Regulation of defective mitochondrial DNA accumulation and transmission in C. elegans by the programmed cell death and aging pathways
- Department of MCD Biology and Neuroscience Research Institute, University of California, Santa Barbara, United States
- Computational Biology Unit, Institute for Informatics, University of Bergen, Norway
Figures
Figure 1 with 2 supplements

Analysis of the impact of mtDNAuaDf5 on fitness parameters.
(A) Diagram of C. elegans mtDNA. Black bars with arrows indicate the locations of genes and direction of transcription. Black lines with letters indicate the locations of tRNAs. Green bars show the locations of the mtDNAuaDf5 deletion as well as the linked w47 insertion that was identified via Illumina sequencing. (B) Brood size analysis of mtDNAuaDf5 compared to laboratory wildtype N2. (C) Embryonic lethality analysis of uaDf5 compared to laboratory wildtype N2. (D) Developmental rate analysis of mtDNAuaDf5 compared to laboratory wildtype N2, counting how many hours it takes for starved L1s to reach gravidity once plated on food. (E) Developmental rate analysis of mtDNAuaDf5 compared to laboratory wildtype N2, staging worms 60 hr after synchronized, starved L1s are plated on food. (F) Survival curve analysis of mtDNAuaDf5 compared to laboratory wildtype N2, day 1 is defined as the day starved L1s are plated on food. Median lifespan and statistics are presented in Figure 1—figure supplement 2. For (B–E), box plots show median and IQR (Interquartile Range), and the diamond indicates the mean. Statistical analysis was performed using the Mann–Whitney test (***p < 0.001, n.s. not significant).
Figure 1—figure supplement 1
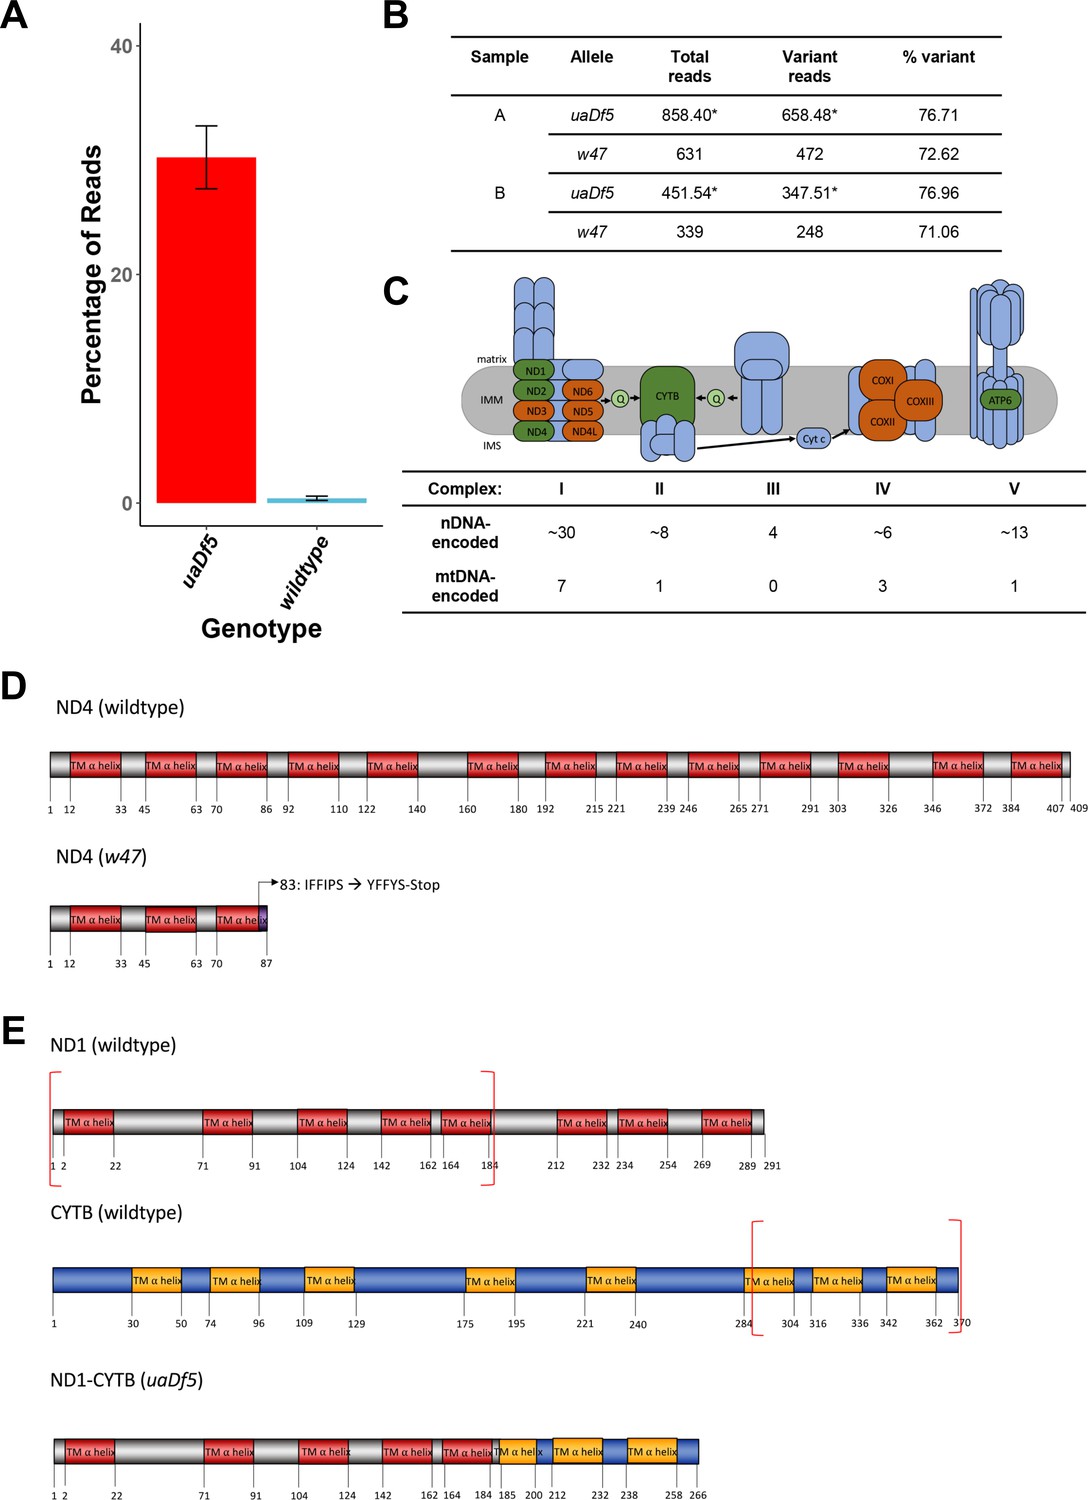
Characterization of the uaDf5 allele.
(A) The percentage of reads that mapped to the w47 insertion in uaDf5 samples (red) and wildtype samples (blue). Error bars represent standard deviation of the mean (SEM). (B) Table outlining the percentage of reads that mapped to the w47 and uaDf5 mutations in uaDf5 samples. *The number of variant reads was determined by averaging the mapped reads across the deleted region and subtracting that from the average number of reads mapped to the rest of the mtDNA genome (total reads). (C) Diagram showing the mitochondrial respiratory chain (MRC) machinery subunits. Blue indicates nuclear DNA (nDNA)-encoded subunits, orange and green indicate mtDNA-encoded subunits. Green indicates those subunits that are knocked out in the uaDf5 allele (including NADH dehydrogenase 4 [ND4] which is knocked out by the linked w47 mutation). (D) Diagram showing the likely effect of the w47 mutation on ND4 protein translation. ND4 is a 409-aa long transmembrane subunit that spans the inner mitochondrial membrane 13 times. The w47 mutation results in a premature stop codon at position 89, eliminating 10 of the 13 alpha-helix membrane domains. (E) Diagram showing the likely effect of the uaDf5 mutation on ND1 protein translation. ND1 is a 291-aa long transmembrane subunit that spans the inner mitochondrial membrane 8 times and CYTB is a 370-aa long transmembrane subunit that spans the inner mitochondrial membrane 8 times. The uaDf5 mutation results in a 266 amino acid long fusion protein that connects the first 185 amino acids (and 5 subunits) of ND1 with the last 81 amino acids (and 3 subunits) of CYTB.
-
Figure 1—figure supplement 1—source data 1
ddPCR reads of mitochondrial DNA.
- https://cdn.elifesciences.org/articles/79725/elife-79725-fig1-figsupp1-data1-v1.xlsx
Figure 1—figure supplement 2
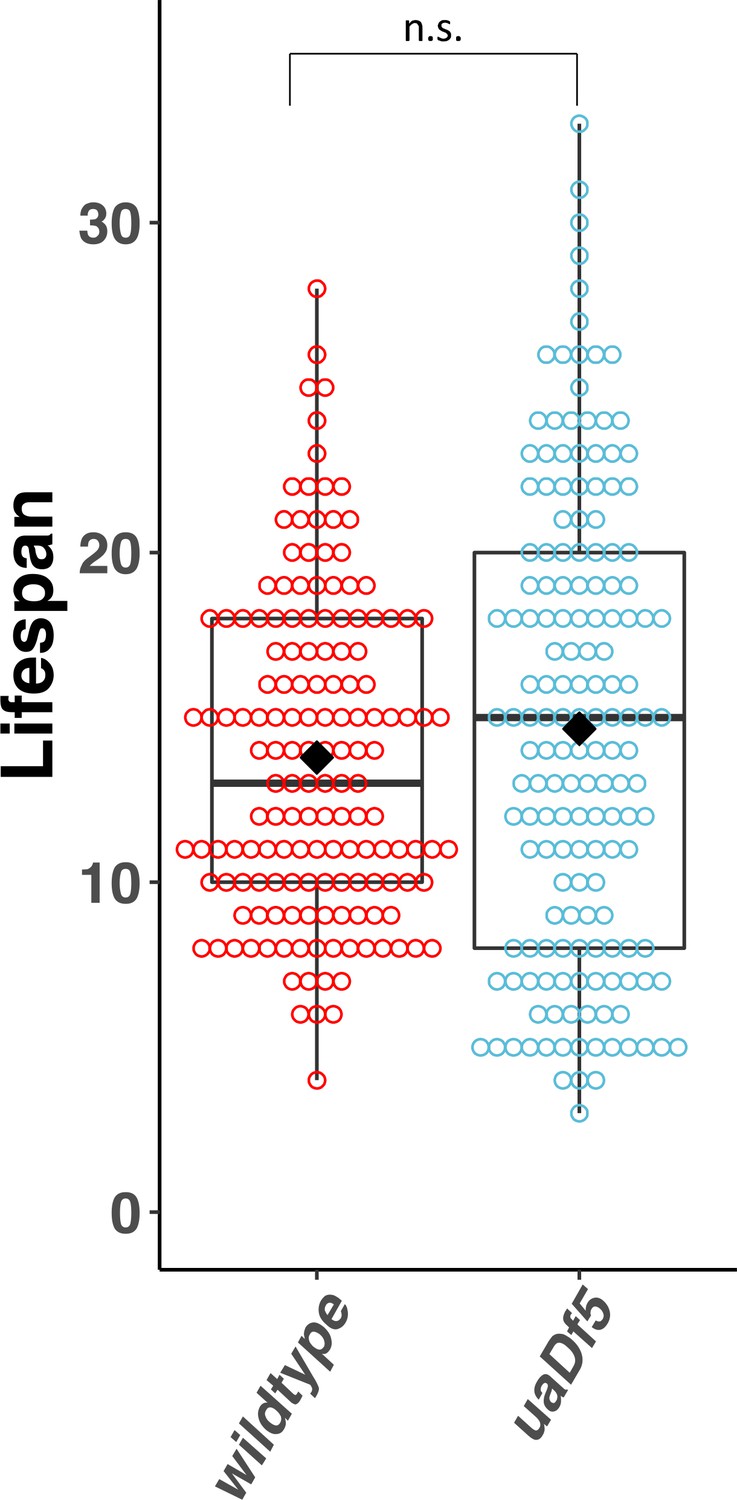
Lifespan analysis of the impact of uaDf5.
Lifespan analysis of N2-bearing uaDf5 compared to wildtype N2. Day 1 is defined as the day starved L1s are plated on food. Box plots show median and IQR, and the diamond indicates the mean. Statistical analysis was performed using the Mann–Whitney test (n.s., not significant).
Figure 2 with 4 supplements

Regulators of programmed cell death (PCD) act on mutant mtDNA.
(A–C) Digital-droplet PCR (ddPCR) analysis of the steady-state molar ratio of mtDNAuaDf5 in 200 worm populations of day 1 adults of various PCD mutant backgrounds. (A) PCD mutants that result in a significant increase in the molar ratio of mtDNAuaDf5. (B) PCD mutants that result in no statistical change in the molar ratio of mtDNAuaDf5. (C) PCD mutant that results in a significant decrease in the molar ratio of mtDNAuaDf5. (D) The relative brood size of the animals with and without mtDNAuaDf5 in the indicated mutant backgrounds. For each nuclear genotype shown, the brood size of uaDf5-containing worms was normalized by dividing by the average brood size of worms containing only WT-mtDNA. Box plots show the median and IQR, the diamond indicates the mean. For A–C, n = 3 or more biological replicates of 200 worm populations were performed for each genotype. Average wildtype mtDNA copy number ± standard deviation is shown in the graph below in each panel. Statistical analysis was performed using one-way analysis of variance (ANOVA) with Dunnett’s correction for multiple comparisons. For (D), statistical analysis was performed using the Mann–Whitney test. Error bars represent standard deviation of the mean (SEM) (***p < 0.001, **p < 0.01, *p < 0.05, n.s. not significant).
Figure 2—figure supplement 1
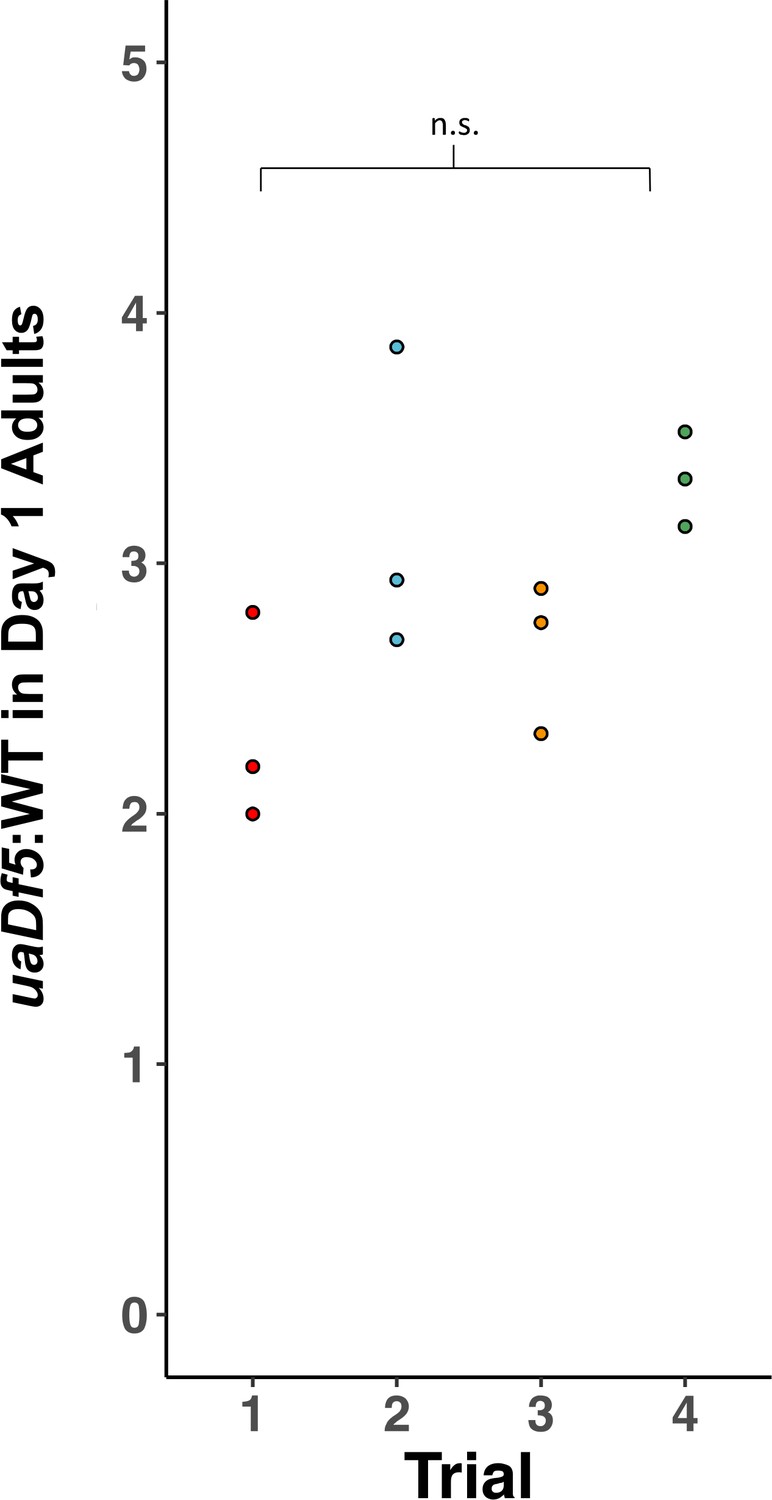
Reproducibility of digital-droplet PCR (ddPCR) measurement of uaDf5.
Analysis of the steady state of uaDf5 in a wildtype nuclear background shows highly stable steady-state levels. Trials were done months apart on different thaws. Dots represent biological replicates. Statistical analysis was performed using one-way analysis of variance (ANOVA) with Tukey correction for multiple comparisons (n.s., not significant).
Figure 2—figure supplement 2
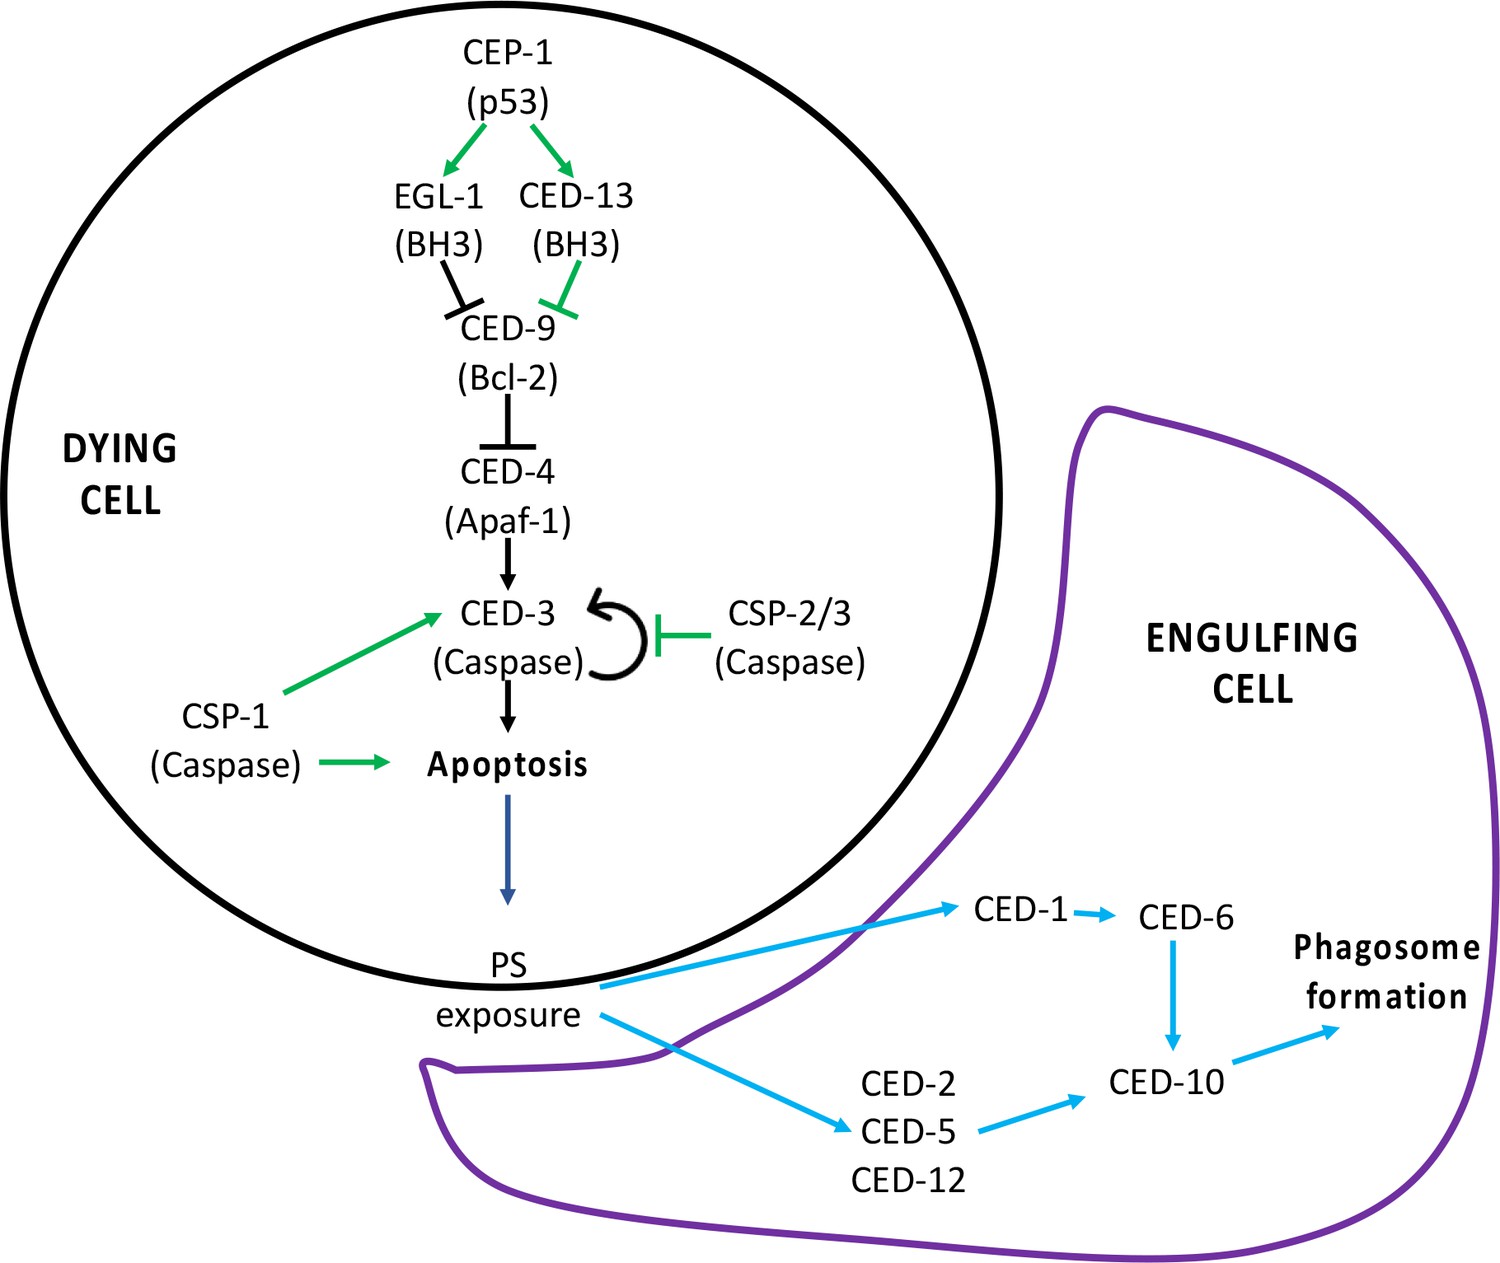
Programmed cell death (PCD) signaling pathway.
(A) Signaling pathway for PCD. The canonical pathway is shown with black arrows, the non-canonical pathway is shown with green arrows, and the downstream engulfment pathway is shown with blue arrows. Figure supplement 2 has been adapted from Figure 2 in Conradt et al., 2016.
Figure 2—figure supplement 3
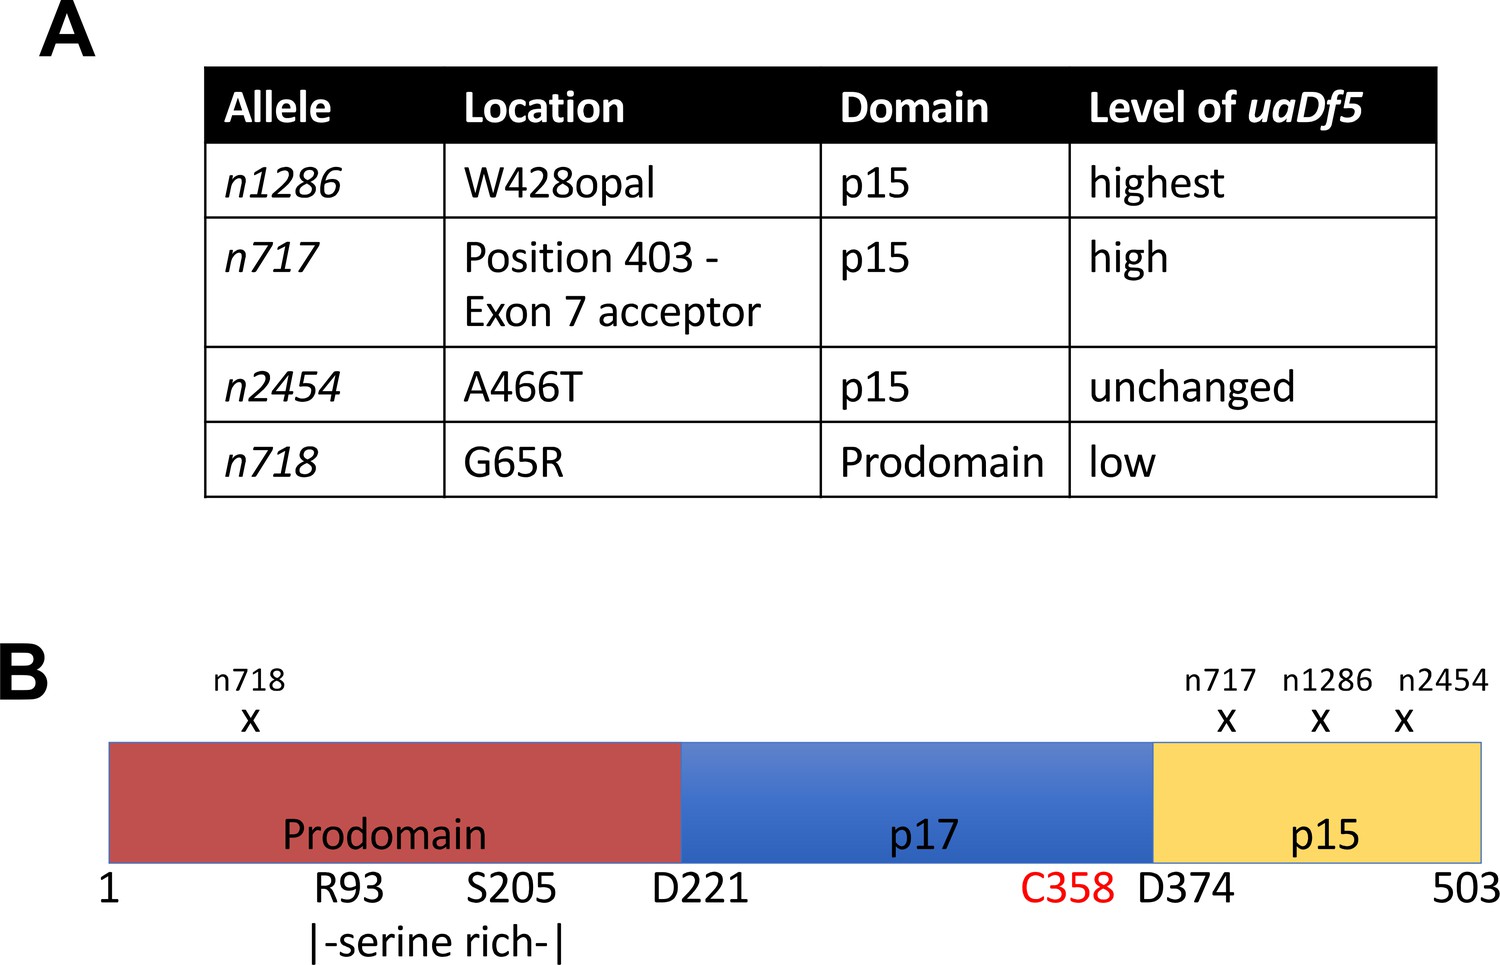
Analysis of the ced-3 alleles.
(A) Locations and consequences of the four tested ced-3 alleles, as well as the measured fractional abundance of uaDf5. (B) Diagram showing the locations of the mutations for each allele.
Figure 2—figure supplement 4
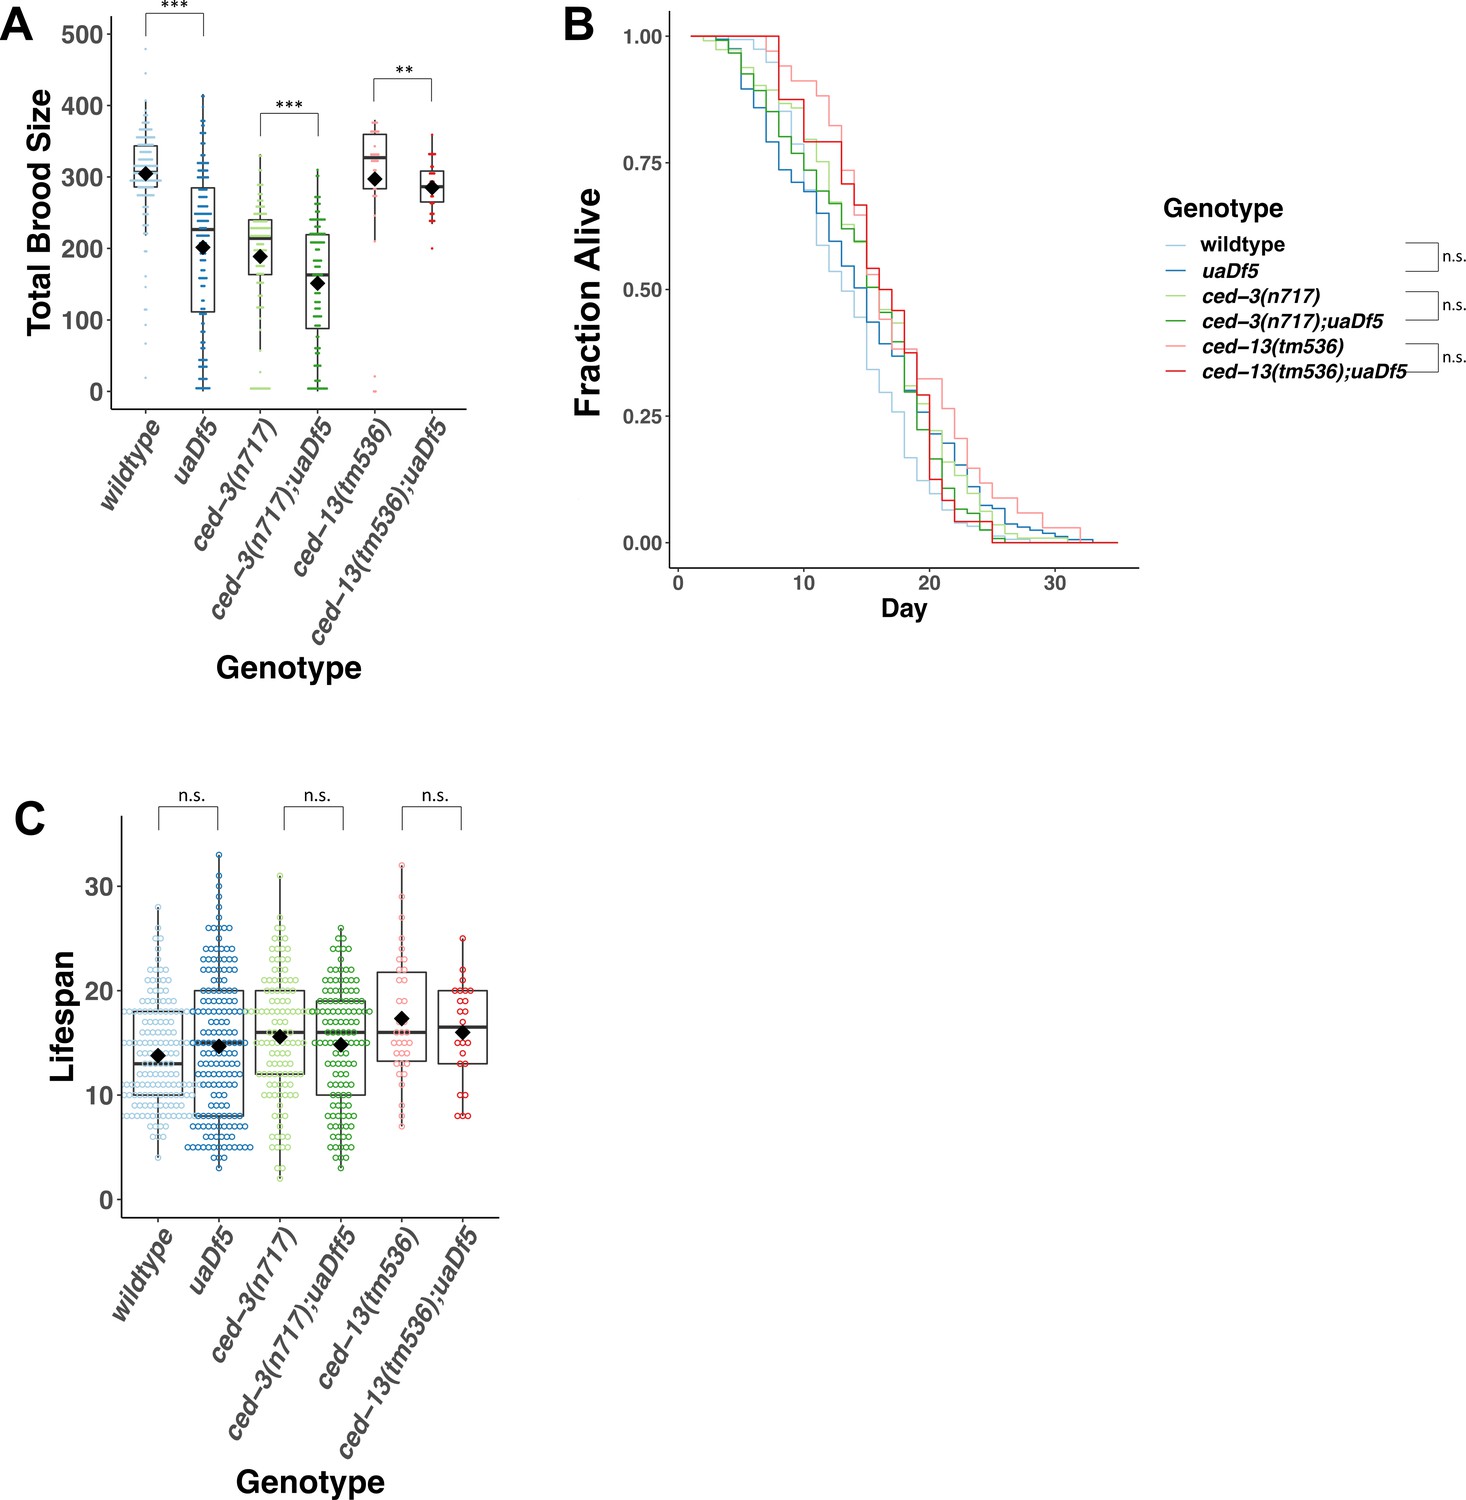
Analysis of the impact of uaDf5 on fitness parameters in programmed cell death (PCD) mutants.
(A) Brood size analysis of PCD mutants. (B) Lifespan analysis shows that uaDf5 does not affect lifespan in both wildtype background and in PCD mutant backgrounds. (C) Lifespan analysis shows that uaDf5 does not affect lifespan in a wildtype nuclear background nor in PCD mutant backgrounds. For B and C, day 1 is defined as the day starved L1s are plated on food. For A and C, box plots show median and IQR, and the diamond indicates the mean. Statistical analysis was performed using the Mann–Whitney Wilcoxon test (***p < 0.001, **p < 0.01, n.s., not significant).
Figure 3 with 1 supplement

mtDNAuaDf5 accumulates in the germline of aging adults, and evidence of purifying selection between mother and offspring.
(A) Analysis of the molar ratio of mtDNAuaDf5 in aging adults in a wildtype nuclear background. Average wildtype mtDNA copy number ± standard deviation is shown in the graph below. (B) Analysis of the percent change of uaDf5:WT from day 1 (Y axis = (uaDf5:WT day x − uaDf5:WT day 1)/(uaDf5:WT day 1)). For glp-1(q231ts), fem-3(q20ts), and glp-4(bn2ts), 15°C is the permissive temperature (germline development occurs) and 25°C is the restrictive temperature (female germline development is inhibited). Statistical analysis was performed using one-way analysis of variance (ANOVA) with Tukey correction for multiple comparisons (***p < 0.001, **p < 0.01, *p < 0.05, n.s., not significant). Error bars represent standard deviation of the mean (SEM). (C) Analysis of the molar ratio of mtDNAuaDf5 in aging adults (P0 adult) and their L1 progeny (F1-L1) in various nuclear backgrounds shows that all strains decrease the uaDf5 load during transmission from mother to offspring, and that strains with significantly higher mtDNAuaDf5 levels (atfs-1(et15), ced-10(n1993), and ced-13(sv32)) have a more significant removal mechanism at day 4 of adulthood. n = 3 or more replicates of 200 worm populations were performed for each timepoint. Error bars represent SEM. Gray dashed line indicates a hypothetical threshold at which high mtDNAuaDf5 burden activates enhanced intergenerational purifying selection in older mothers. (D) Analysis of the measured loss of mtDNAuaDf5 between mother and offspring at each day of adulthood shows that mtDNAuaDf5 removal occurs. n = 6 replicates of 200 worm populations for each condition.
Figure 3—figure supplement 1
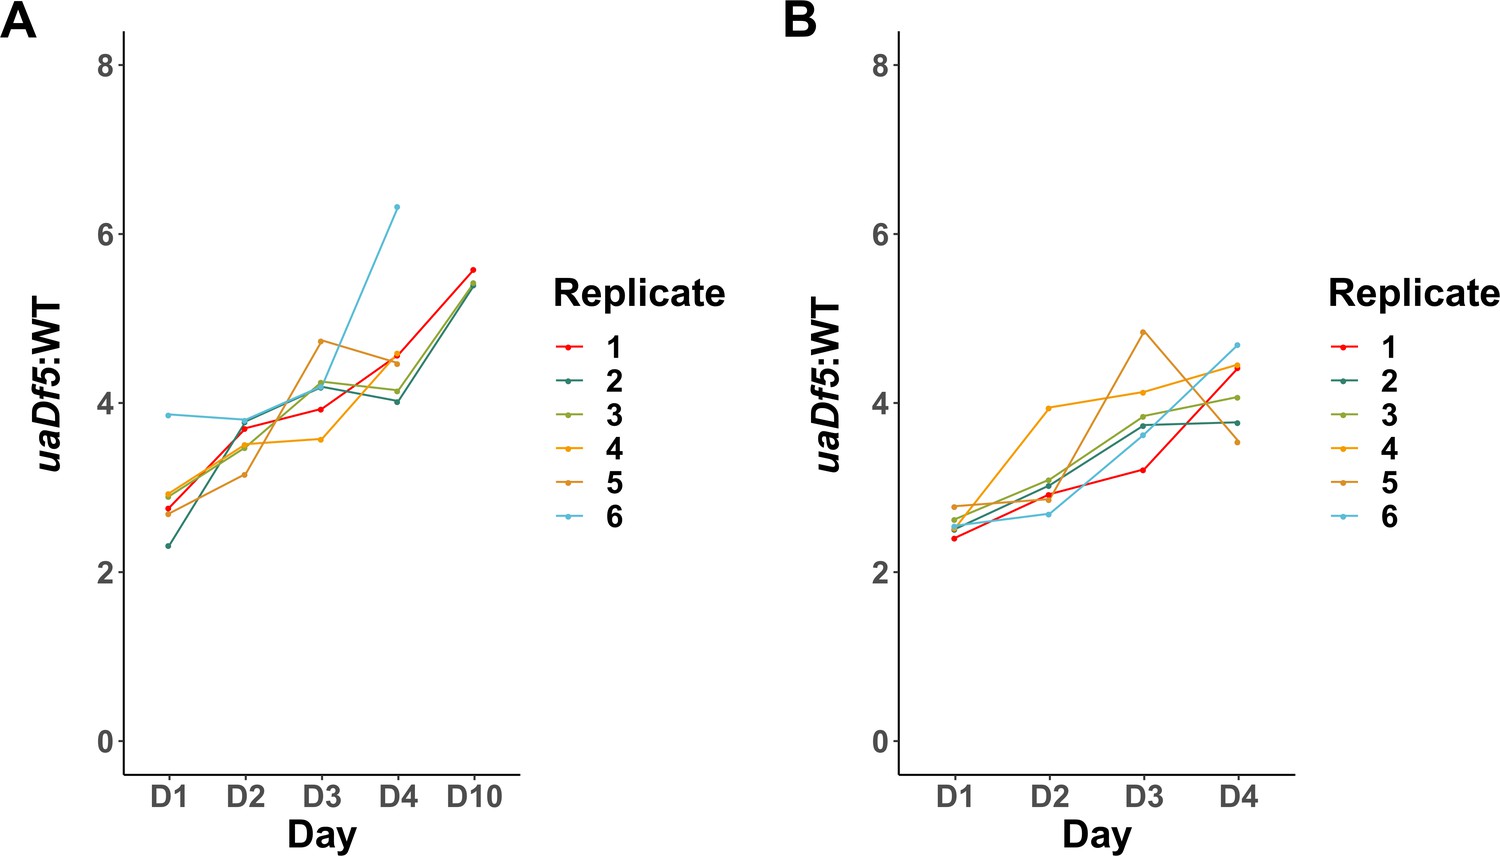
uaDf5 accumulation in individual lines of adults and progeny.
(A) Analysis of uaDf5 accumulation in individual lines of aging P0 adults shows a consistent accumulation trend as adults age. (B) Analysis of uaDf5 accumulation in individual lines of F1-L1 progeny that were born from those mothers shown in panel A shows a consistent trend of progeny born from older mothers inheriting a larger uaDf5 load than their siblings born from younger mothers.
Figure 4 with 3 supplements

Lifespan mutants have both a lower steady-state level and accumulation rate of mtDNAuaDf5.
(A–C) Analysis of molar ratio of mtDNAuaDf5 in day 1 adults of various mutant backgrounds. Average wildtype mtDNA copy number ± standard deviation is shown in the graph below in each panel. (A) Analysis of steady-state mtDNAuaDf5 levels in long-lived mutants. (B) Analysis of steady-state mtDNAuaDf5 levels in short-lived mutants, showing synergistic activity on mtDNAuaDf5 removal capacity in the daf-2(e1391) clk-1(qm30) double mutant. (C) Analysis of steady-state mtDNAuaDf5 levels in daf-2(−) single and daf-16(−); daf-2(−) double mutants, showing a partial rescue of daf-2(−) phenotype by daf-16(−). (D) Analysis of the molar ratio of mtDNAuaDf5 in aging adults in 21 different nuclear backgrounds shows a consistent accumulation trend. (E) Summary of the rate of increase for the lifespan regulation mutants, showing that daf-16 rescues the daf-2 accumulation rate phenotype. The normalized accumulation rate was calculated by fitting a regression line for each trial and then dividing the slope of the regression line by the slope of the averaged regression line found in a wildtype background. For all, n = 3 or more replicates of 200 worm populations for each genotype and stage. For A and E, statistical analysis was performed using one-way analysis of variance (ANOVA) with Tukey correction for multiple comparisons. For C, statistical analysis was performed using one-way ANOVA. For B, statistical analysis was performed using one-way ANOVA with Dunnett’s correction formultiple comparisons. Error bars represent standard deviation of the mean (SEM) (***p <0 .001, **p <0 .01, *p < 0.05, n.s., not significant).
Figure 4—figure supplement 1

Insulin/IGF-1 signaling (IIS) pathway.
Insulin-like peptides (ILPs) bind to DAF-2 and activate the PI3P pathway which prevents nuclear translocation of DAF-16. AAK-2 may phosphorylate and activate DAF-16 transcriptional activity. Loss of aak-2 or daf-2 (highlighted in red) reduces lifespan.
Figure 4—figure supplement 2
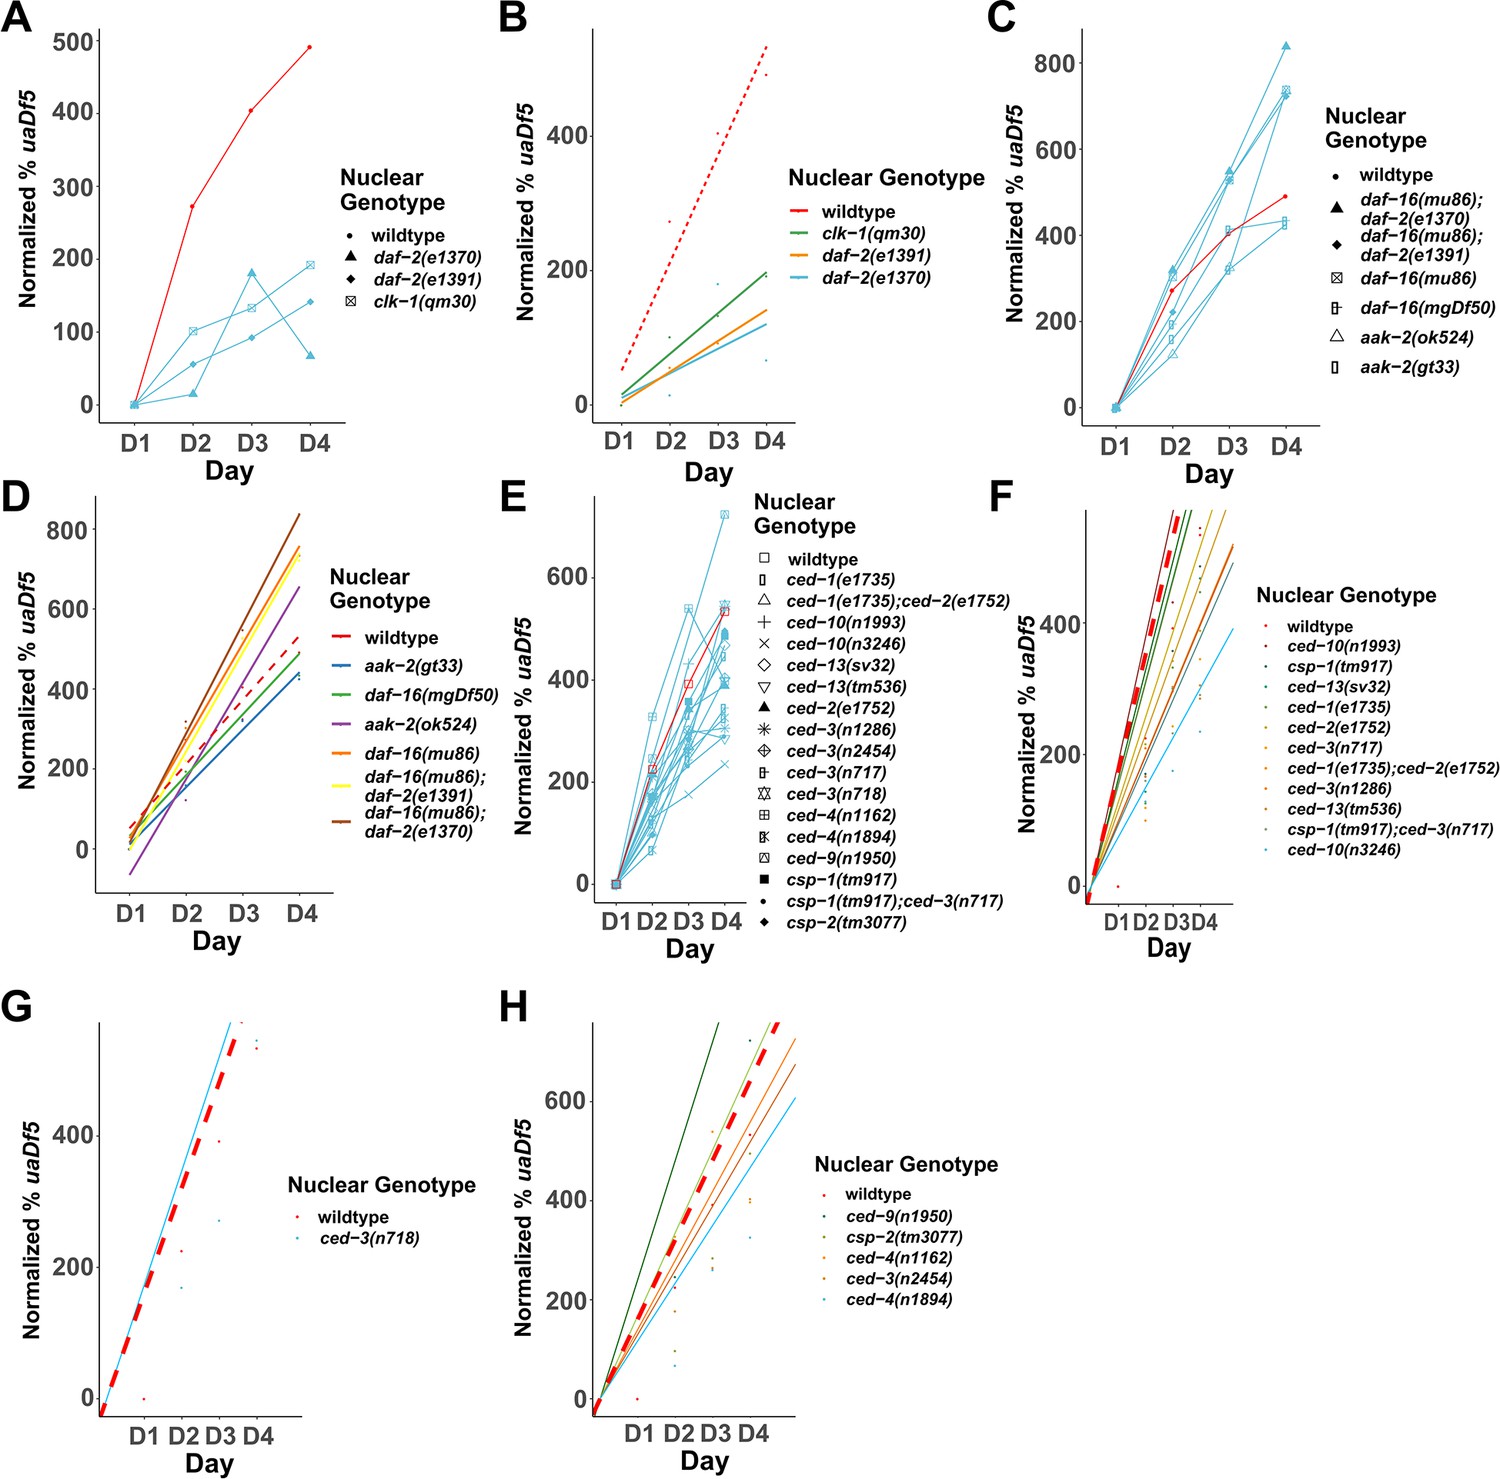
Analysis of the accumulation of mtDNAuaDf5 in programmed cell death (PCD) and lifespan mutants.
Analysis of the normalized fractional abundance uaDf5 [(% uaDf5 day x − % uaDf5 day 1) × % uaDf5 day 1] in steady-state populations, showing the accumulation rate of mtDNAuaDf5 as worms age from day 1 to 4 of adulthood. (A, B) Analysis of the accumulation of uaDf5 in long-lived mutants. (C) Analysis of the accumulation of mtDNAuaDf5 in short-lived mutants (C, D). Linear regression analysis of the normalized fractional abundance uaDf5 [(% uaDf5 day x − % uaDf5 day 1) × % uaDf5 day 1] in steady-state populations, showing the accumulation rate of mtDNAuaDf5 as worms age from day 1 to 4 of adulthood. (C) Analysis of long-lived mutants. (D) Analysis of short-lived mutants. (E) Analysis of the accumulation of mtDNAuaDf5 in PCD mutants. (F–H) Linear regression analysis of the normalized fractional abundance mtDNAuaDf5 [(% uaDf5 day x − % uaDf5 day 1) × % uaDf5 day 1] in steady-state populations, showing the accumulation rate of mtDNAuaDf5 as worms age from day 1 to 4 of adulthood. (F) Analysis of PCD mutants with significantly high steady-state level of mtDNAuaDf5. (G) Analysis of PCD mutants with significantly low steady-state level of mtDNAuaDf5. (H) Analysis of PCD mutants with no significant change in the steady-state level of mtDNAuaDf5. For C, D, F–H, dots represent actual datapoints, lines are fitted regression models of the data. For all, n = 3 replicates or more of 200 worm populations for each datapoint.
Figure 4—figure supplement 3
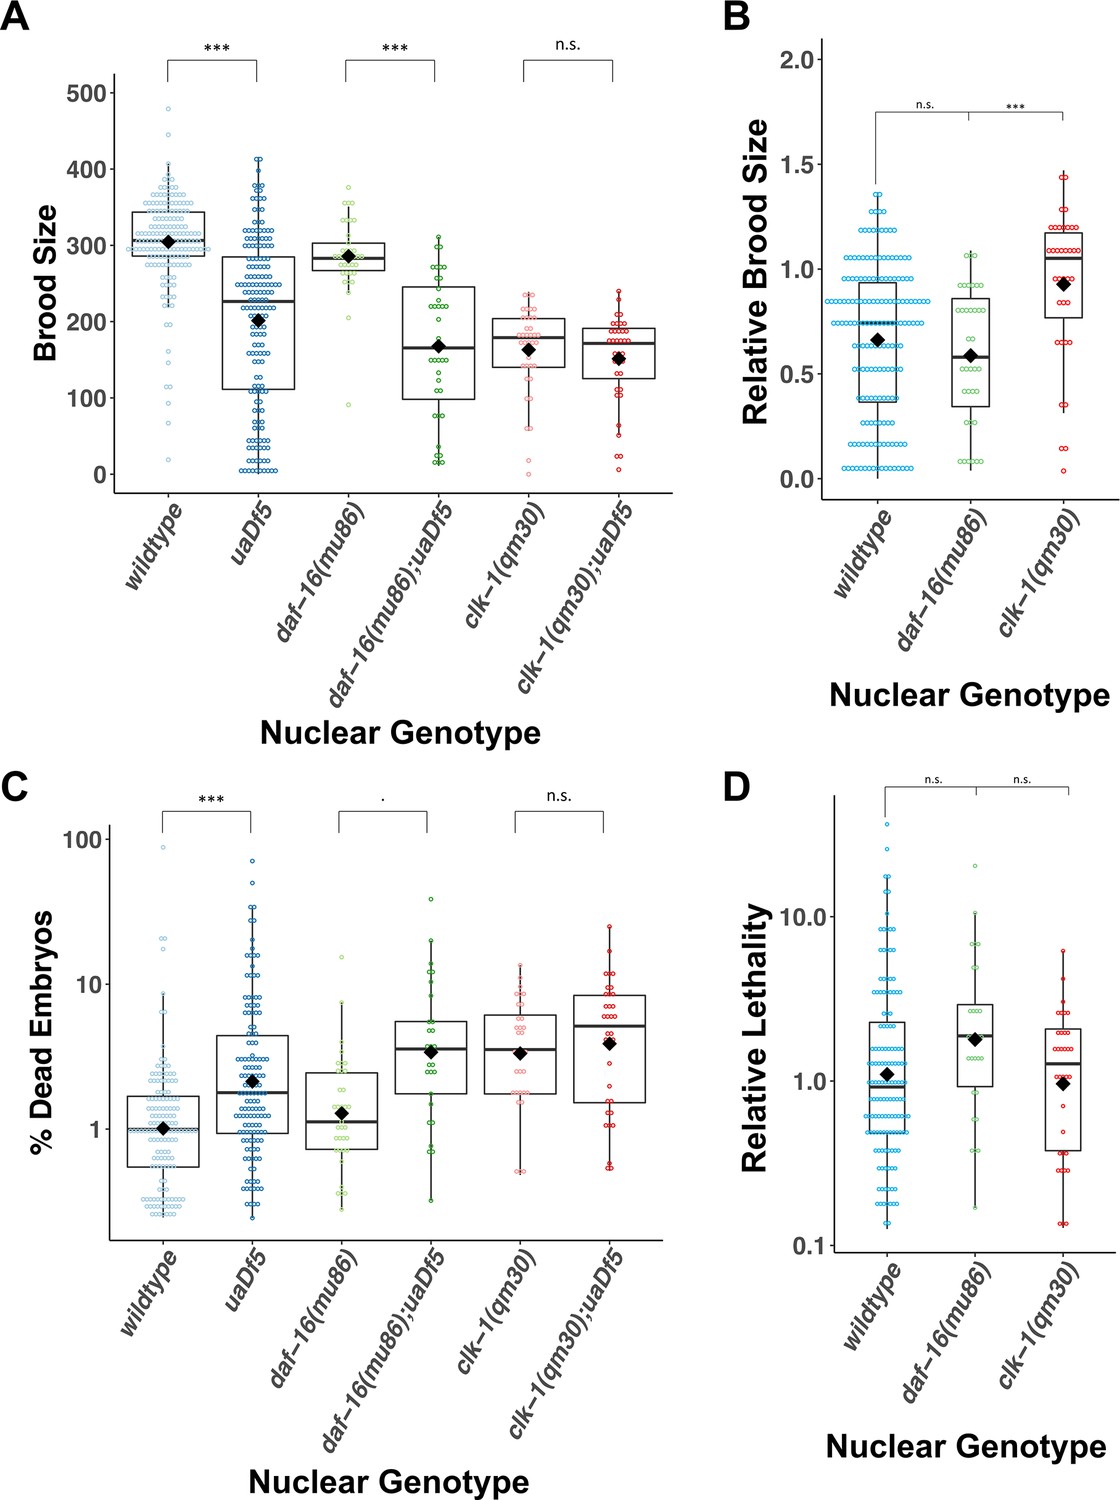
uaDf5 differentially impacts fitness parameters in lifespan-affecting mutants.
(A, B) Brood size analysis showing how uaDf5 differentially impacts brood size in lifespan mutant backgrounds. uaDf5 has no negative impact on the long-lived mutant clk-1 but has a modestly larger negative impact on the short-lived mutant daf-16 than it does in the wildtype background. (B) Relative brood size of the animals with and without uaDf5 in the indicated mutant backgrounds. (C, D) Embryonic lethality analysis showing how uaDf5 differentially impacts embryonic lethality in lifespan mutant backgrounds. uaDf5 has no negative impact on the long-lived mutant clk-1 but has a modestly larger negative impact on the short-lived mutant daf-16 than it does in a wildtype background. (D) Relative lethality of the animals with and without uaDf5 in the indicated mutant backgrounds. Box plots show median and IQR, and the diamond indicates the mean. For A and C, statistical analysis was performed using the Mann–Whitney test. For B and D, statistical analysis was performed using the Kruskal–Wallis test (***p < 0.001, n.s., not significant).
Figure 5

Evidence for late adulthood-specific mechanisms for removal of mtDNAuaDf5.
(A) Subtracting uaDf5:WT in progeny from day 1 adults from progeny of day 4 adults shows that day 4 F1-L1s tend to have higher mtDNAuaDf5 burden than their day 1 siblings, but this is no longer the case in nuclear backgrounds that result in a significantly higher steady-state levels of mtDNAuaDf5 in the adult. n = 3 or more replicates for each genotype and statistical analysis was performed using the Mann–Whitney test. (B) Comparison of the molar ratio of mtDNAuaDf5 in day 4 adult mothers to the absolute % removal of mtDNAuaDf5 from mother to offspring shows a positive correlation (***p < 0.001).
Figure 6

Regulation of mtDNAuaDf5 accumulation and transmission by the programmed cell death (PCD) and aging pathways.
(A) Our results suggest that CED-3 and CSP-1, which are activated by BH-3 only protein CED-13, function cooperatively to promote mitochondrial purifying selection, independent of CED-9 and the CED-4 apoptosome. The clearance of mtDNAuaDf5 may therefore involve induction of a non-canonical germline PCD mechanism or non-apoptotic action of the CED-13/caspase axis. Additionally, Insulin/IGF-1 signaling (IIS) and CLK-1 aging pathways act synergistically to regulate mitochondrial purifying selection. (B) mtDNAuaDf5 (red) accumulates in the germline relative to mtDNAWT (blue) as adults age and the increased mtDNAuaDf5 levels are transmitted to the progeny, although the mtDNAuaDf5 burden is consistently lower in progeny than mothers. This intergenerational purifying selection is enhanced in the older mothers of mutants with high steady-state mtDNAuaDf5 (e.g., ced-13, ced-10, and atfs-1), suggesting a threshold beyond which a germline PCD-independent mtDNA quality control process may be initiated or enhanced in these older mothers.
Additional files
-
Supplementary file 1
A summary of all mutants analyzed in the PCD pathway, including their known homologs, whether they are part of the core PCD machinery, if they are pro- or anti-apoptotic, whether they are mitochondrial proteins, and molecular details of the alleles analyzed.
- https://cdn.elifesciences.org/articles/79725/elife-79725-supp1-v1.docx
-
Supplementary file 2
Wildtype and mutant mtDNA levels in the different cell death and aging pathway mutants.
(mean of 3 replicates ± standard deviation).
- https://cdn.elifesciences.org/articles/79725/elife-79725-supp2-v1.docx
-
Supplementary file 3
A summary of all lifespan mutants analyzed, including their known homologs, cellular pathways they are known to act in, whether the mutant extends or reduces lifespan, and molecular details of the alleles analyzed.
- https://cdn.elifesciences.org/articles/79725/elife-79725-supp3-v1.docx
-
Supplementary file 4
C. elegans strains used in this study.
- https://cdn.elifesciences.org/articles/79725/elife-79725-supp4-v1.docx
-
MDAR checklist
- https://cdn.elifesciences.org/articles/79725/elife-79725-mdarchecklist1-v1.pdf
Download links
A two-part list of links to download the article, or parts of the article, in various formats.
Downloads (link to download the article as PDF)
Open citations (links to open the citations from this article in various online reference manager services)
Cite this article (links to download the citations from this article in formats compatible with various reference manager tools)
Regulation of defective mitochondrial DNA accumulation and transmission in C. elegans by the programmed cell death and aging pathways
eLife 12:e79725.
https://doi.org/10.7554/eLife.79725


