Canonical Wnt signaling and the regulation of divergent mesenchymal Fgf8 expression in axolotl limb development and regeneration
- Research Institute of Molecular Pathology (IMP), Vienna BioCenter (VBC), Campus- Vienna-Biocenter 1, Austria
- Vienna BioCenter PhD Program, Doctoral School of the University of Vienna and Medical University of Vienna, Austria
Figures
Figure 1 with 2 supplements
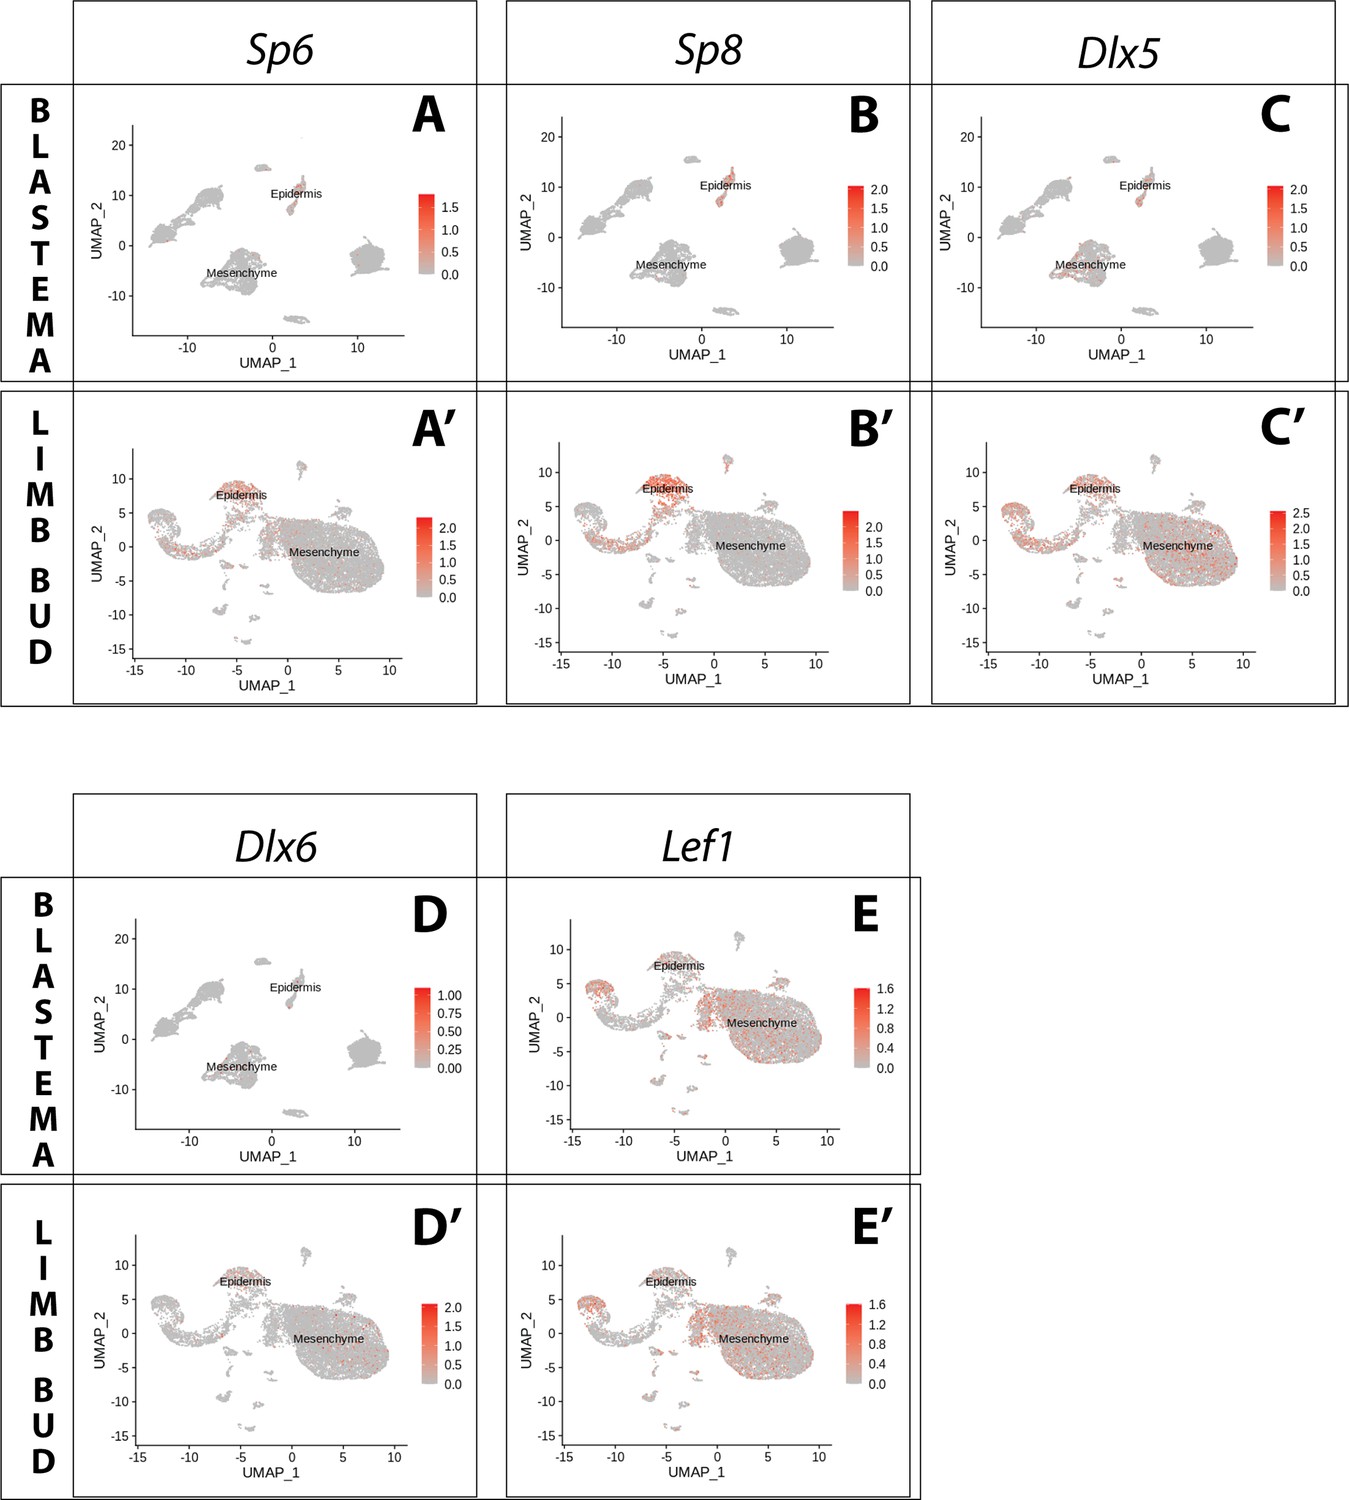
Expression of AER transcription factors in the axolotl limb bud and limb blastema assessed by reanalysis of Axolotl scRNA seq datasets.
Reanalysis of scRNA seq data from blastema (A–E, data from Li et al., 2021) or limb bud (A’–E’, data from Lin et al., 2021). (A, A’) UMAPs of Axolotl scRNA seq expression data for Sp6. Expression is detected in the epidermis of the axolotl blastema and limb bud. (B, B’) UMAPs of Axolotl scRNA seq expression data for Sp8. Expression is detected in the epidermis of the axolotl blastema and limb bud. (C, C’) UMAPs of Axolotl scRNA seq expression data for Dlx5. Expression is detected in the epidermis and mesenchyme of the axolotl blastema and limb bud. (D, D’) UMAPs of Axolotl scRNA seq expression data for Dlx6. Expression is detected in the epidermis and mesenchyme of the axolotl limb bud. Expression is detected only in few blastema cells. (E, E’) UMAPs of Axolotl scRNA seq expression data for Lef1. Expression is detected in the epidermis and mesenchyme of the axolotl blastema and limb bud.
Figure 1—figure supplement 1
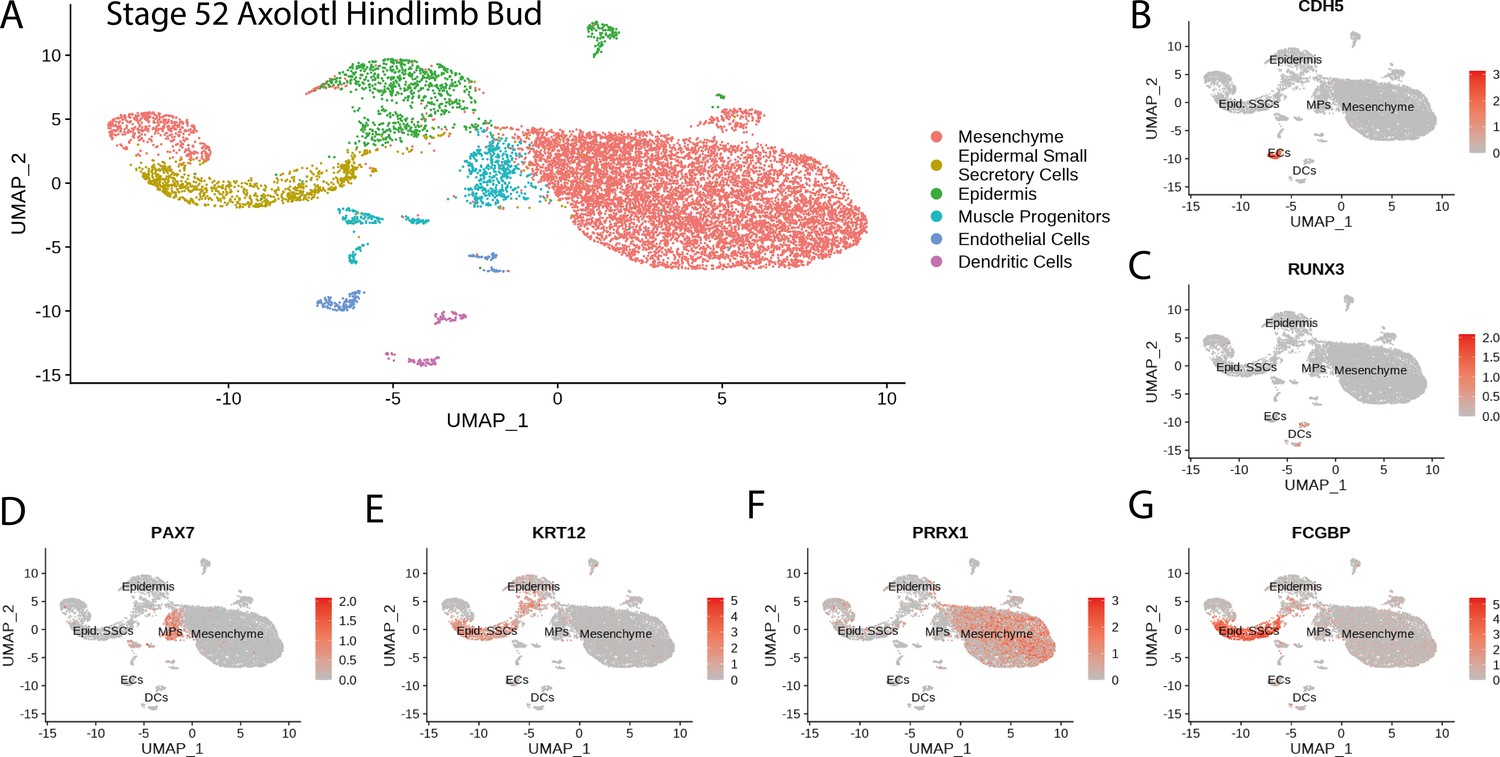
Cluster identification in the reanalysis of axolotl limb bud scRNA seq dataset from Lin et al., 2021.
(A) Clustering of axolotl limb bud scRNA seq expression data reveals six clusters that are readily identifiable by the expression of key markers. (B) Cdh5 labels endothelial cells in the axolotl limb bud scRNA seq dataset. (C) Runx3 labels dendritic cells in the axolotl limb bud scRNA seq dataset. (D) Pax7 labels muscle progenitors in the axolotl limb bud scRNA seq dataset. (E) Krt12 labels epidermal cells (including SSCs) in the axolotl limb bud scRNA seq dataset. (F) Prrx1 labels mesenchymal cells in the axolotl limb bud scRNA seq dataset. (G) Fcgbp labels epidermal small secretory cells in the axolotl limb bud scRNA seq dataset.
Figure 1—figure supplement 2
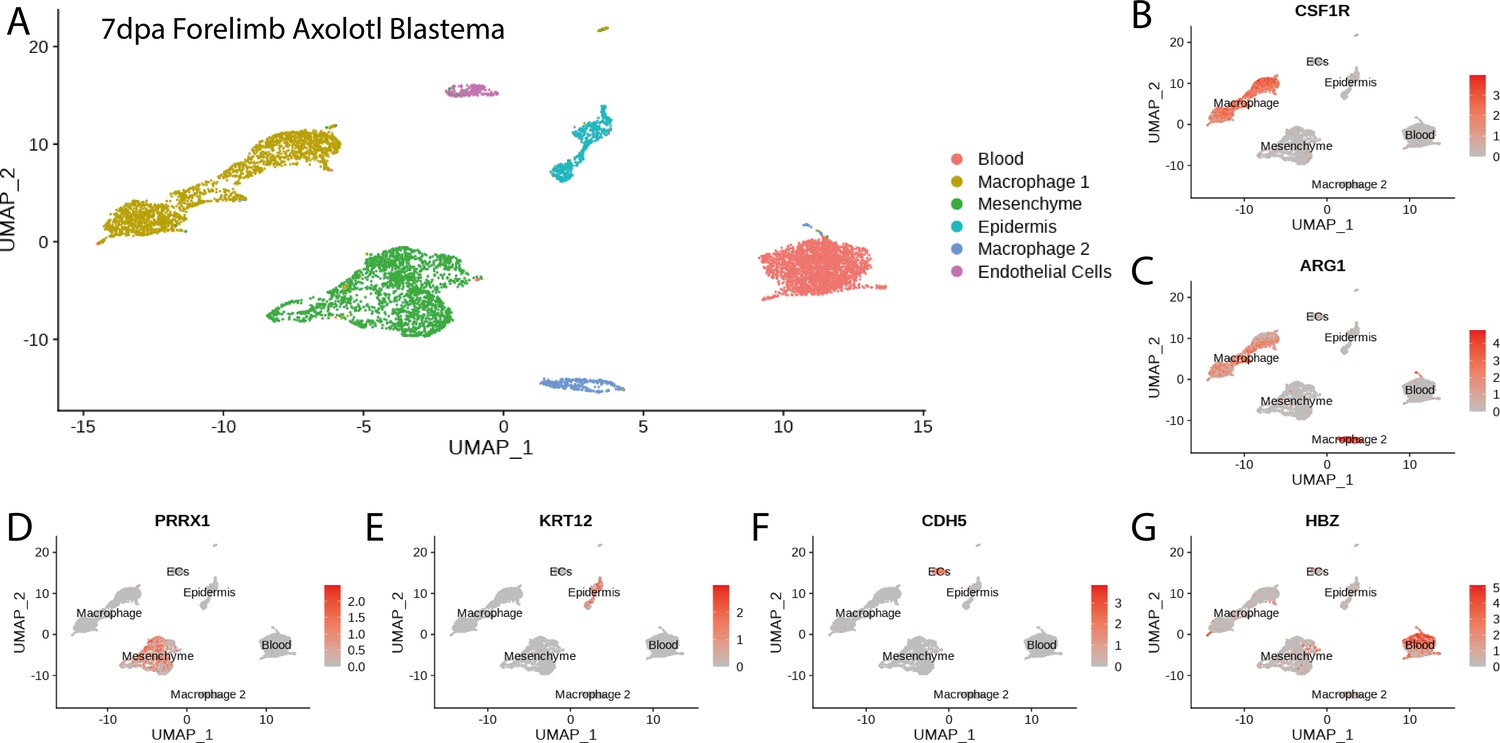
Cluster identification in the reanalysis of axolotl blastema scRNA seq dataset from Li et al., 2021.
(A) Clustering of axolotl limb bud scRNA seq expression data reveals six clusters that are readily identifiable by the expression of key markers. (B, C) Csf1r and Arg1 label two macrophage clusters in the axolotl blastema scRNA seq dataset. (D) Prrx1 labels mesenchymal cells in the axolotl blastema scRNA seq dataset. (E) Krt12 labels epidermal cells in the axolotl blastema scRNA seq dataset. (F) Cdh5 labels endothelial cells in the axolotl blastema scRNA seq dataset. (G) Hbz labels blood cells in the axolotl blastema scRNA seq dataset.
Figure 2 with 1 supplement
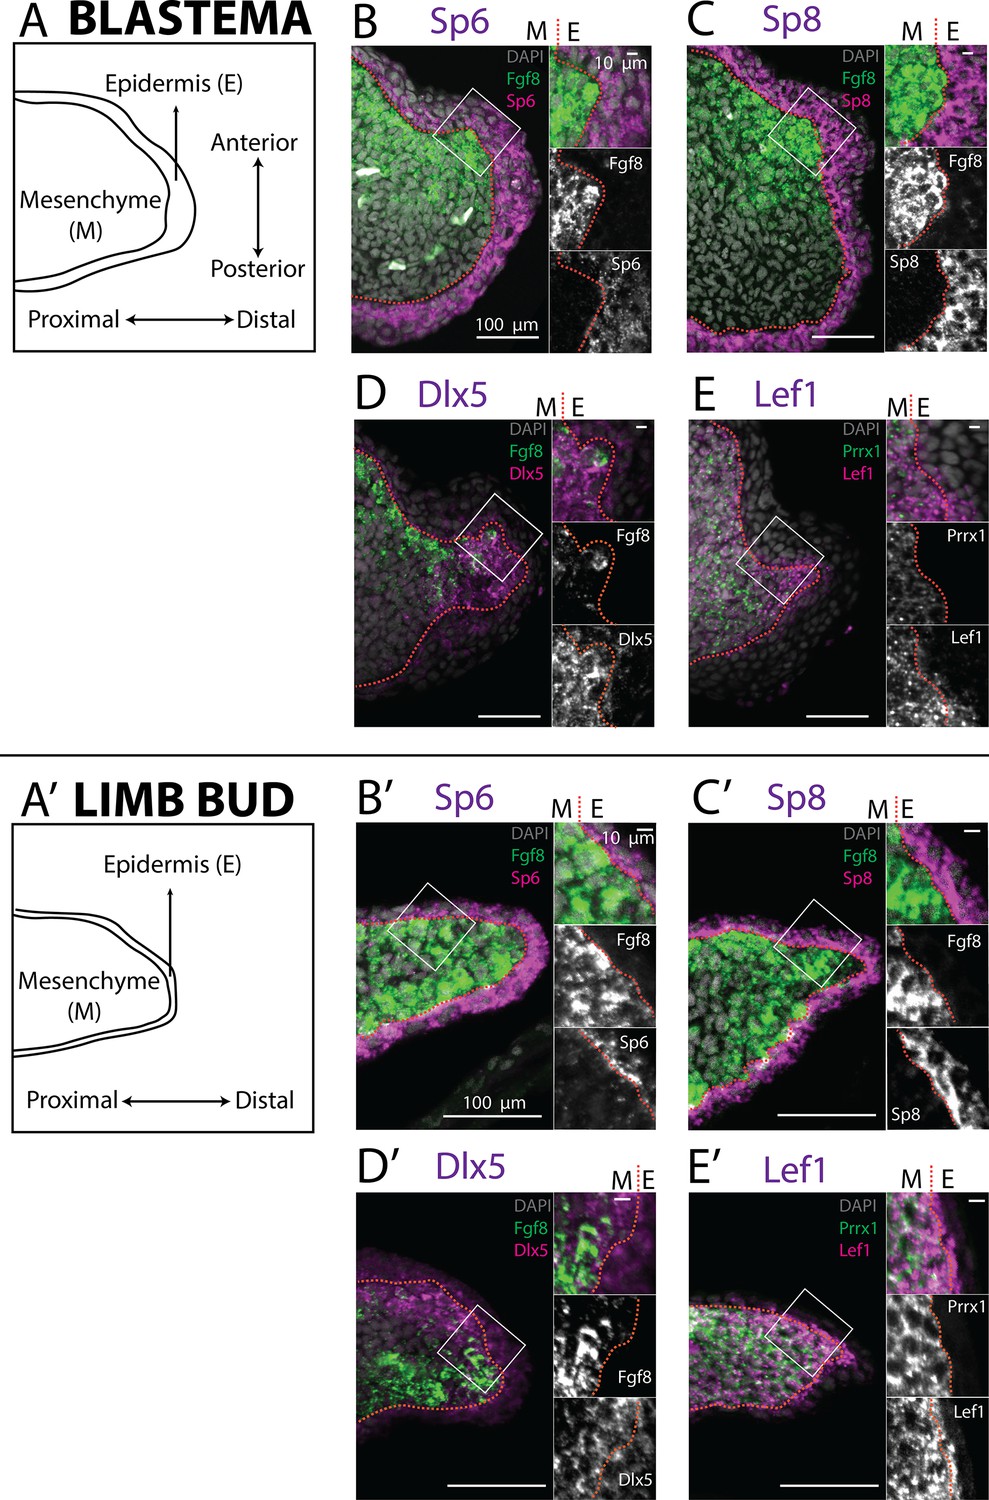
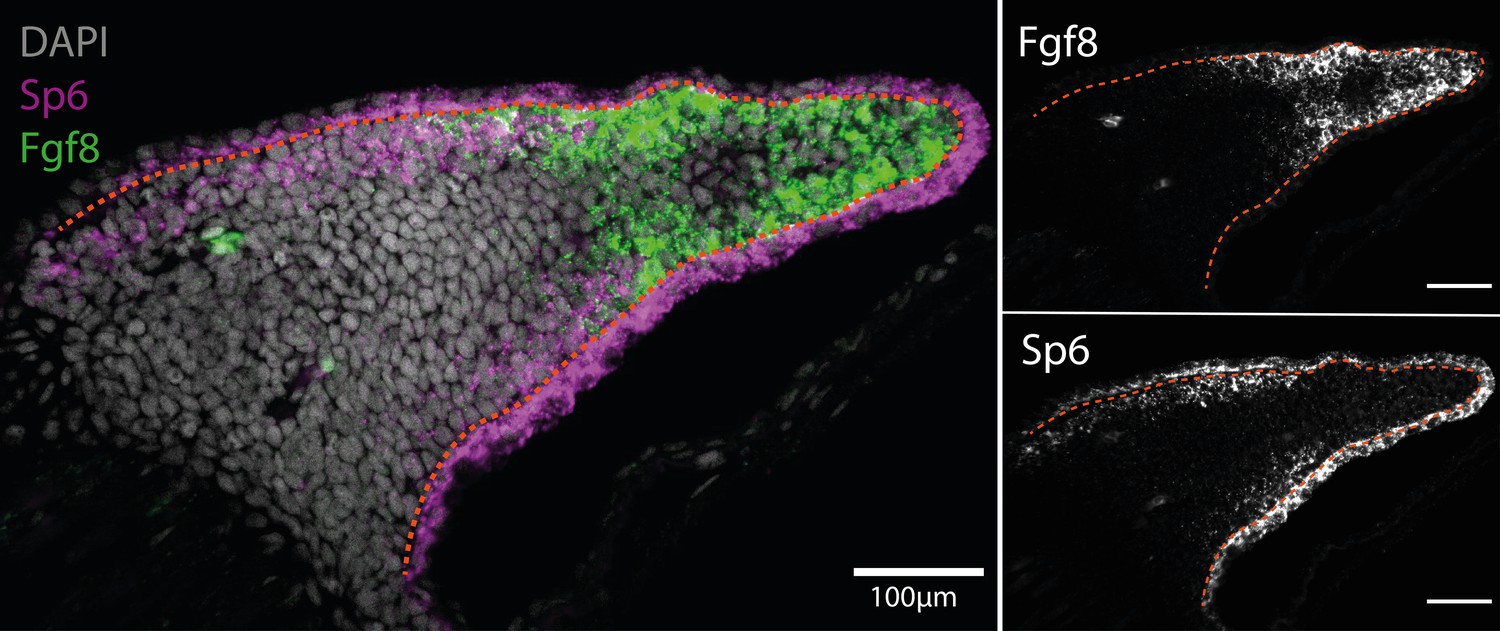
Expression of AER transcription factors in the axolotl limb blastema and limb bud assessed by HCR in situ hybridization.
(A, A’) Schematic outlining the mesenchymal and epidermal compartments in a longitudinal section of an axolotl blastema and limb bud. (B, B’) Expression of Sp6 in the epidermis and of Fgf8 in the mesenchyme of the axolotl blastema and limb bud revealed by HCR (single planes from whole-mount images, n = 4). (C, C’) Expression of Sp8 in the epidermis and of Fgf8 in the mesenchyme of the axolotl blastema and limb bud revealed by HCR (single planes from whole-mount images, n = 4). (D, D’) Expression of Fgf8 in the mesenchyme as well as of Dlx5 in the mesenchyme and basal epidermis of the axolotl limb bud and blastema (single planes from whole-mount images, n = 4). (E, E’) Expression of the mesenchymal marker Prrx1, and of Lef1 in the mesenchyme and basal epidermis of the axolotl blastema and limb bud (single planes from whole-mount images, n = 4). For microscopy images right panels represent magnifications of the outlined boxes, M = mesenchyme, E = epidermis. Dashed lines demarcate epidermal–mesenchymal boundaries.
Figure 2—figure supplement 1
Sp6 is expressed in the basal epidermis and proximal mesenchyme in the axolotl limb bud (n = 4).
(A) Single plane image from a whole-mount limb bud HCR staining of Sp6 and Fgf8 transcripts. (B) Fgf8 expression is localized to the distal mesenchyme of the axolotl limb bud. (C) Sp6 is ubiquitously expressed in the epidermis but only expressed in the proximal mesenchyme of the axolotl limb bud. Dashed lines demarcate epidermal–mesenchymal boundaries.
Figure 3
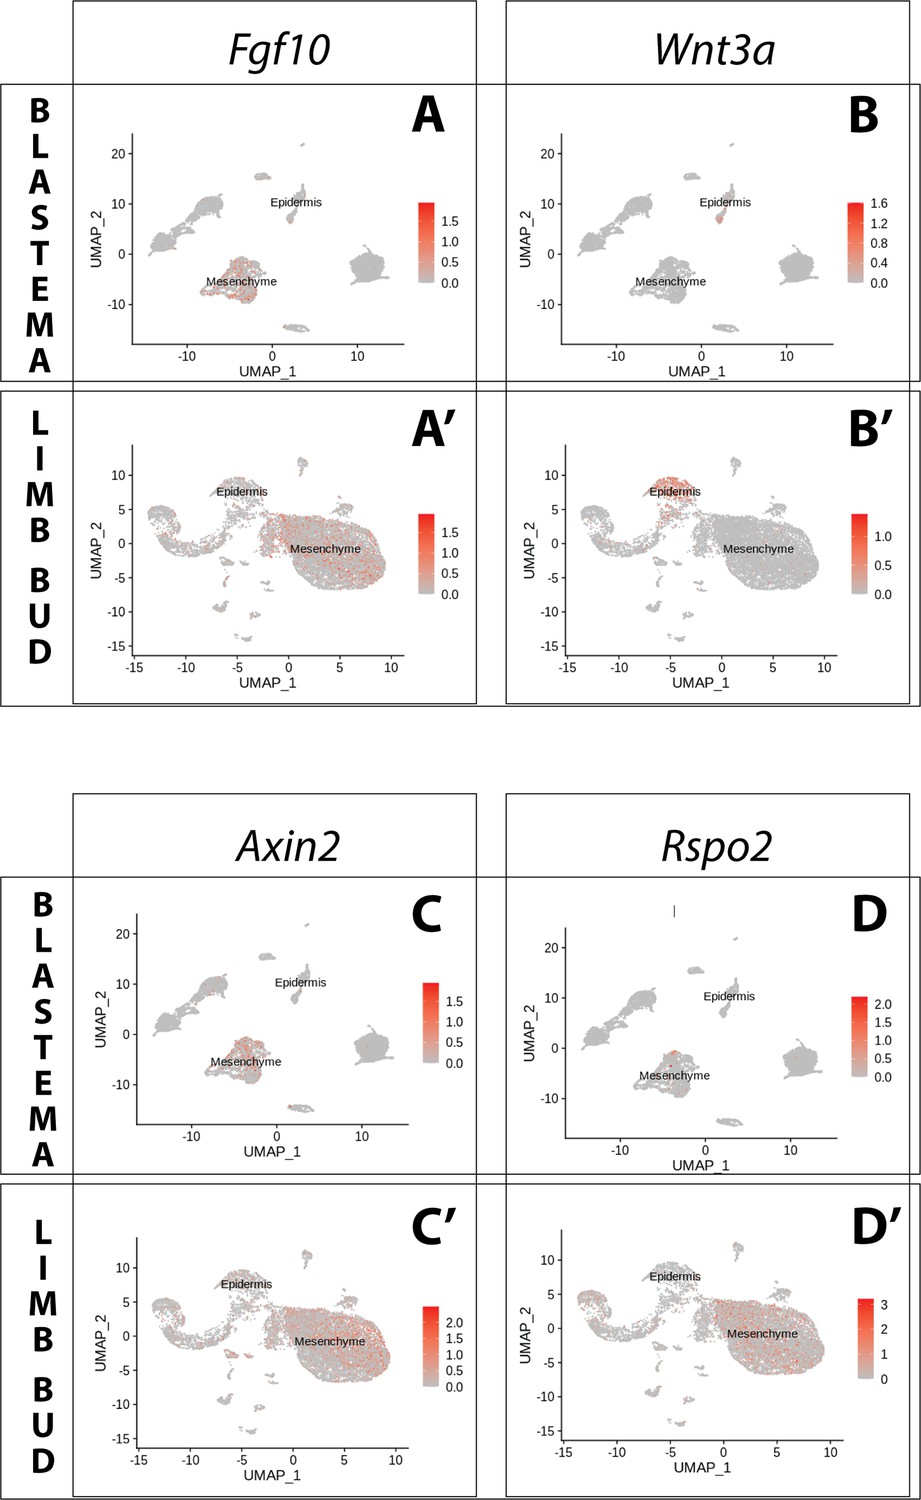
Expression of Fgf10 and of the canonical Wnt pathway components Wnt3a, Axin2, Rspo2 in the axolotl limb bud and limb blastema assessed by reanalysis of Axolotl scRNA seq datasets.
Reanalysis of scRNA seq data from blastema (A–D, data from Li et al., 2021) or limb bud (A’–D’, data from Lin et al., 2021). (A, A’) UMAPs of Axolotl scRNA seq expression data for Fgf10. Expression is detected in the mesenchyme of the axolotl blastema and limb bud. (B, B’) UMAPs of Axolotl scRNA seq expression data for Wnt3a. Expression is detected in the epidermis of the axolotl blastema and limb bud. (C, C’) UMAPs of Axolotl scRNA seq expression data for Axin2. Expression is detected in the prevalently in the mesenchyme of the axolotl blastema and limb bud. (D, D’) UMAPs of Axolotl scRNA seq expression data for Rspo2. Expression is detected in the mesenchyme of the axolotl limb bud. Expression is detected only in few blastema cells.
Figure 4 with 2 supplements
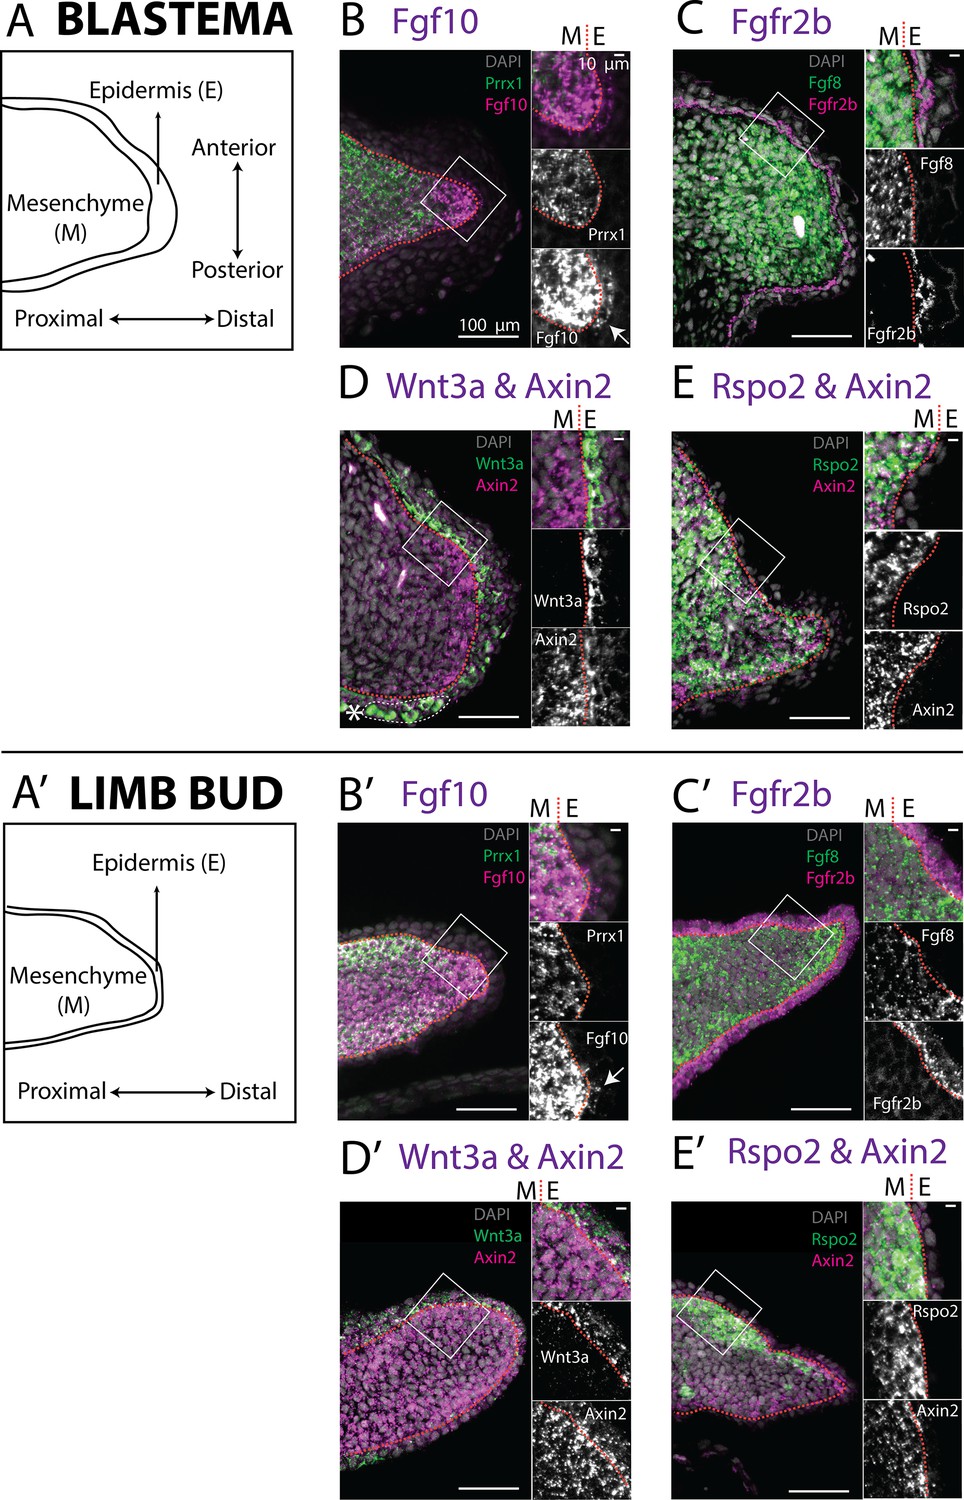
Expression of Fgf10, Fgfr2b and of the canonical Wnt pathway components Wnt3a, Axin2, Rspo2 in the axolotl limb bud and limb blastema evaluated by HCR in situ hybridization.
(A, A’) Schematic outlining the mesenchymal and epidermal compartments in a longitudinal section of an axolotl blastema and limb bud. (B, B’) Expression of Prrx1 and Fgf10 in the mesenchyme of the axolotl blastema and limb bud revealed by HCR (single planes from whole-mount images, n = 4). Arrows point to weak Fgf10 expression present in the distal basal epidermis of the blastema and limb bud. (C, C’) Expression of Fgf8 in the mesenchyme and expression of Fgfr2b in the basal epidermis of the axolotl blastema and limb bud revealed by HCR (single planes from whole-mount images, n = 4). (D, D’) Expression of Wnt3a in the basal epidermis and Axin2 in the mesenchyme and basal epidermis of the axolotl blastema and limb bud (single planes from whole-mount images, n = 4). Axin2 expression is stronger in the mesenchyme and weaker in the epidermis. (E, E’) Expression of Rspo2 in the mesenchyme and Axin2 in the mesenchyme and basal epidermis of the axolotl blastema and limb bud (single plane from whole-mount image, n = 4). Bright green structures (*) in the blastema outer epidermis are autofluorescent signal. For microscopy images right panels represent magnifications of the outlined boxes, M = mesenchyme, E = epidermis. Dashed lines demarcate epidermal–mesenchymal boundaries.
Figure 4—figure supplement 1
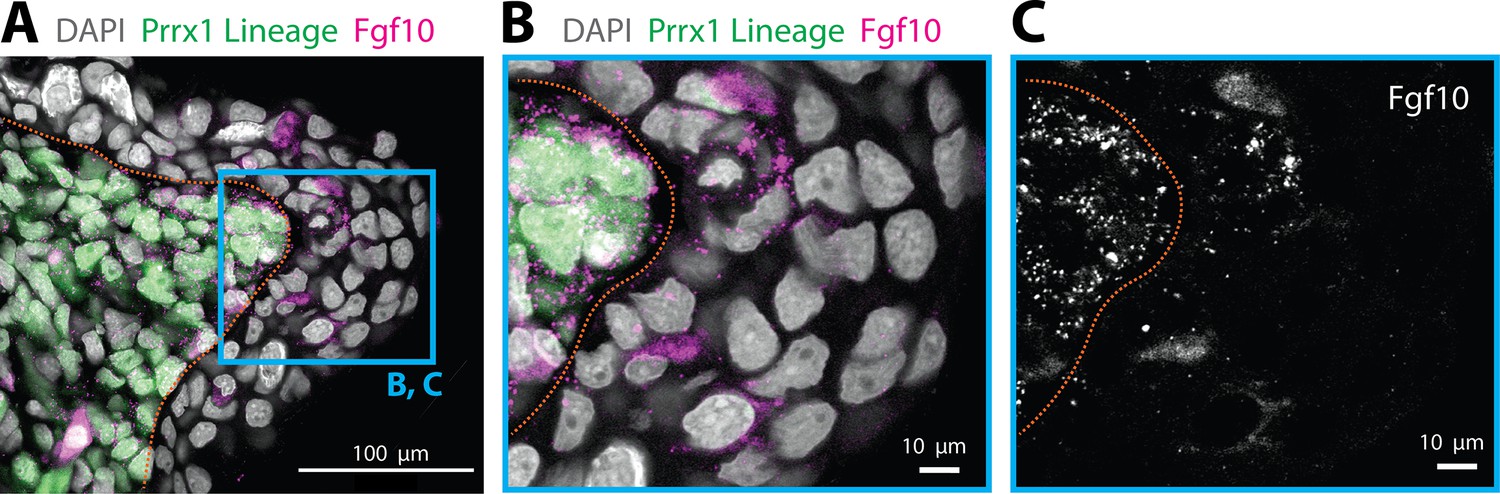
Epidermal cells expressing Fgf10 are not of mesenchymal origin.
(A) Fgf10 transcripts are present in epidermal cells that are not Prrx1 lineage labeled in the axolotl blastema. Fgf10 transcripts are present in epidermal cells that are not Prrx1 lineage labeled in the axolotl blastema (n = 4 blastemas). HCR in situ hybridization performed in a tissue section of a Prrx1:Cre-ER;CAGGs:lp-Cherry animal that was tamoxifen converted during limb development. Green cells are cells of mesenchymal lineage origin. (B, C) Magnifications of the box outlined in A. Dashed lines demarcate epidermal–mesenchymal boundaries.
Figure 4—figure supplement 2

Rspo2 expression is biased along the dorsoventral axis in the axolotl blastema (A–C) and limb bud (D–F) (n = 4).
(A) Single plane image from a whole-mount blastema HCR staining of Rspo2 transcripts. (B) Cross-section of the blastema proximodistal axis showing biased expression along the dorsoventral axis. (C) Cross-section of the blastema anterior–posterior axis showing biased expression along the dorsoventral axis. (D) Single plane image from a whole-mount limb bud HCR staining of Rspo2 transcripts. (E) Cross-section of the limb bud proximodistal axis showing biased expression along the dorsoventral axis. (F) Cross-section of the limb bud anterior–posterior axis showing biased expression along the dorsoventral axis.
Figure 5 with 3 supplements
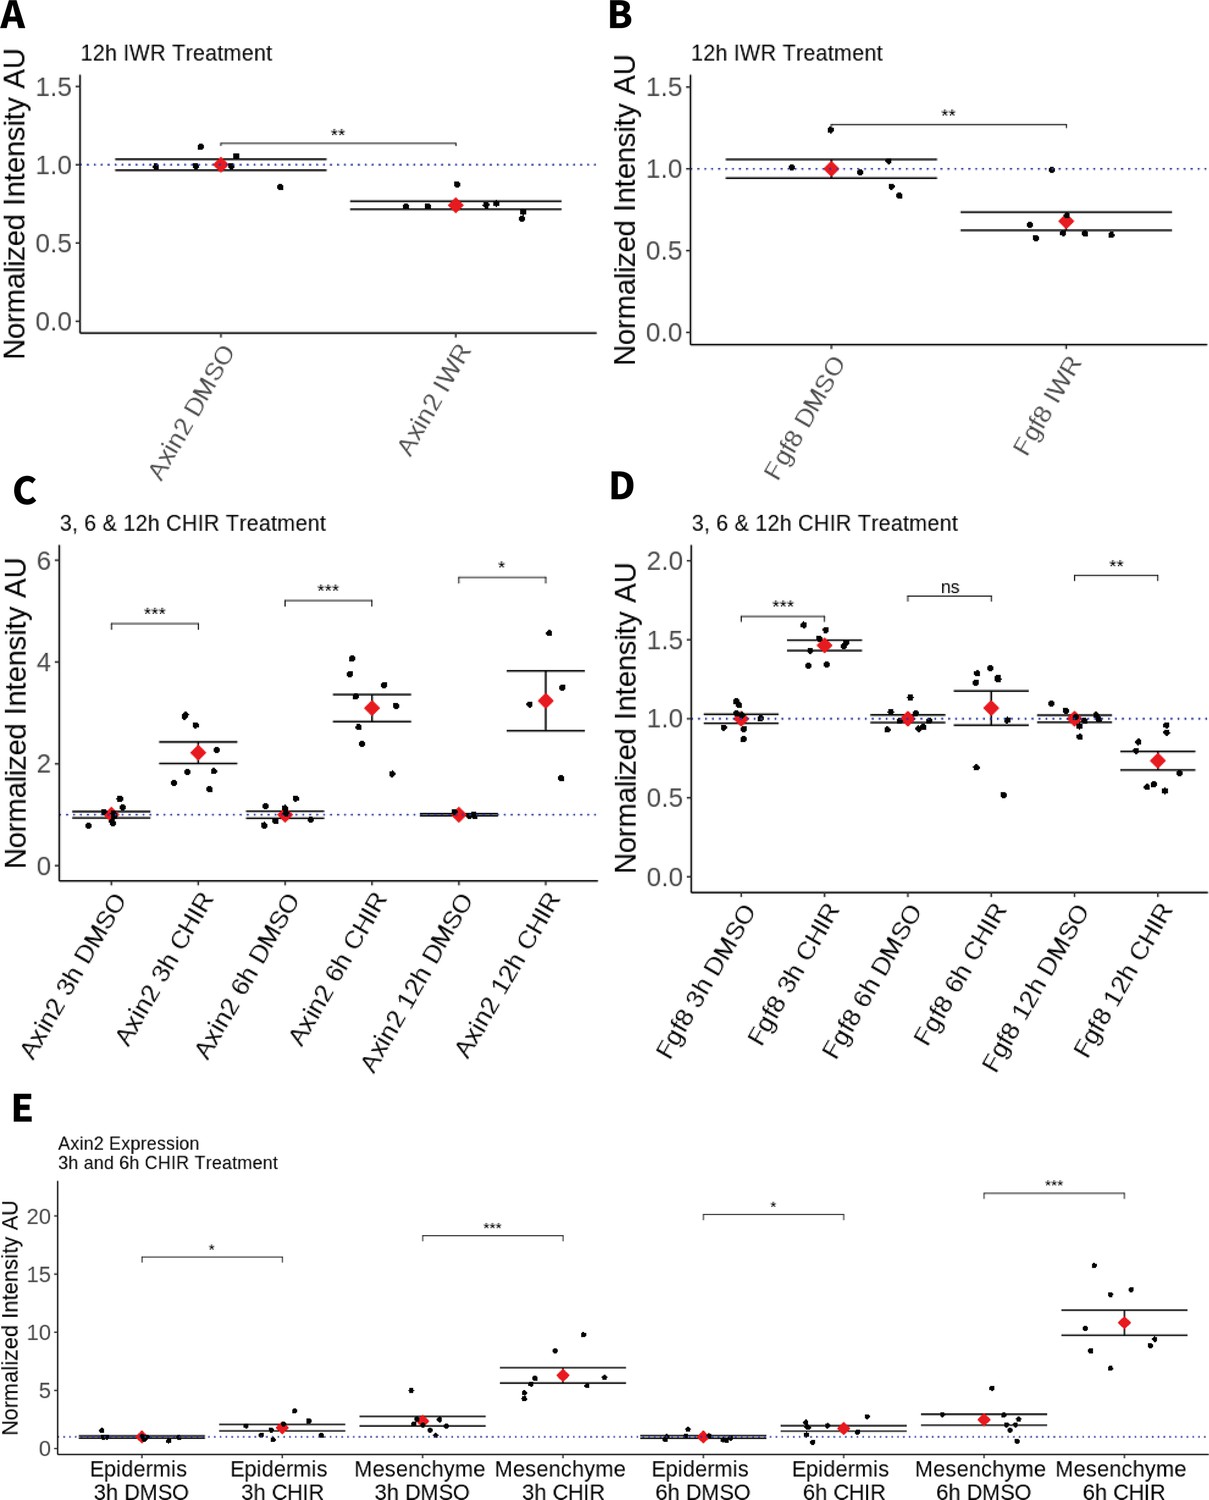
Effect of pharmacological perturbation of Wnt signaling on Fgf8 expression in the axolotl blastema.
Plots depicting expression levels of Fgf8 or Axin2 as assessed by mean fluorescent intensity of HCR signal inside the corresponding gene expression domains. Each black dot represents the mean signal quantified from one blastema, each red dot represents mean values for each condition. Whiskers indicate the standard error of the mean. * indicates statistical significance (*p < 0.05, **p < 0.01, ***p < 0.001, ns = nonsignificant = p > 05). Statistics were performed using the nonparametric Wilcoxon rank sum test. (A, B) Pharmacological inhibition of Wnt signaling using IWR1-endo downregulates Axin2 and Fgf8 expression in the axolotl limb blastema. (C) CHIR treatment activates canonical Wnt signaling in the axolotl blastema as shown by upregulation of Axin2 expression after 3, 6, and 12 hr of treatment. (D) Pharmacological activation of Wnt signaling using CHIR upregulates Fgf8 in the axolotl blastema after 3 hr of treatment. Fgf8 expression comparable to DMSO control levels after 6 hr of treatment and downregulated after 12 hr of CHIR treatment. (E) Mesenchymal and epidermal Axin2 expression are both upregulated after 3 and 6 hr of CHIR treatment. Mesenchymal Axin2 increases 2.6-fold after 3 hr and 4.4-fold after 6 hr of treatment. Epidermal Axin2 increases 1.8-fold after 3 hr and 1.7-fold after 6 hrs of treatment.
-
Figure 5—source data 1
Numerical data for the plots in Figure 5.
- https://cdn.elifesciences.org/articles/79762/elife-79762-fig5-data1-v2.xlsx
Figure 5—figure supplement 1
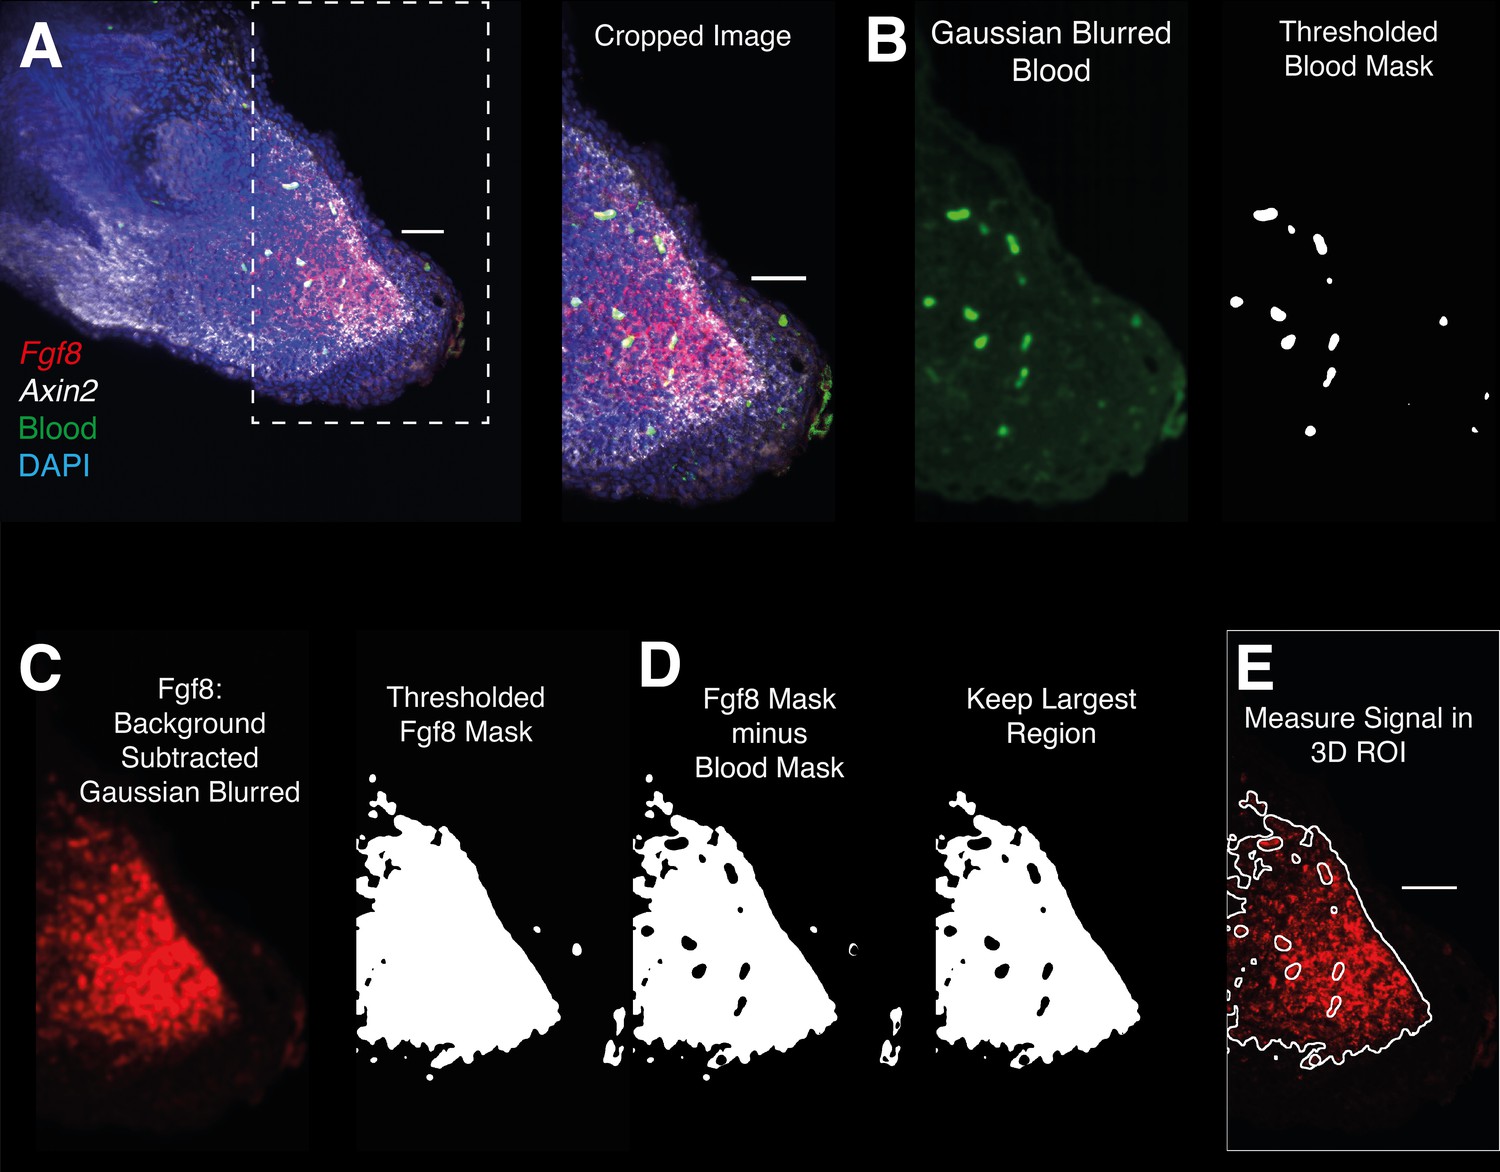
Image analysis workflow for whole-mount HCR signal quantification inside gene expression domains.
(A) 3D images are cropped distal to the amputated bone. (B) The Image acquired using 488 illumination (no HCR staining) is used to generate a 3D mask of the autofluorescent blood cells. The mask is generated by thresholding after denoising (Gaussian Blur). (C) HCR images are background subtracted, denoised, and thresholded to generate a mask containing HCR signal + autofluorescence. (D) HCR signal is isolated subtracting the previously obtained autofluorescence mask from the gene expression mask. (E) The resulting mask is refined and used for 3D signal quantification.
Figure 5—figure supplement 2
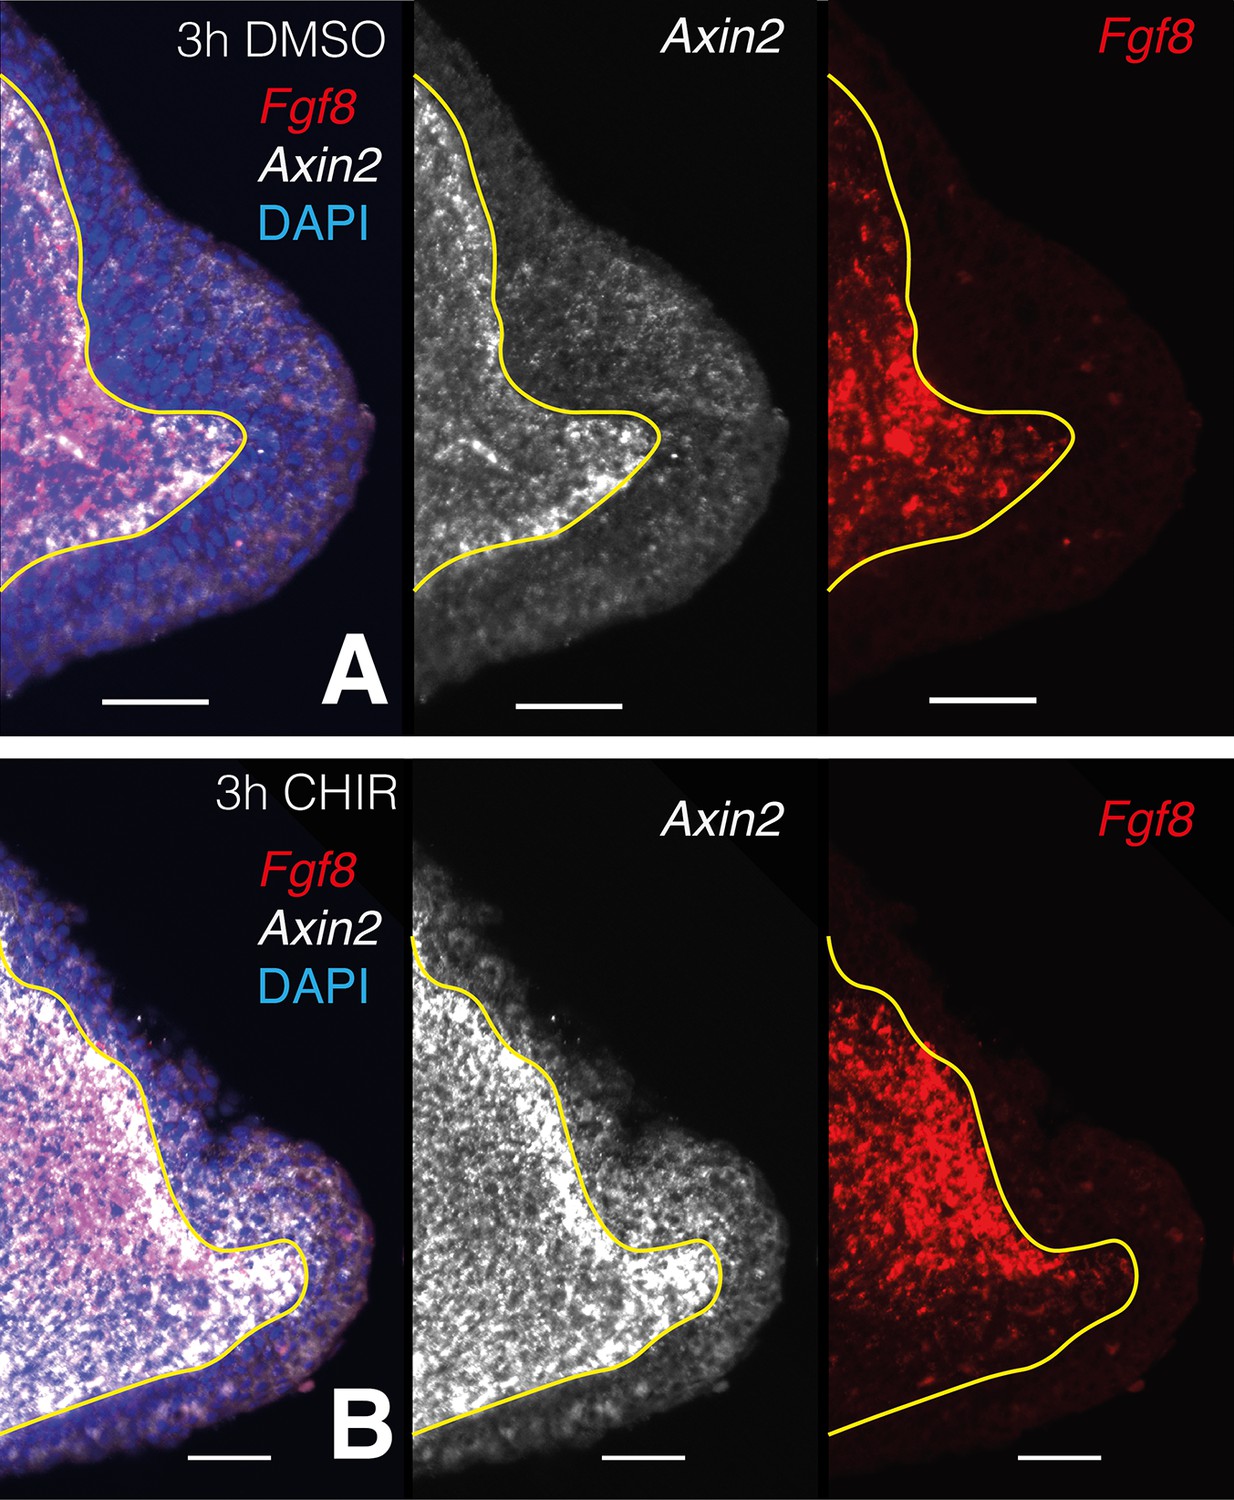
Single plane images from whole-mount stacks of 3-hr CHIR-treated and DMSO control samples.
(A) Three hours DMSO control blastema. From left to right: composite multichannel image, Axin2 alone, Fgf8 alone. (B) Three hours CHIR-treated blastema. From left to right: composite multichannel image, Axin2 alone, Fgf8 alone. (A, B) All pairs from treated and control are displayed with the same settings. Yellow lines demarcate epidermal–mesenchymal boundaries.
Figure 5—figure supplement 3
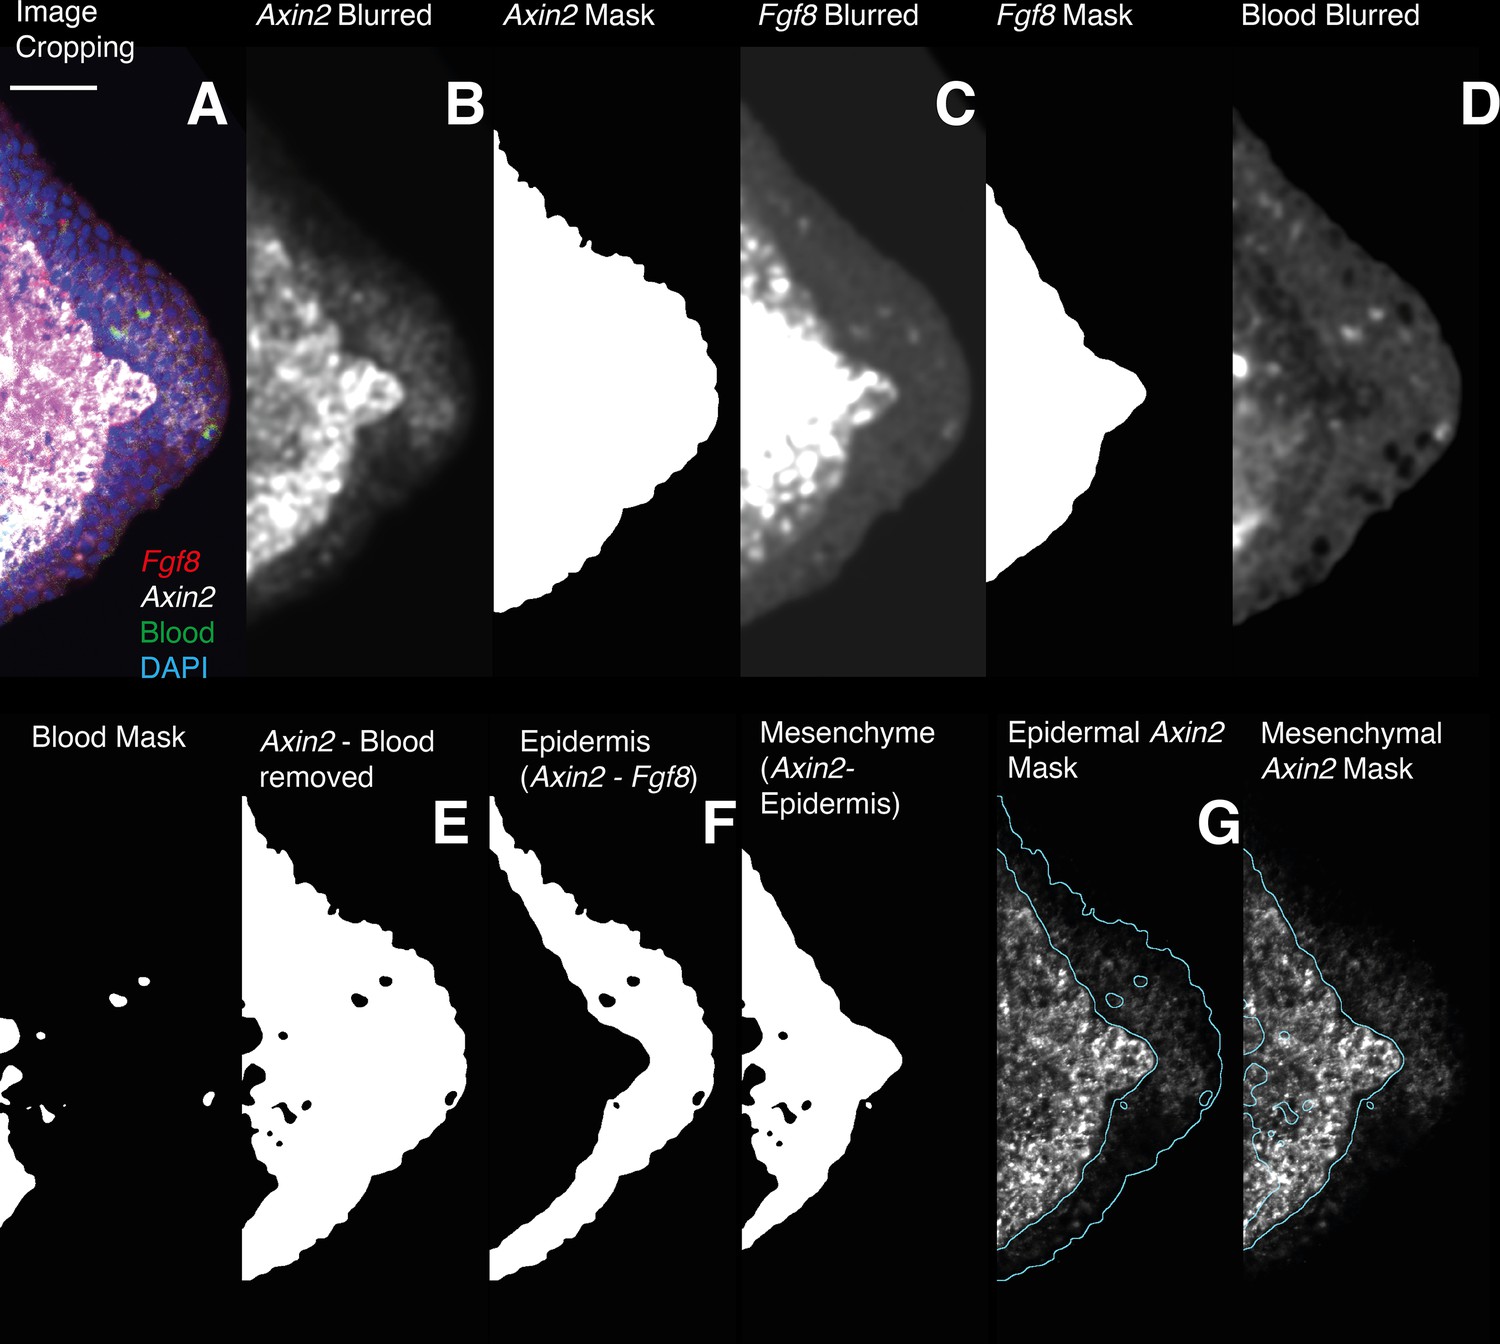
Image analysis workflow for the quantification of Axin2 HCR signal quantification in the epidermal and mesenchymal domains.
(A) 3D images are cropped, in the cropped images the entire mesenchyme contains Fgf8 transcripts. (B, C) HCR images for Axin2 and Fgf8 are denoised and thresholded to generate a mask containing HCR signal + autofluorescence. (D) The Image acquired using 488 nm illumination (no HCR staining) is used to generate a 3D mask of the autofluorescent blood cells. (E) The Axin2 gene expression domain is isolated by subtracting the autofluorescence mask from the previously obtained masks. (F, G) The Fgf8 mask is used to outline the mesenchyme. A mask for the Axin2 epidermal expression domain is obtained subtracting the Fgf8 mask from the Axin2 mask. To obtain intensity measurements the 3D masks are applied to the raw data after background subtraction.
Tables
Key resources table
| Reagent type (species) or resource | Designation | Source or reference | Identifiers | Additional information |
|---|---|---|---|---|
| Strain, strain background (Ambystoma mexicanum, d/d strain) | Axolotl, d/d strain | Tanaka lab axolotl colony | – | Axolotl stock maintained in Tanaka lab, Vienna, Austria. |
| Chemical compound, drug | CHIR-99021 | Tocris | 4423 | |
| Chemical compound, drug | IWR-1, ≥98% (hplc) | Sigma-Aldrich | I0161-25MG | |
| Chemical compound, drug | DAPI | Sigma-Aldrich | D9542 | |
| Chemical compound, drug | DMSO | Sigma-Aldrich | D2650-5 × 5 ML | |
| Chemical compound, drug | Histodenz | Sigma-Aldrich | D2158-100G | |
| Chemical compound, drug | Triton X-100 | Sigma-Aldrich | X100-500ML | |
| Chemical compound, drug | N-Methylacetamide, ≥99% | Sigma-Aldrich | M26305-100G | |
| Commercial assay or Kit | V3.0 HCR kit | Molecular Instruments | ||
| Chemical compound, drug | Abberior Mount, Liquid Antifade | Abberior GmbH | MM-2009-2 × 15 ML | |
| Chemical compound, drug | Tissue Tek O.C.T. Compound | Science Service | 62550-12 |
Additional files
-
Supplementary file 1
HCR probes sequences and transcripts IDs table.
- https://cdn.elifesciences.org/articles/79762/elife-79762-supp1-v2.xlsx
-
Transparent reporting form
- https://cdn.elifesciences.org/articles/79762/elife-79762-transrepform1-v2.pdf
Download links
A two-part list of links to download the article, or parts of the article, in various formats.
Downloads (link to download the article as PDF)
Open citations (links to open the citations from this article in various online reference manager services)
Cite this article (links to download the citations from this article in formats compatible with various reference manager tools)
Canonical Wnt signaling and the regulation of divergent mesenchymal Fgf8 expression in axolotl limb development and regeneration
eLife 11:e79762.
https://doi.org/10.7554/eLife.79762


