Adaptation to glucose starvation is associated with molecular reorganization of the circadian clock in Neurospora crassa
- Department of Physiology, Semmelweis University, Hungary
- Department of Neurovascular Cellbiology, University Hospital Bonn, Germany
- Department of Molecular Biology, Semmelweis University, Hungary
- Biochemistry Center, Heidelberg University, Germany
Figures
Figure 1 with 2 supplements
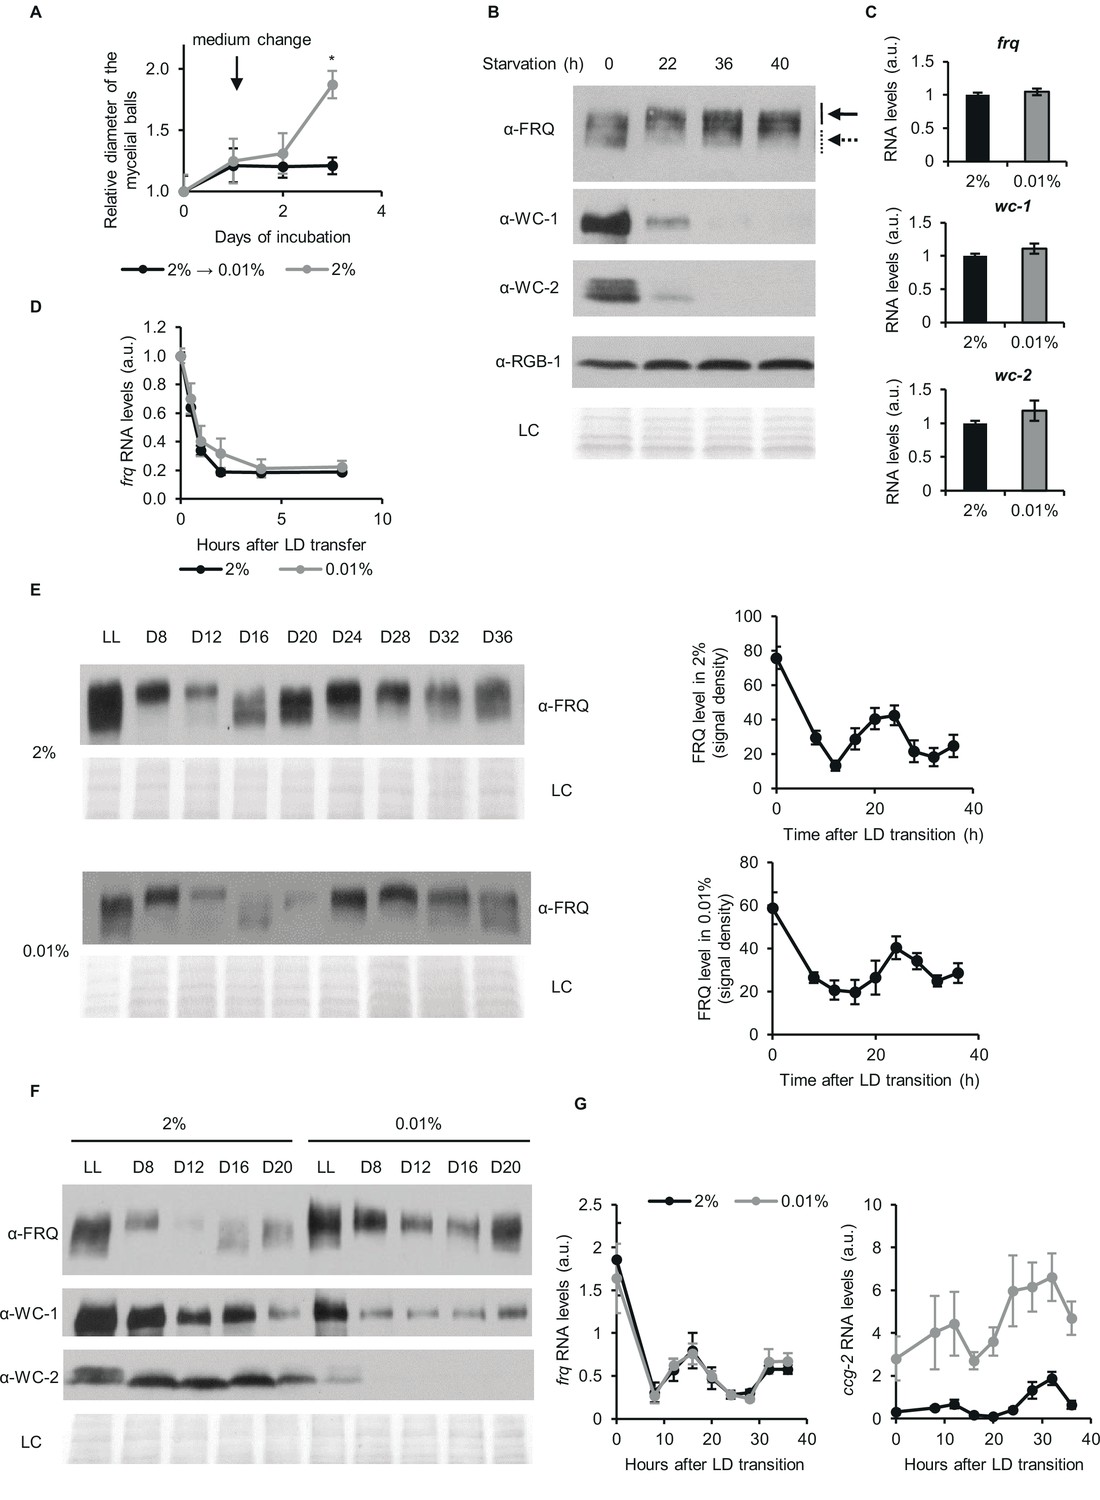
Despite changes of the stoichiometry of clock components circadian time-measuring is sustained upon glucose depletion.
(A) Neurospora growth is arrested in starvation medium. Following an incubation for 24 hr in standard liquid medium, mycelia were transferred to media containing either 2% or 0.01% glucose. Diameter of the mycelial balls was measured each day. The arrow indicates the time of medium change. (n=3, ± SEM, Repeated measures ANOVA, significant time-treatment interaction; post hoc analysis: Fisher LSD test). (B) Long-term glucose starvation affects expression of clock proteins in wt. Mycelial discs were incubated for 24 hr in standard liquid medium and then transferred to starvation medium (time point 0). Samples were harvested at the indicated time points. Cell extracts were analyzed by western blotting. Solid and dashed arrows indicate hyper- and hypophosphorylated forms of FRQ, respectively. RGB-1 and Ponceau staining (LC: loading control) are shown as loading controls. (n=3) See also A. (C) RNA levels of frq, wc-1 and wc-2 are similar under standard and nutrient limited conditions. Mycelial discs of the wt strain were incubated in standard liquid medium for 24 hr, then transferred to fresh media containing either 0.01% or 2% glucose and incubated for 40 hr in LL. RNA levels were normalized to that in cells grown in standard medium. (n=9–22, ± SEM, two-sample t-test, n.s.). (D) Stability of frq RNA is not affected by starvation. Growth conditions were described in (C). Following 40 hr of incubation in LL, cultures were transferred to DD (time point 0). Samples were harvested at the indicated time points. RNA levels were normalized to those measured at time point 0. (n=6, ± SEM, Repeated measures ANOVA, n.s.). (E) Left panel: FRQ level oscillates under starvation conditions in DD. Following an incubation in standard liquid medium for 24 hr, mycelia were transferred to standard or starvation medium. After 24 hr incubation in LL, cultures were transferred to DD. Samples were harvested at the indicated time points. (n=3, LC: loading control) Right panel: FRQ specific signals were analyzed by densitometry. (n=4–6). (F) WC levels are reduced and FRQ is hyperphosphorylated during glucose starvation. The experiment was performed as described in (E). Cell extracts from both growth conditions were analyzed on the same gel. (n=3, LC: loading control). (G) Expression of frq and ccg-2 is rhythmic during long-term glucose starvation. Experiment was performed as described in (E). RNA levels were determined by qPCR. (n=3–11, ± SEM, Repeated measures ANOVA, n.s.).
-
Figure 1—source data 1
Source data for Figure 1B.
(a) Western blots were used to detect expression of FRQ in the indicated samples for Figure 1B. (b) Figure with the area highlighted was used to develop the Figure 1B for FRQ. (c) Western blots were used to detect expression of WC-1 in the indicated samples for Figure 1B. (d) Figure with the area highlighted was used to develop the Figure 1B for WC-1. (e) Western blots were used to detect expression of WC-2 in the indicated samples for Figure 1B. (f) Figure with the area highlighted was used to develop the Figure 1B for WC-2. (g) Western blots were used to detect expression of RGB1 in the indicated samples for Figure 1B. (h) Figure with the area highlighted was used to develop the Figure 1B for RGB1. (i) Ponceau S staining was used to detect loading control of the indicated samples for Figure 1B. (j) Figure with the area highlighted was used for LC of Figure 1B .
- https://cdn.elifesciences.org/articles/79765/elife-79765-fig1-data1-v1.zip
-
Figure 1—source data 2
Source data for Figure 1E.
(a) Western blots were used to detect expression of FRQ in the indicated samples grown in 0.01% glucose containing medium for Figure 1E. (b) Figure with the area highlighted was used to develop the Figure 1E for FRQ in 0.01% glucose. (c) Western blots were used to detect expression of FRQ in the indicated samples grown in 2% glucose containing medium for Figure 1E. (d) Figure with the area highlighted was used to develop the Figure 1E for FRQ in 2% glucose. (e) Ponceau S staining was used to detect loading control of the indicated samples for Figure 1E (0.01% glucose). (f) Figure with the area highlighted was used to develop the Figure 1E for LC (0.01% glucose). (g) Ponceau S staining was used to detect loading control of the indicated samples for Figure 1E (2% glucose). (h) Figure with the area highlighted was used to detect loading control of the indicated samples for Figure 1E (2% glucose).
- https://cdn.elifesciences.org/articles/79765/elife-79765-fig1-data2-v1.zip
-
Figure 1—source data 3
Source data for Figure 1F.
(a) Western blots were used to detect expression of FRQ in the indicated samples for Figure 1F. (b) Figure with the area highlighted was used to develop the Figure 1F for FRQ. (c) Western blots were used to detect expression of WC-1 in the indicated samples for Figure 1F. (d) Figure with the area highlighted was used to develop the Figure 1F for WC-1. (e) Western blots were used to detect expression of WC-2 in the indicated samples for Figure 1F. (f) Figure with the area highlighted was used to develop the Figure 1F for WC-2. (g) Ponceau S staining was used to detect loading control of the indicated samples for Figure 1F. (h) Figure with the area highlighted was used as LC for Figure 1F.
- https://cdn.elifesciences.org/articles/79765/elife-79765-fig1-data3-v1.zip
-
Figure 1—source data 4
Actin levels are decreased in glucose starvation.
Experimental procedures were performed as described in Figure 1C. Ct values of the indicated genes were determined by qPCR. (n=3, ± SEM) In the last row, ratio of the expression levels (wt 0.01%/2%) are shown based on the RNAseq dataset.
- https://cdn.elifesciences.org/articles/79765/elife-79765-fig1-data4-v1.docx
Figure 1—figure supplement 1
Analysis of expression changes in clock components.
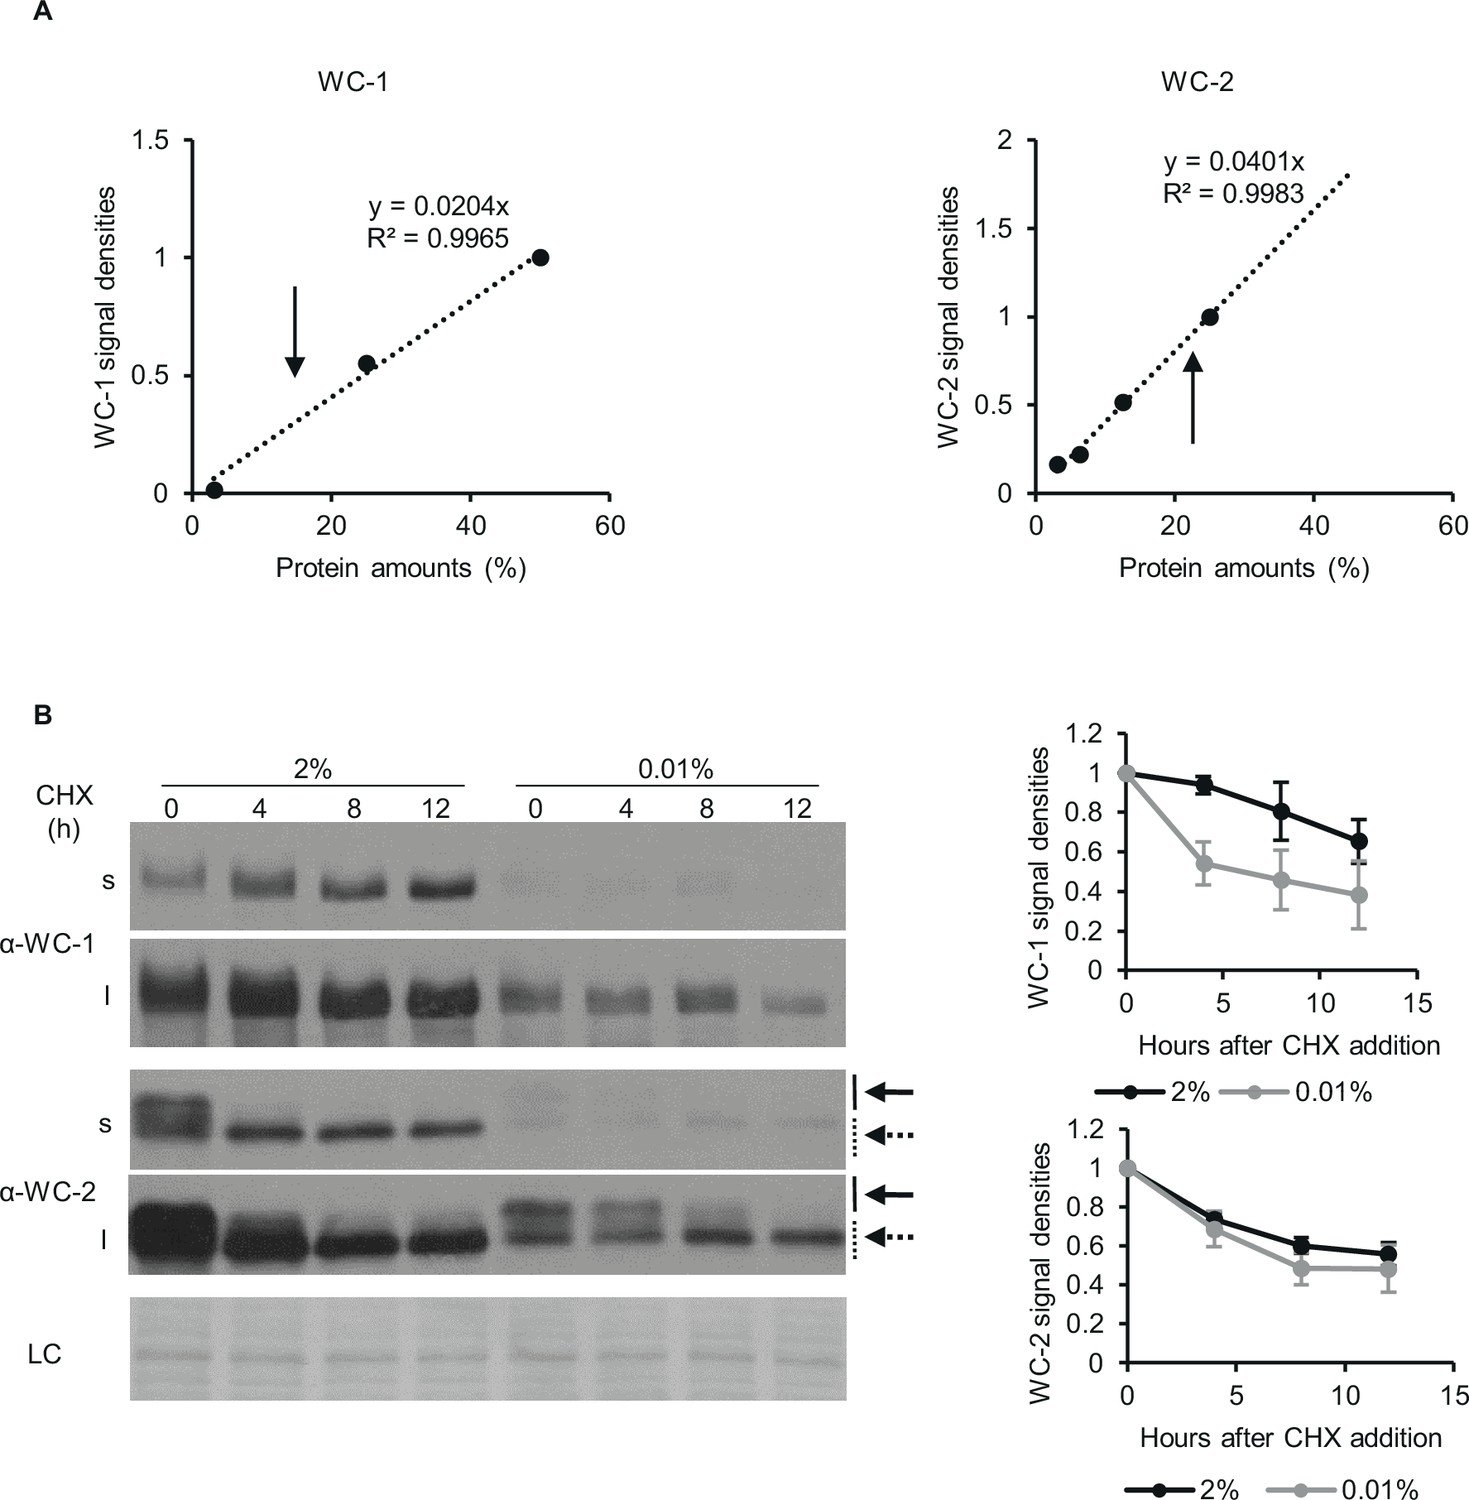
(A) Calibration of the WCC expression levels in starvation. Protein gel was loaded with increasing quantities (3,13–50%) of wt lysates grown in 2% glucose containing medium and analysed by western blotting. WC-1 (left panel) and WC-2 (right panel) specific signals were analysed by densitometry and a calibration line was fitted by linear regression. Arrows indicate the amount of positive clock components in wt lysates grown in starvation medium. (B) Glucose starvation moderately reduces the stability of WC-1. Experimental procedures were performed as described in Figure 1C. Following 40 hr of starvation translation inhibitor cycloheximide (CHX) was added to the medium in a final concentration of 10 µg/ml (time point 0). Samples were harvested at the indicated time points following CHX addition. Left panel: Whole cell extracts were analysed by western blotting with the indicated antibodies. Solid and dashed arrows indicate hyper- and hypophosphorylated forms of WC-2 proteins, respectively. Short (s) and long (l) exposures are shown in order to get comparable signals in both conditions. (LC: loading control) Right panel: Signal densities of WC proteins were determined and normalized to the values detected in time point 0. (n=5, ± SEM).
-
Figure 1—figure supplement 1—source data 1
Source data for Figure 1—figure supplement 1B.
(a) Western blots were used to detect expression of WC-1 in the indicated samples for Figure 1—figure supplement 1B (s: short exposure). (b) Figure with the area highlighted was used to develop the Figure 1—figure supplement 1B for WC-1 (s: short exposure). (c) Western blots were used to detect expression of WC-1 in the indicated samples for Figure 1—figure supplement 1B (l: long exposure). (d) Figure with the area highlighted was used to develop the Figure 1—figure supplement 1B for WC-1 (l: long exposure). (e) Western blots were used to detect expression of WC-2 in the indicated samples for Figure 1—figure supplement 1B (s: short exposure). (f) Figure with the area highlighted was used to develop the Figure 1—figure supplement 1B for WC-2 (s: short exposure). (g) Western blots were used to detect expression of WC-2 in the indicated samples for Figure 1—figure supplement 1B (l: long exposure). (h) Figure with the area highlighted was used to develop the Figure 1—figure supplement 1B for WC-2 (l: long exposure). (i) Ponceau S staining was used to detect loading control of the indicated samples for Figure 1—figure supplement 1B. (j) Figure with the area highlighted was used as LC of Figure 1—figure supplement 1B.
- https://cdn.elifesciences.org/articles/79765/elife-79765-fig1-figsupp1-data1-v1.zip
Figure 1—figure supplement 2
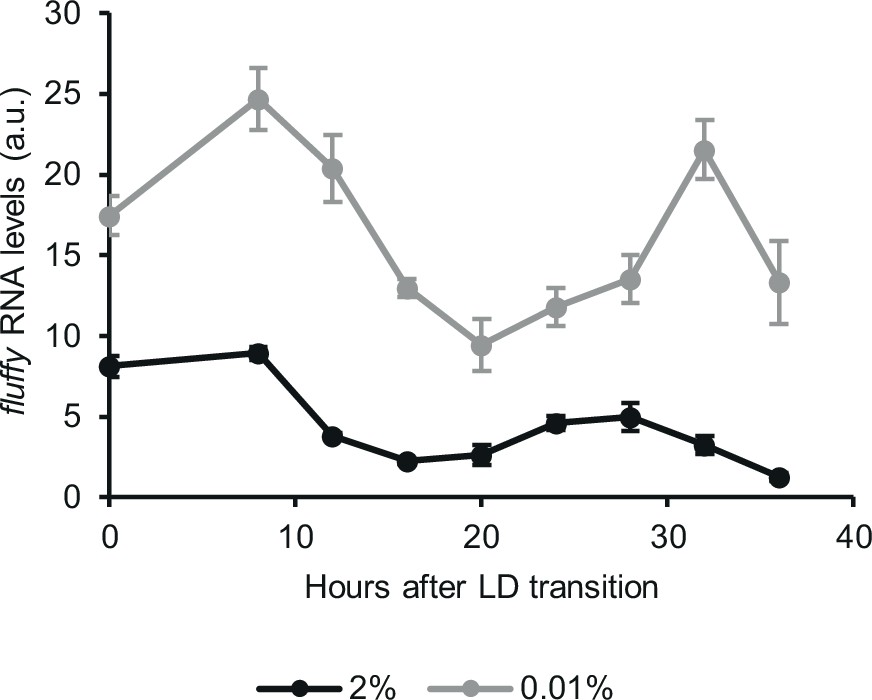
The circadian output is rhythmic in starvation.
Following an incubation in standard liquid medium for 24 hr, mycelia were transferred to fresh standard or starvation medium. After 24 hr of incubation in LL, cultures were transferred to DD. Samples were harvested at the indicated time points. Relative fluffy RNA levels were determined. (n=3–6, ± SEM).
Figure 2
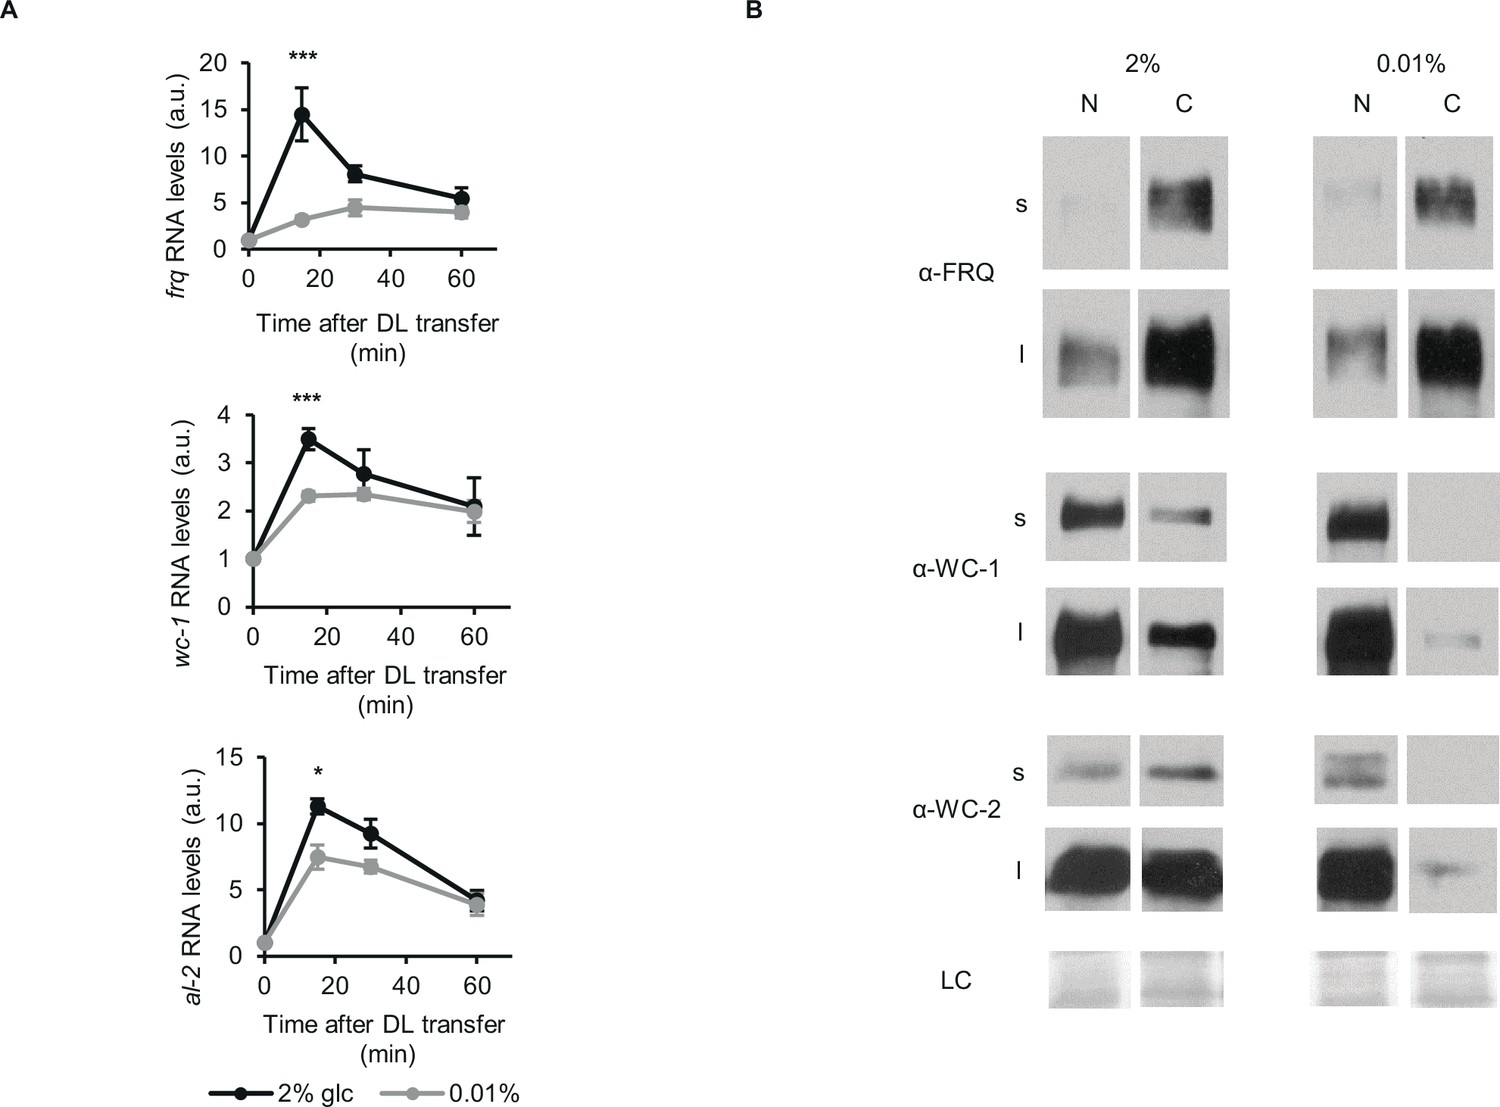
Glucose deprivation impacts both light induction of gene expression and subcellular distribution of clock components.
(A) Light induction of gene expression is attenuated by glucose starvation. Mycelial discs of the wt strain were incubated in standard liquid medium for 24 hr, then transferred to media containing either 0.01% or 2% glucose. Following a 24 hr incubation in LL, cultures were transferred to DD for 16 hr and then light induced. Samples were harvested at the indicated time points after light on. Relative frq, wc-1 and al-2 RNA levels were normalized to that measured at the first time point. (n=5–11, ± SEM, Repeated measures ANOVA, significant time*treatment interaction, post hoc analysis: Tukey HSD test). (B) Glucose deprivation affects subcellular distribution of clock proteins. Growth conditions were as described in Figure 1C. Nuclear (N) and cytosolic (C) fractions were analyzed by Western blotting. (n=3, s: short exposure, l: long exposure, LC: loading control).
-
Figure 2—source data 1
Source data for Figure 2B.
(a) Western blots were used to detect expression of FRQ in the indicated samples for Figure 2B (s: short exposure). (b) Figure with the area highlighted was used to develop the Figure 2B for FRQ (s: short exposure). (c) Western blots were used to detect expression of FRQ in the indicated samples for Figure 2B (l: long exposure). (d) Figure with the area highlighted was used to develop the Figure 2B for FRQ (l: long exposure). (e) Western blots were used to detect expression of WC-1 in the indicated samples for Figure 2B (s: short exposure). (f) Figure with the area highlighted was used to develop the Figure 2B for WC-1 (s: short exposure). (g) Western blots were used to detect expression of WC-1 in the indicated samples for Figure 2B (l: long exposure). (h) Figure with the area highlighted was used to develop the Figure 2B for WC-1 (l: long exposure). (i) Western blots were used to detect expression of WC-2 in the indicated samples for Figure 2B (s: short exposure). (j) Figure with the area highlighted was used to develop the Figure 2B for WC-2 (s: short exposure). (k) Western blots were used to detect expression of WC-2 in the indicated samples for Figure 2B (l: long exposure). (l) Figure with the area highlighted was used to develop the Figure 2B for WC-2 (l: long exposure). (m) Ponceau S staining was used to detect loading control of the indicated samples for Figure 2B. (n) Figure with the area highlighted was used as LC for Figure 2B.
- https://cdn.elifesciences.org/articles/79765/elife-79765-fig2-data1-v1.zip
Figure 3
FRQ, PKA, GSK and PP2A affect the starvation response of the Neurospora clock.
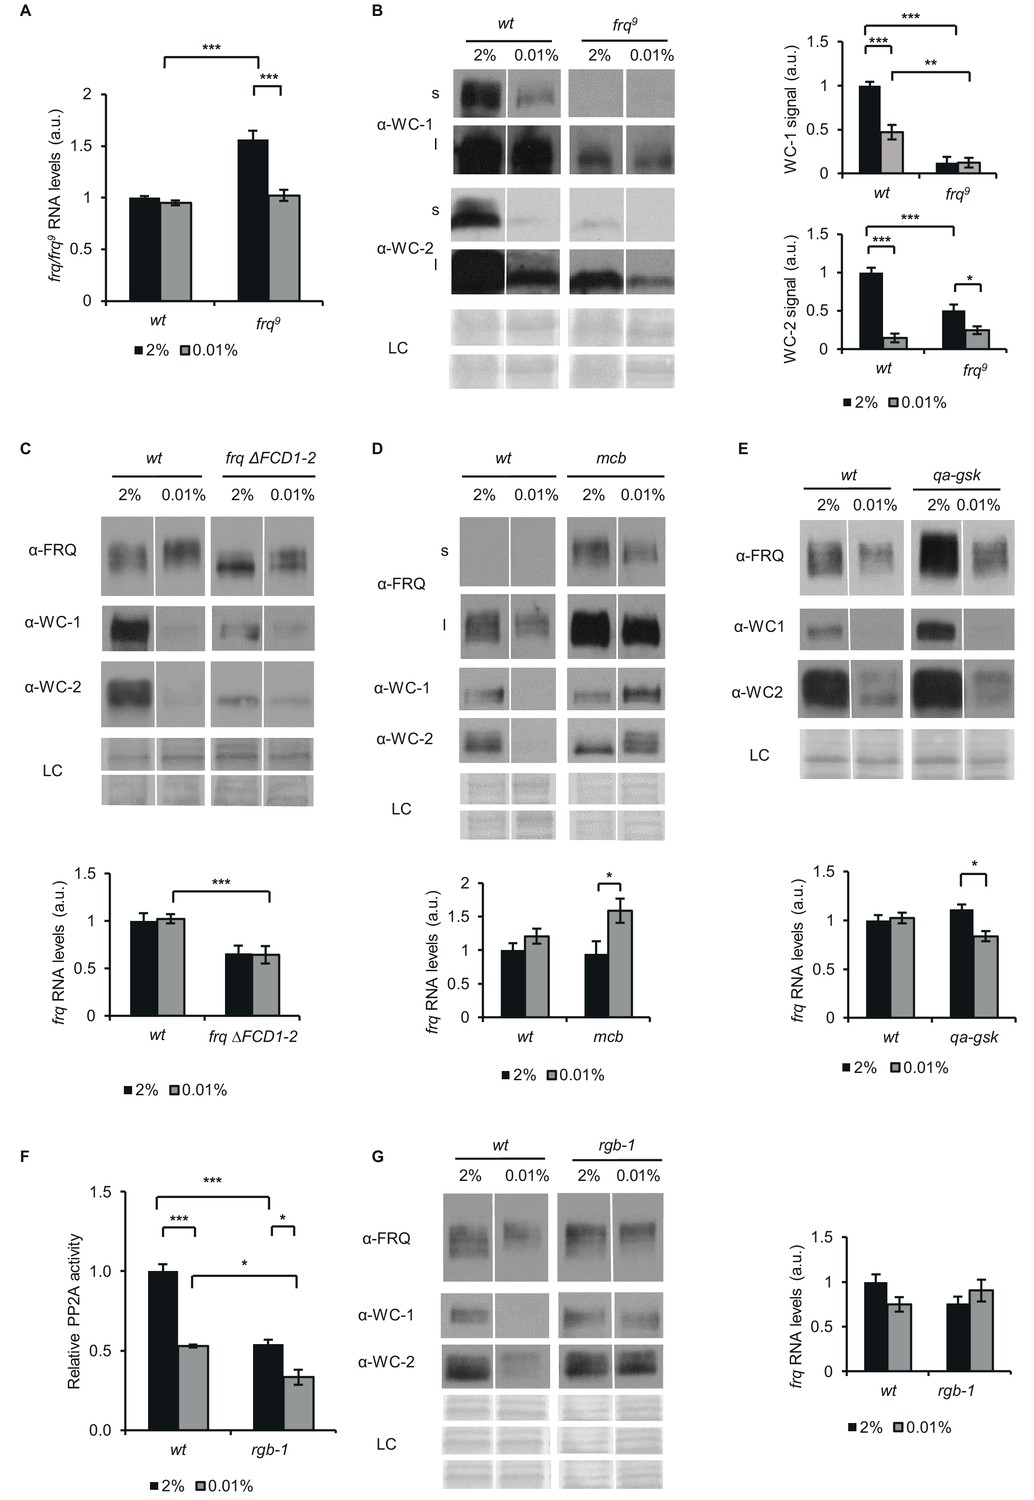
(A) frq9 RNA expression is sensitive to glucose deprivation. Growth conditions were as described in Figure 1C. RNA levels were normalized to that of wt grown in standard medium. (n=6, ± SEM, Factorial ANOVA; significant strain*treatment interaction; post hoc analysis: Tukey HSD test). (B) Effect of starvation on WC levels is reduced in frq9. Growth conditions were as described in Figure 1C. Cell extracts were analyzed by western blotting (left panel). (n=3) Protein signal density was analyzed (right panel). (n=3, ± SEM, LC: loading control for WC-2 (upper panel) and WC-1 (lower panel), Factorial ANOVA; significant strain*treatment interaction; post hoc analysis: Tukey HSD test). (C) Impaired FRQ-CK1a interaction affects the starvation response of the molecular clock. Experiments were performed with the indicated strains as described in Figure 1C. Indicated protein (upper panel) and frq expressions (lower panel) were analyzed. RNA levels were normalized to that of wt grown in standard medium. (n (protein analysis)=12, LC: loading control for FRQ and WC-2 (upper panel) and WC-1 (lower panel), n (RNA analysis)=4–5, ± SEM, Factorial ANOVA; significant strain effect; post hoc analysis: Tukey Unequal N HSD test). (D) The starvation response is altered in the PKA mutant (mcb). Experiments were performed with the indicated strains as described in Figure 1C. Upper panel: analysis of cell extracts by Western blotting (n=12, s: short exposure, l: long exposure; LC: loading control for FRQ (upper panel), WC-1 and WC-2 (lower panel)) Lower panel: frq RNA levels of the indicated strains. RNA levels were normalized to that of wt grown in standard medium. (n=8–9, ± SEM, Factorial ANOVA; significant treatment effect; post hoc analysis: Tukey Unequal N HSD test). (E) Hyperphosphorylation of FRQ upon glucose withdrawal is dependent on GSK. Experiments were performed with the indicated strains as described in Figure 1C. The medium was supplemented with 1.5*10–5M quinic acid (QA) during the first day of incubation. Following the medium change, mycelia were incubated in QA-free medium. Upper panel: cell extracts analyzed by Western blotting. (LC: loading control) Lower panel: frq RNA levels of the indicated strains. RNA levels were normalized to that of wt grown in standard medium. (n=6, ± SEM; Factorial ANOVA, significant strain*treatment interaction, post hoc analysis: Tukey HSD test). (F) PP2A activity is decreased under starvation conditions. Experiments were performed with the indicated strains as described in Figure 1C. PP2A-specific activity of the cell lysates was determined and normalized to that of the wt grown in standard medium. (n=3–4, ± SEM, Factorial ANOVA, Significant strain*treatment interaction, post hoc analysis: Tukey Unequal N HSD test). (G) The starvation response is altered in the strain lacking a functional PP2A regulatory subunit (rgb-1). Experimental procedures were performed with the indicated strains as described in Figure 1C. Cell extracts were analyzed by Western blotting (n=12, LC: loading control for FRQ (upper panel), for WC-1 (middle panel) for WC-2 (lower panel)) (left panel) and RNA levels of frq were determined. RNA levels were normalized to that of wt grown in standard medium. (n=9–10, ± SEM, Factorial ANOVA, significant strain*treatment interaction) (right panel).
-
Figure 3—source data 1
Source data for Figure 3B.
(a) Western blots were used to detect expression of WC-1 in the indicated samples for Figure 3B (s: short exposure). (b) Figure with the area highlighted was used to develop the Figure 3B for WC-1 (s: short exposure). (c) Western blots were used to detect expression of WC-1 in the indicated samples for Figure 3B (l: long exposure). (d) Figure with the area highlighted was used to develop the Figure 3B for WC-1 (l: long exposure). (e) Western blots were used to detect expression of WC-2 in the indicated samples for Figure 3B (s: short exposure). (f) Figure with the area highlighted was used to develop the Figure 3B for WC-2 (s: short exposure). (g) Western blots were used to detect expression of WC-2 in the indicated samples for Figure 3B (l: long exposure). (h) Figure with the area highlighted was used to develop the Figure 3B for WC-2 (l: long exposure). (i) Ponceau S staining was used to detect loading control of the indicated samples for Figure 3B. (j) Figure with the area highlighted was used to as LC for WC-1 in Figure 3B. (k) Figure with the area highlighted was used as LC for WC-2 in Figure 3B .
- https://cdn.elifesciences.org/articles/79765/elife-79765-fig3-data1-v1.zip
-
Figure 3—source data 2
Source data for Figure 3C.
(a) Western blots were used to detect expression of FRQ in the indicated samples for Figure 3C. (b) Figure with the area highlighted was used to develop the Figure 3C for FRQ. (c) Western blots were used to detect expression of WC-1 in the indicated samples for Figure 3C. (d) Figure with the area highlighted was used to develop the Figure 3C for WC-1. (e) Western blots were used to detect expression of WC-2 in the indicated samples for Figure 3C. (f) Figure with the area highlighted was used to develop the Figure 3C for WC-2. (g) Ponceau S staining was used to detect loading control of WC-1 for Figure 3C. (h) Figure with the area highlighted was used to develop the Figure 3C for LC for WC-1. (i) Ponceau S staining was used to detect loading control of FRQ and WC-2 for Figure 3C. (j) Figure with the area highlighted was used as LC for FRQ and WC-2 for Figure 3C.
- https://cdn.elifesciences.org/articles/79765/elife-79765-fig3-data2-v1.zip
-
Figure 3—source data 3
Source data for Figure 3D.
(a) Western blots were used to detect expression of FRQ in the indicated samples for Figure 3D (s: short exposure). (b) Figure with the area highlighted was used to develop the Figure 3D for FRQ (s: short exposure). (c) Western blots were used to detect expression of FRQ in the indicated samples for Figure 3D (l: long exposure). (d) Figure with the area highlighted was used to develop the Figure 3D for FRQ (l: long exposure). (e) Western blots were used to detect expression of WC-1 in the indicated samples for Figure 3D. (f) Figure with the area highlighted was used to develop the Figure 3D for WC-1. (g) Western blots were used to detect expression of WC-2 in the indicated samples for Figure 3D. (h) Figure with the area highlighted was used to develop the Figure 3D for WC-2. (i) Ponceau S staining was used to detect loading control of the indicated samples for Figure 3D. (j) Figure with the area highlighted was used as LC for FRQ in Figure 3D. (k) Figure with the area highlighted was used as LC for WC-1 and for WC-2 in Figure 3D .
- https://cdn.elifesciences.org/articles/79765/elife-79765-fig3-data3-v1.zip
-
Figure 3—source data 4
Source data for Figure 3E.
(a) Western blots were used to detect expression of FRQ in the indicated samples for Figure 3E. (b) Figure with the area highlighted was used to develop the Figure 3E for FRQ. (c) Western blots were used to detect expression of WC-1 in the indicated samples for Figure 3E. (d) Figure with the area highlighted was used to develop the Figure 3E for WC-1. (e) Western blots were used to detect expression of WC-2 in the indicated samples for Figure 3E. (f) Figure with the area highlighted was used to develop the Figure 3E for WC-2. (g) Ponceau S staining was used to detect loading control of the indicated samples for Figure 3E. (h) Figure with the area highlighted was used as LC of Figure 3E.
- https://cdn.elifesciences.org/articles/79765/elife-79765-fig3-data4-v1.zip
-
Figure 3—source data 5
Source data for Figure 3G.
(a) Western blots were used to detect expression of FRQ in the indicated samples for Figure 3G. (b) Figure with the area highlighted was used to develop the Figure 3G for FRQ. (c) Western blots were used to detect expression of WC-1 in the indicated samples for Figure 3G. (d) Figure with the area highlighted was used to develop the Figure 3G for WC-1. (e) Western blots were used to detect expression of WC-2 in the indicated samples for Figure 3G. (f) Figure with the area highlighted was used to develop the Figure 3G for WC-2. (g) Ponceau S staining was used to detect loading control of the indicated samples for Figure 3G for FRQ. (h) Figure with the area highlighted was used as LCfor FRQ in Figure 3G. (i) Figure with the area highlighted was used as LC for WC-1 develop the Figure 3G for LC for WC-1. (j) Figure with the area highlighted was used to develop the Figure 3G for LC for WC-2.
- https://cdn.elifesciences.org/articles/79765/elife-79765-fig3-data5-v1.zip
Figure 4 with 7 supplements

WC-1 is required for adaptation to starvation in genome-wide scale.
(A) Distribution of number of genes showing starvation induced up- and downregulation in wt and ∆wc-1. Values on the y-axis of the bar graphs indicate the minimal and maximal fold-change of up- and downregulation, respectively. Venn-diagrams indicate the number of up- and downregulated genes in wt (red) and ∆wc-1(blue). (B) Distribution of genes expressed at lower and higher level in ∆wc-1 than in wt in standard or starvation medium. Values on the y-axis of the bar graphs indicate the minimal and maximal ratios of RNA levels (∆wc-1/wt). Venn-diagrams indicate the number of genes showing different expression in the two strains in the indicated medium (red: standard medium, blue: starvation). (C) Number of genes showing strain-specific changes in major metabolic functions in response to a 40 hr glucose deprivation. Positive and negative values indicate number of genes with increased and decreased RNA levels, respectively. Genes were classified by GO analysis (Mi et al., 2013). (D) Number of genes showing treatment-specific (2% vs 0.01% glucose) changes in their ∆wc-1/wt RNA ratio. Positive and negative values indicate number of genes with increased and decreased RNA ratio, respectively. Genes involved in major metabolic functions were classified by GO analysis (Mi et al., 2013).
-
Figure 4—source data 1
Genes, that changed in a strain-specific manner in response to glucose starvation and are direct targets of the WCC.
- https://cdn.elifesciences.org/articles/79765/elife-79765-fig4-data1-v1.docx
-
Figure 4—source data 2
Gene Ontology (GO) enrichment analysis of genes showing at least two-fold significant alteration in their amount in response to starvation.
Significantly enriched functions are shown. Yellow highlight: wt-specific changes, red highlight: Δwc-1-specific changes.
- https://cdn.elifesciences.org/articles/79765/elife-79765-fig4-data2-v1.xlsx
-
Figure 4—source data 3
Gene Ontology (GO) enrichment analysis of genes showing strain-specific response to starvation.
Significantly enriched functions are shown. GO enrichment analysis was performed on data obtained by the analysis shown in Figure 4—figure supplement 1, that is on genes showing exclusive or significantly higher change in their expression rate in one of the strains. (FDR: false discovery rate).
- https://cdn.elifesciences.org/articles/79765/elife-79765-fig4-data3-v1.docx
-
Figure 4—source data 4
Genes of central carbon metabolism, amino acid biosynthesis and fatty acid metabolism, that showed strain-specific expression change to starvation.
Genes were selected with the help of the KEGG Mapper tool. Numbering of genes in Figure 4—figure supplements 4–6 can be found in the last column. Genes, that are direct targets of WCC are marked with bold typesetting.
- https://cdn.elifesciences.org/articles/79765/elife-79765-fig4-data4-v1.docx
-
Figure 4—source data 5
Comparison of the results from RNA-seq and the experimental validation of the chosen genes with qPCR.
Experimental procedures were performed as described in Figure 4—figure supplement 7. (n=4, two sample t-test).
- https://cdn.elifesciences.org/articles/79765/elife-79765-fig4-data5-v1.docx
Figure 4—figure supplement 1
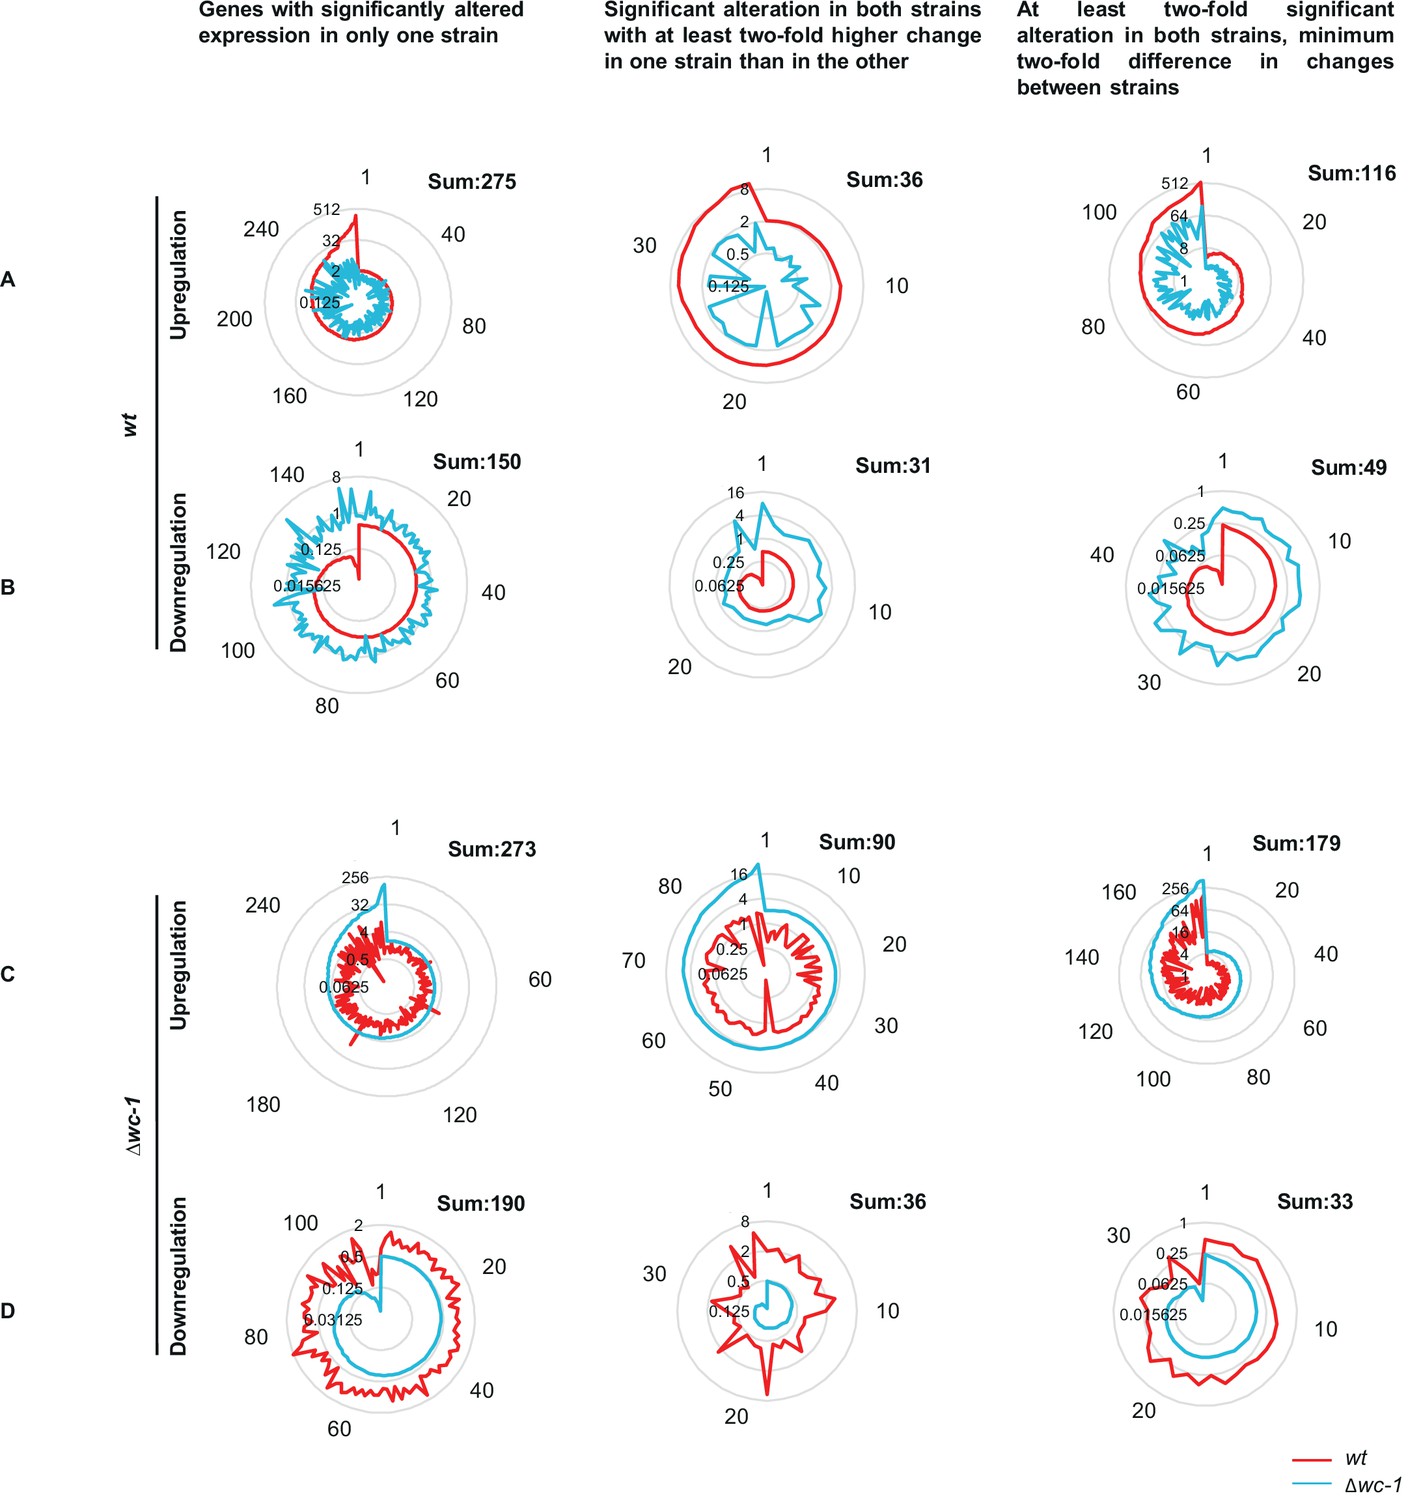
Strain-specific differences of gene expression changes in response to starvation.
Concentric circles indicate the fold-change, numbers around the diagram indicate the genes ordered according to the extent of up/downregulation. (A) Genes showing wt-specific increase in their RNA levels in response to starvation. (B) Genes showing wt-specific decrease in their RNA levels in response to starvation. (C) Genes showing Δwc-1-specific increase in their RNA levels in response to starvation. (D) Genes showing Δwc-1-specific decrease in their RNA levels in response to starvation.
Figure 4—figure supplement 2
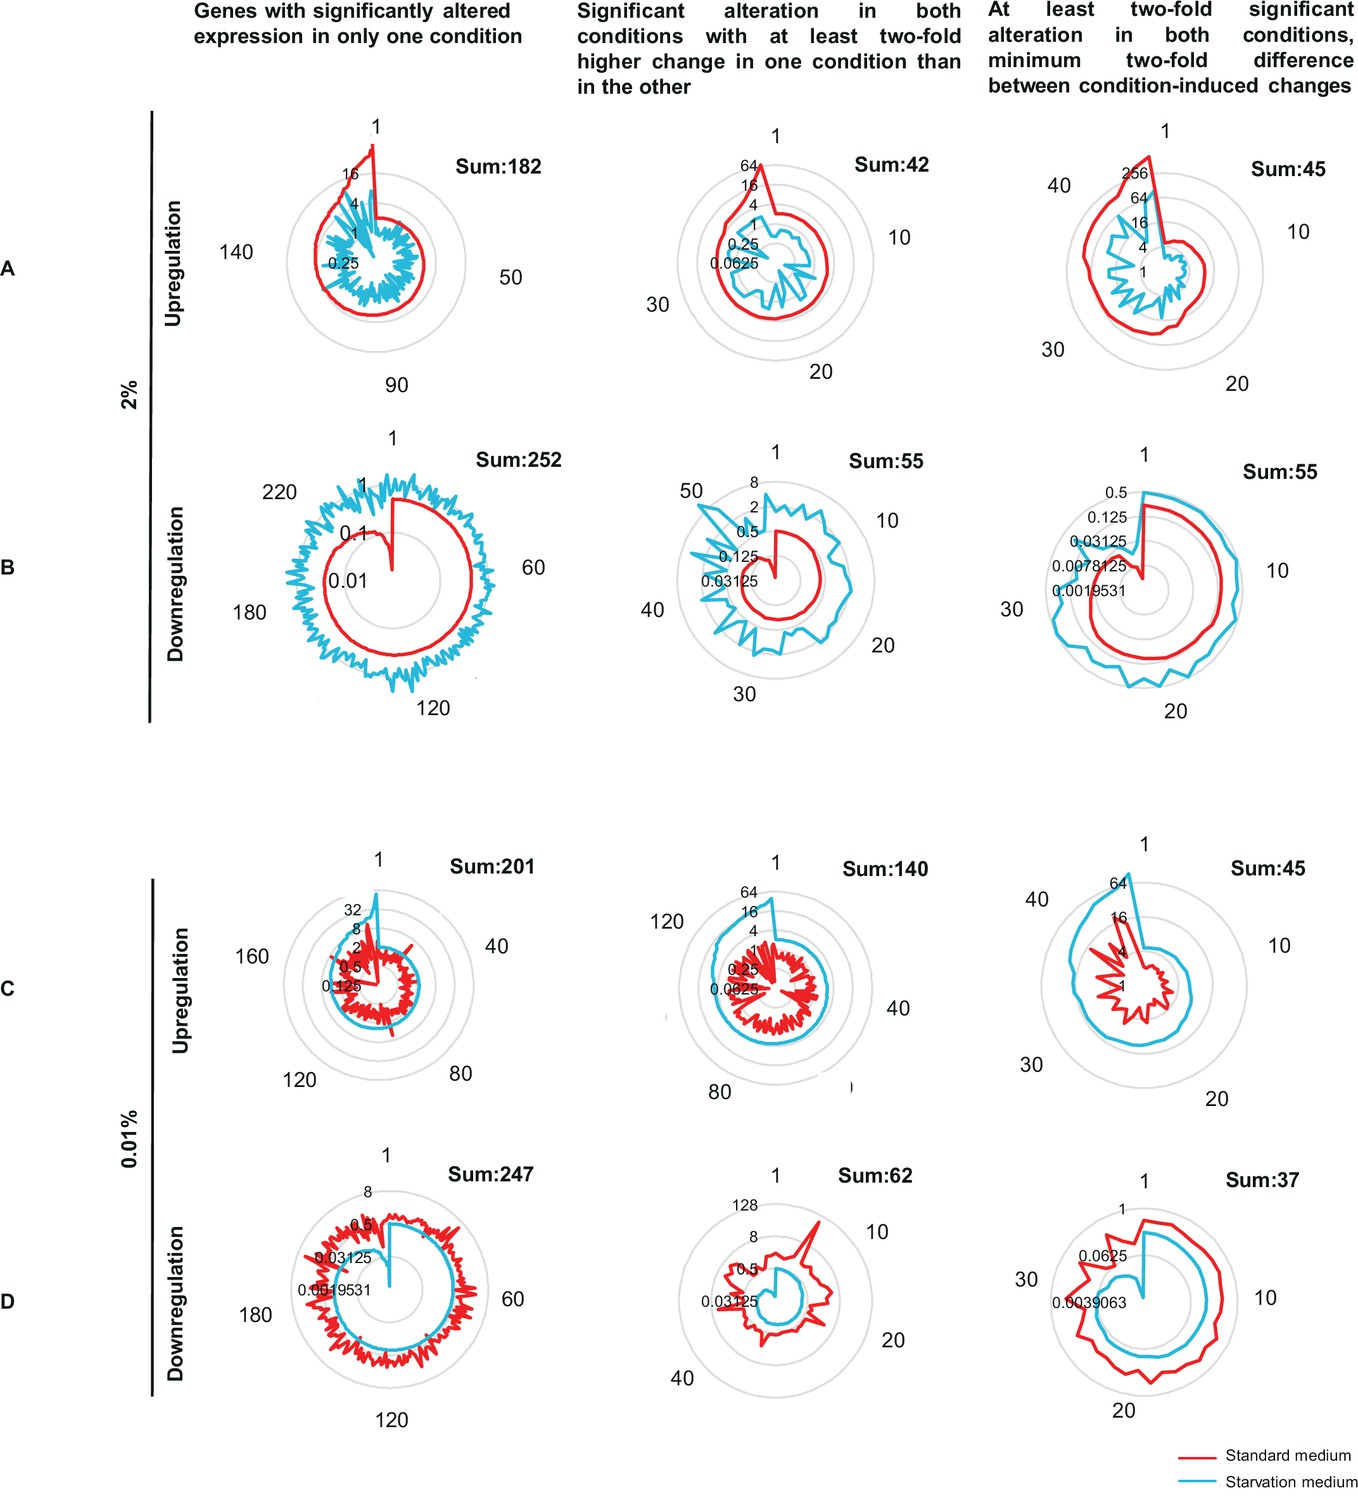
Glucose-specific differences in Δwc-1/wt ratio of gene expression.
Concentric circles indicate the fold-change, numbers around the diagram indicate the genes ordered according to the extent of up/downregulation. (A) Genes showing glucose-specific (2%) increase in their Δwc-1/wt ratio. (B) Genes showing glucose-specific decrease in their Δwc-1/wt ratio. (C) Genes showing starvation-specific (0.01%) increase in their Δwc-1/wt ratio. (D) Genes showing starvation-specific (0.01%) decrease in their Δwc-1/wt ratio.
Figure 4—figure supplement 3
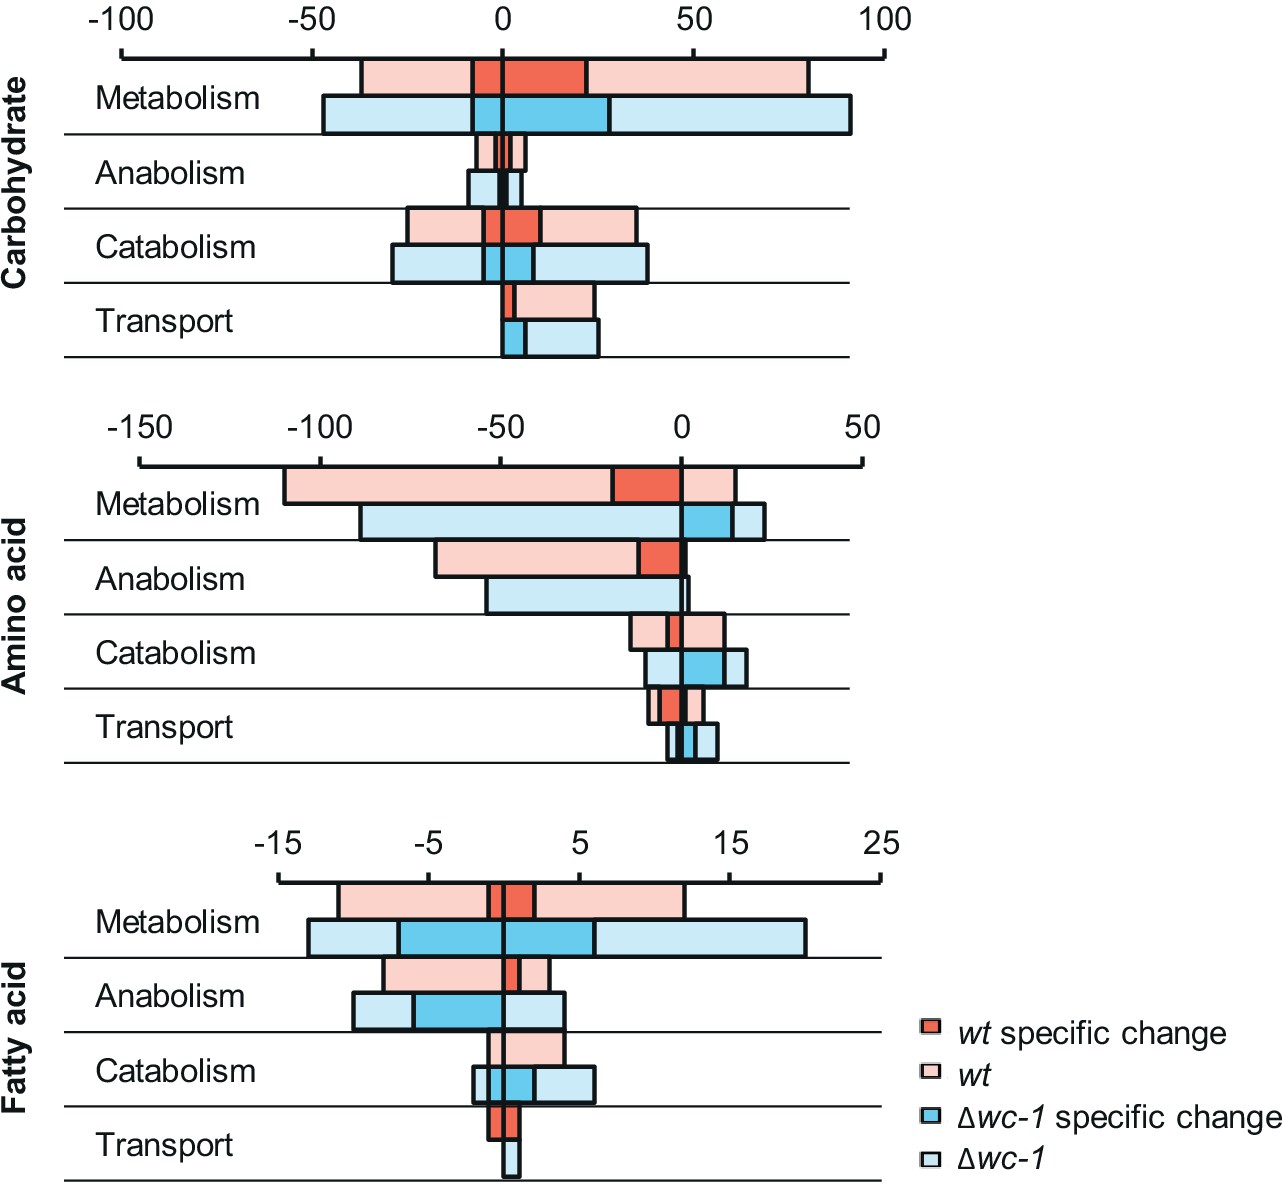
Characterization of different metabolic pathways in strain-specific responses to glucose starvation.
Expression changes of genes involved in amino acid, carbohydrate and fatty acid metabolism in response to 40 hr glucose starvation. Positive values show number of genes with increased, while negative values indicate number of genes with decreased RNA levels. Number of genes showing strain-specific changes in wt or ∆wc-1 are marked with darker red and blue color, respectively. Genes were classified by GO analysis (Mi et al., 2013).
Figure 4—figure supplement 4
Genes of central carbon metabolism, that showed strain-specific change to starvation.
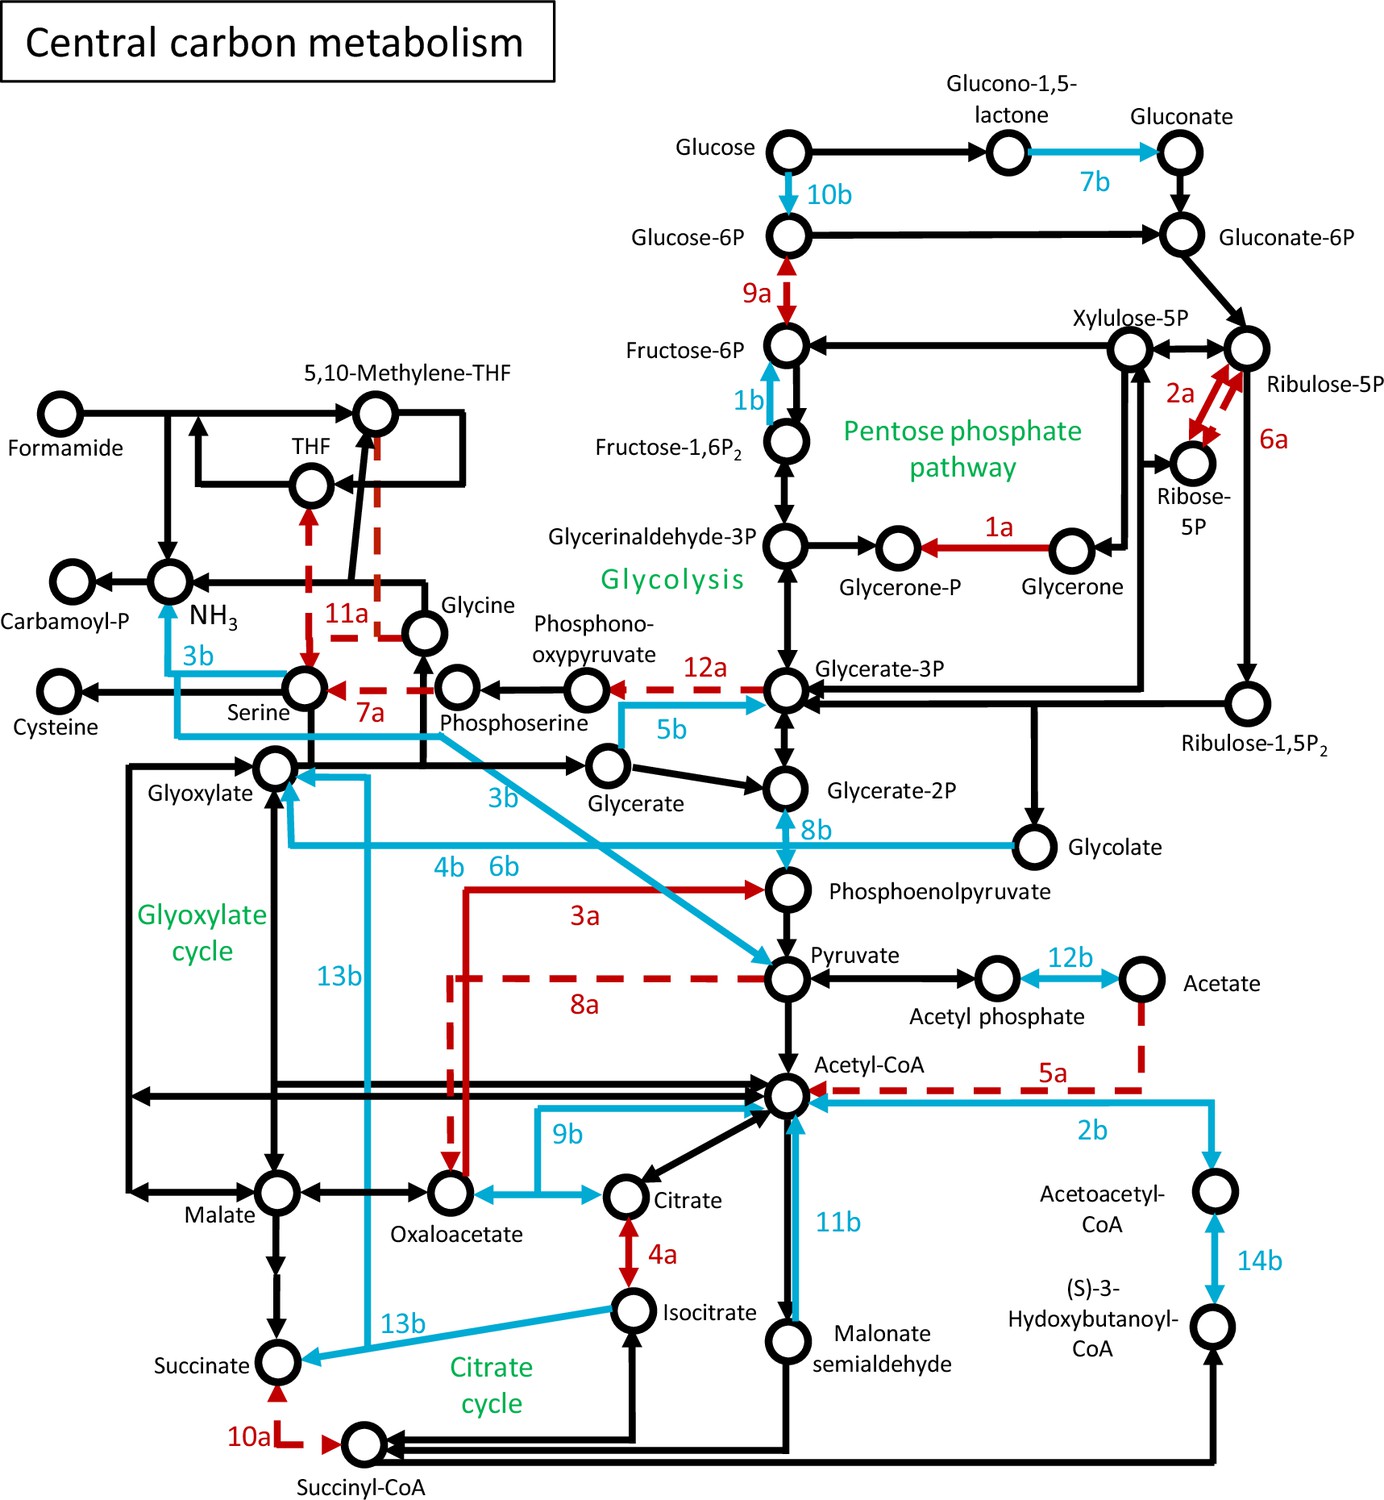
Network of genes were constructed based on the KEGG Mapper tool. Numbering of genes is resolved in Figure 4—source data 4. Red arrow: wt-specific change; Blue arrow: ∆wc-1-specific change; Solid line: significant increase; Dashed line: significant decrease.
Figure 4—figure supplement 5
Genes of amino acid biosynthesis, that showed strain-specific change to starvation.
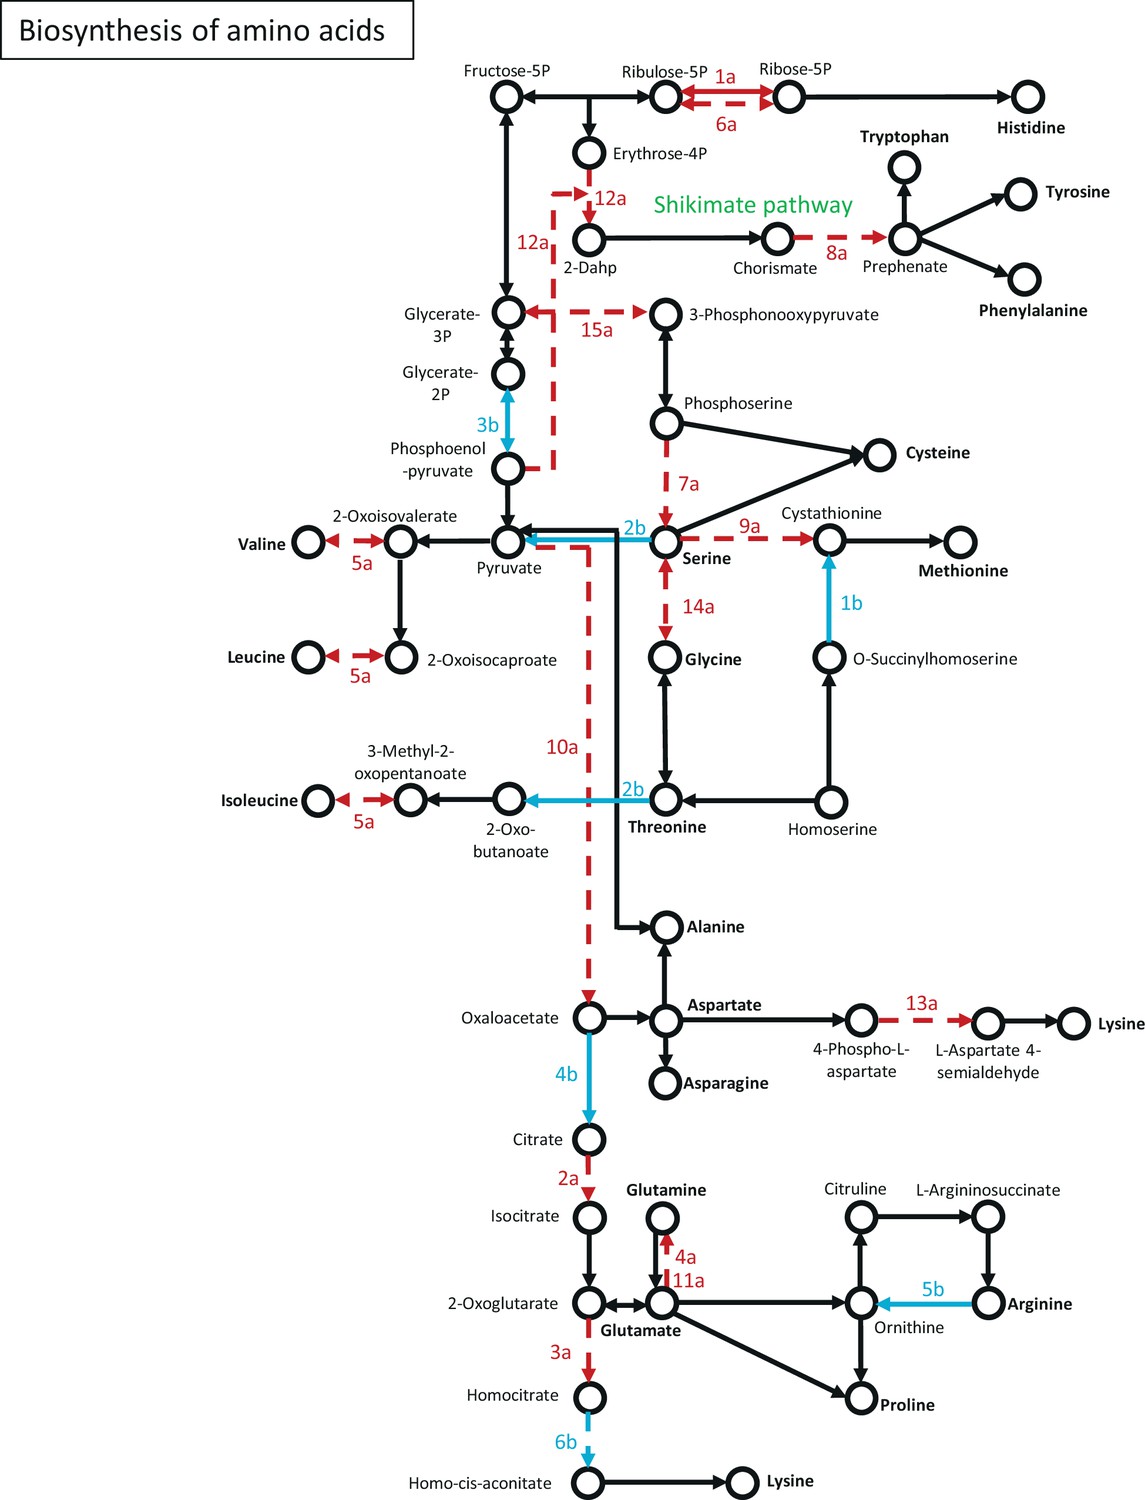
Network of genes were constructed based on the KEGG Mapper tool. Numbering of genes is resolved in Figure 4—source data 4. Red arrow: wt-specific change; Blue arrow: ∆wc-1-specific change; Solid line: significant increase; Dashed line: significant decrease.
Figure 4—figure supplement 6
Genes of fatty acid metabolism, that showed strain-specific change to starvation.
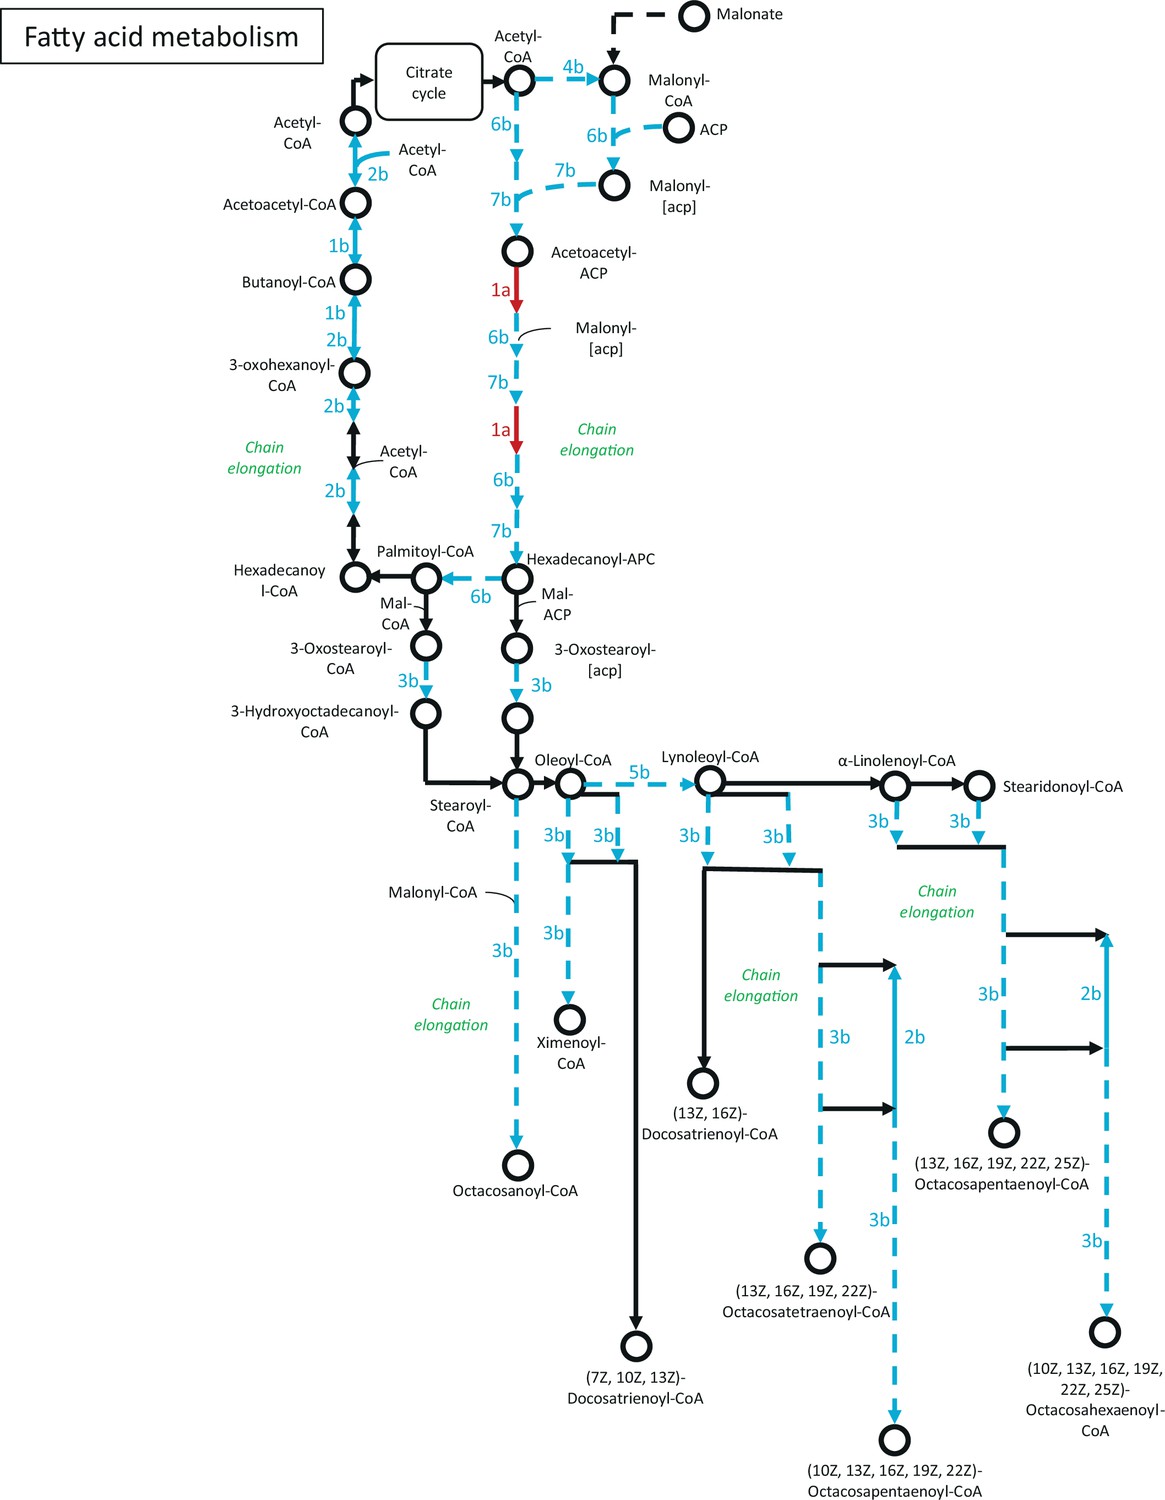
Network of genes were constructed based on the KEGG Mapper tool. Numbering of genes is resolved in Figure 4—source data 4. Red arrow: wt-specific change; Blue arrow: ∆wc-1-specific change; Solid line: significant increase; Dashed line: significant decrease.
Figure 4—figure supplement 7
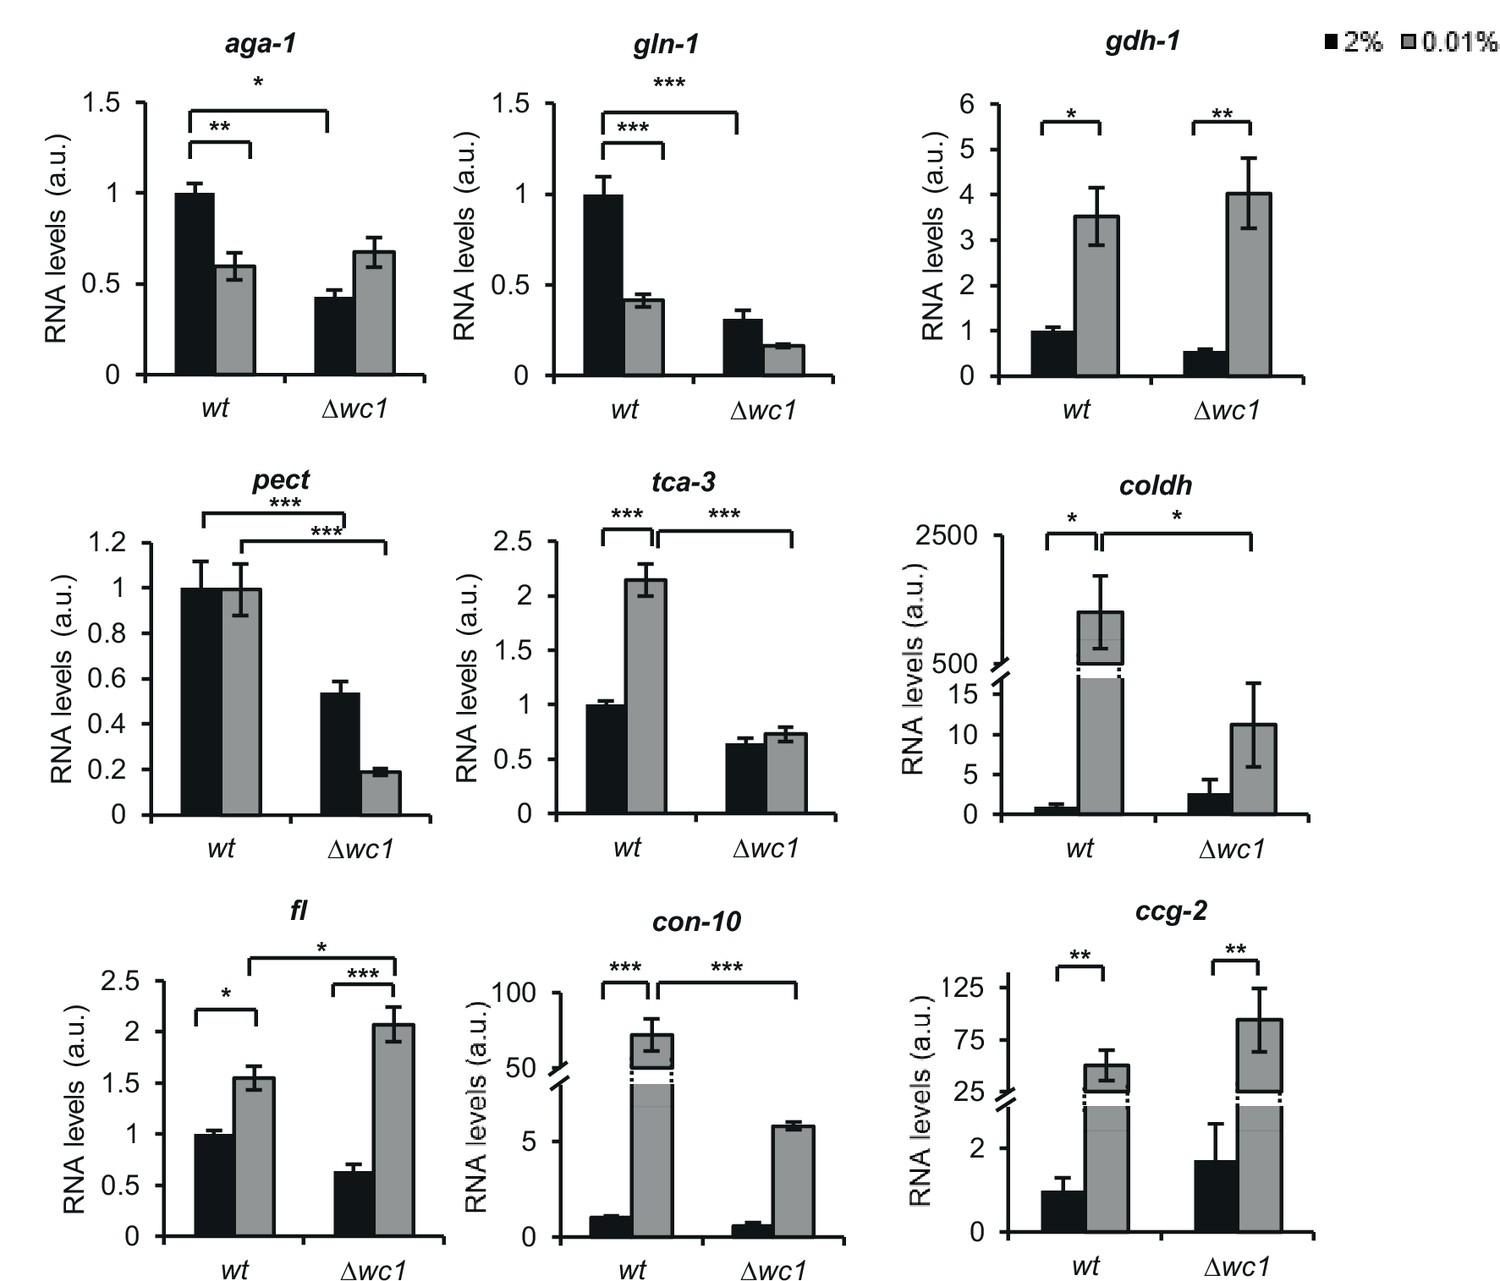
qPCR validation of the RNA-seq data.
Three groups of processes (amino acid metabolism, carbohydrate metabolism and conidiation) that were hypothesized to change in response to glucose deprivation were tested. Values were normalized to those measured in wt grown in standard medium. (aga-1: arginase (NCU02333); gln-1: glutamine synthetase (NCU06724); gdh-1: NAD-specific glutamate dehydrogenase (NCU00461); pect: pectin esterase (NCU10045); tca-3: aconitate hydratase, mitochondrial (NCU02366); choldh: choline dehydrogenase (NCU01853); fl: conidial development protein fluffy (NCU08726); con-10: conidiation-specific protein 10 (NCU07325); ccg-2: hydrophobin (NCU08457)) (n=4, ± SEM, Factorial ANOVA, significant treatment effect (gdh-1, ccg2), significant strain effect (pect) significant strain*treatment interaction (aga-1, gln-1, tca-3, coldh, fl, con-10)).
Figure 5 with 1 supplement
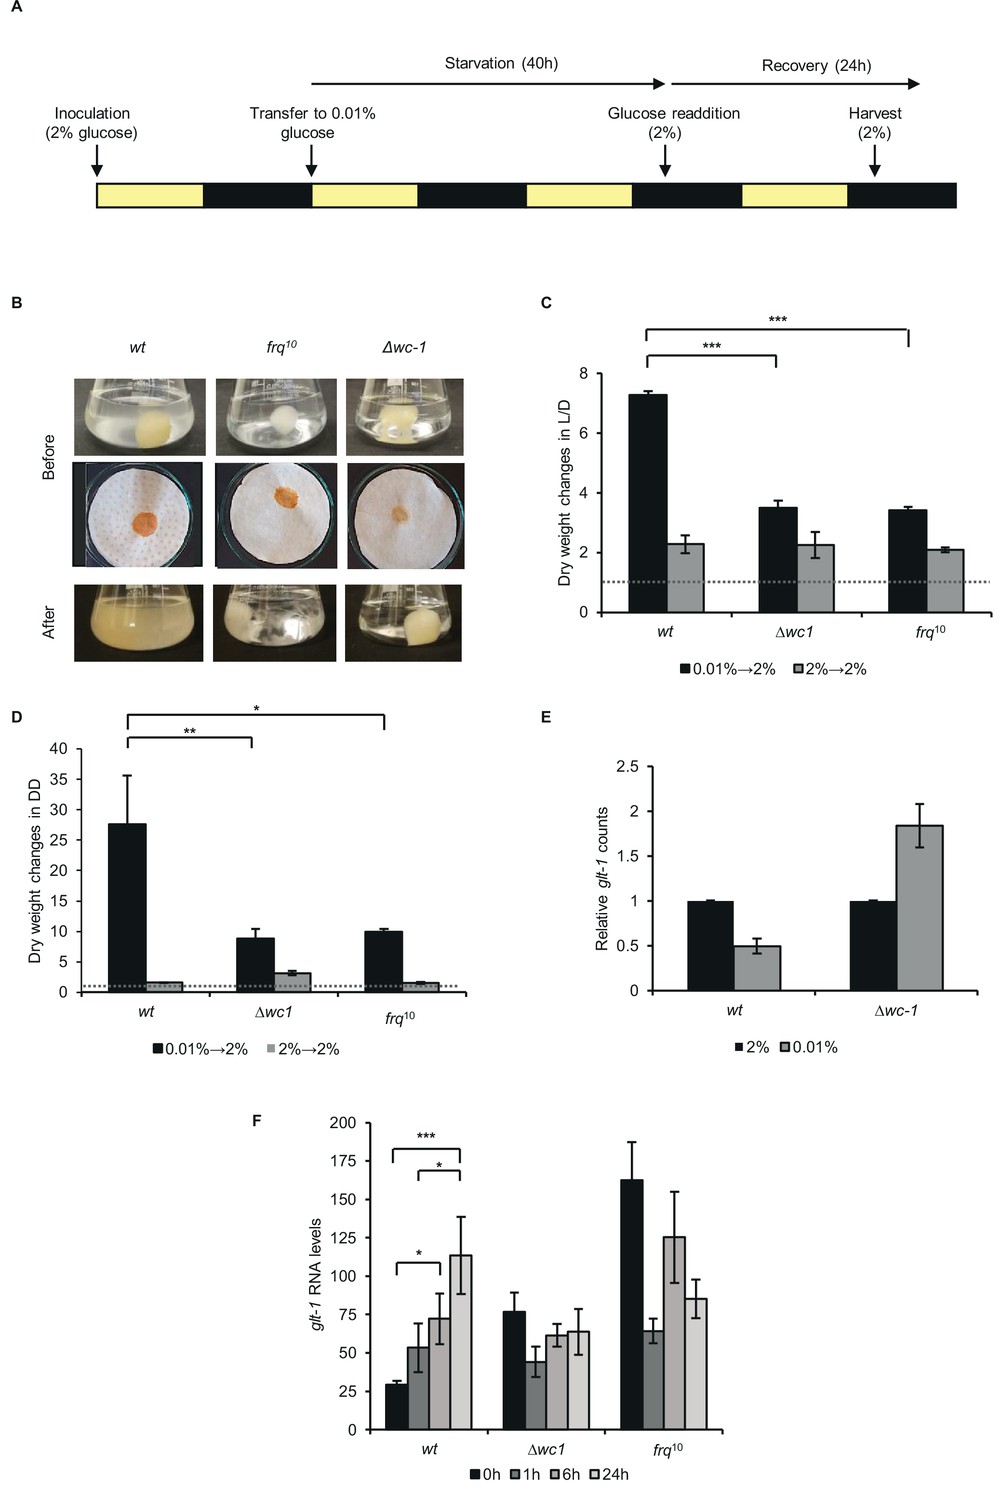
Proper recovery from starvation requires a functional clock.
(A) Schematic design of the experiment. Mycelial discs of the wt and the clock mutant strains were incubated in standard liquid medium in L/D12. After 24 hr mycelial balls were transferred to starvation medium. Following 40 hr of starvation, glucose was added to the medium. Yellow and black bars indicate the periods cultures spent in light and darkness, respectively. (B) Comparison of the growth of wt and clock mutants after glucose resupply. Pictures of the liquid (Before: upper images) and the vacuum filtered cultures (Before: lower images) were taken after 40 hr of starvation and 24 hr after glucose resupply (After). (C) wt grows faster after glucose supplementation than clock mutants in L/D. Experimental procedures were performed as described in (A). Dry weight of cultures was measured after 24 hr of glucose resupply. Values were normalised to the dry weight measured before glucose resupply (indicated with dashed line). (n=4, ± SEM, Factorial ANOVA, significant strain*treatment interaction, post hoc analysis: Tukey HSD test). (D) wt grows faster after glucose supplementation than clock mutants in DD. Experimental procedures were performed as described in (A) except the light conditions: after 24 hr in LL, cultures were incubated in DD. Values were normalised to the dry weight measured before glucose resupply (indicated with dashed line). (n=3, ± SEM, Factorial ANOVA, significant strain*treatment interaction, post hoc analysis: Fisher LSD test). (E) Lack of wc-1 affects the proper glucose transporter expression in response to starvation. glt-1 counts in RNAseq data. Values were normalized to that of cultures grown in 2% glucose. (F) Lack of the functional clock affects the proper alignment of glucose transporter expression to glucose levels. Experiments were performed as described in (A). Samples were harvested at the indicated time points following glucose readdition and relative levels of glt-1 RNA were determined by qPCR. (n=3, ± SEM, Factorial ANOVA, significant strain*treatment interaction, post hoc analysis: Tukey HSD test).
Figure 5—figure supplement 1
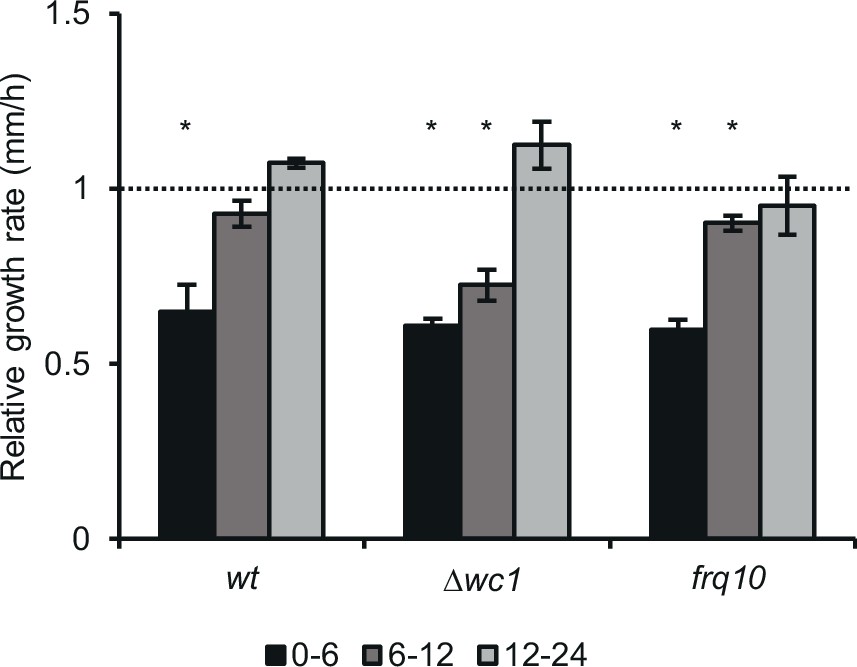
Growth rate of wt recovers faster, than that of ∆wc-1 and frq10 on solid medium.
Experiments were performed as described in Figure 5A. Race tubes containing 2% of glucose were inoculated with starved and normal mycelia from the liquid cultures and growth rate was determined in three intervals (0–6 hr, 6–12 hr, 12–24 hr) during the first day following inoculation. Growth rate of the samples originated from starved cultures was normalized to those of the non-starved samples (indicated with dashed line) of the same strain during the same period. (n=12, ± SEM, two-sample t-test).
Figure 6
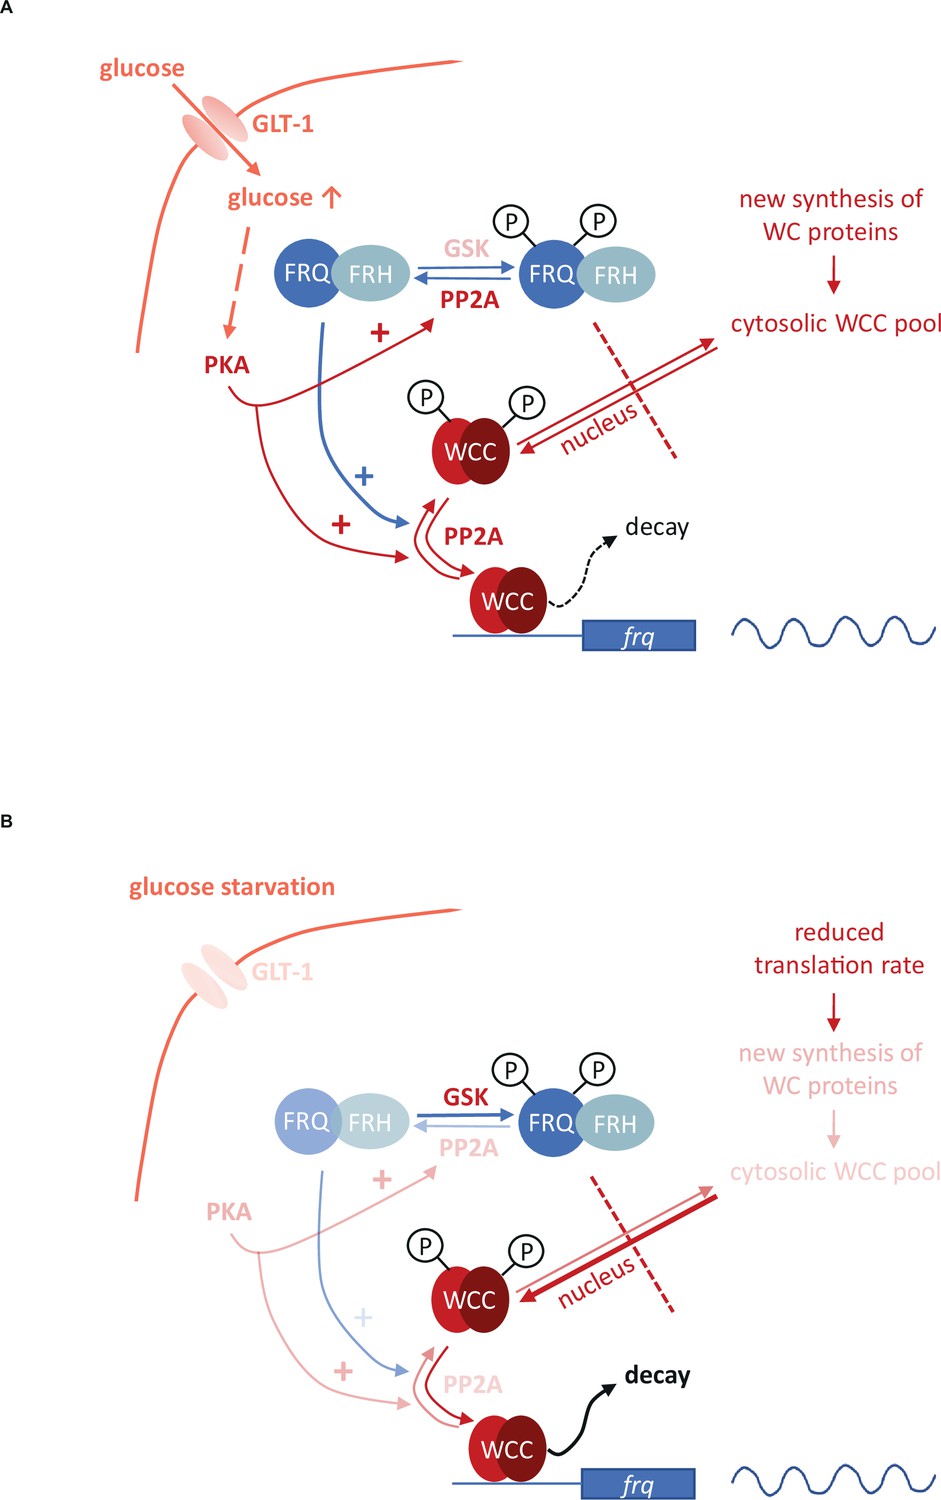
Model representing the role of the negative feedback and the PKA-, PP2A- and GSK-mediated signaling in the control of the molecular clock at high glucose levels (A) and under starvation (B).
Starvation reduces the activity of both PKA and PP2A but stimulates GSK. PKA can act as a central regulator of the starvation-induced modifications of the clock components, as its weakened activity results in enhanced action and the consequent destabilization of the WCC, resulting in compensated frq transcription at significantly reduced WC levels. PKA also affects PP2A. Reduced activity of PP2A and the parallel induction of GSK in starvation can lead to hyperphosphorylation of FRQ which in turn lessens the negative feedback on the WCC. Higher and lower activities of enzymes and processes are indicated by more and less intense colors, respectively.
Author response image 1
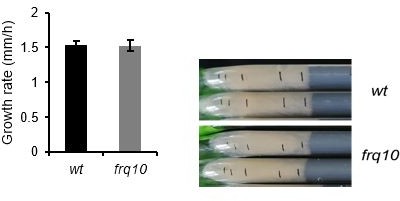
Growth rate on race tubes containing 2% glucose.
Cultures were incubated in 2% liquid medium before the inoculation to race tubes. (n=15; n.s.).
Tables
Table 1
The first 15 most upregulated annotated genes in wt during glucose starvation.
For experimental procedures of the RNA-seq analysis see Materials and Methods section. Genes with more pronounced upregulation in wt compared to Δwc-1 are bold-lettered.
| ID | Name | Upregulation in wt(fold change) | Upregulation in ∆wc-1(fold change) | wt/∆wc-1 (2%) | Gene product |
|---|---|---|---|---|---|
| NCU02500 | ccg-4 | 281 | n.s. | n.s. | clock-controlled pheromone |
| NCU07225 | gh11-2 | 254 | 163 | n.s. | xylanase |
| NCU08769 | con-6 | 117 | 88 | n.s. | conidiation specific protein |
| NCU05924 | gh10-1 | 96 | 15 | n.s. | xylanase |
| NCU00943 | tre-1 | 77 | 102 | n.s. | trehalase |
| NCU07325 | con-10 | 70 | 13 | n.s. | conidiation specific protein |
| NCU08189 | gh10-2 | 67 | 13 | n.s. | xylanase |
| NCU10055 | nop-1 | 66 | 58 | n.s. | opsin |
| NCU06905 | thnr | 65 | n.s. | 0.01 | tetrahydroxynaphthalene reductase |
| NCU08457 | eas | 49 | 73 | n.s. | hydrophobin |
| NCU09873 | acu-6 | 39 | 12 | 2.9 | phosphoenolpyruvate carboxykinase |
| NCU10021 | hgt-1 | 35 | 56 | 1.4 | monosacharide transporter |
| NCU08755 | gh3-3 | 28 | 38 | n.s. | beta-glucosidase |
| NCU00762 | gh5-1 | 21 | n.s. | n.s. | endoglucanase |
| NCU08114 | cdt-2 | 21 | 11 | n.s. | hexose transporter |
Key resources table
| Reagent type (species) or resource | Designation | Source or reference | Identifiers | Additional information |
|---|---|---|---|---|
| Strain, strain background (Neurospora crassa) | wt | Fungal Genetics Stock Center | #2489 | |
| Strain, strain background (Neurospora crassa) | wt,bd | Fungal Genetics Stock Center | #1858 | |
| Strain, strain background (Neurospora crassa) | bd;frq10 | Fungal Genetics Stock Center | #7490 | |
| Strain, strain background (Neurospora crassa) | bd;frq9 | Fungal Genetics Stock Center | #7779 | |
| Strain, strain background (Neurospora crassa) | rgb-1 | Fungal Genetics Stock Center | #8380 | |
| Strain, strain background (Neurospora crassa) | mcb | Fungal Genetics Stock Center | #7094 | |
| Strain, strain background (Neurospora crassa) | bd; ∆wc1 | https://doi.org/10.1093/emboj/20.3.307 https://doi.org/10.1093%2Femboj%2F18.18.4961 | ||
| Strain, strain background (Neurospora crassa) | bd;frq10, his-3 | https://doi.org/10.1128%2Fmcb.16.2.513 | ||
| Strain, strain background (Neurospora crassa) | frq10 ∆fcd1-2 | This paper | See Materials and Methods. | |
| Strain, strain background (Neurospora crassa) | qa-gsk | https://doi.org/10.1074%2Fjbc.M112.396622 | ||
| Strain, strain background (Escherichia coli) | ∆H5-α | New England Biolabs | ||
| Antibody | α-FRQ (mouse monoclonal) | https://doi.org/10.1093/emboj/20.24.7074 | WB (1:5000) | |
| Antibody | α-WC1 (rabbit polyclonal) | https://doi.org/10.1101%2Fgad.360906 | WB (1:10000) | |
| Antibody | α-WC2 (rabbit polyclonal) | https://doi.org/10.1038%2Fembor.2008.113 | WB (1:10000) | |
| Antibody | Goat- α-mouse IgG (H/L): HRP, polyclonal | Bio-Rad | Cat#1706516 | WB (1:5000) |
| Antibody | Goat α-rabbit IgG (H/L): HRP, polyclonal | Bio-Rad | Cat#1706515 | WB (1:5000) |
| Recombinant DNA reagent | pBM60-ClaI-∆FCD1-2 (plasmid) | https://doi.org/10.1016/j.molcel.2011.06.033 | ||
| Sequence-based reagent | frq F | https://doi.org/10.1093/emboj/20.24.7074 | qPCR primer | TTGTAAT GAAAGGT GTCCGAA GGT |
| Sequence-based reagent | frq F | https://doi.org/10.1093/emboj/20.24.7074 | qPCR primer | GGAGGAA GAAGCGG AAAACA |
| Sequence-based reagent | frq probe | https://doi.org/10.1093/emboj/20.24.7074 | qPCR primer | [6-FAM] AC CTCCCAAT CTCCGAAC TCGCCTG [TAMRA] |
| Sequence-based reagent | wc-1 F | https://doi.org/10.1101%2Fgad.360906 | qPCR primer | ACCTCGCT GTCCTCGA TTTG |
| Sequence-based reagent | wc-1 R | https://doi.org/10.1101%2Fgad.360906 | qPCR primer | TGCTGGGC CTCTTTCAA CTC |
| Sequence-based reagent | wc-1 probe | https://doi.org/10.1101%2Fgad.360906 | qPCR primer | [6-FAM] CC GTCCGAC ATCGTGC CGG [TAMRA] |
| Sequence-based reagent | wc-2 F | https://doi.org/10.1038%2Fembor.2008.113 | qPCR primer | AGTTTGCA CCCAATCC AGAGA |
| Sequence-based reagent | wc-2 R | https://doi.org/10.1038%2Fembor.2008.113 | qPCR primer | AGGGTCG AAGCCAT CATGAAC |
| Sequence-based reagent | wc-2 probe | https://doi.org/10.1038%2Fembor.2008.113 | qPCR primer | [6-FAM] AG TCGCCTTT CTGCCAG [TAMRA] |
| Sequence-based reagent | ccg-2 F | This paper | qPCR primer | GCTGCGT TGTCGGT GTCAT |
| Sequence-based reagent | ccg-2 R | This paper | qPCR primer | GGAGTTG CCGGTGT TGGTAA |
| Sequence-based reagent | ccg-2 probe | This paper | qPCR primer | [6-FAM] AA TGTGGTG CCAGCGT CAAGTGC TG [TAMRA] |
| Sequence-based reagent | al-2 F | https://doi.org/10.1016/j.cell.2010.08.010 | qPCR primer | ACCTGGC CAATTCG CTCTTT |
| Sequence-based reagent | al-2 R | https://doi.org/10.1016/j.cell.2010.08.010 | qPCR primer | GACAGAA GGAGTAC AGCAGGA TCA |
| Sequence-based reagent | al-2 probe | https://doi.org/10.1016/j.cell.2010.08.010 | qPCR primer | [6-FAM] CT GGTCGAC TCCGCAT T [TAMRA] |
| Sequence-based reagent | act F | https://doi.org/10.1101%2Fgad.360906 | qPCR primer | AATGGGT CGGGTAT GTGCAA |
| Sequence-based reagent | act R | https://doi.org/10.1101%2Fgad.360906 | qPCR primer | CTTCTGG CCCATAC CGATCA |
| Sequence-based reagent | act probe | https://doi.org/10.1101%2Fgad.360906 | qPCR primer | [6-FAM] CA GAGCTGT TTTCCCT TCCATCG TTGGT [TAMRA] |
| Sequence-based reagent | gna-3 F | This paper | qPCR primer | ATATCCT CACTTGA CACAAGC C |
| Sequence-based reagent | gna-3 R | This paper | qPCR primer | CGGAGTC TTTAAGG GCGTTAT T |
| Sequence-based reagent | gna-3 probe | This paper | qPCR primer | [6-FAM] TC CAACATC CGTCTCG TGTTTGC T [TAMRA] |
| Sequence-based reagent | tfc-1 F | This paper | qPCR primer | CGATTTG ATCCCTC CTCCTAA C |
| Sequence-based reagent | tfc-1 R | This paper | qPCR primer | GGGCTGA TTTCCTT GGTGTA |
| Sequence-based reagent | tfc-1 probe | This paper | qPCR primer | [6-FAM] AT GAGCTTG CCCTTCC AATACGG T[TAMRA] |
| Sequence-based reagent | sarA F | This paper | qPCR primer | TGGTTGT GGTCTTG GTTCTAC |
| Sequence-based reagent | sarA R | This paper | qPCR primer | TGGCAAC GCGATCA TTCT |
| Sequence-based reagent | sarA probe | This paper | qPCR primer | [6-FAM] AT ATCCTTT CCAACCT CGGCCTG C[TAMRA] |
| Sequence-based reagent | aga-1 F | This paper | qPCR primer | CAGTGTC AAGAAGC TGGTCTA C |
| Sequence-based reagent | aga-1 R | This paper | qPCR primer | TGCCGTG CTTGTCA ATGT |
| Sequence-based reagent | gln-1 F | This paper | qPCR primer | GCAACAC GTCCTCA CTACTT |
| Sequence-based reagent | gln-1 R | This paper | qPCR primer | GATTGTT GATTCTG ACGCCAT TT |
| Sequence-based reagent | gdh-1 F | This paper | qPCR primer | AGAGCAG ATGAAGC AAGTCAA G |
| Sequence-based reagent | gdh-1 R | This paper | qPCR primer | CGTCGAT GCCAAGC TCATTAT |
| Sequence-based reagent | con-10 F | This paper | qPCR primer | CTGGCAC TGGTAAC GACAA |
| Sequence-based reagent | con-10 R | This paper | qPCR primer | GCAATTT CGCGCTG TTTCT |
| Sequence-based reagent | flf F | This paper | qPCR primer | GGCAGCG ATAACTC GTGAA |
| Sequence-based reagent | flf R | This paper | qPCR primer | AAGAAGG CGTAGCA TGTGAA |
| Sequence-based reagent | pect F | This paper | qPCR primer | CTTGGGT ATATCAC CGCCTTG |
| Sequence-based reagent | pect R | This paper | qPCR primer | CTCCCGA AGGCACA TTGTTA |
| Commercial assay or kit | QuantiTect Reverse Transcription Kit | QIAGEN | Cat#205314 | |
| Commercial assay or kit | Ser/Thr Phosphatase Assay System | Promega | Cat#V2460 | |
| Commercial assay or kit | LightCycler 480 Probes Master | Roche | Cat#048873 01001 | |
| Chemical compound, drug | TriReagent | Sigma-Aldrich | Cat#93289 | |
| Software, algorithm | Statistica 13 | Statsoft Inc, Tulsa, OK, USA | ||
| Software, algorithm | ImageJ | https://doi.org/10.1038/nmeth.2089 | ||
| Other | RNA sequencing data | doi:10.5061/dryad.t4b8gtj4p | See RNA sequencing and data analysis in Material and Methods |
Additional files
Download links
A two-part list of links to download the article, or parts of the article, in various formats.
Downloads (link to download the article as PDF)
Open citations (links to open the citations from this article in various online reference manager services)
Cite this article (links to download the citations from this article in formats compatible with various reference manager tools)
Adaptation to glucose starvation is associated with molecular reorganization of the circadian clock in Neurospora crassa
eLife 12:e79765.
https://doi.org/10.7554/eLife.79765


