Senescent preosteoclast secretome promotes metabolic syndrome associated osteoarthritis through cyclooxygenase 2
- Department of Orthopaedic Surgery, Russell H. Morgan Department of Radiology and Radiological Science, The Johns Hopkins University School of Medicine, United States
- Department of Orthopaedic Surgery, The Third Xiangya Hospital of Central South University, China
- Division of Orthopaedics & Traumatology, Department of Orthopaedics, Southern Medical University Nanfang Hospital, China
- Musculoskeletal Radiology, Russell H. Morgan Department of Radiology and Radiological Science, The Johns Hopkins University School of Medicine, United States
- University of Southern California, Dornsife College of Letters, Arts and Sciences, United States
- Department of Radiology, Boston University School of Medicine, United States
- Johns Hopkins Asthma & Allergy Center, Johns Hopkins University School of Medicine, United States
Figures
Figure 1 with 4 supplements
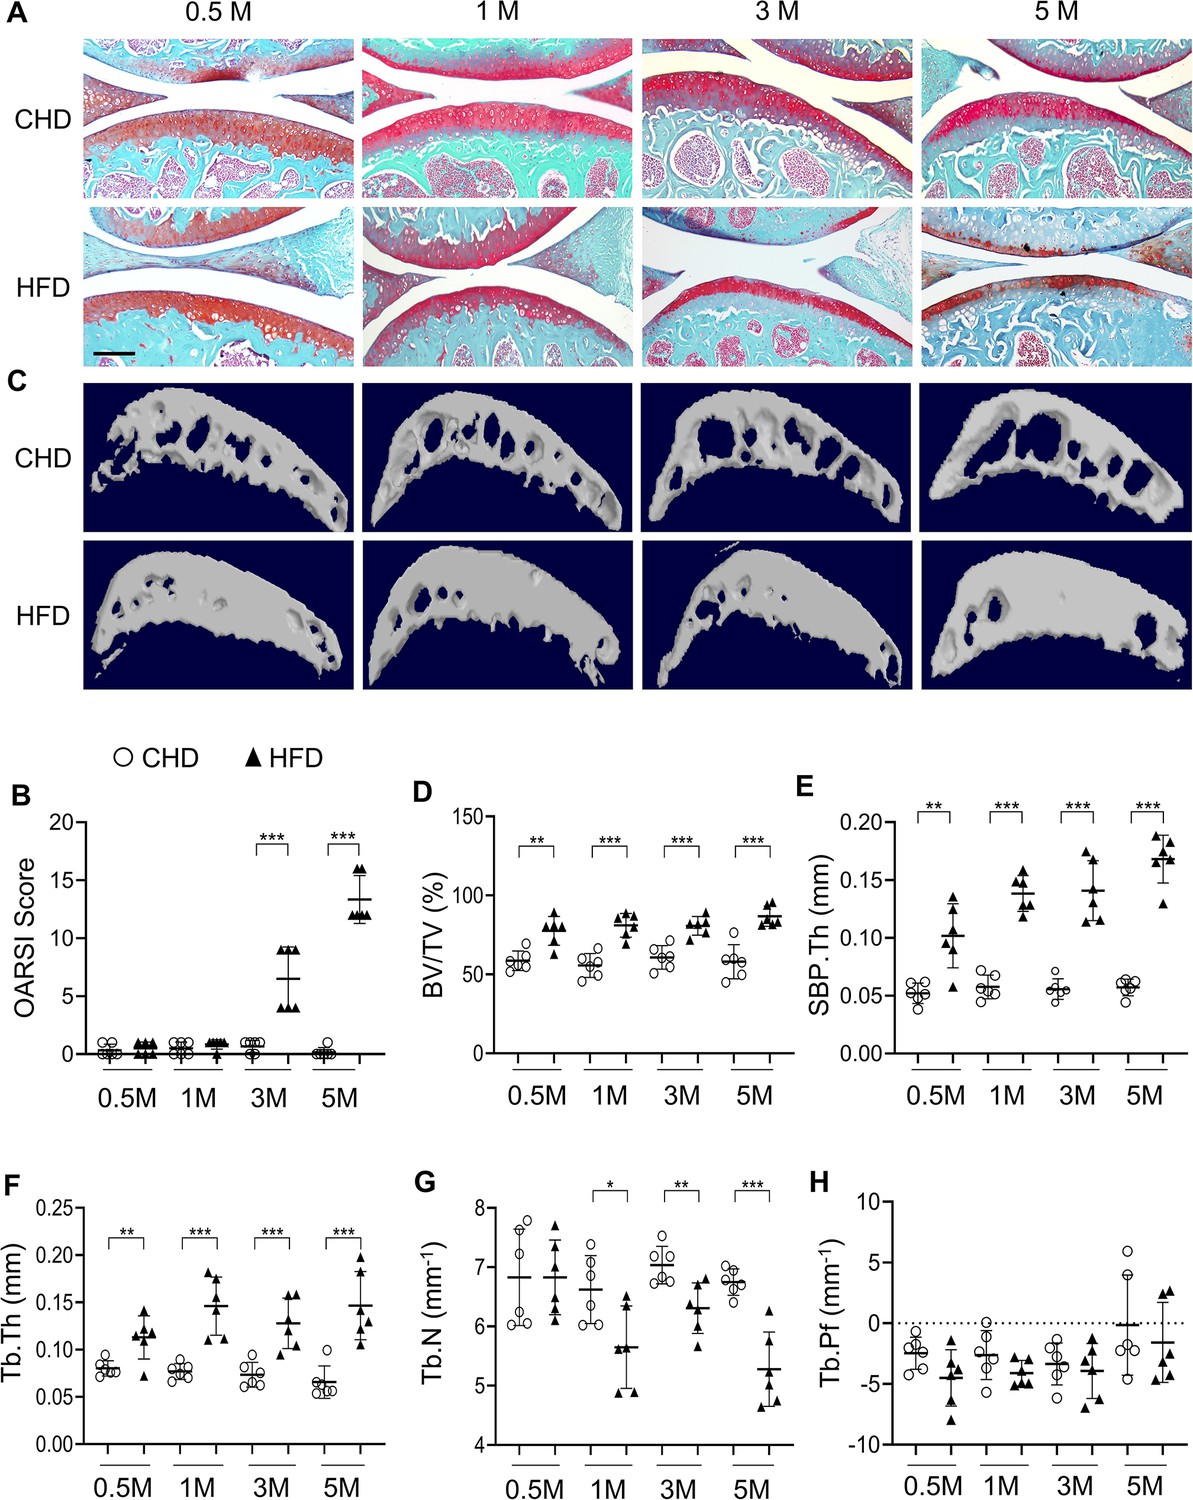
High-fat-diet (HFD) challenge leads to rapid subchondral bone thickening before cartilage damage occurs.
Three-month-old C57BL/6 mice were fed a standard chow-food diet (CHD) or HFD for 0.5, 1, 3, or 5 months. n=6 mice per group. (A) Safranin O-fast green staining of the tibia subchondral bone medial compartment (sagittal view). Scale bar, 200 μm. (B) Calculation of Osteoarthritis Research Society International (OARSI) scores. (C–H) Three-dimensional micro-computed tomography (μCT) images (C) and quantitative analysis of structural parameters of knee joint subchondral bone: bone volume/tissue volume (BV/TV, %) (D), subchondral bone plate thickness (SBP. Th, mm) (E), trabecular thickness (Tb.Th, mm) (F), trabecular number (Tb.N, mm–1) (G), and trabecular pattern factor (Tb. Pf, mm–1) (H). All data are shown as means ± standard deviations. *p<0.05, **p<0.01, and ***p<0.001. Statistical significance was determined by unpaired, two-tailed Student’s t-test.
Figure 1—figure supplement 1
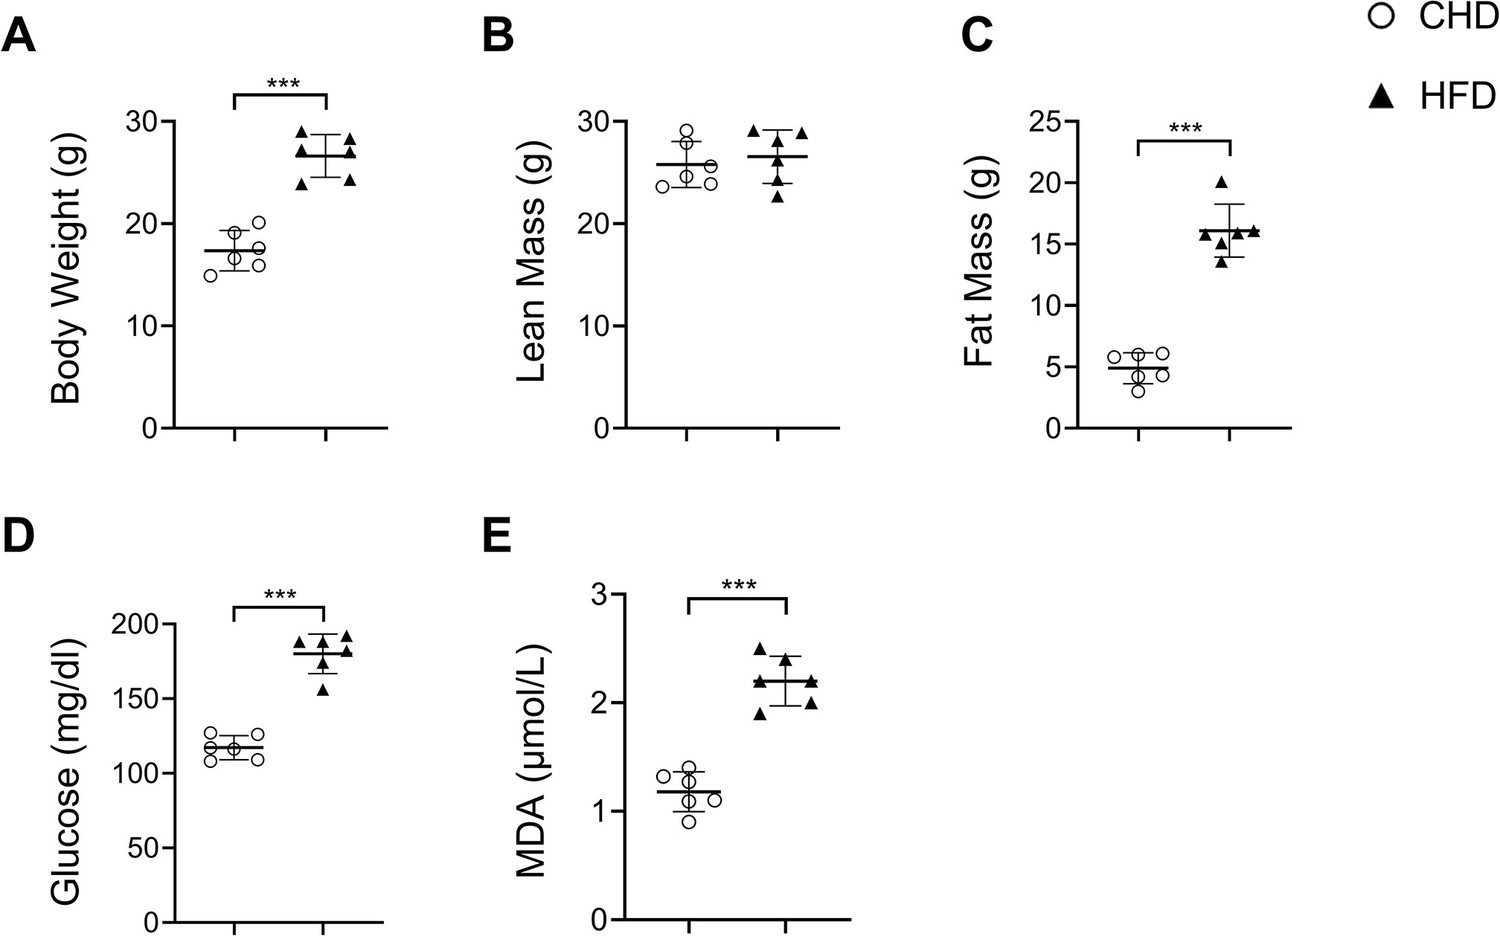
Mice fed a high-fat diet (HFD) develop metabolic syndrome.
Three-month-old C57BL/6 mice were fed a standard chow-food diet (CHD) or HFD for 3 months. Body weight (A), Lean mass (B), Fat mass (C), Blood glucose (D), and serum MDA (E) of the mice were measured. n=6 mice per group. ***p<0.001. Statistical significance was determined by unpaired, two-tailed Student’s t-test.
Figure 1—figure supplement 2
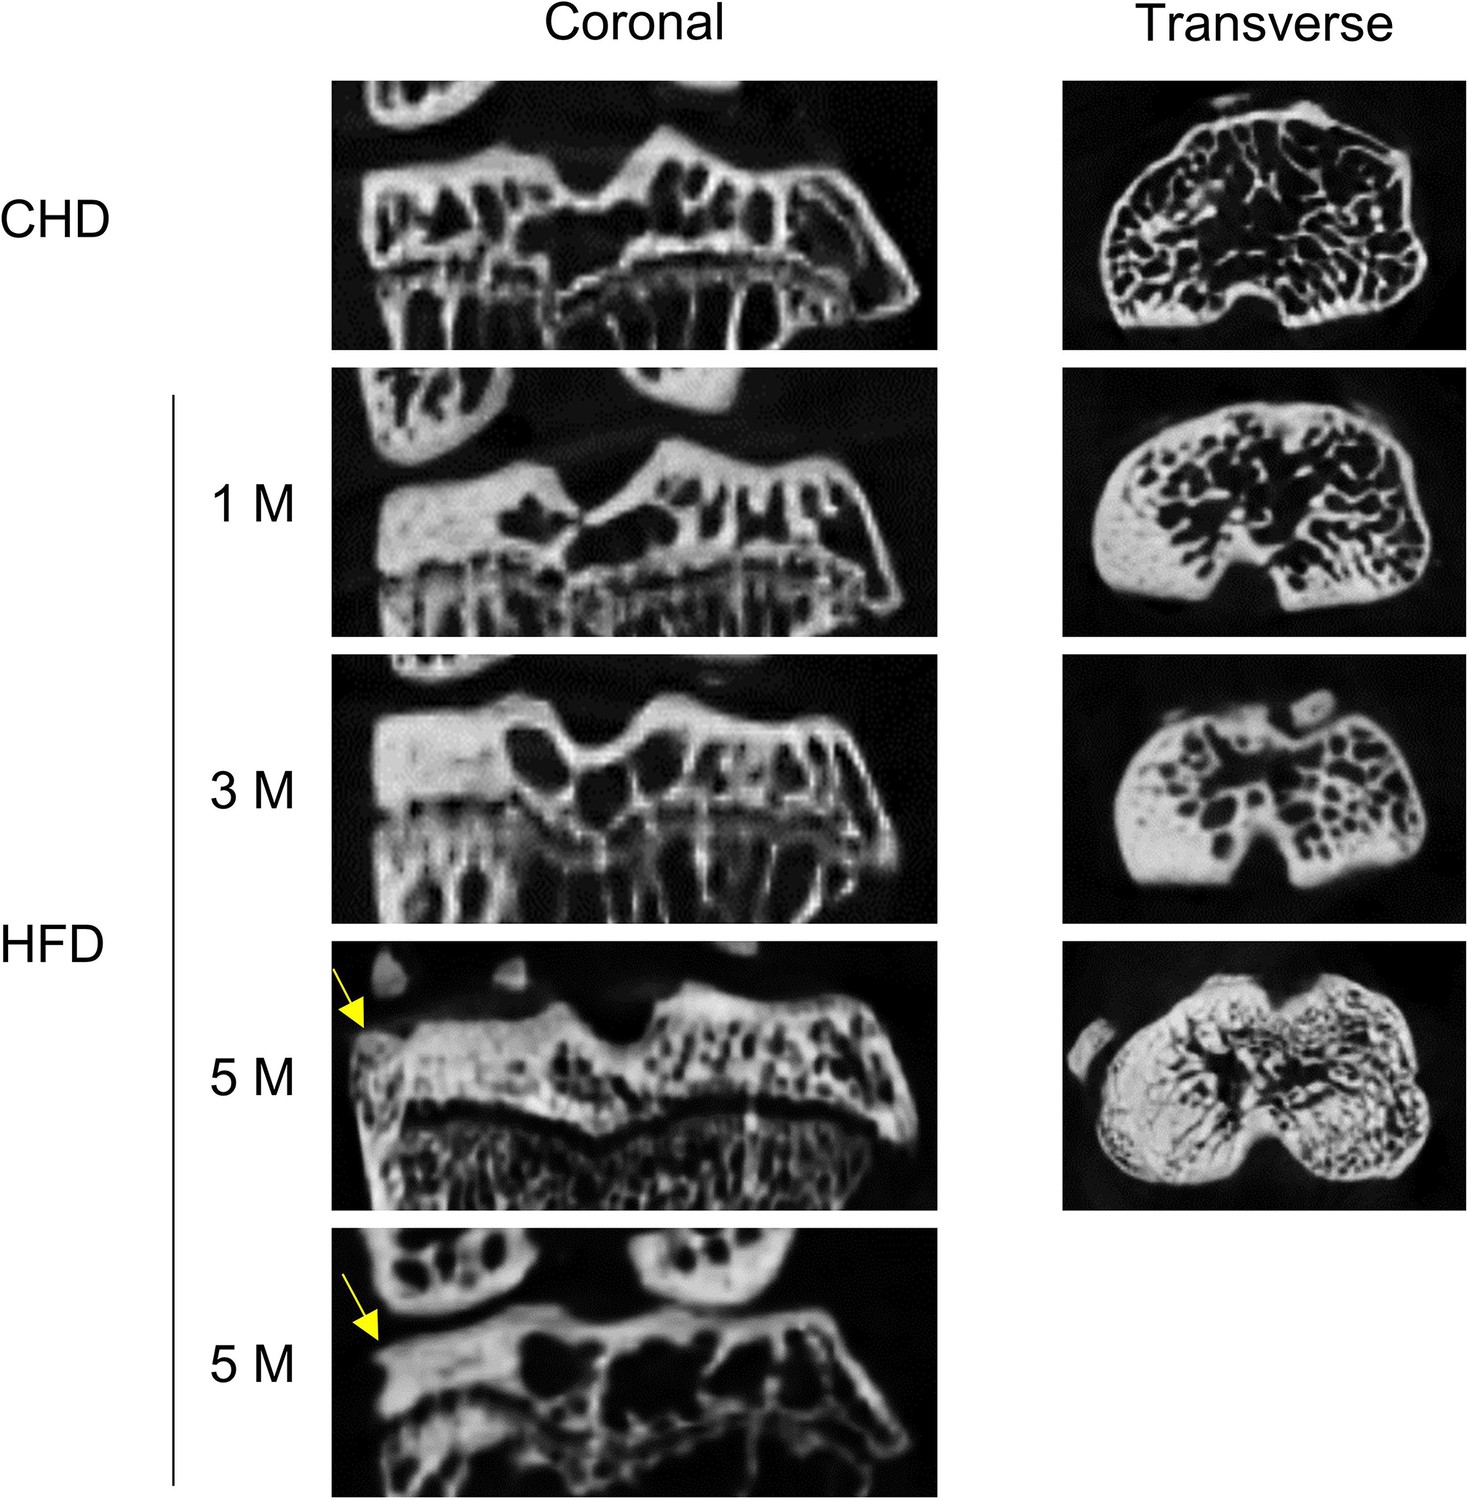
Coronal and transverse view of micro-computed tomography scanning of joint subchondral bone change in high-fat-diet (HFD)-challenged mice.
Three-month-old C57BL/6 mice were fed a standard chow-food diet (CHD) or HFD for 1, 3, or 5 months. n=6 mice per group. Coronal and transverse view of micro-computed tomography scanning of knee joint subchondral bone. Yellow arrows indicate osteophytes.
Figure 1—figure supplement 3
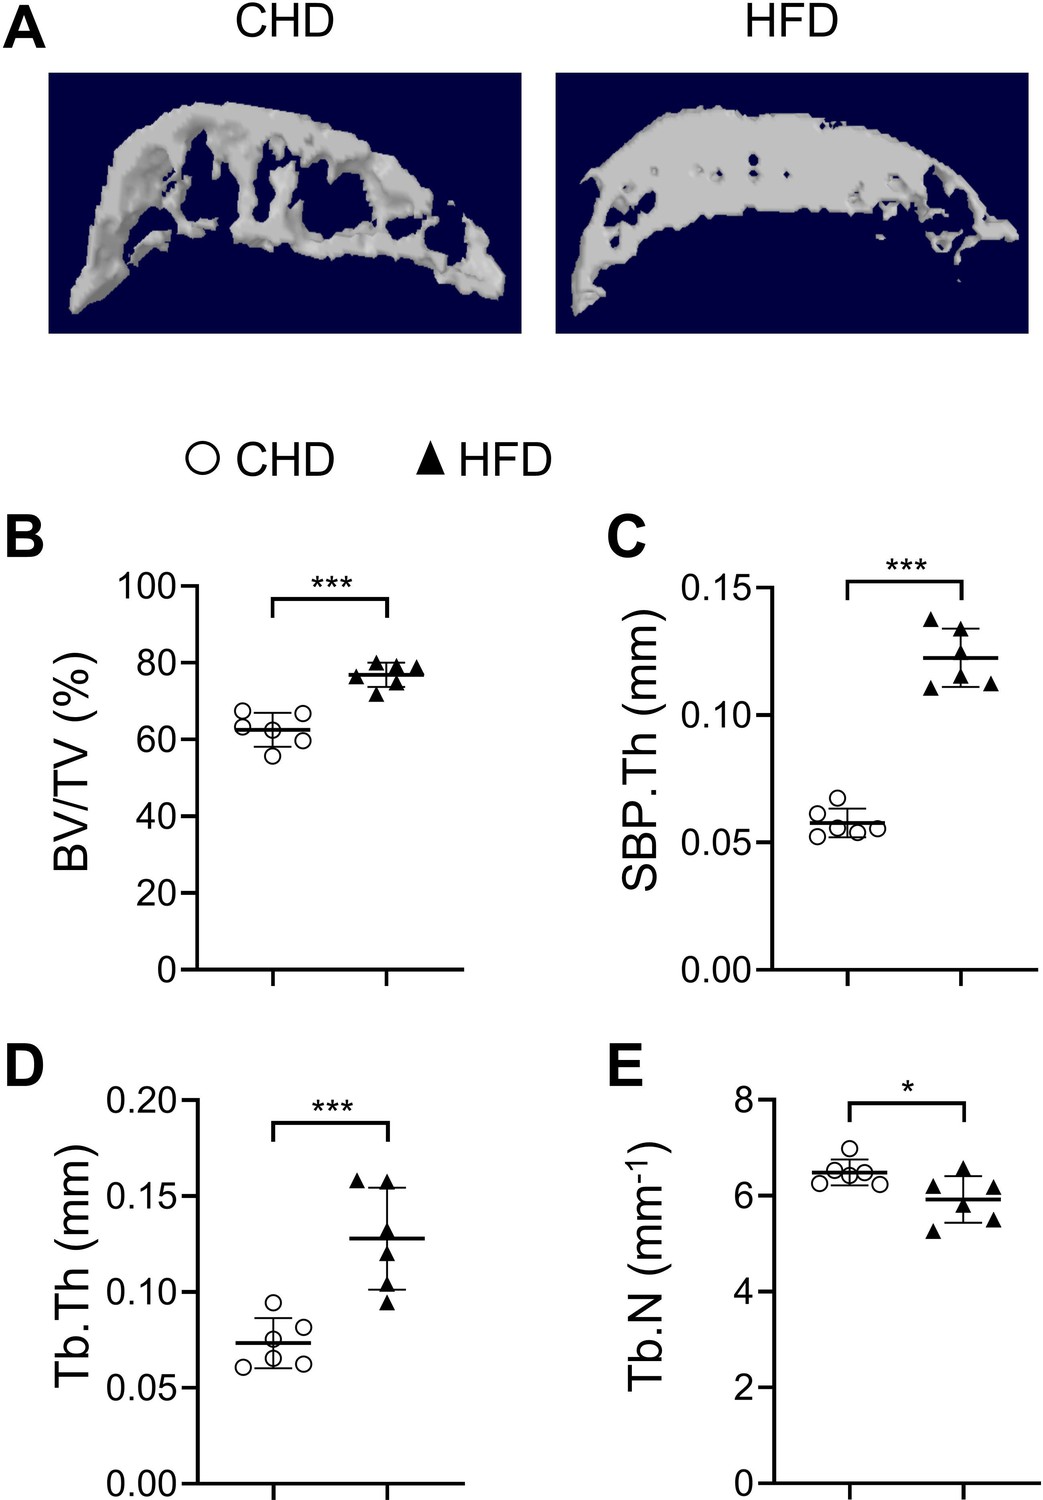
High-fat-diet (HFD) challenge leads to rapid subchondral bone thickening in female mice.
Three-month-old female C57BL/6 mice were fed a standard chow-food diet (CHD) or HFD for 1 month. n=6 mice per group. Three-dimensional micro-computed tomography (μCT) images (A) and quantitative analysis of structural parameters of knee joint subchondral bone: bone volume/tissue volume (BV/TV, %) (B), subchondral bone plate thickness (SBP. Th, mm) (C), trabecular thickness (Tb.Th, mm) (D), trabecular number (Tb.N, mm-1) (E). All data are shown as means ± standard deviations. *p<0.05 and ***p<0.001. Statistical significance was determined by unpaired, two-tailed Student’s t-test.
Figure 1—figure supplement 4
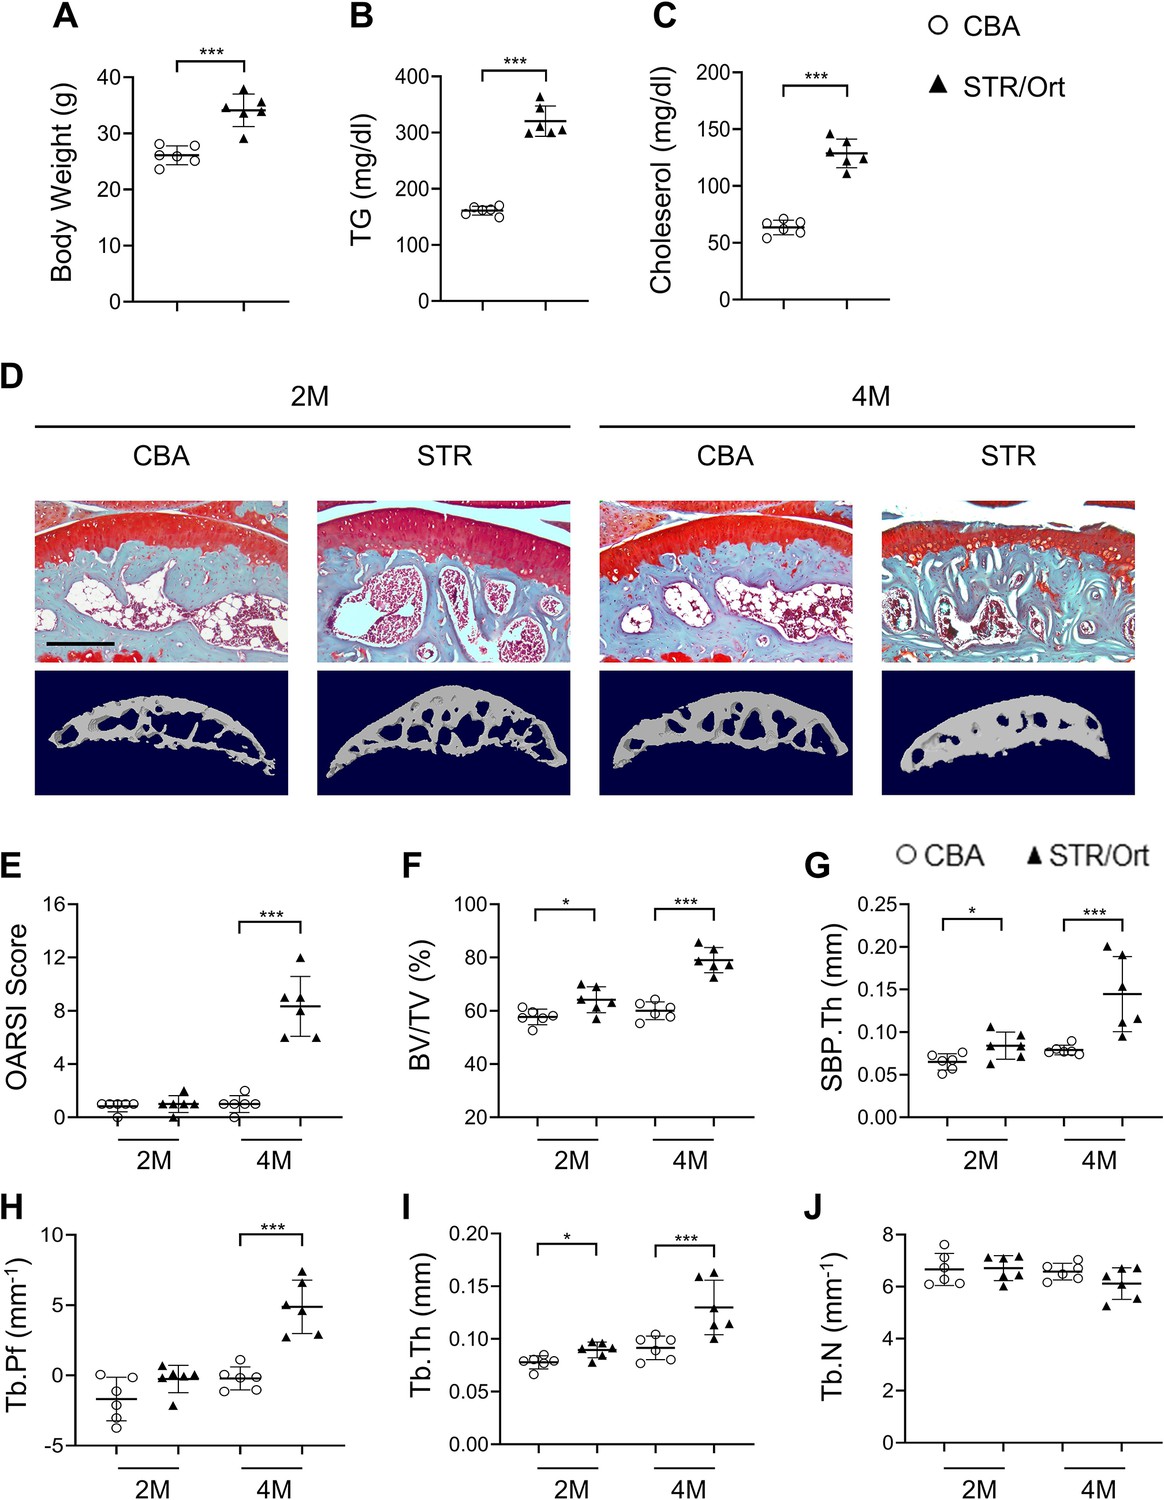
STR/Ort mice develop dyslipidemia and subchondral bone thickness.
Two- and 4-month-old STR/Ort mice were euthanized. Body weight (A), blood triglyceride (TG) (B), and cholesterol (C) of the mice were measured. (D–E) Safranin O-fast green staining of the tibia subchondral bone medial compartment (sagittal view). Scale bar, 100 μm (D) Calculation of Osteoarthritis Research Society International (OARSI) scores (E). (F–J) Three-dimensional μCT images and quantitative analysis of structural parameters of subchondral bone: bone volume/tissue volume (BV/TV, %) (F), subchondral bone plate thickness (SBP. Th, mm) (G), trabecular pattern factor (Tb. Pf, mm–1) (H), trabecular thickness (Tb.Th, mm) (I), and trabecular number (Tb.N, mm–1) (J). All data are shown as mean ± standard deviation. n=6 mice per group. *p<0.05 and ***p<0.001. Statistical significance was determined by unpaired, two-tailed Student’s t-test.
Figure 2
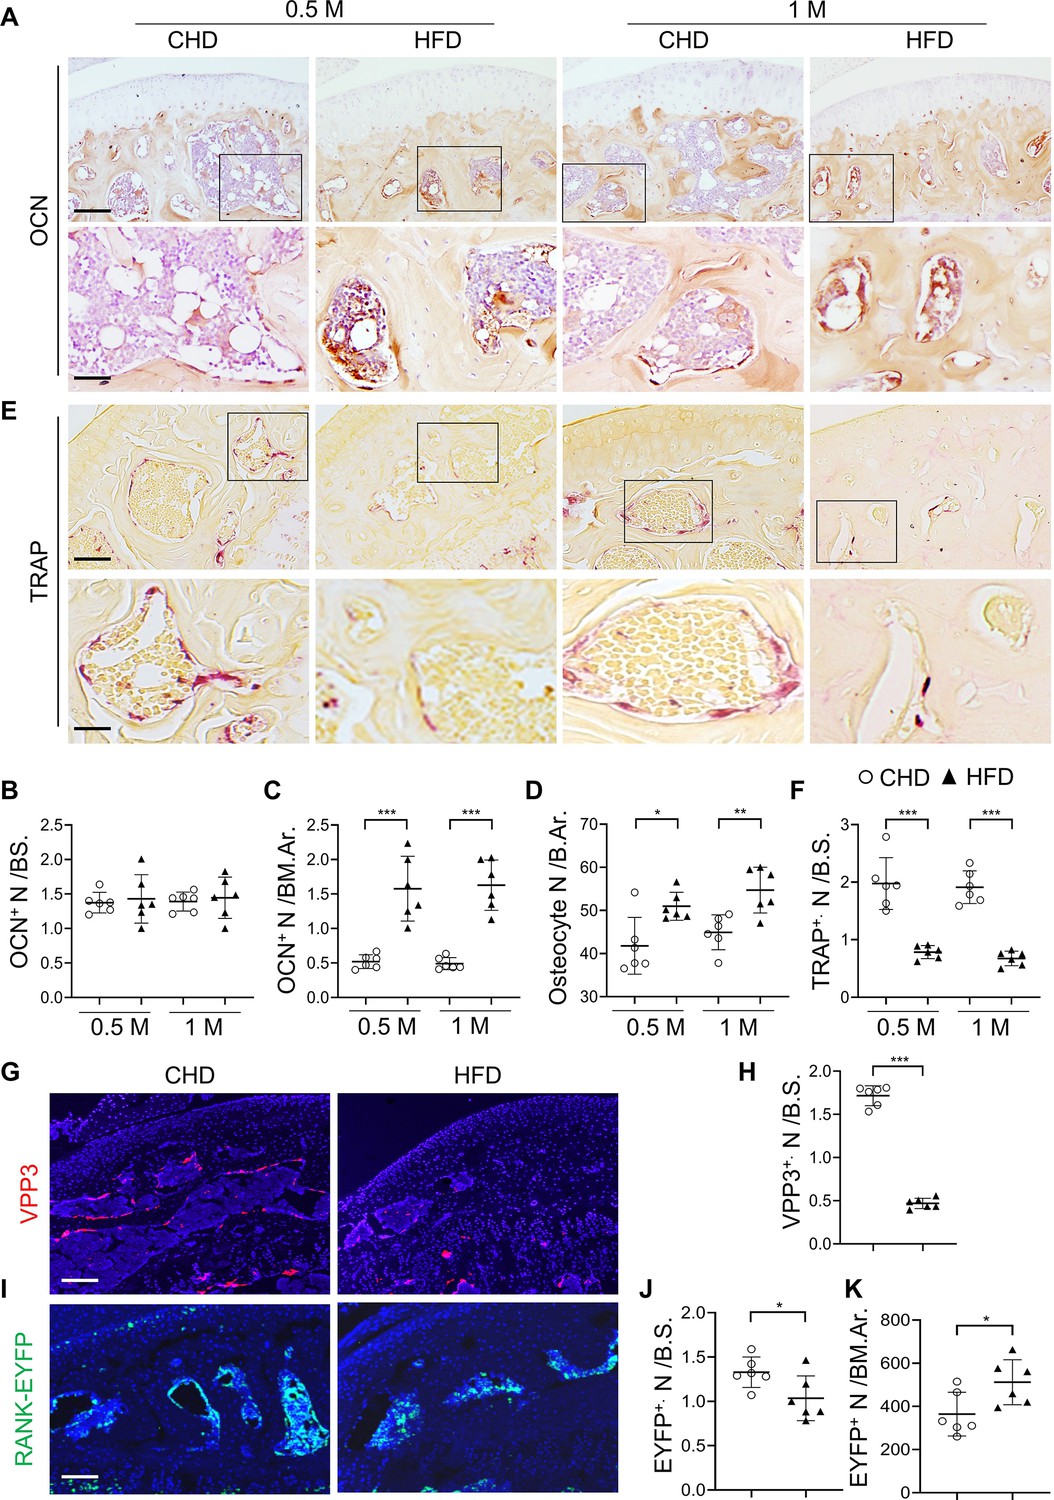
Subchondral osteoblast and osteoclast lineage cells change rapidly in response to a high-fat-diet (HFD) challenge.
(A–E) Three-month-old C57BL/6 mice were fed a standard chow-food diet (CHD) or HFD for 0.5 month or 1 month. n=6 mice per group. Immunohistochemical staining of knee joint tissue sections with antibody against osteocalcin (OCN) (A). Quantification of OCN+ cells within bone marrow (BM) cavity (B) and on bone surface (BS) (C). Calculation of the number of osteocytes embedded in bone matrix (D). Scale bar, 100 μm(up), 50 μm(down). TRAP staining (E) and quantification of TRAP+ cells at the bone surface (F). Scale bar, 100 μm(up), 50 μm(down). (G–K) Three-month-old Tnfrsf11aCre/+; ROSA26lsl-EYFP mice were fed with CHD or HFD for 1 month. Immunofluorescence staining of knee joint tissue sections with antibody against VPP3 (red) (G). Quantification of the number of VPP3+ cells at the bone surface (H). Scale bar, 100 μm. Immunofluorescence staining of knee joint tissue sections with antibody against GFP (green) (I). Quantification of the number of EYFP+ cells at the bone surface (J) or in the BM area (K). Scale bar, 100 μm. Ar, area; BM., bone marrow. B.S., bone surface. All data are shown as means ± standard deviations. *p<0.05, **p<0.01, and ***p<0.001. Statistical significance was determined by unpaired, two-tailed Student’s t-test.
Figure 3 with 2 supplements
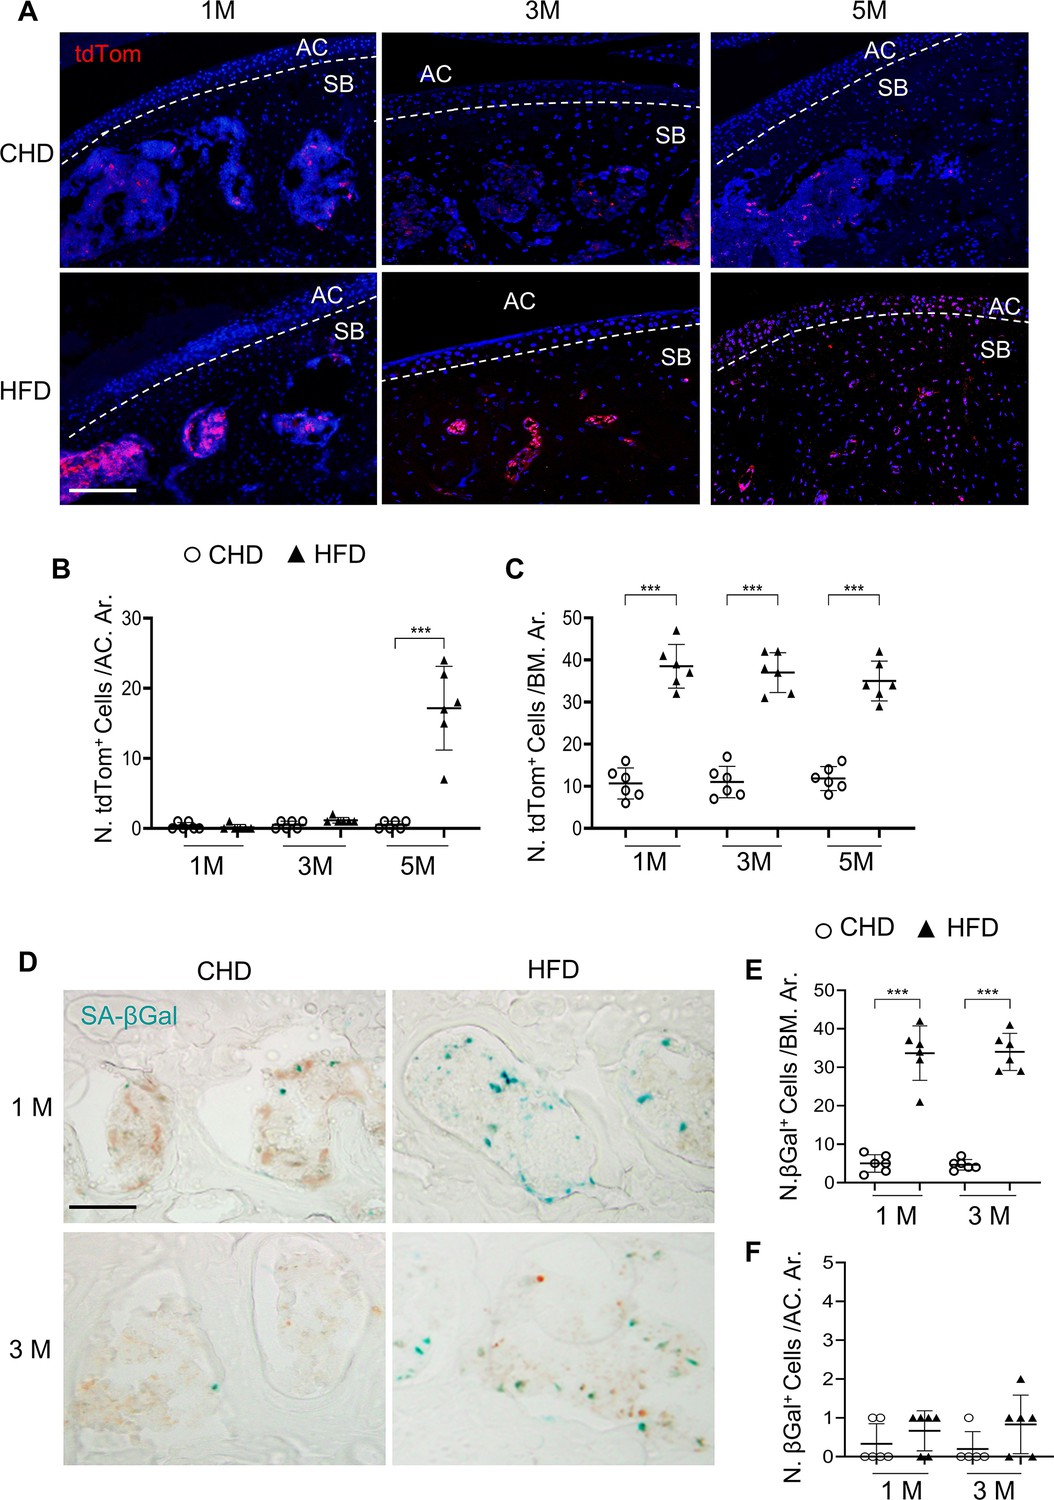
Senescent cells accumulate in subchondral bone of high-fat-diet (HFD)-challenged mice.
(A–B) Three-month-old Cdkn2atdTom mice were fed a standard chow-food diet (CHD) or HFD for different time periods as indicated, n=6 mice per group. Fluorescence images showing tdTom+ cells (red) (A) with quantification of the number of tdTom+ cells at articular cartilage (B) or subchondral bone/bone marrow (C) of knee joints. Scale bar, 100 μm. (D–F) Three-month-old C57BL/6 mice were fed a CHD or HFD for 1 or 3 months. SA-βGal staining (D) and quantification of SA-βGal+ cells at subchondral bone/bone marrow (E) or articular cartilage (F) of knee joints. Scale bar, 100 μm.
Figure 3—figure supplement 1
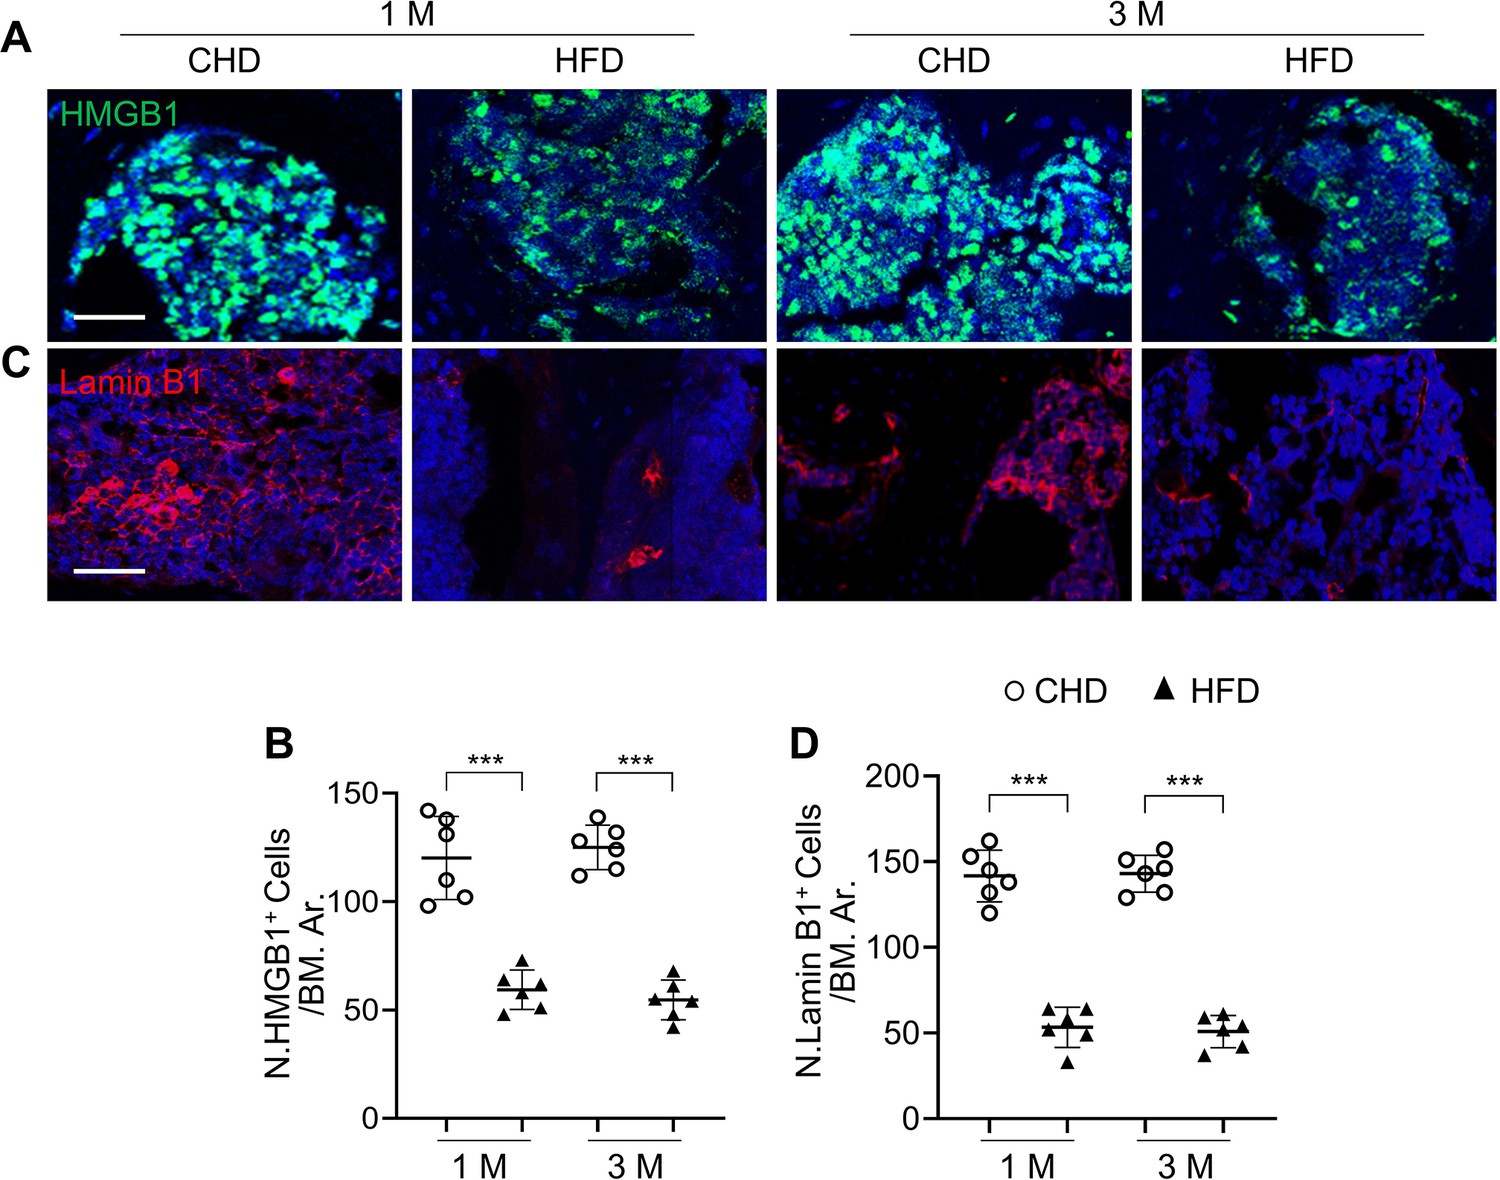
Senescent cells accumulate in subchondral bone of high-fat-diet (HFD)-challenged mice.
Three-month-old C57BL/6 mice were fed a standard chow-food diet (CHD) or HFD for 1 or 3 months. Immunofluorescence staining of HMGB1 (green) (A) and Lamin B1 (red) (C) with quantification of the number of HMGB1+ cells (B) or Lamin B1+ cells (D) in the subchondral bone marrow area. All data are shown as mean ± standard deviation. n=6 mice per group. ***p<0.001. Scale bar, 50 μm. Statistical significance was determined by unpaired, two-tailed Student’s t-test.
Figure 3—figure supplement 2
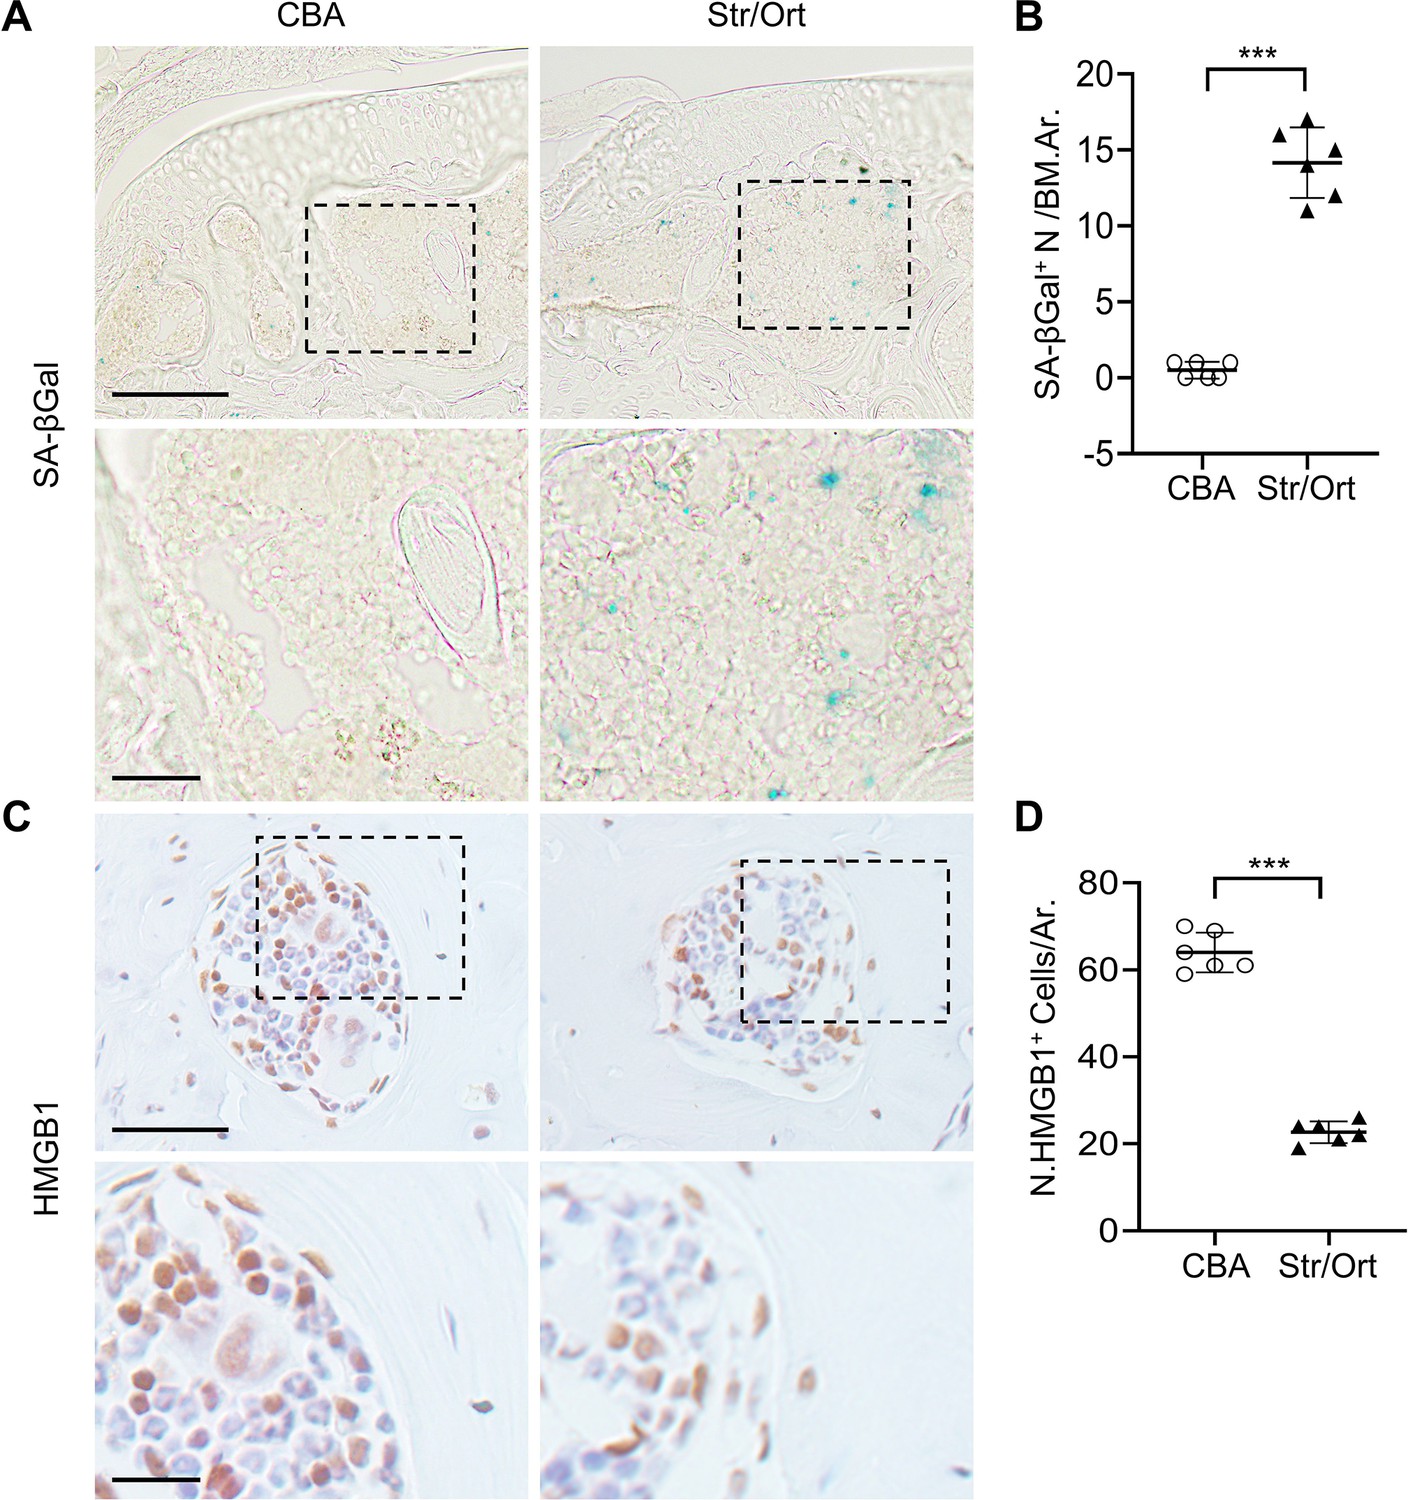
Senescent cells accumulate in subchondral bone of STR/Ort mice.
STR/Ort mice were euthanized at 2 months. SA-βGal staining (A) and quantification of SA-βGal+ cells in subchondral bone marrow area (B), Scale bar, 100 μm(up), 50 μm(down). Immunohistochemical staining of HMGB1 (C) and quantification of HMGB1+ cells per bone marrow area (D), Scale bar, 100 μm(up), 50 μm(down). All data are shown as mean ± standard deviation. n=6 mice per group. ***p<0.001. Statistical significance was determined by unpaired, two-tailed Student’s t-test.
Figure 4
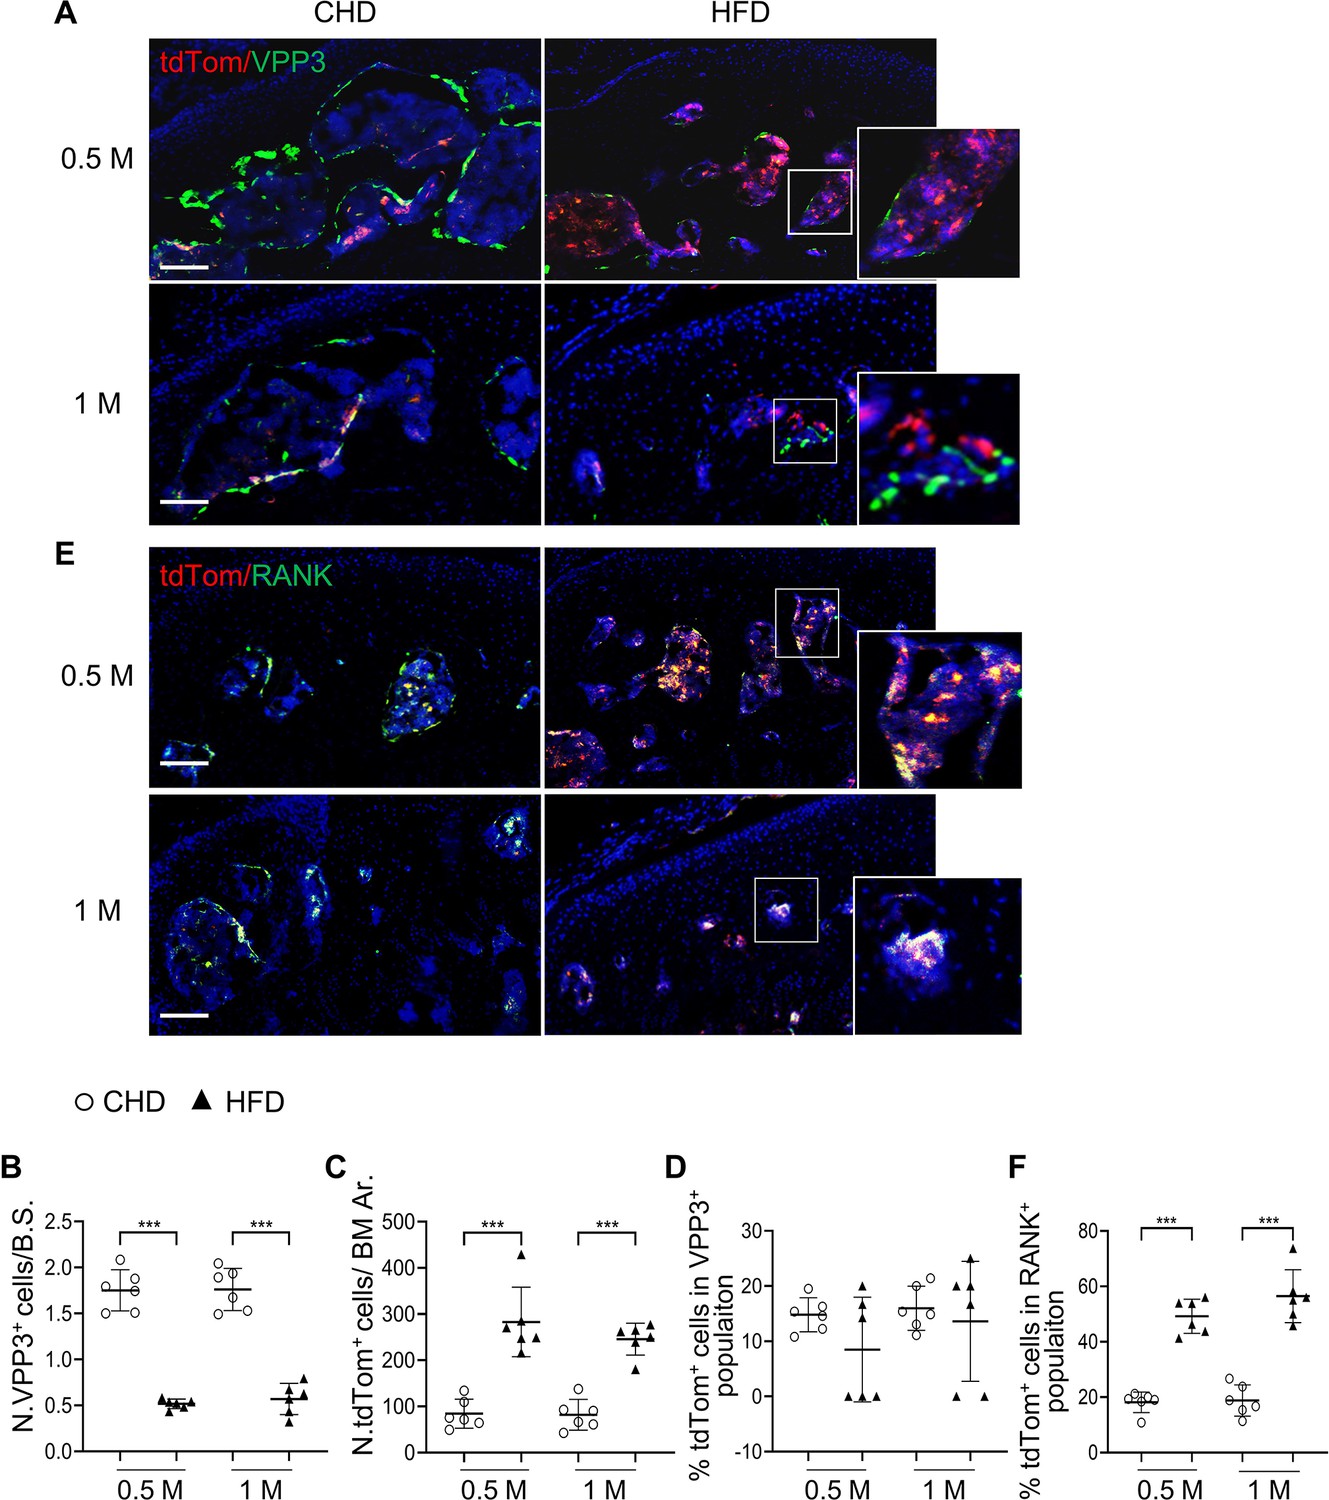
Subchondral marrow preosteoclasts exhibit senescence-like feature in high-fat-diet (HFD)-challenged mice.
Three-month-old Cdkn2atdTom mice were fed a CHD or HFD for 0.5 month or 1 month, n=6 mice per group. Immunofluorescence staining of knee joint tissue sections with antibody against VPP3. Double fluorescence imaging of tdTom (red) and VPP3 (green) are shown in (A). Quantification of VPP3+ cell numbers at the bone surface (B); tdTom+ cell numbers in subchondral bone marrow area (C); percentage of tdTom+ cells out of total VPP3+ cells (D). Immunofluorescence staining of knee joint tissue sections with antibody against RANK. Double fluorescence imaging of tdTom (red) and RANK (green) were shown in (E). Percentage of tdTom+ cells out of total RANK+ cells were shown in (F). Scale bar, 100 μm. All data are shown as means ± standard deviations. ***p<0.001. Statistical significance was determined by unpaired, two-tailed Student’s t test.
Figure 5 with 1 supplement
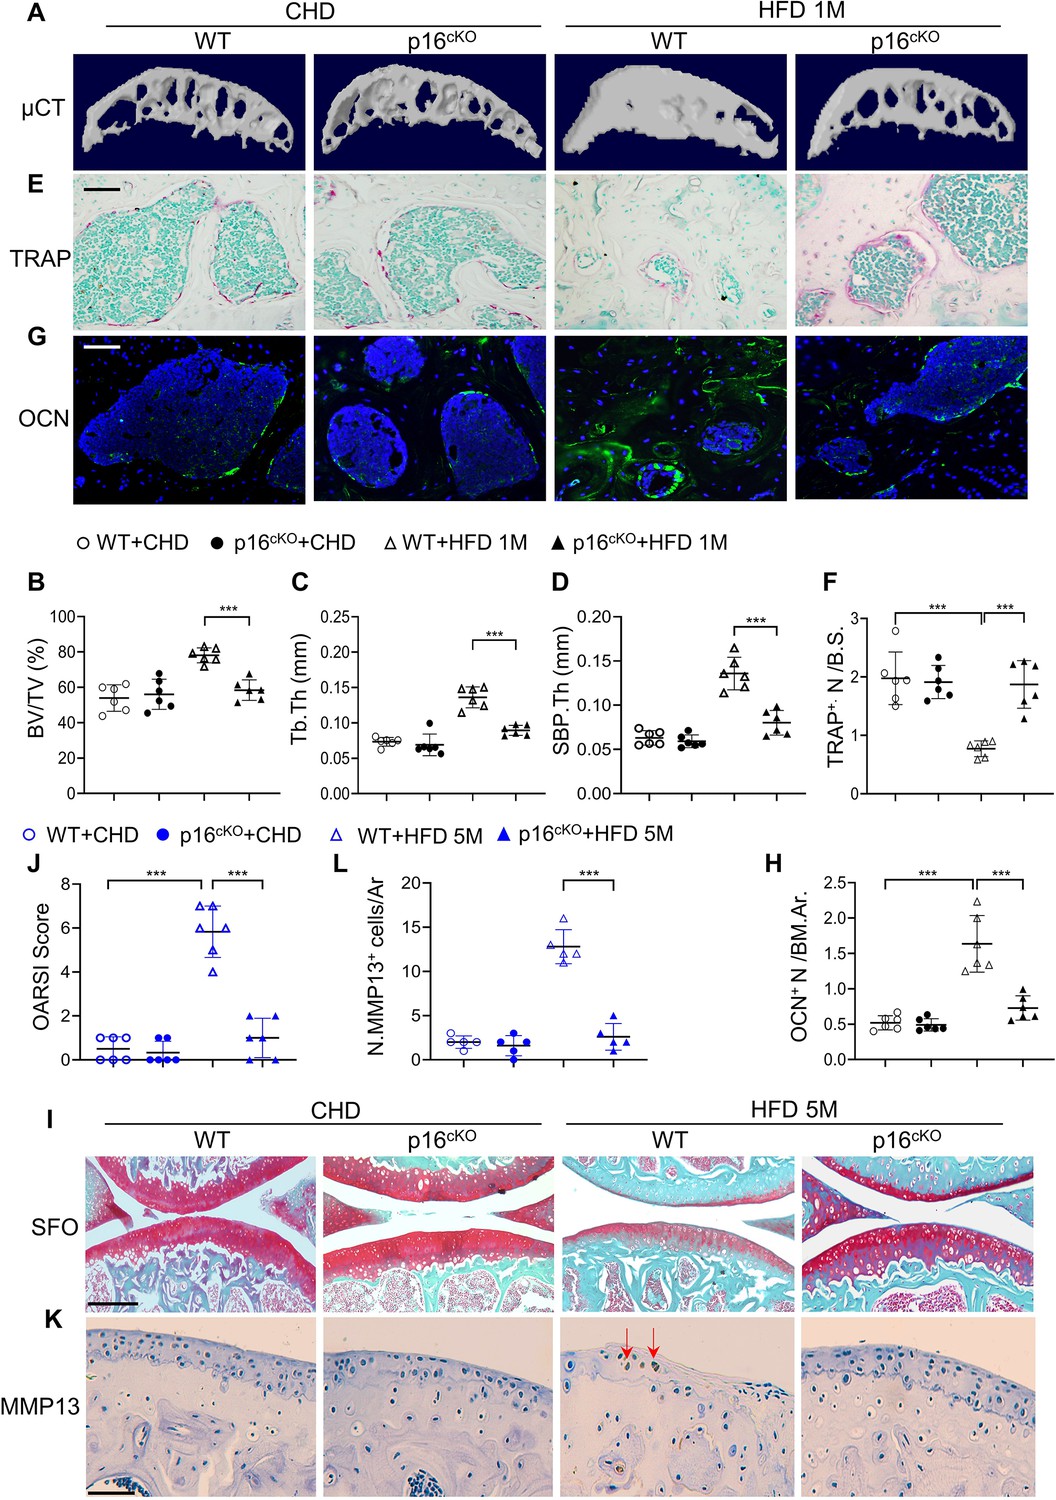
Deletion of Cdkn2a in preosteoclasts attenuates subchondral bone thickness and cartilage damage in high-fat-diet (HFD) mice.
(A–H) Three-month-old Tnfrsf11aCre/+; Cdkn2aflox/flox mice (p16cko) and Cdkn2aflox/flox littermates (wild-type [WT]) were fed a standard chow-food diet (CHD) or HFD for 1 months, n=6 mice per group. Three-dimensional micro-computed tomography (μCT) images (A) and quantitative analysis of structural parameters of knee joint subchondral bone: bone volume/tissue volume (BV/TV, %) (B), subchondral bone plate thickness (SBP. Th, mm) (C), and trabecular thickness (Tb.Th, mm) (D). TRAP staining of knee joint tissue sections (E) and quantification of TRAP+ cells at the bone surface (F). Scale bar, 100 μm. Immunofluorescence staining of knee joint tissue sections with antibody against osteocalcin (OCN) (green) (G). Quantification of the number of OCN+ cells per bone marrow area (H). (I–L) Three-month-old Tnfrsf11aCre/+; Cdkn2aflox/flox mice (p16cko) and Cdkn2aflox/flox littermates (wild-type [WT]) were fed a standard chow-food diet (CHD) or HFD for 5 months, n=6 mice per group. Safranin O-fast green staining of the tibia subchondral bone medial compartment (sagittal view) (I). Scale bar, 200 μm. Calculation of Osteoarthritis Research Society International (OARSI) scores (J). Scale bar, 100 μm. Immunostaining of knee joint tissue sections with antibody against MMP13 (brown) (K) and quantification of MMP13+ cells on cartilage (L). Red arrows: MMP13+ cells. Results are expressed as mean ± standard deviations, ***p<0.001. Statistical significance was determined by unpaired, two-tailed Student’s t test.
Figure 5—figure supplement 1

Deletion of Cdkn2a in RANK+ cells efficiently prevents subchondral cellular senescence.
Three-month-old Tnfrsf11aCre/+; Cdkn2aflox/flox mice (p16cko) and Cdkn2aflox/flox littermates (wild-type [WT]) were fed a standard chow-food diet (CHD) or HFD for 1 months, n=6 mice per group. SA-βGal staining (A) and quantification of SA-βGal+ cells in subchondral bone marrow area of knee joints (B). Scale bar, 100 μm. All data are shown as mean ± standard deviation. ***p<0.001. Statistical significance was determined by unpaired, 2-tailed Student’s t-test.
Figure 6 with 4 supplements
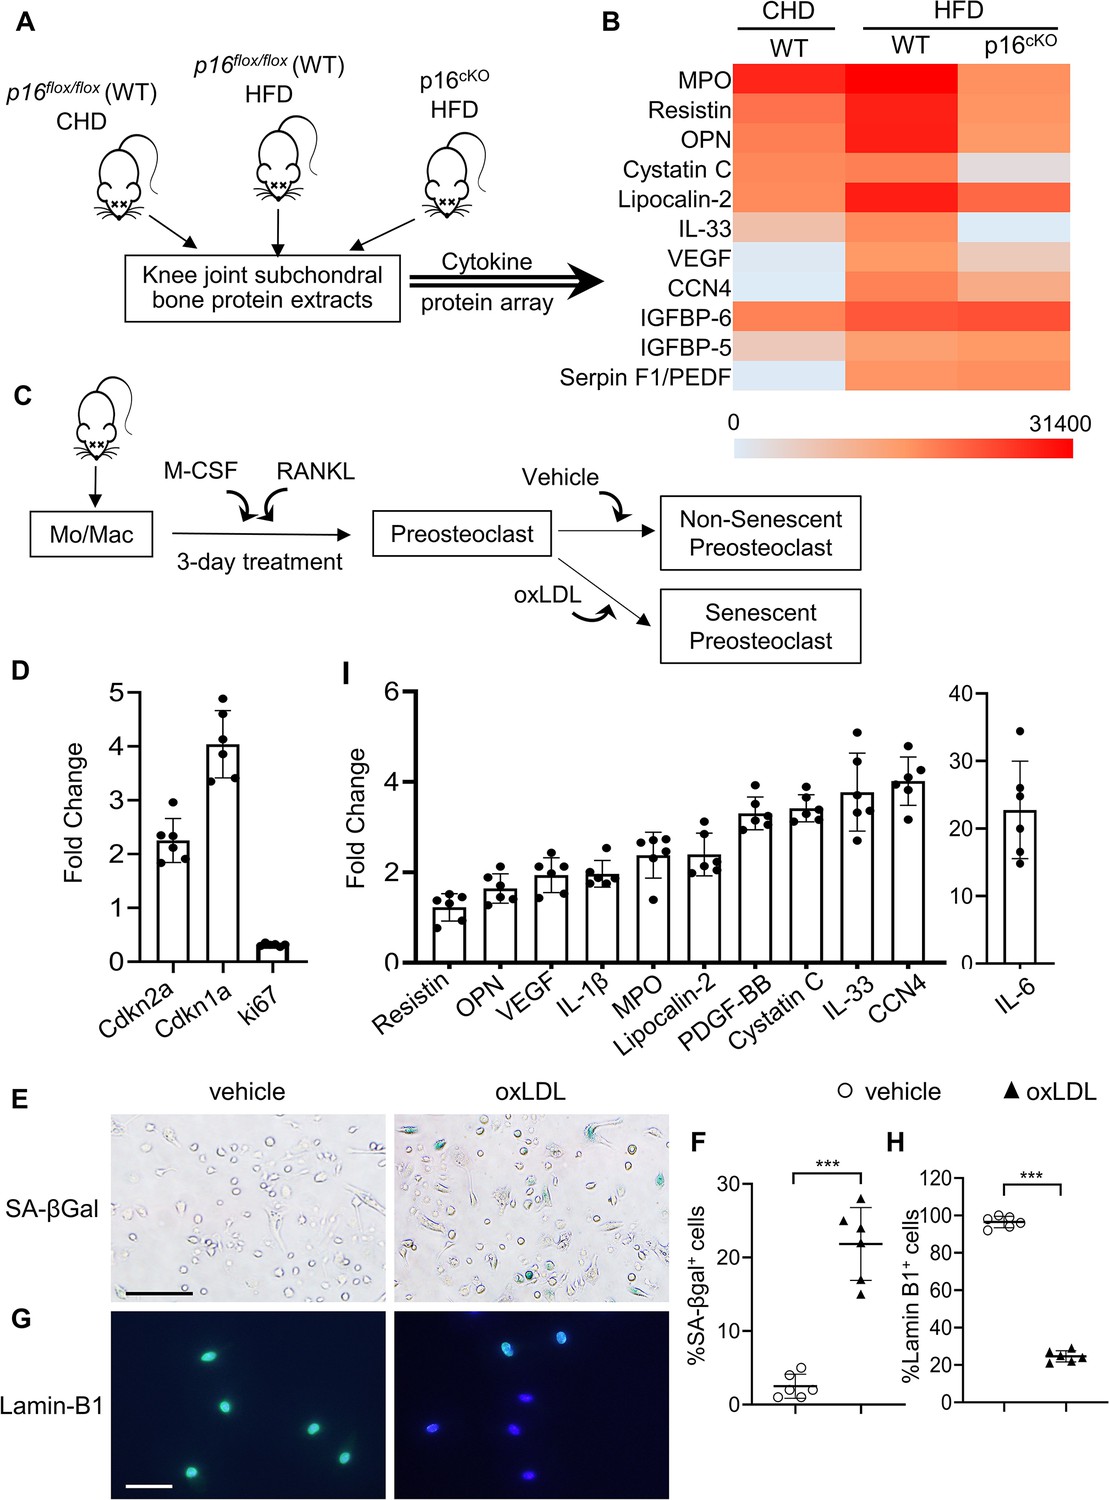
Subchondral preosteoclasts acquire a unique secretory phenotype in high-fat-diet (HFD) mice.
Three-month-old Cdkn2aflox/flox mice were fed a standard chow-food diet (CHD). Three-month-old Tnfrsf11aCre/+; Cdkn2aflox/flox mice(p16cko) and Cdkn2aflox/flox littermates (wild-type [WT]) were fed with the HFD. (A) The subchondral bone protein extracts were harvested after 1 month. n=6 mice per group. (B) Differentially expressed proteins are shown on a heat map. (C) Isolated bone marrow monocytes/macrophages were treated with M-CSF and receptor activator of nuclear factor kappa-B ligand (RANKL) to obtain mononuclear preosteoclasts. Cellular senescence of the preosteoclasts was induced by challenging the cells with oxidized low-density lipoprotein (oxLDL) or vehicle. (D) In vitro senescence-associated changes in normalized mRNA expression of three senescence effectors. (Cdkn2a, Cdkn1a, and Mki67) (E, F) SA-βGal staining (E) and percentage quantification of SA-βGal+ cells (F). Scale bar, 100 μm. (G–H) Immunofluorescence staining of Lamin B1 (green) (G) and percentage quantification of Lamin B1+ cells (H). Scale bar, 50 μm. (I) In vitro senescence-associated changes in normalized mRNA expression of established SASP components are shown. Results are expressed as mean ± standard deviations, ***p<0.001. Statistical significance was determined by unpaired, two-tailed Student’s t-test.
Figure 6—figure supplement 1
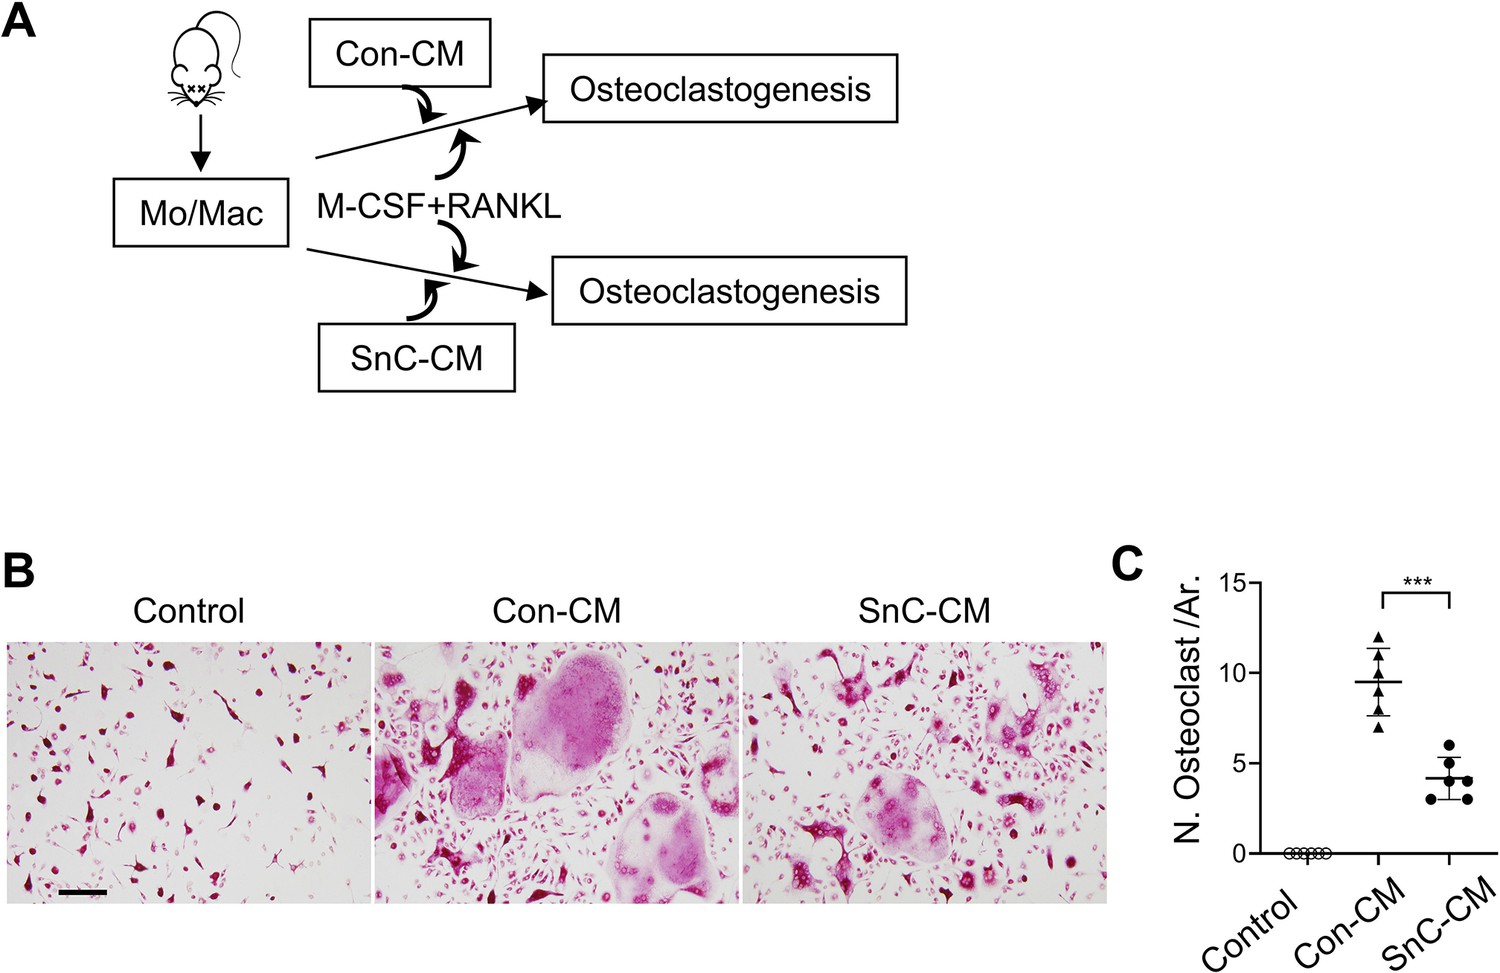
Senescence-associated secretome inhibits osteoclastogenesis.
(A) Experimental procedure: Monocytes/macrophages were incubated with osteoclastogenesis medium (macrophage colony stimulating factor [M-CSF] and receptor activator of nuclear factor kappa-B ligand [RANKL]). Control conditioned medium (Con-CM) or senescent cell conditioned medium (SnC-CM) were also added. (B–C) Representative images of tartrate‐resistant acid phosphatase (TRAP) staining (B) and quantification of TRAP +multinuclear cells (C). All data are shown as mean ± standard deviation. n=6, ***p<0.001. Statistical significance was determined by unpaired, two-tailed Student’s t-test.
Figure 6—figure supplement 2
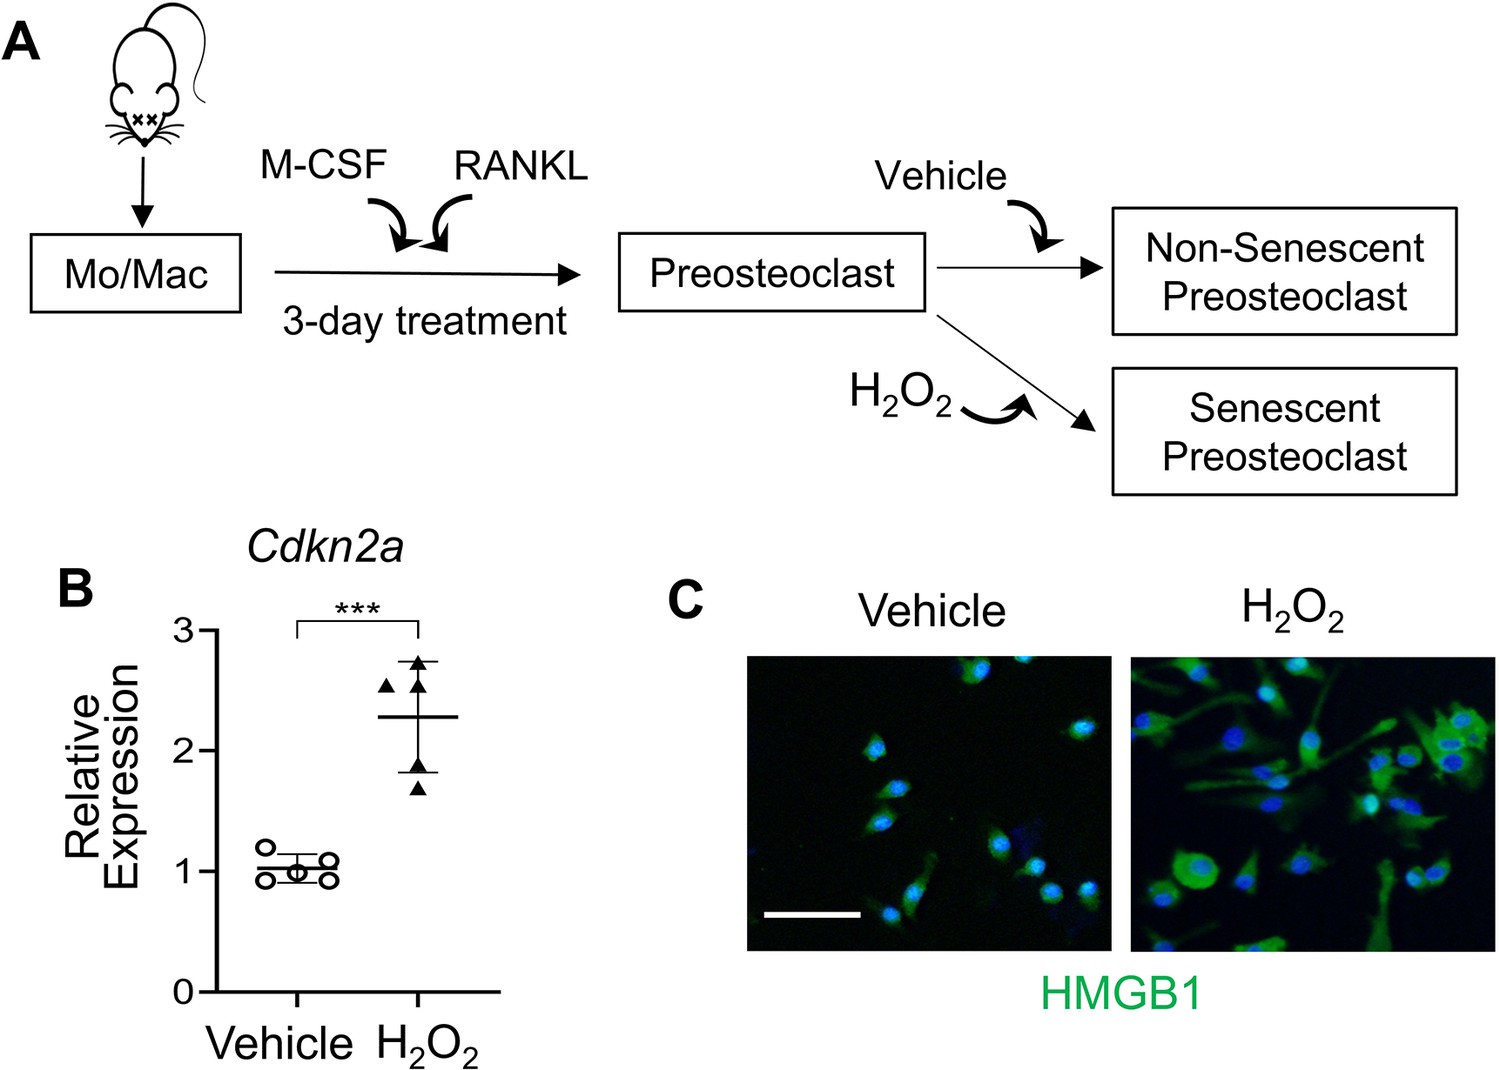
Senescence of preosteoclasts was successfully induced with hydrogen peroxide.
(A) Procedure for preparation of senescent preosteoclasts. Isolated bone marrow monocytes/macrophages were treated with M-CSF and RANKL for 3 days to obtain mononuclear preosteoclasts. Cellular senescence of the preosteoclasts was induced by challenging the cells with H2O2. (B) p16INK4a expression was measured by qRT-PCR. (C) Immunofluorescence staining of HMGB1 (green). Scale bar, 100 μm. All data are shown as mean ± standard deviation, n=5, ***p<0.001. Statistical significance was determined by unpaired, two-tailed Student’s t-test.
Figure 6—figure supplement 3
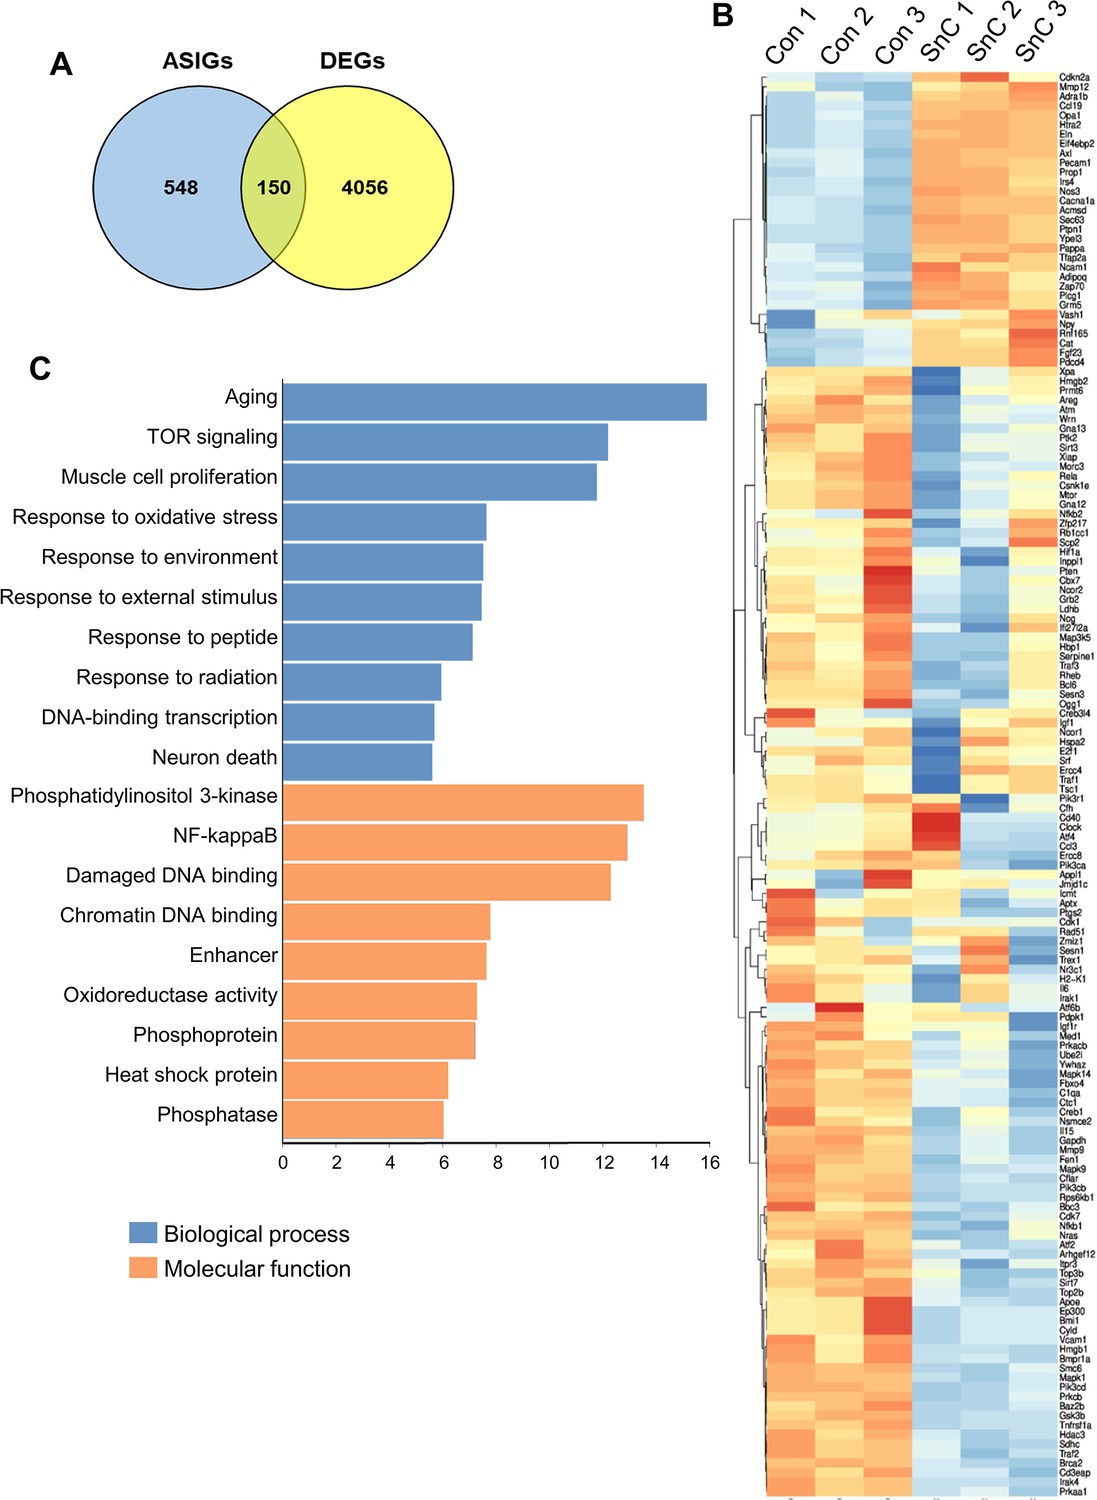
RNA-seq reveals aging/senescence-induced genes in senescent preosteoclasts.
RNA-seq was performed using senescent preosteoclasts and non-senescent preosteoclasts. (A) 150 aging/senescence-induced genes (ASIGs) were defined based on previously published studies (see Methods). (B) Heatmap depicting ASIGs displaying significant upregulated and downregulated genes. (C) Enriched pathways are enlisted based on the analyses of biological process and molecular function.
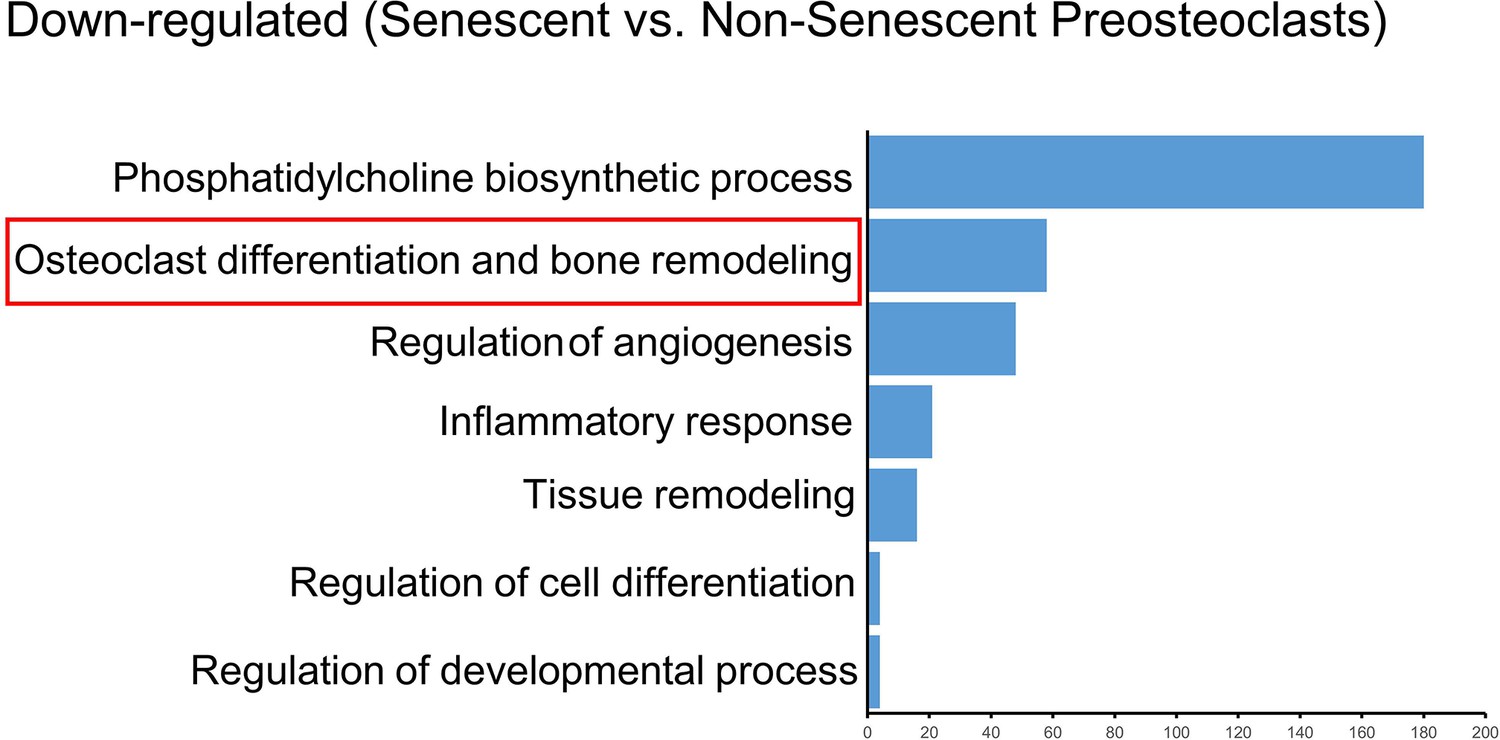
Figure 6—figure supplement 4
Osteoclast differentiation-related genes are down-regulated in the senescent preosteoclasts in the RNA-seq dataset.
Figure 7
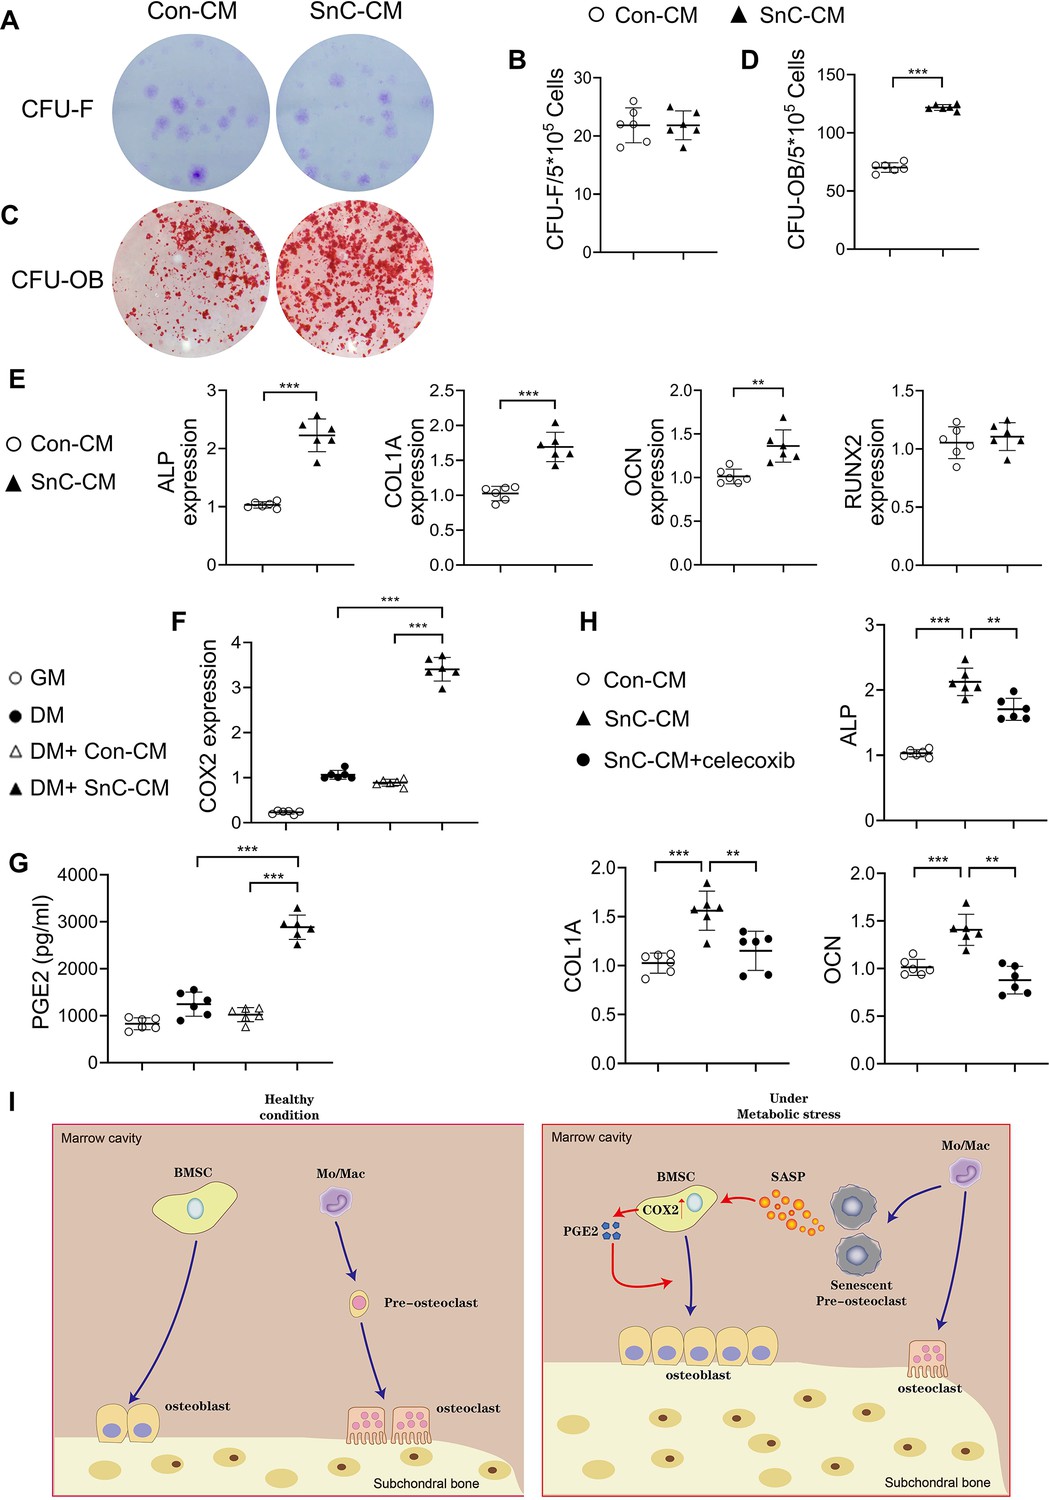
Secreted factors from preosteoclasts stimulate osteoblast differentiation through COX2-PGE2 signaling.
(A–D) Representative images (A, C) and the quantified CFU-F frequency (B), and CFU-OB frequency (D) of bone marrow stromal cells treated with control conditioned medium (Con-CM) or senescent conditioned medium (SnC-CM). (E) qRT-PCR analysis of the relative levels of Alpl, Col1a1, Bglap, Runx2 mRNA expression in bone marrow stromal cells cultured in the mixture of osteoblast differentiation medium (DM) and Con-CM or SnC-CM (DM:CM = 1:1). **p<0.01, and ***p<0.001. Statistical significance was determined by unpaired, two-tailed Student’s t-test. (F) Relative levels of Cox2 mRNA expression in BMSCs cultured in growth medium (GM), osteoblast DM, Con-CM, or SnC-CM. (G) PGE2 protein levels from GM, DM, Con-CM, or SnC-CM were calculated. Results are expressed as mean ± standard deviations. (H) qRT-PCR analysis of the relative levels of Alpl, Col1a1, Bglap mRNA expression in BMSCs cultured in the mixture of osteoblast DM and Con-CM or SnC-CM (DM:CM = 1:1), or together with celecoxib (40 μM). (I) Schematic model for the role of preosteoclast secretome-COX2/PGE2 axis in mediating subchondral bone formation during metabolic syndrome (MetS). Under MetS, preosteoclasts in subchondral bone marrow undergo cellular senescence and secrete SASP factors, which acts on both osteoclast precursors to suppress osteoclast differentiation and osteoblast precursors to activate COX2-PGE2 signaling to promote osteoblast differentiation for bone formation.
Figure 8
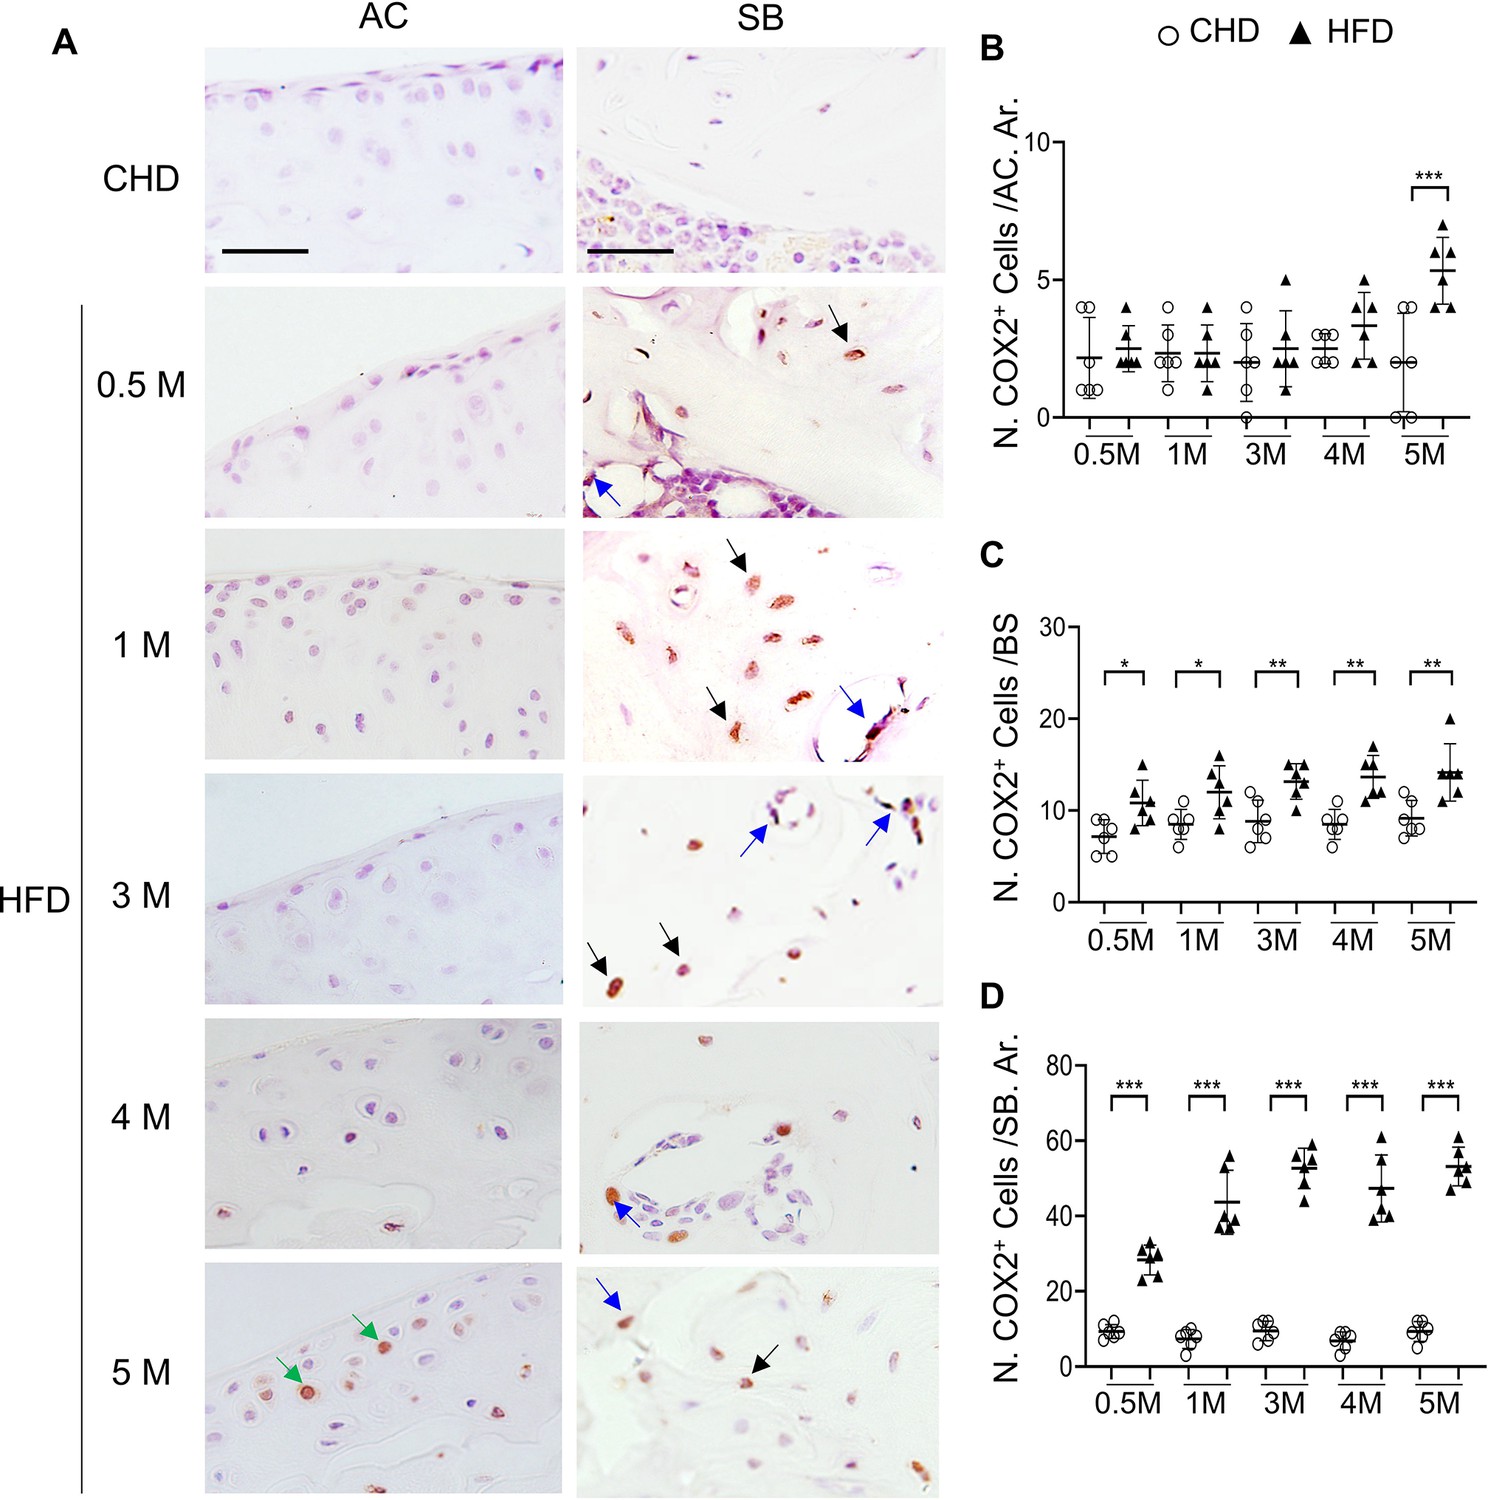
High-fat diet (HFD) mice have increased COX2+ cells in subchondral bone.
Three-month-old C57BL/6 mice were fed a standard chow-food diet (CHD) or HFD for different time periods as indicated, n=6 mice per group. Immunofluorescence staining of knee joint tissue sections with antibody against COX2 (green) (A). Green arrows, COX2+ cells in cartilage; Blue arrows, COX2+ cells in bone surface osteoblasts; Black arrows, COX2+ cells in osteocytes. Quantification of the number of COX2+ cells per cartilage area (B), COX2+ cells per bone surface (C), and COX2+ cells per bone area (D). Results are expressed as mean ± standard deviation. n=5, *** p<0.001.
Figure 9
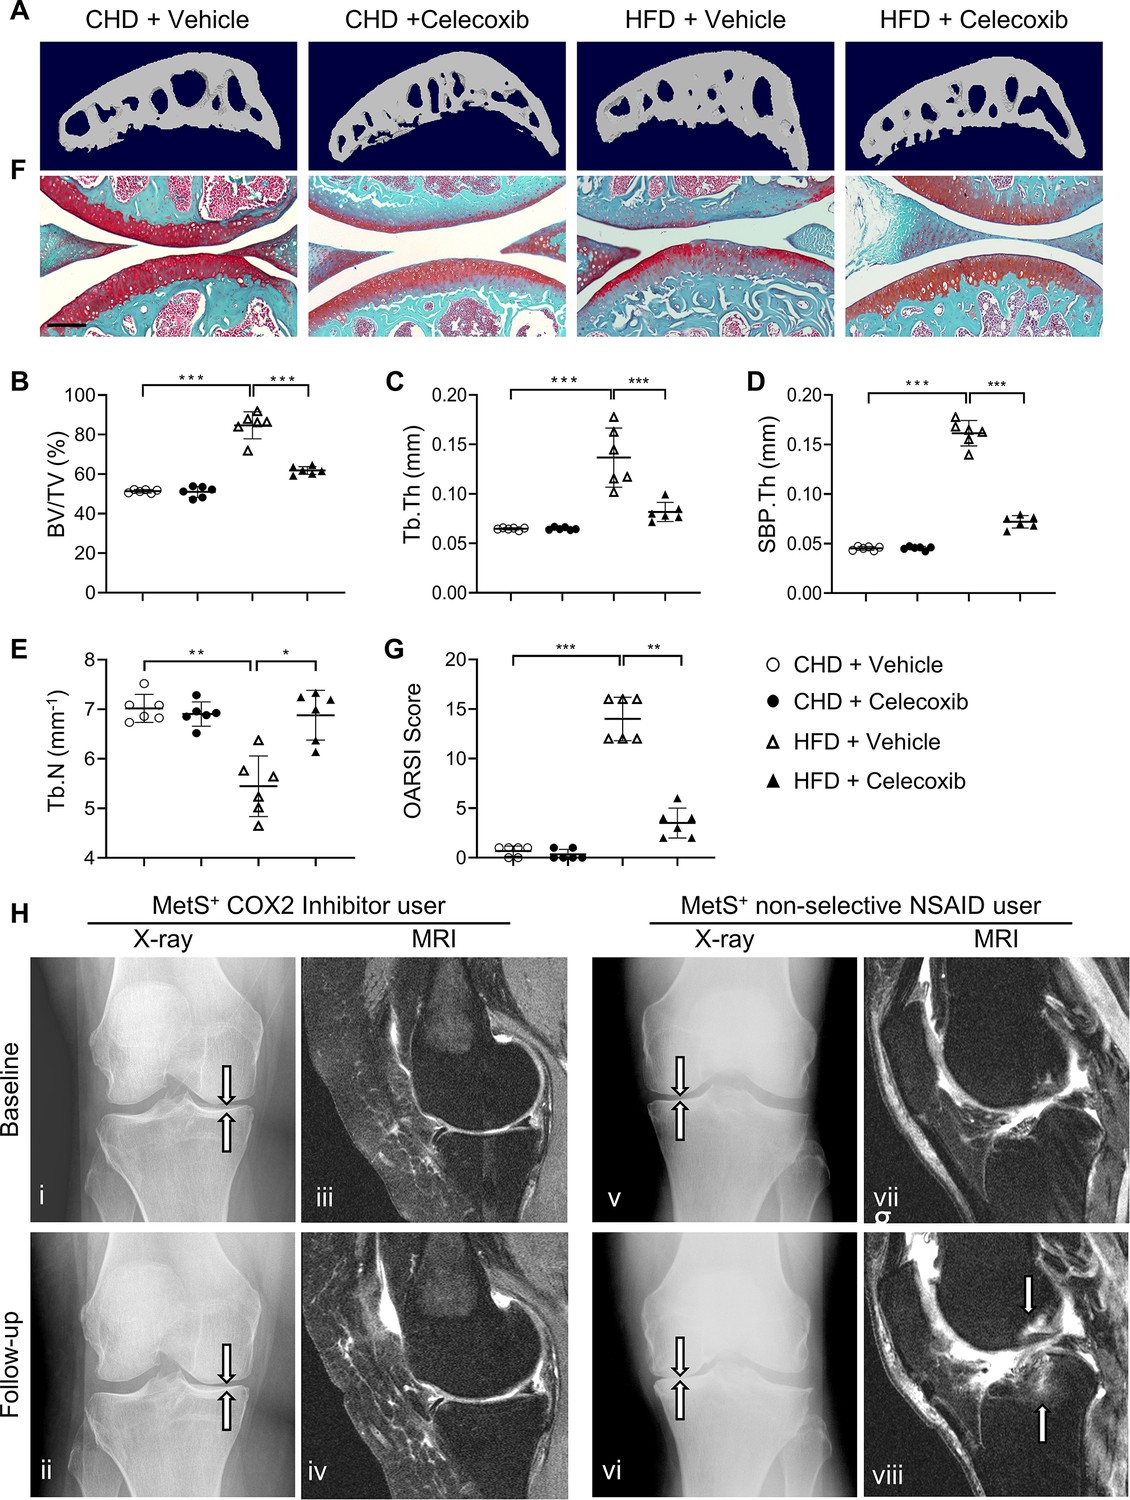
Cyclooxygenase 2 (COX2) inhibitor alleviates high-fat diet (HFD)-induced joint degeneration in mice.
Three-month-old C57BL/6 mice were fed a standard chow-food diet (CHD) or HFD for 5 months. During the last 2 months of the HFD challenge, the mice also received celecoxib (16 mg/kg–1 daily) or vehicle. n=6 mice per group. (A–E) Three-dimensional micro-computed tomography (μCT) images (A) and quantitative analysis of structural parameters of subchondral bone: bone volume/tissue volume (BV/TV, %) (B), trabecular thickness (Tb.Th, mm) (C), subchondral bone plate thickness (SBP. Th, mm) (D) and trabecular number (Tb.N, mm–1) (E). (F) Safranin O-fast green staining of the tibia subchondral bone medial compartment (sagittal view). Scale bar, 200 μm (G) Calculation of Osteoarthritis Research Society International (OARSI) scores. *p<0.05, **p<0.01 and ***p<0.001. Statistical significance was determined by multifactorial ANOVA. All data are shown as means ± standard deviations. (H) COX2 inhibitor user (i–iv) and nonselective nonsteroidal anti-inflammatory drug (NSAID) user (v-viii) baseline and follow-up radiographs and magnetic resonance images of patients with metabolic syndrome (MetS)-associated osteoarthritis phenotype (MetS+). Weightbearing posteroanterior radiograph of the right knee using fixed flexion protocol of a 64-year-old MetS+ woman with COX2 inhibitor use at baseline (i) and at 24-month follow-up (ii). Sagittal intermediate-weighted fat-suppressed MRI sequences in the same knee of COX2 inhibitor user patient at baseline (iii) and at 24-month follow-up (iv). Weightbearing posteroanterior radiograph of the left knee using fixed flexion protocol of a 62-year-old MetS+woman with nonselective NSAID use at baseline (v) and at 24-month follow-up (vi). Sagittal intermediate-weighted fat-suppressed MRI sequences in the same knee of nonselective NSAID use patient at baseline (vii) and at 24-month follow-up (viii).
Author response image 1
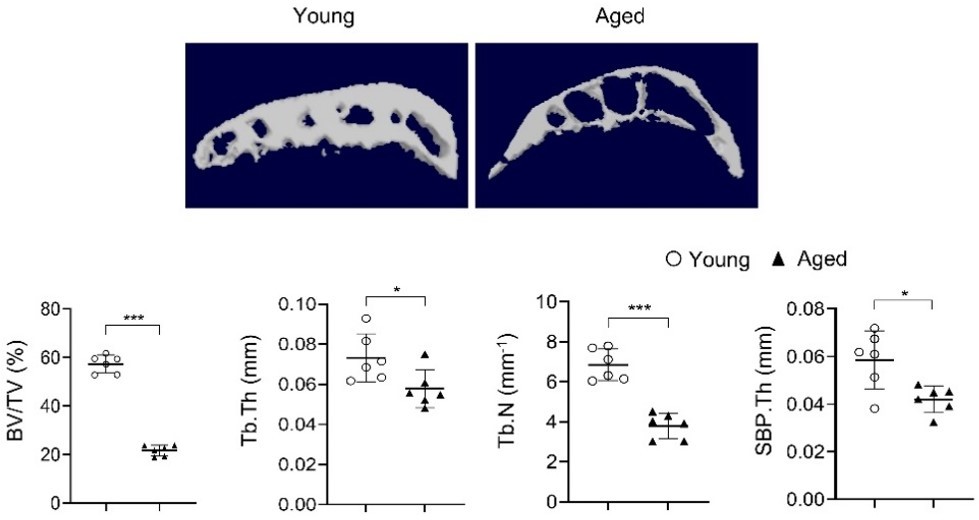
Subchondral bone changes in aged mice relative to young mice.
Tables
Table 1
Longitudinal comparison of the standard knee OA outcomes and subchondral BML worsening between human participants with MetS-OA and their matched PTOA participants (MetS+ PTOA– versus PTOA+ MetS–).
| PS-matched MetS-OA versus PTOA participants | |
|---|---|
| Knee OA standard outcomes | Hazard ratio (95% Confidence Interval), p-value, Sample size, Number of events* [MetS-OA: PTOA] |
| Knee OA incidence | 0.89 (0.56–1.41), p:0.609, N:184 (92:92), Event [34:36] |
| Knee OA progression | 1.04 (0.73–1.49), p:0.822, N:316 (158:158), Event [65:62] |
| Symptomatic incidence (NASS) | 0.95 (0.54–1.67), p:0.859, N:338 (169:169), Event [28:30] |
| Subchondral BML Worsening (MOAKS) | Odds ratio (95% Confidence Interval), P-value, N:338 (169:169), Number of events* [MetS-OA: PTOA] |
| Worsening in number of affected subregions with BML | 1.37 (1.06–1.77), p:0.015 Improvement, [16:31] No change, [92:84] Worsening, [61:54] |
| Worsening in the number of affected subregions | 0.44 (0.22–0.87), p:0.018 Yes, [31:16] |
| Maximum worsening in BML score | 1.17 (0.85–1.6), p:0.337 No change, [83:91] Worsening by ≤1 grade, [59:54] by ≥2 grades, [27:24] |
| Improvement in the subregions' BML score | 0.82 (0.51–1.30), p:0.389 Yes, [90:98] |
-
Standard OA outcomes (baseline to 8th year) and validated MOAKS measures of subchondral BML worsening (between baseline and 24 month visit) were assessed between knees of participants with MetS-OA and their PS-matched knees of participants with PTOA. Cox proportional hazards were used for standard OA outcomes, and participants had a mean follow-up duration of 6.9 years (median and 1st and 3rd quartiles of 8 years). and logistic mixed-effect regression models were used for subchondral BML assessments. Knees of participants were matched for confounders using the 1:1 PS matching method. All analyses were adjusted for the baseline Kellgren-Lawrence (KL) and Osteoarthritis Research Society International medial joint space narrowing (OARSI JSN) grades of knees. Standard OA outcomes included knee OA incidence defined by KL grade ≥2 in participants with KL equal to 0–1, knee OA progression defined by partial or whole grade progression in OARSI JSN grade, and knee OA symptomatic incidence measured by NASS. Subchondral BML worsening was assessed using standard MOAKS measures. N corresponds to the total number of knees included in each analysis and the number of matched knees of MetS-OA and PTOA participants in the parenthesis.
-
*
Number of events for each outcome has been shown separately for participants with MetS-OA and PTOA in the brackets.
-
BML: Bone marrow lesion, COX2I: Cyclooxygenase 2 inhibitor, MetS: metabolic syndrome, MOAKS: MRI Osteoarthritis Knee Score, NASS: non-acceptable symptomatic state, PS: propensity score, OA: osteoarthritis.
Table 2
Longitudinal comparison of standard knee OA outcomes between human COX2 inhibitor users vs. non-selective NSAID users according to the presence of MetS.
| COX2I users vs. non-selective NSAID usersHazard ratio (95% Confidence Interval), p-value, Sample size,Number of events* [COX2I: NSAID] | ||
|---|---|---|
| MetS-OA+ | MetS-OA– | |
| Knee OA incidence | 0.42 (0.04–4.77), p:0.487, N: 30 (15:15), Events* [2:3] | 0.62 (0.13–2.84), p:0.537, N: 118 (59:59), Events* [5:9] |
| Knee OA progression | 0.18 (0.04–0.85), p:0.030, N: 94 (47:47), Events* [2:8] | 0.96 (0.53–1.74), p:0.886, N: 266 (133:133), Events* [21:23] |
| Symptomatic incidence (NASS) | 0.8 (0.27–2.4), p:0.689, N: 108 (54:54), Events* [2:3] | 1.56 (0.63–3.89), p:0.337, N: 324 (162:162), Events* [18:12] |
-
COX2I: cyclooxygenase 2 inhibitor, MetS: metabolic syndrome, NASS: non-acceptable symptomatic state, NSAID: Non-Steroidal Anti-Inflammatory Drug, OA: Osteoarthritis. Standard OA outcomes were compared between knees of COX2 inhibitor users vs. matched non-selective NSAID users. Analysis was stratified analysis for the presence of MetS-associated OA (MetS-OA+ vs. MetS-OA–). Cox proportional hazards were used. Knees of participants were matched for confounders using the 1:1 propensity-score matching method. Events are knee OA incidence defined by Kellgren-Lawrence (KL) grade ≥2 in participants with KL equal to 0–1, knee OA progression defined by partial or whole grade progression in Osteoarthritis Research Society International medial joint space narrowing grade, and knee OA symptomatic incidence measured by NASS. The mean follow-up duration for standard knee OA outcomes was 4.4 years (median: 4 years, 1st and 3rd quartiles of 1 and 8 years). N corresponds to the total number of knees included in each analysis and the number of matched knees of COX2 inhibitor users vs. non-selective NSAID users in the parentheses.
-
*
Number of events for each outcome has been shown separately in the brackets for COX2 inhibitor users and non-selective NSAID users.
Table 3
Longitudinal comparison of subchondral BML worsening between human COX2 inhibitor users vs. non-selective NSAID users with MetS-OA.
| Subchondral BML Worsening (MOAKS) | COX2 inhibitor users vs. non-selective NSAID users with MetS-OA | |
|---|---|---|
| Odds ratio (95% Confidence Interval), p-value, Sample size | Number of events in each group[COX2 inhibitor: NSAID]* | |
| Worsening in number of affected subregions with BML | 0.35 (0.13–0.93), p:0.035, N: 88 (44:44) | Improvement, [3:2] No change, [14:9] Worsening, [27:33] |
| Improvement in number of affected subregions | 1.21 (0.19–7.72), p:0.839, N: 88 (44:44) | Yes, [3:2] |
| Maximum worsening in BML score | 0.45 (0.2–0.99), p:0.046, N: 88 (44:44) | No change, [18:9] Worsening by ≤1 grade, [22:27] by ≥2 grades, 4:8 |
| Improvement in the subregions' BML score | 1.28 (0.33–5.00), p:0.722, N: 88 (44:44) | Yes, [9:6] |
-
Among the PS-matched COX2 inhibitor users and non-selective NSAID users with MetS-OA, participants with available baseline and 24-month follow-up MRIs were included. A musculoskeletal radiologist read and scored MRIs according to validated MOAKS measures of subchondral BML worsening. Logistic mixed-effect regression models were used for subchondral BML assessments. All analyses were adjusted for the baseline Kellgren-Lawrence (KL) and Osteoarthritis Research Society International medial joint space narrowing (OARSI JSN) grades of knees. Subchondral BML worsening was assessed using standard MOAKS measures. N corresponds to the total number of knees included in each analysis and the number of matched knees of MetS-OA and PTOA participants in the parenthesis.
-
*
Number of events for each outcome has been shown separately in the brackets for COX2 inhibitor users and non-selective NSAID users.
-
BML: Bone marrow lesion, MetS: metabolic syndrome, MOAKS: MRI Osteoarthritis Knee Score, NSAID: Non-Steroidal Anti-Inflammatory Drug, OA: osteoarthritis.
Author response table 1
Result of PS-matching MetS+ and MetS- participants once with BMI inclusion in the PS-matching covariates and once without including BMI.
With BMI in the matching model, MetS+ participants have lower mean KL grades, and without its inclusion, MetS+ participants have higher mean KL grades.
| All OAI subjects | Matched subjects without BMI in matching | Matched subjects with BMI in matching | |||||||
|---|---|---|---|---|---|---|---|---|---|
| MetS– | MetS+ | MetS– | MetS+ | MetS– | MetS+ | ||||
| 7459 | 1810 | SMD | 1803 | 1803 | SMD | N: 1800 | N: 1800 | SMD | |
| Variables included in the PS matching model | |||||||||
| Age (year) [mean (SD)] | 60.38 (9.09) | 64.94 (8.49) | 0.52 | 65.22 (8.95) | 64.90 (8.48) | 0.04 | 65.12 (8.47) | 64.87 (8.46) | 0.03 |
| Sex, Female, N (%) | 4426 (59.3) | 985 (54.4) | 0.10 | 1043 (57.8) | 985 (54.6) | 0.07 | 1014 (56.3) | 983 (54.6) | 0.04 |
| Non-white race [N (%)] | 1468 (19.7) | 494 (27.3) | 0.18 | 439 (24.4) | 487 (27.0) | 0.06 | 481 (26.8) | 488 (27.1) | 0.01 |
| BMI (kg/m2) [mean (SD)] | 28.23 (4.78) | 30.71 (4.43) | 0.54 | 28.09 (4.52) | 30.72 (4.43) | 0.59 | 30.51 (4.53) | 30.69 (4.43) | 0.04 |
| Smoking, current smoker [N (%)] | 517 (6.9) | 120 (6.6) | 0.01 | 113 (6.3) | 120 (6.7) | 0.02 | 107 (5.9) | 120 (6.7) | 0.03 |
| Alcohol use, ≥1/week [N (%)] | 3250 (43.6) | 698 (38.6) | 0.10 | 689 (38.2) | 698 (38.7) | 0.01 | 733 (40.7) | 696 (38.7) | 0.04 |
| PASE score [mean (SD)] | 165.42 (83.48) | 141.00 (76.02) | 0.31 | 137.63 (72.17) | 141.25 (76.03) | 0.05 | 143.72 (78.12) | 141.42 (75.89) | 0.03 |
| Variables not included in the PS matching model | |||||||||
| KL grade, N (%) | 0.21 | 0.12 | 0.11 | ||||||
| Grade 0 | 2875 (38.5) | 540 (29.8) | 634 (35.2) | 538 (29.8) | 511 (28.4) | 539 (29.9) | |||
| Grade 1 | 1318 (17.7) | 345 (19.1) | 317 (17.6) | 342 (19.0) | 283 (15.7) | 342 (19.0) | |||
| Grade 2 | 2019 (27.1) | 515 (28.5) | 496 (27.5) | 514 (28.5) | 549 (30.5) | 511 (28.4) | |||
| Grade 3 | 1005 (13.5) | 332 (18.3) | 296 (16.4) | 331 (18.4) | 375 (20.8) | 331 (18.4) | |||
| Grade 4 | 242 (3.2) | 78 (4.3) | 60 (3.3) | 78 (4.3) | 82 (4.6) | 77 (4.3) | |||
| Medial JSN score, N (%) | 0.22 | 0.17 | 0.04 | ||||||
| Grade 0 | 4625 (65.9) | 937 (55.9) | 1068 (63.4) | 933 (55.8) | 959 (57.1) | 936 (56.0) | |||
| Grade 1 | 1503 (21.4) | 431 (25.7) | 379 (22.5) | 430 (25.7) | 409 (24.4) | 427 (25.6) | |||
| Grade 2 | 742 (10.6) | 255 (15.2) | 205 (12.2) | 254 (15.2) | 265 (15.8) | 254 (15.2) | |||
| Grade 3 | 148 (2.1) | 54 (3.2) | 32 (1.9) | 54 (3.2) | 46 (2.7) | 54 (3.2) | |||
| WOMAC pain score (mean (SD)) | 2.35 (3.28) | 2.96 (3.56) | 0.18 | 2.43 (3.27) | 2.96 (3.56) | 0.16 | 2.75 (3.62) | 2.95 (3.56) | 0.06 |
| Cardio/Cerebrovascular diseases, N (%) | 239 (3.3) | 196 (11.4) | 0.31 | 79 (4.5) | 196 (11.4) | 0.26 | 82 (4.7) | 192 (11.2) | 0.24 |
| Hypertension [N (%)] | 2704 (36.3) | 1734 (95.8) | 1.62 | 750 (41.6) | 1728 (95.8) | 1.44 | 829 (46.1) | 1724 (95.8) | 1.31 |
| Diabetes Mellitus [N (%)] | 86 (1.2) | 646 (36.7) | 1.02 | 18 (1.0) | 641 (36.5) | 1.02 | 13 (0.7) | 636 (36.3) | 1.03 |
| Dyslipidemia [N (%)] | 1010 (13.5) | 1599 (88.3) | 2.26 | 257 (14.3) | 1594 (88.4) | 2.21 | 272 (15.1) | 1591 (88.4) | 2.16 |
| Abdominal obesity [N (%)] | 6293 (84.6) | 1810 (100.0) | 0.60 | 1535 (85.4) | 1803 (100.0) | 0.58 | 1659 (92.6) | 1800 (100.0) | 0.40 |
Additional files
-
Supplementary file 1
Human osteoarthritis initiative datasets used in the study.
(A) Baseline characteristics of the participants according to presence of metabolic syndrome-associated OA (MetS+ PTOA– versus PTOA+ MetS–) before and after propensity score matching.(B) Baseline characteristics of human COX2 inhibitor and non-selective NSAID users included in the study, before and after propensity score matching. Matched participants were includde in the analysis of COX2 inhibitor use association with OA outcomes, according to its phenotype.(C) Osteoarthritis Initiative (OAI) datasets used in the study. (D) Flowchart outlining the selection criteria and PS-matching process according to the presence of metabolic syndrome-associated OA (MetS-OA) and post-traumatic OA (PTOA) in Osteoarthritis initiative participants. (E) Flowchart outlining the selection criteria and PS-matching process of human COX2 inhibitor and non-selective NSAID users from the Osteoarthritis initiative dataset.
- https://cdn.elifesciences.org/articles/79773/elife-79773-supp1-v2.docx
-
MDAR checklist
- https://cdn.elifesciences.org/articles/79773/elife-79773-mdarchecklist1-v2.pdf
Download links
A two-part list of links to download the article, or parts of the article, in various formats.
Downloads (link to download the article as PDF)
Open citations (links to open the citations from this article in various online reference manager services)
Cite this article (links to download the citations from this article in formats compatible with various reference manager tools)
Senescent preosteoclast secretome promotes metabolic syndrome associated osteoarthritis through cyclooxygenase 2
eLife 11:e79773.
https://doi.org/10.7554/eLife.79773


