Comprehensive phylogenetic analysis of the ribonucleotide reductase family reveals an ancestral clade
- Department of Chemistry and Chemical Biology, Cornell University, United States
- Research School of Chemistry, Australian National University, Australia
- Australian Research Council Centre of Excellence for Innovations in Peptide and Protein Science, Australian National University, Australia
- Australian Research Council Centre of Excellence in Synthetic Biology, Australian National University, Australia
Figures
Figure 1 with 1 supplement
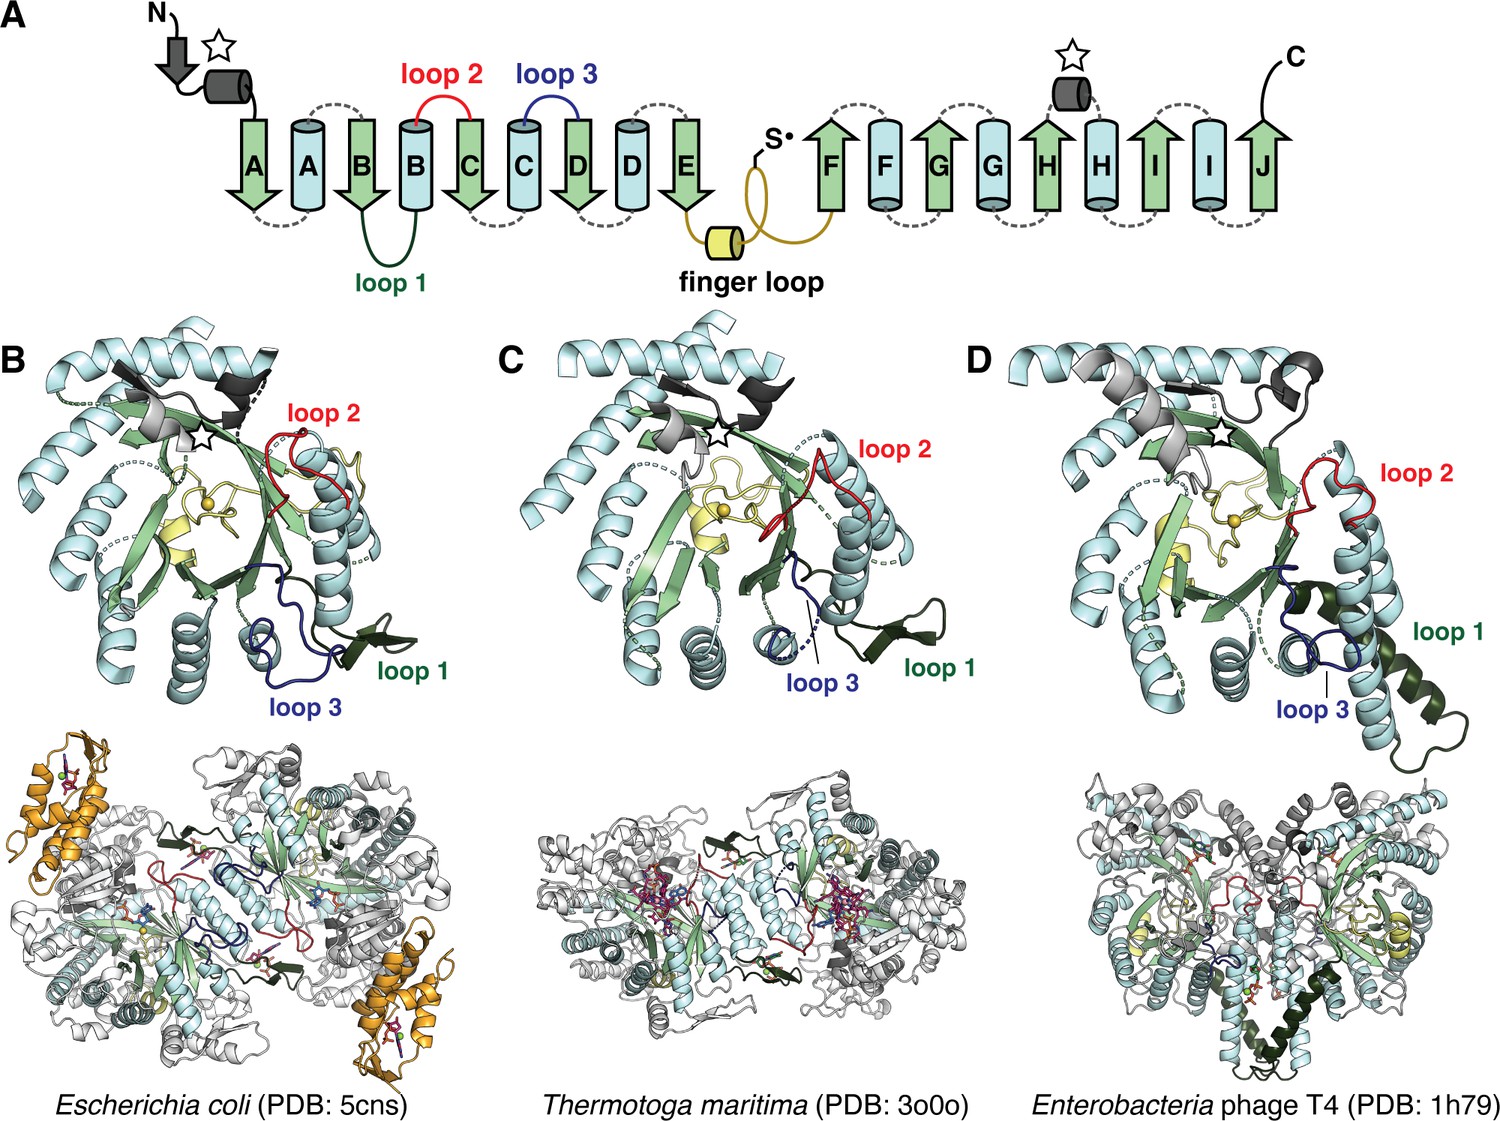
The catalytic fold of the ribonucleotide reductase (RNR) family is a unique 10-stranded ɑ/β barrel, consisting of 10 β-strands (light green) and 8 ɑ-helices (light blue).
(A) Each half of the barrel contains a five-stranded parallel β-sheet (βA-βE and βF-βJ) that is arranged in anti-parallel orientation with respect to each other. The two halves are connected by the so-called ‘finger loop’ (yellow) which typically begins with a short ɑ-helix and contains a conserved cysteine that has been shown to be the site of the catalytically essential thiyl radical in all biochemically characterized RNRs. Diversity among the RNRs is generated by N- and C-terminal extensions as well as the insertions (dashed curves) between the secondary structure elements in the ɑ/β barrel. Loops 1–3 (dark green, red, blue) have special names in the RNR literature for their involvement in specificity regulation. The gray secondary structure elements (starred) are partially integrated in the ɑ/β barrel and are involved in substrate binding. (B) The barrel portion (top) of the Escherichia coli class Ia catalytic subunit (bottom dimer). The ATP-cone domain is colored in orange. (C) The barrel portion (top) of the Thermotoga maritima class II catalytic subunit (bottom dimer). (D) The barrel portion (top) of the T4 phage class III catalytic subunit (bottom dimer). In class III RNRs, the loop 1 region (dark green) is a long helix that is involved in dimerization.
Figure 1—figure supplement 1
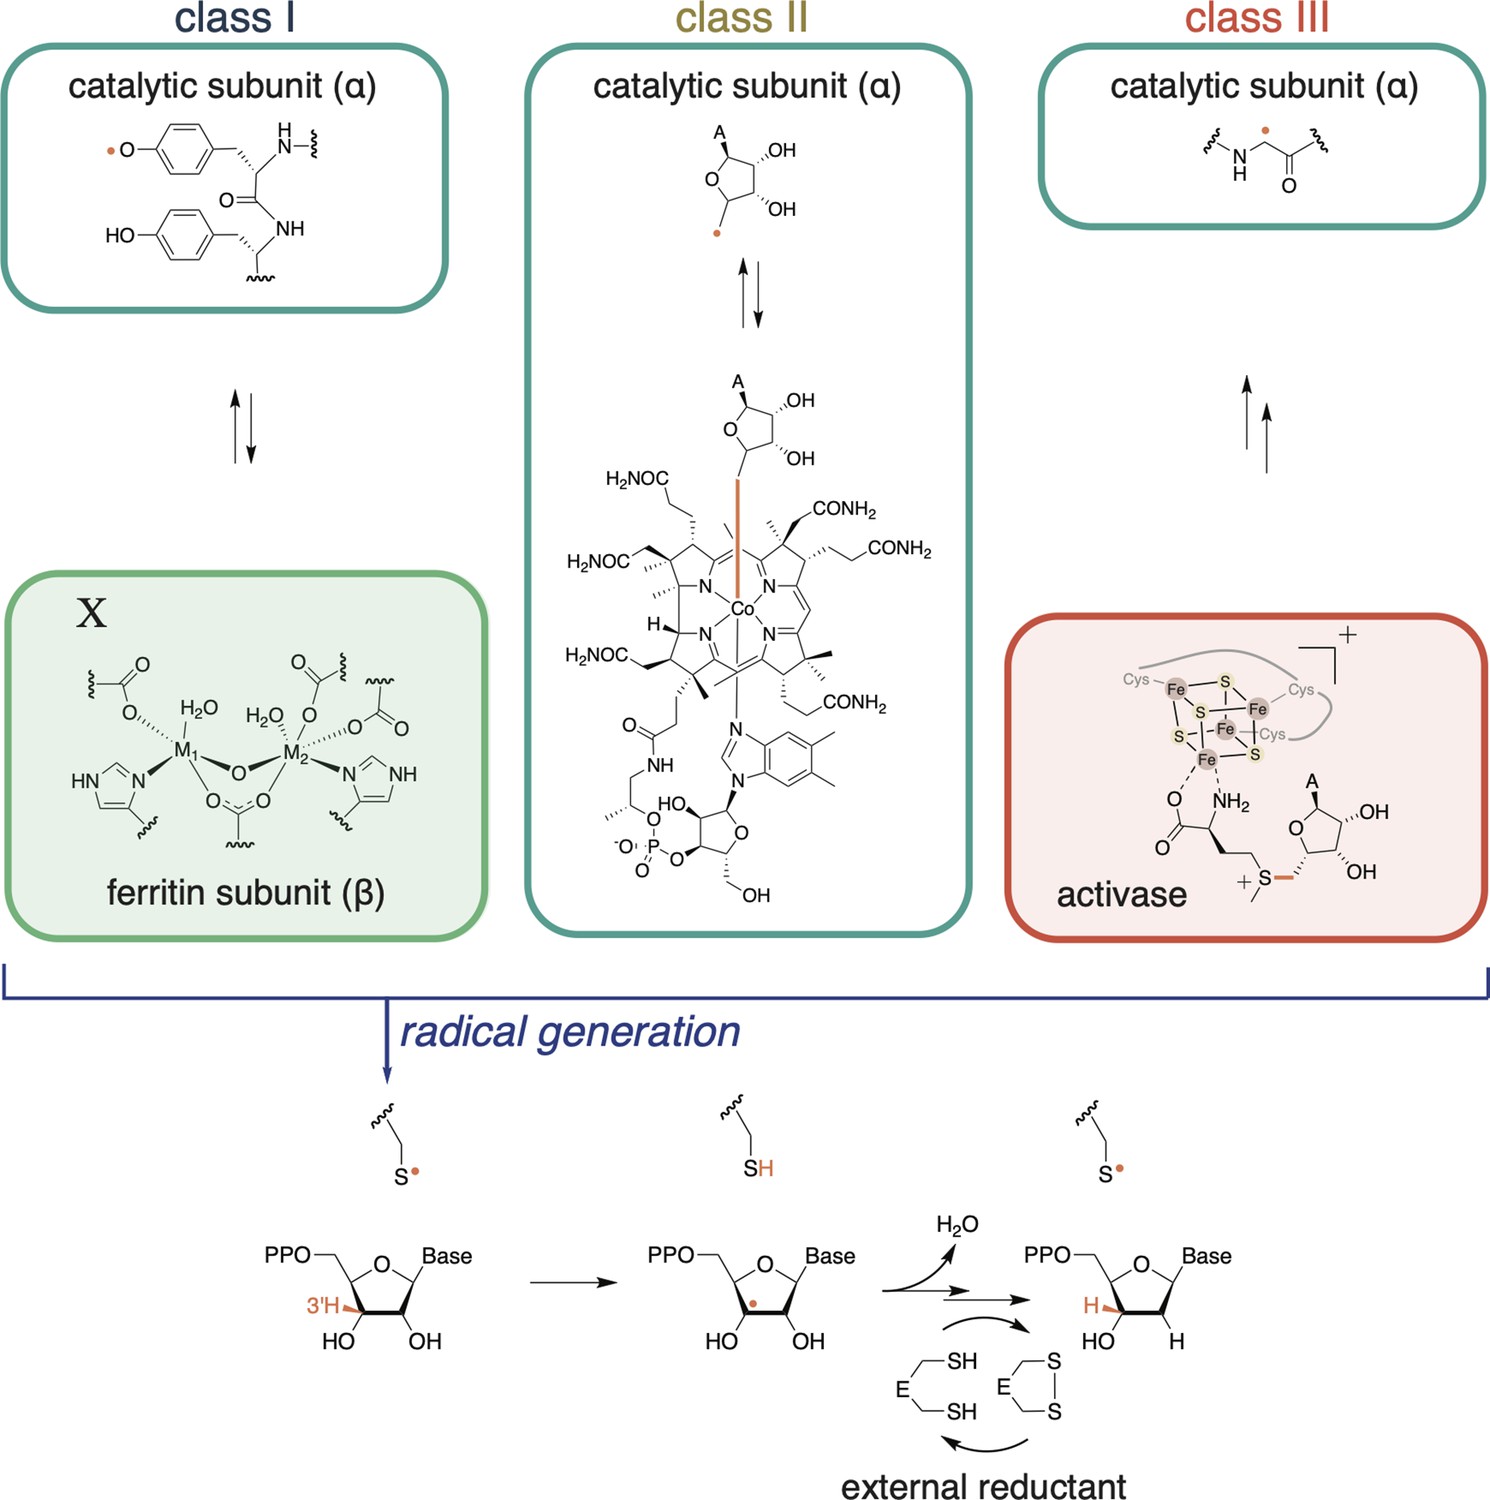
Ribonucleotide reductases (RNRs) catalyze the reduction of ribonucleoside di- or tri-phosphates (NDPs or NTPs) to their respective deoxynucleotide forms (dNDPs or dNTPs).
The full catalytic cycle involves three steps: (1) cofactor-mediated generation of a thiyl radical, (2) nucleotide reduction, and (3) active-site reduction. In the first step, class I RNRs utilize a ferritin subunit, which has a characteristic metal-binding E/D+EXXH motif and a nearby residue, X. The residue X and the metal center together constitute the radical cofactor in class I RNRs. In most subclasses, X is a tyrosine, but it can also be a redox-inert residue like phenylalanine (e.g., as in class Ic RNRs) or a tyrosine post-translationally modified to dihydroxyphenylalaninine (DOPA) in class Ie RNRs. The metal ions (M1, M2) are typically Fe and/or Mn, although in class Ie RNRs, the metal-binding motif is not conserved and therefore unable to coordinate metals (Blaesi et al., 2018; Srinivas et al., 2018). Once the thiyl radical is generated, nucleotide reduction proceeds in a conserved manner. Reducing equivalents for nucleotide reduction are ultimately provided by external sources (redoxins or formate). In most RNRs, nucleotide reduction is coupled to the oxidation of a pair of active-site cysteines, which are subsequently reduced by thioredoxin, thioredoxin reductase, and NADPH. Some class III RNRs do not have this conserved cysteine pair, and they use formate as the external reductant (Wei et al., 2014b).
Figure 2 with 2 supplements
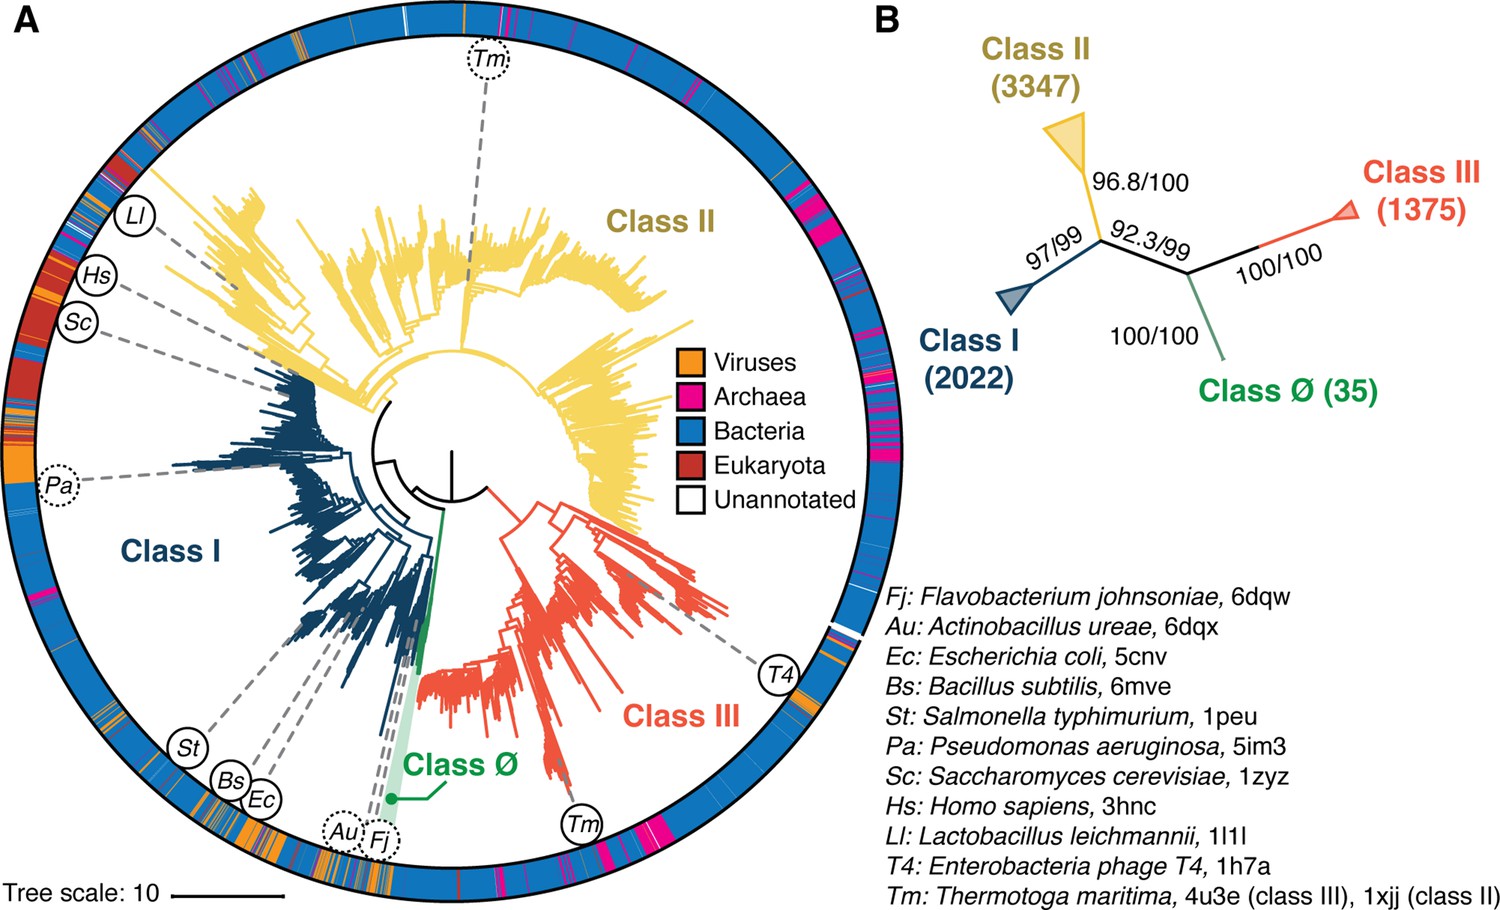
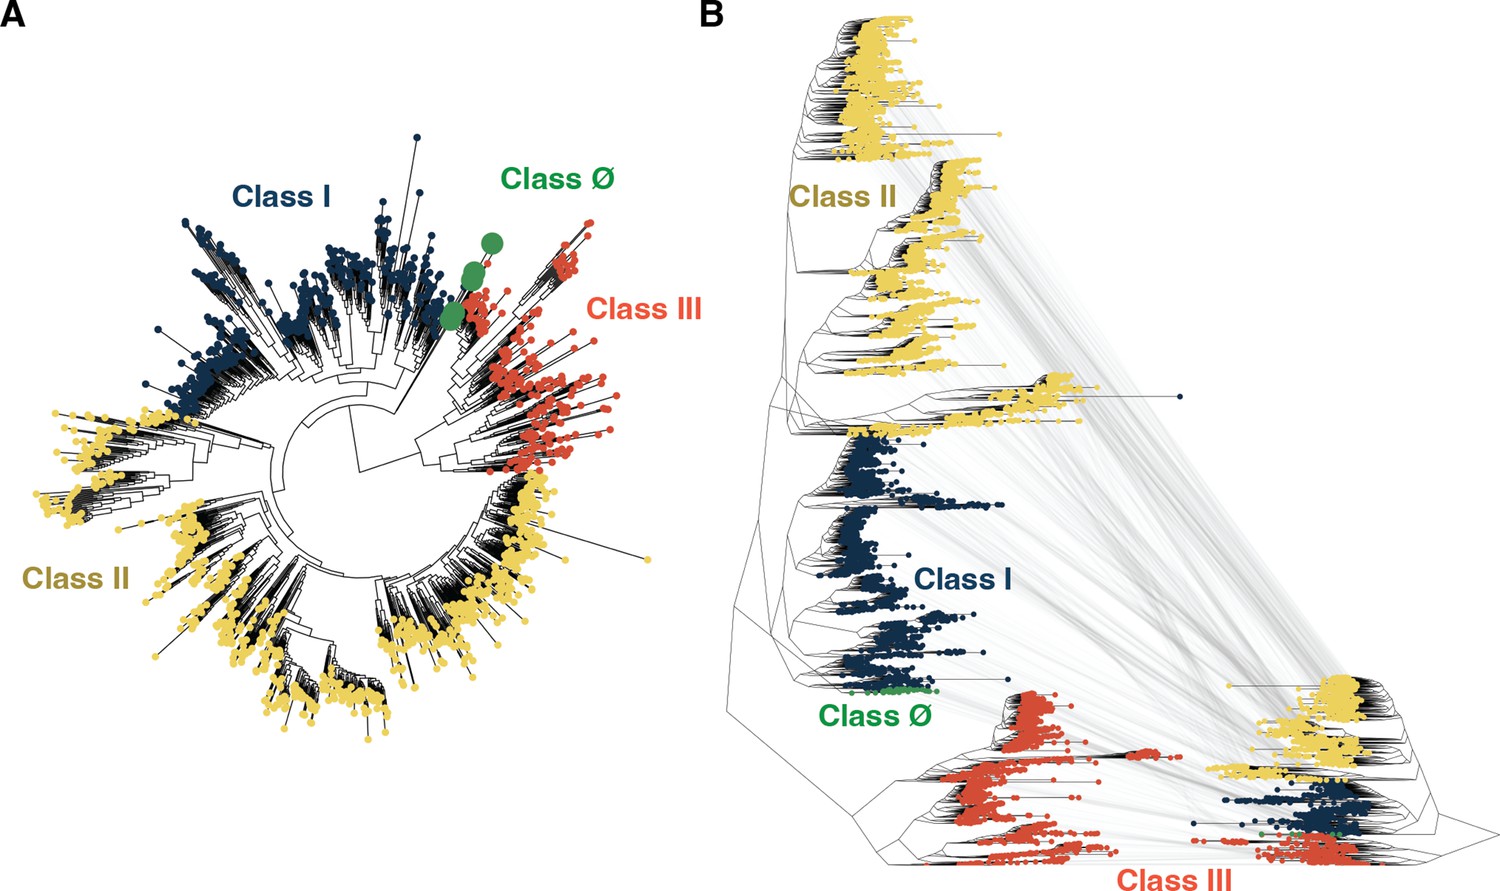
Phylogenetic reconstruction of the ribonucleotide reductase (RNR) family.
(A) A representative phylogeny of 6779 extant RNR ɑ sequences rooted at the midpoint. The superfamily forms four distinct lineages, with the three major clades (blue, yellow, red) corresponding to the three biochemically known classes I–III. Class III is the most distantly related clade (red). A small ancestral clade (green) forms an outgroup to the clades corresponding to classes I and II (blue and yellow, respectively). The scale bar represents the expected number of amino acid substitutions per site in the alignment. The taxonomic group each sequence belongs to is labeled by a color strip at the circumference. Sequences used for the structural alignment are mapped onto the tree by organism ID in circles. Organism IDs in dashed circles are ɑ sequences that were utilized in the structural alignment but were filtered in favor of more representative sequences for the tree inference and thus are not on the tree (see Methods). These structures are represented by closely related sequences with ≥80% sequence identity. (B) An unrooted representation of the RNR phylogeny with branch supports (UFboot/SH-ALRT statistics) for the placements of major lineages. Deep nodes in the RNR phylogeny are resolved with high confidence.
Figure 2—figure supplement 1
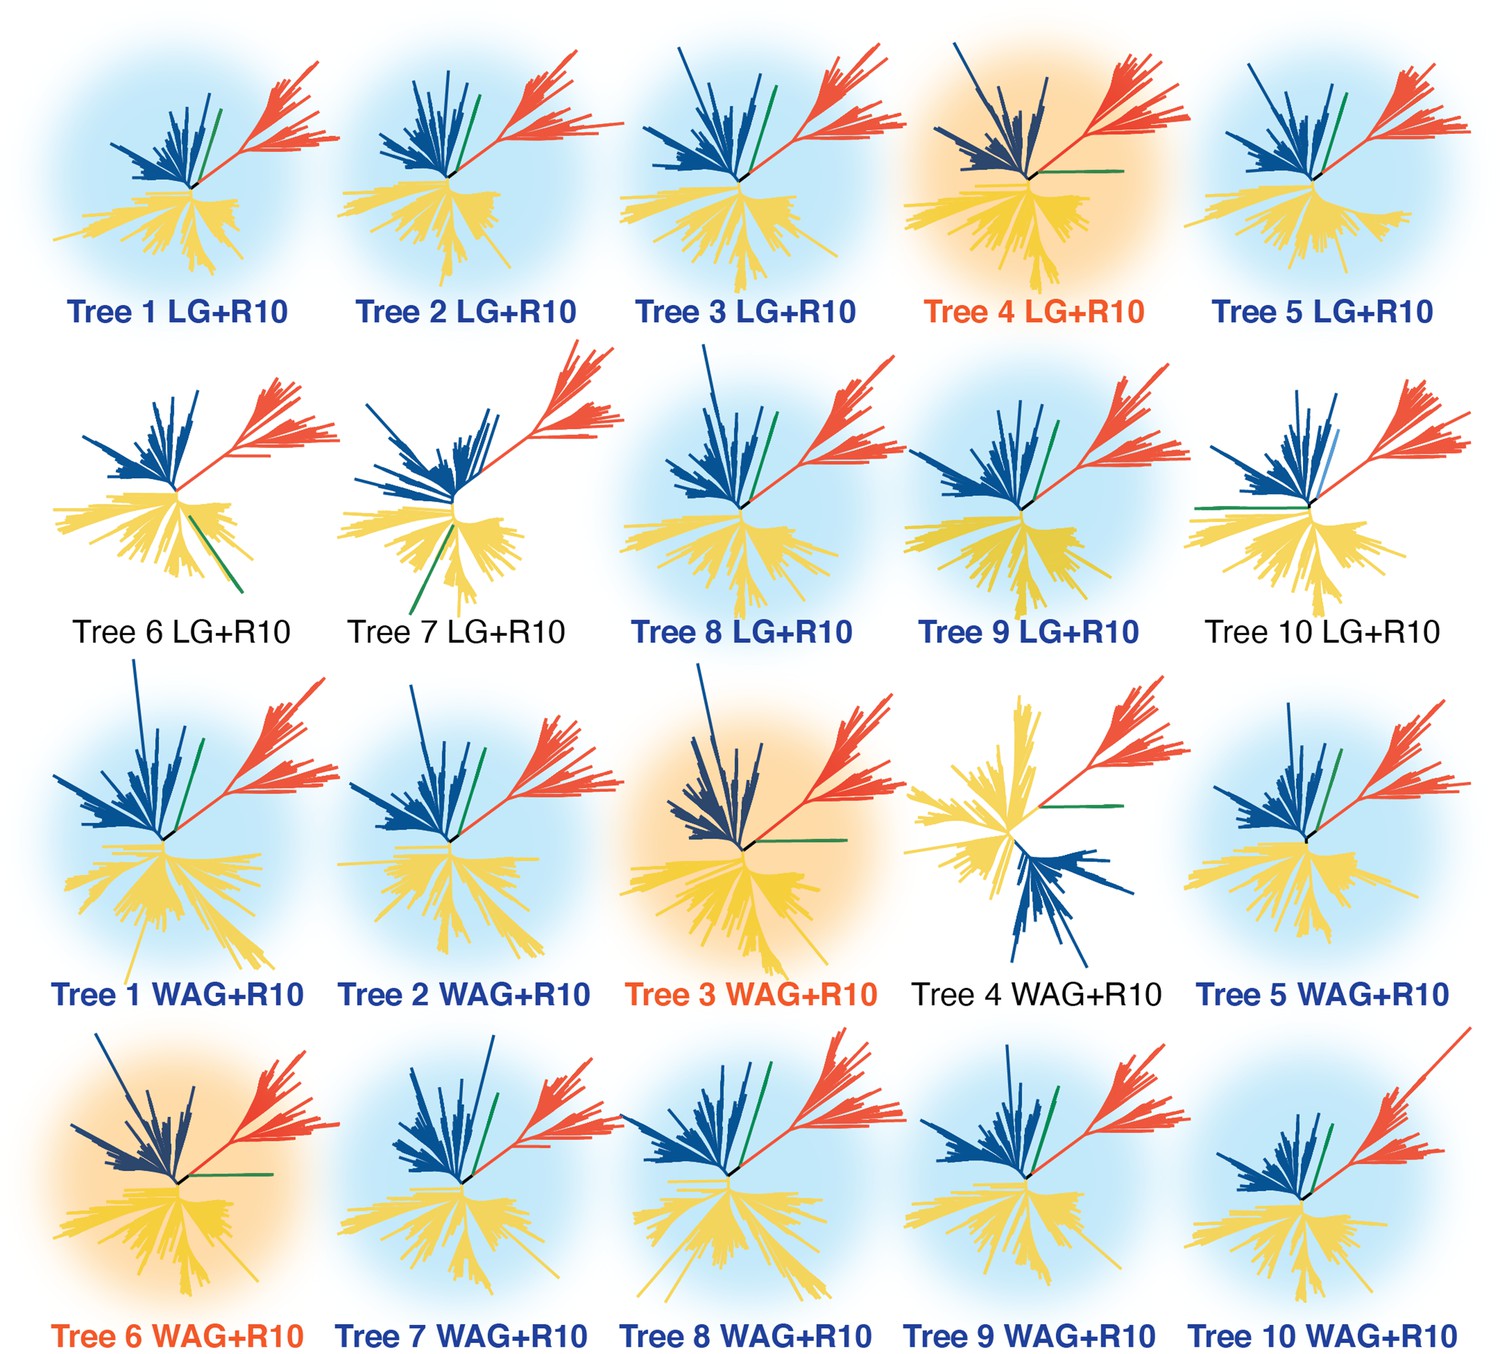
All 20 inferred phylogenies of the ribonucleotide reductase family shown in the unrooted representation.
Green, red, yellow, and blue branches are clade Ø and classes III, II, and I, respectively. Trees are labeled with the respective matrices of evolution used for the phylogenetic inference. The tree shown in Figure 2 and referenced throughout this work is tree 1. Trees with the light blue background support the overall topology shown in Figure 2 of the major classes. Trees with orange background show the second most frequently observed topology, where the midpoint places the class Ø clade ancestral to the class III clade. The four trees without a colored background cannot be categorized into either of the previously described topologies.
Figure 2—figure supplement 2
Tree inference is robust to sequence identity threshold.
(A) Tree inference on a ribonucleotide reductase (RNR) sequence dataset with redundancy reduced to 55% identity reconstructs class Ø sequences as ancestral to the last common ancestor of classes I and II, congruent with analyses performed at a higher redundancy threshold (see Methods). (B) The tree shown in Figure 2A (reproduced here on the left) is of identical topology to the tree inferred at a lower redundancy threshold (shown on the right). Identical sequences between the trees are mapped by gray lines. In both panels A and B, classes I, II, III, and Ø are colored as in Figure 2.
Figure 3
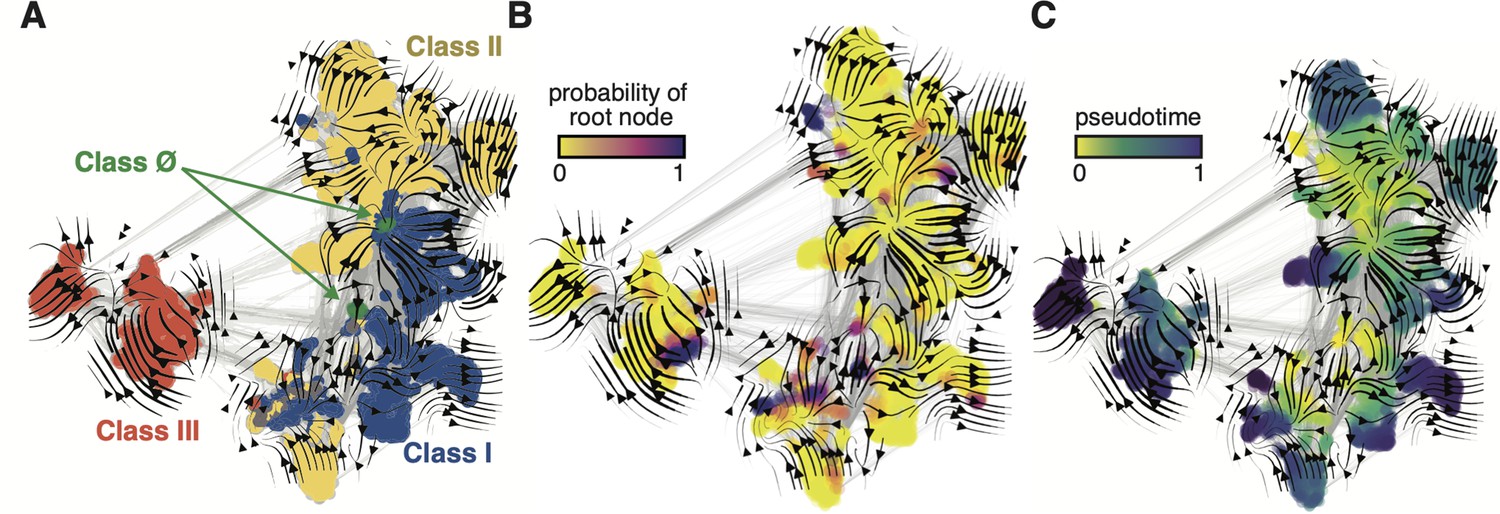
Evo-velocity analysis of the ribonucleotide reductase (RNR) family.
ESM-1b embedded RNR sequences were projected onto a two-dimensional vector plot, where the horizontal and vertical axes are uniform manifold approximation and projection (UMAP) 1 and 2, respectively. Each colored point in the plot corresponds to one of the 6779 ɑ sequences from the full RNR phylogeny. (A) Vector field plot colored by RNR classification: clade Ø (green), class I (blue), class II (yellow), class III (red). (B) Vector field plot colored by the probability of a sequence being a root of the sequence space, where purple sequences are the most likely to represent probable roots. (C) Vector field plot colored by pseudotime, a proxy for phylogenetic depth. Yellow (pseudotime = 0) represents ancestral sequences and indigo (pseudotime = 1) represents sequences that have diverged the most from ancestral sequences.
Figure 4 with 6 supplements
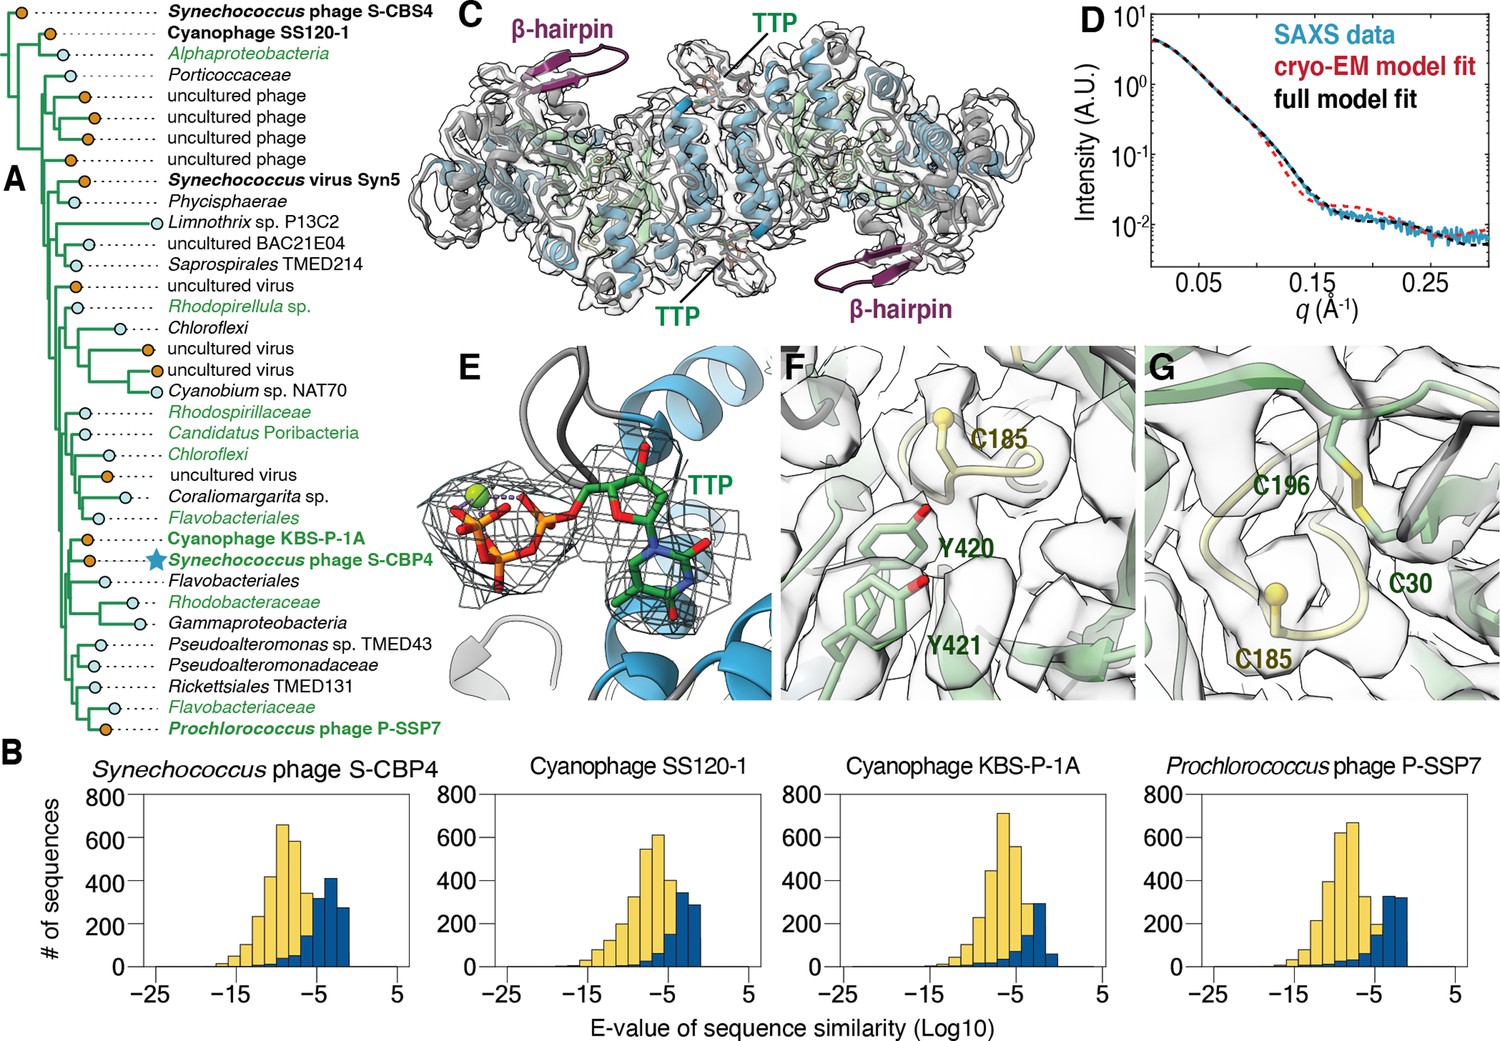
The class Ø ɑ subunit shares similarities with both class I and II ɑ subunits.
(A) An expansion of the class Ø clade from the full tree in Figure 2. Cyanophage sequences in this clade are bolded. Genomes with identified photosynthetic genes, psbA and psbD, are colored in green. (B) Representative results from an all-vs.-all pBLAST search of every class Ø sequence against all ribonucleotide reductase (RNR) ɑ sequences from other clades. Blue bars represent number of significant hits (E-values<10–3) of the title sequence to sequences in the class I clade. Yellow bars represent number of sequences from the class II clade. Overall, the class Ø clade shares greater homology with the class II RNRs. (C) A 3.46 Å cryogenic-electron microscopy (cryo-EM) map of the Synechococcus phage S-CBP4 ɑ subunit (shown at a threshold of 2.17) depicts a dimer with thymidine triphosphate (TTP) bound at the allosteric specificity sites. The β-hairpin (violet) is a shared trait of class I and II RNRs. (D) Experimental small-angle X-ray scattering (SAXS) profile (blue solid) of the Synechococcus phage S-CBP4 ɑ subunit in the presence of 200 μM TTP, 200 mM guanosine diphosphate (GDP) is explained well by the theoretical scattering of our cryo-EM model (red dashed). Model-data agreement is further improved by modeling the disordered N- and C-termini in AllosModFoXS (black dashed, see Methods) (Schneidman-Duhovny et al., 2010). Cryo-EM density for (E) TTP at the specificity site, (F) a stacked tyrosine dyad adjacent to the catalytic cysteine, and (G) the oxidized cysteine pair in the active site is shown at a threshold of 2.77.
Figure 4—figure supplement 1
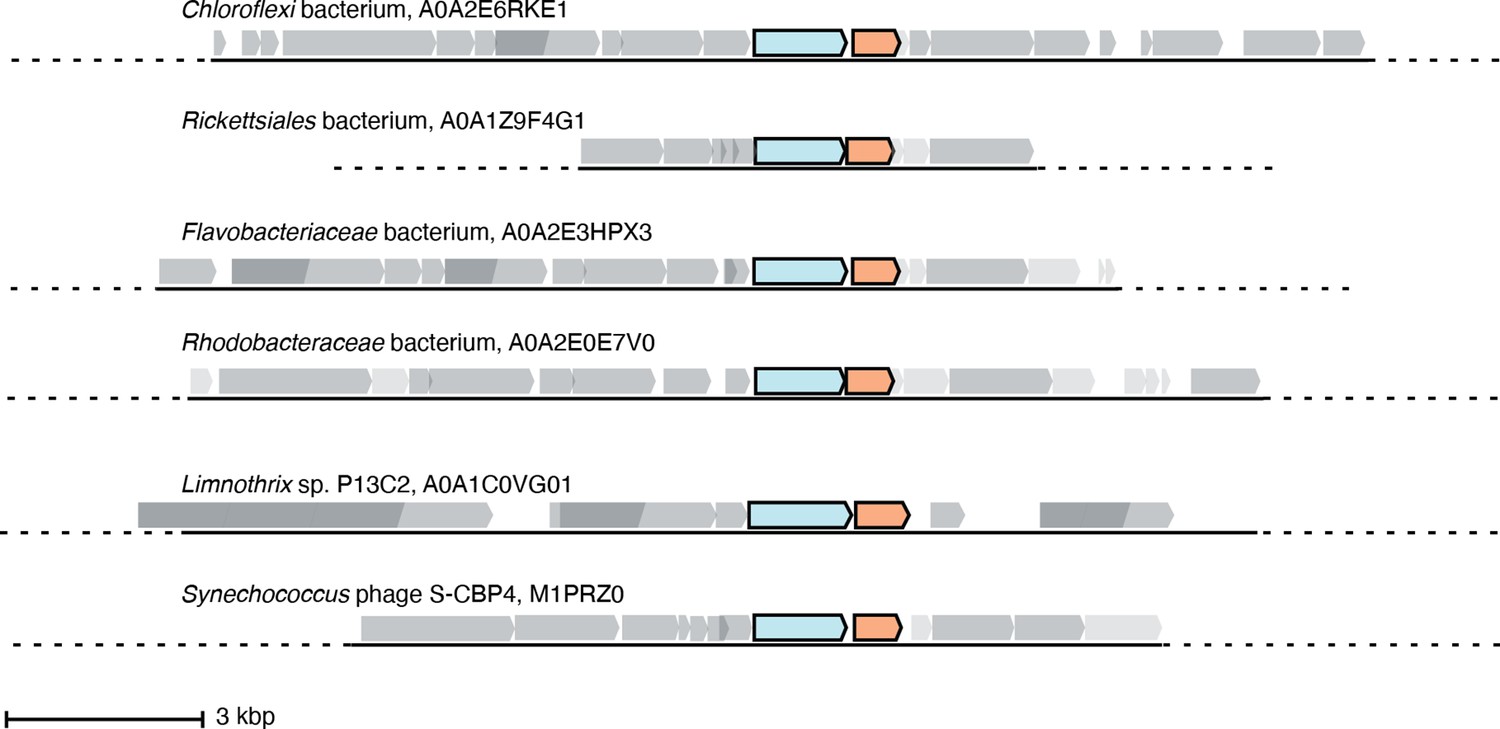
Six representative operons of class Ø sequences.
In sequenced organisms with high genome coverage, the ɑ gene (cyan) is followed by a gene for a small ferritin-like protein (orange). Of the 35 sequences in the class Ø clade, 24 are from sequenced genomes with greater coverage than a contig. Eighteen of these have annotated ferritin-like sequences (IPR009078) directly downstream of the ɑ gene in the operon, and six have unannotated genes that share homology with the class Ø ferritin-like gene directly downstream of the ɑ gene.
Figure 4—figure supplement 2
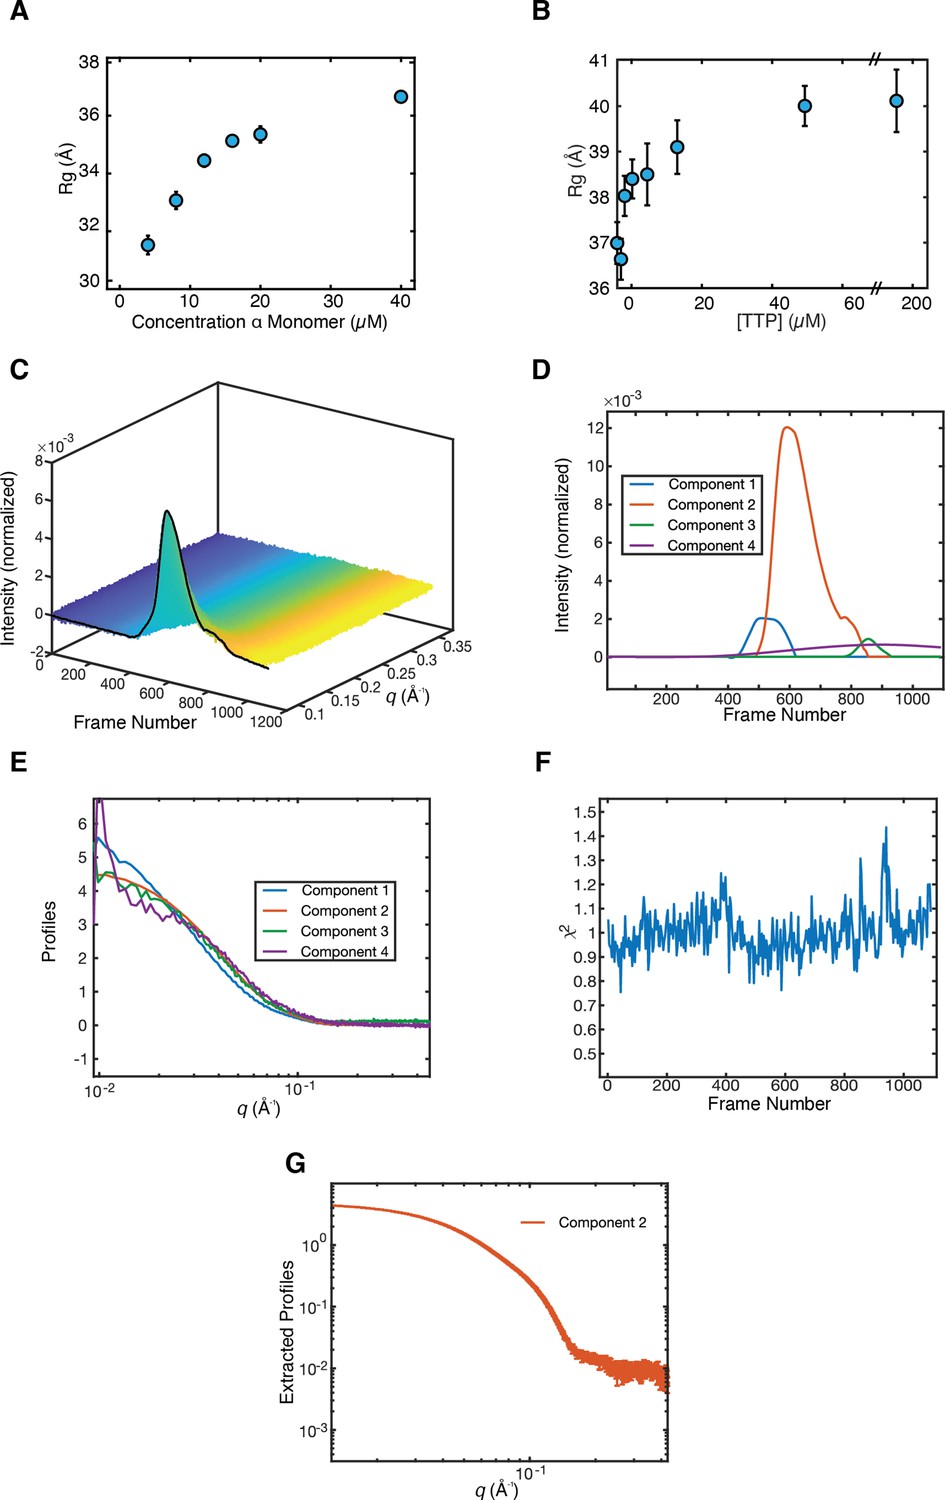
Synechococcus phage S-CBP4 ɑ is a stable dimer in the presence of nucleotides.
(A) The radius of gyration (Rg) of Synechococcus phage S-CBP4 ɑ in the absence of nucleotides as a function of protein concentration in solution shows a monomer-dimer equilibrium. (B) The Rg of 8 µM Synechococcus phage S-CBP4 ɑ in the presence of 200 µM guanosine diphosphate (GDP) as a function of thymidine triphosphate (TTP) concentration in solution is consistent with the stabilization of a dimer. Error bars in panels A and B represent fitting uncertainties from Guinier analysis, and where not visible are smaller than the data marker. The theoretical Rg values of Synechococcus phage S-CBP4 ɑ (based on the cryogenic-electron microscopy [cryo-EM] model with N- and C-termini added) are 26 and 37 Å, respectively, for monomer and dimer. (C) Size exclusion chromatography-coupled SAXS (SEC-SAXS) data collected on the Synechococcus phage S-CBP4 ɑ subunit in the presence of 200 µM TTP and 200 µM GDP. Singular value decomposition (SVD) of the background-subtracted SEC-SAXS data contained four significant singular values. REGALS (Meisburger et al., 2021) was used to decompose the dataset into (D) elution profiles and (E) SAXS profiles for a sloping background component (purple), a minor aggregate component (blue), a protein component (red), and one trailing component (green) representing buffer mismatch and radiation damage. The presence of a minor aggregate species explains the slightly elevated Rg values observed in panel B. (F) Residuals of REGALS decomposition from SEC-SAXS dataset. (G) Extracted SAXS profile for the Synechococcus phage S-CBP4 ɑ dimer shown in Figure 4D.
Figure 4—figure supplement 3
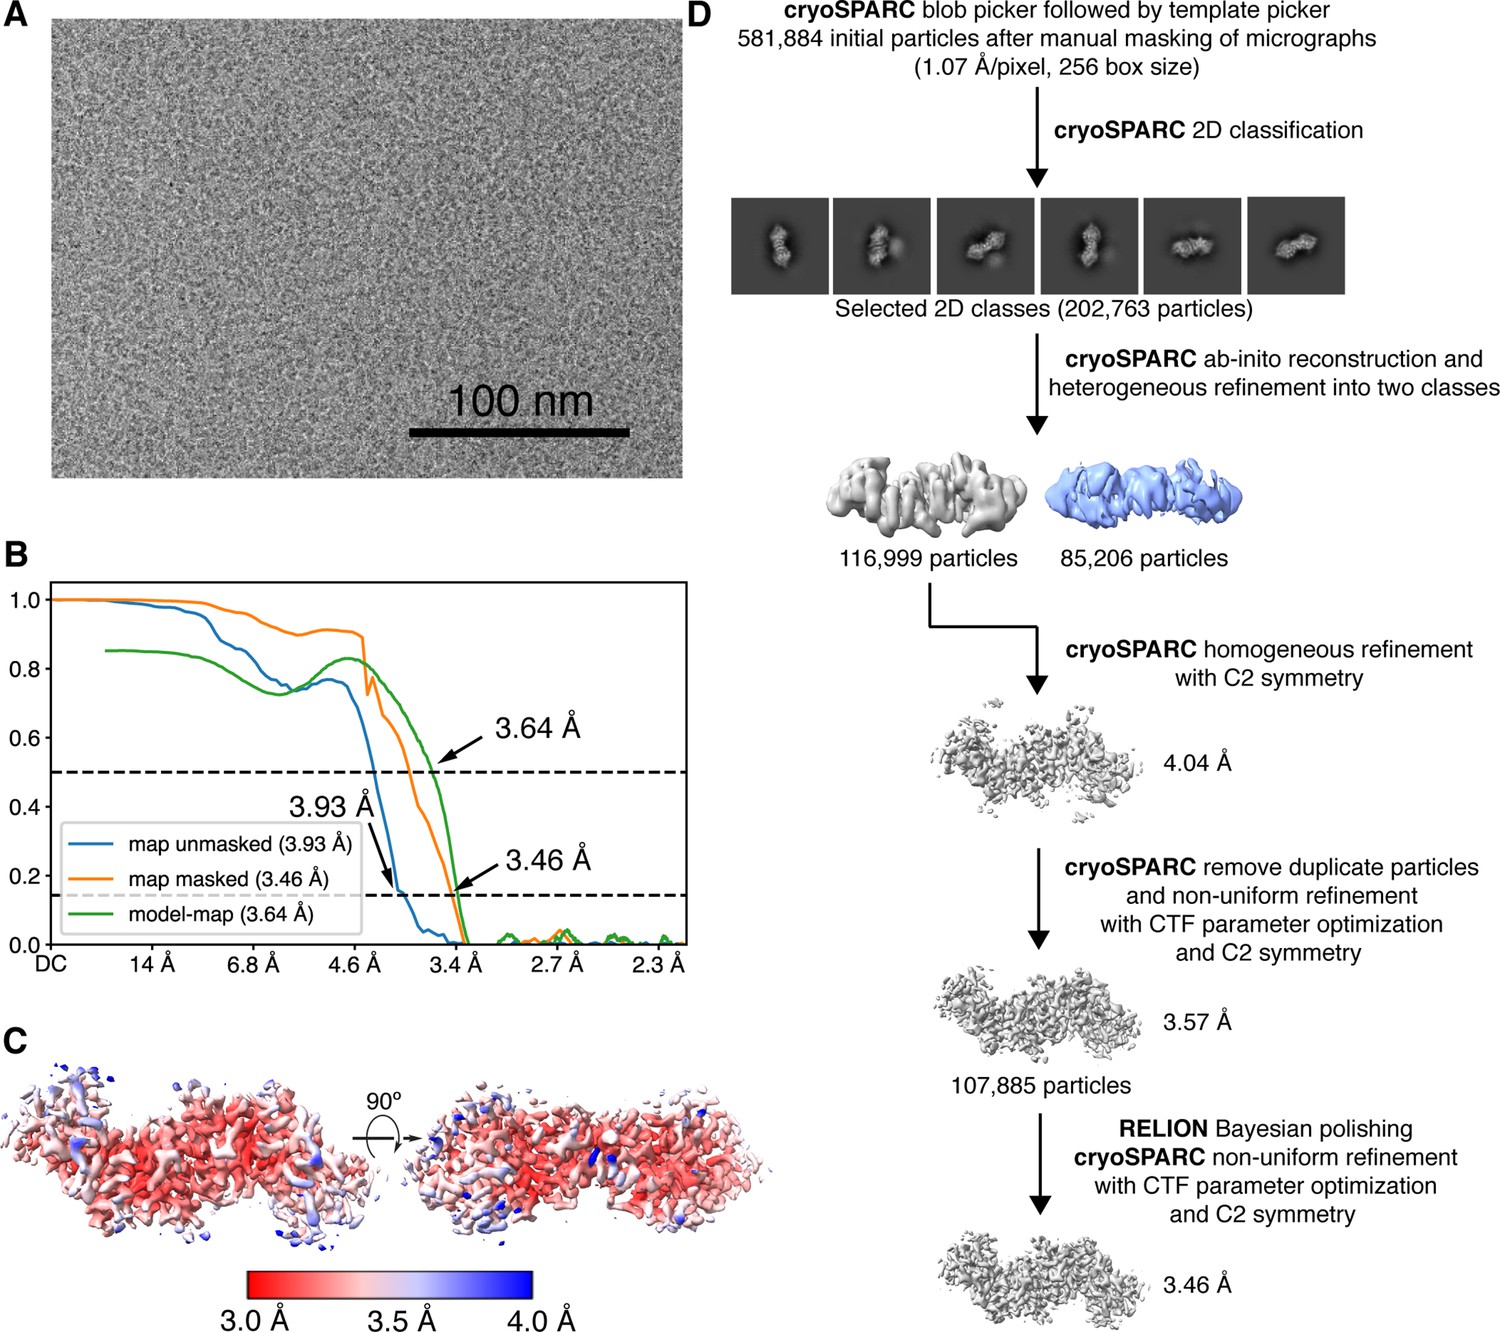
Cryogenic-electron microscopy (Cryo-EM) image processing workflow for reconstructing the 102 kDa Synechococcus phage S-CBP4 ɑ2 dimer.
(A) Representative micrograph used in processing. (B) Fourier shell correlation (FSC) curves for the final map with and without mask reported by cryoSPARC (Punjani et al., 2017) shown as blue and orange curves. The model-map FSC curve (green) was calculated for the deposited model (PDB: 7urg) and the sharpened map using PHENIX (Liebschner et al., 2019). (C) Local resolution estimation computed in cryoSPARC for the final map. (D) Data processing scheme used to obtain the final map.
Figure 4—figure supplement 4

The class Ø ɑ subunit features the most minimal ribonucleotide reductase (RNR) architecture discovered to-date.
Top: Topology of the Synechococcus phage S-CBP4 ɑ subunit monomer based on the cryogenic-electron microscopy (cryo-EM) model the minimal components of the RNR catalytic barrel colored as in Figure 1A. Only a few insertions are observed in the class Ø ɑ subunit (yellow orange, orange, and violet secondary structures). Bottom: The cryo-EM model of the Synechococcus phage S-CBP4 ɑ dimer with the same coloring as above.
Figure 4—figure supplement 5
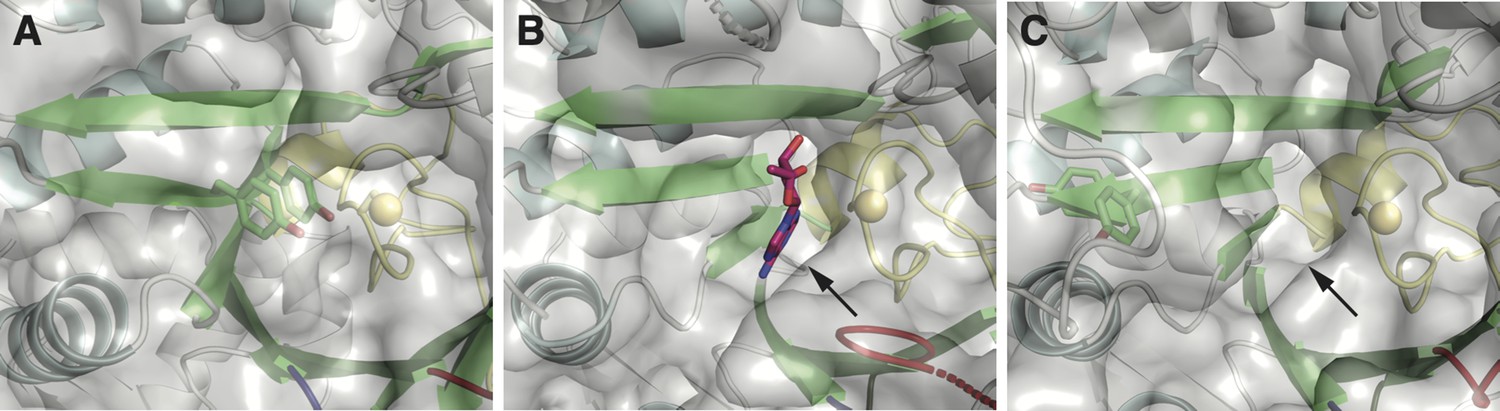
One structural difference between class I and II ɑ subunits is the packing of βJ residues next to the catalytic cysteine on the finger loop (yellow).
(A) Class I ribonucleotide reductases (RNRs) contain a double tyrosine motif (green sticks) on the βJ strand of the barrel. When stacked, the YY dyad packs against the finger loop, such that it is poised for proton-coupled electron transfer (PCET) with the catalytic cysteine (yellow sphere). Shown here is the crystal structure of the Escherichia coli class Ia RNR (PDB: 5cns) (Zimanyi et al., 2016). (B) In structures of class II RNRs (Larsson et al., 2010; Sintchak et al., 2002), there is a binding pocket (indicated by the arrow) for the adenosyl group (magenta sticks) of the adenosylcobalamin (AdoCbl) cofactor in the space adjacent to the finger loop (yellow). Shown here is the crystal structure of Thermotoga maritima class II RNR (ODB: 3o0o). This binding pocket is also found in apo structures that lack the cofactor. (C) The double tyrosine motif is also found in the βJ strand of some class II sequences. However, AlphaFold2 prediction of these sequences suggests that the tyrosines are unstacked and placed outside of the binding pocket for the adenosyl group (indicated by the arrow). Shown here is the predicted model for the class II RNR from Thermaerobacter marianensis (Uniprot: E6SMJ2).
Figure 4—figure supplement 6
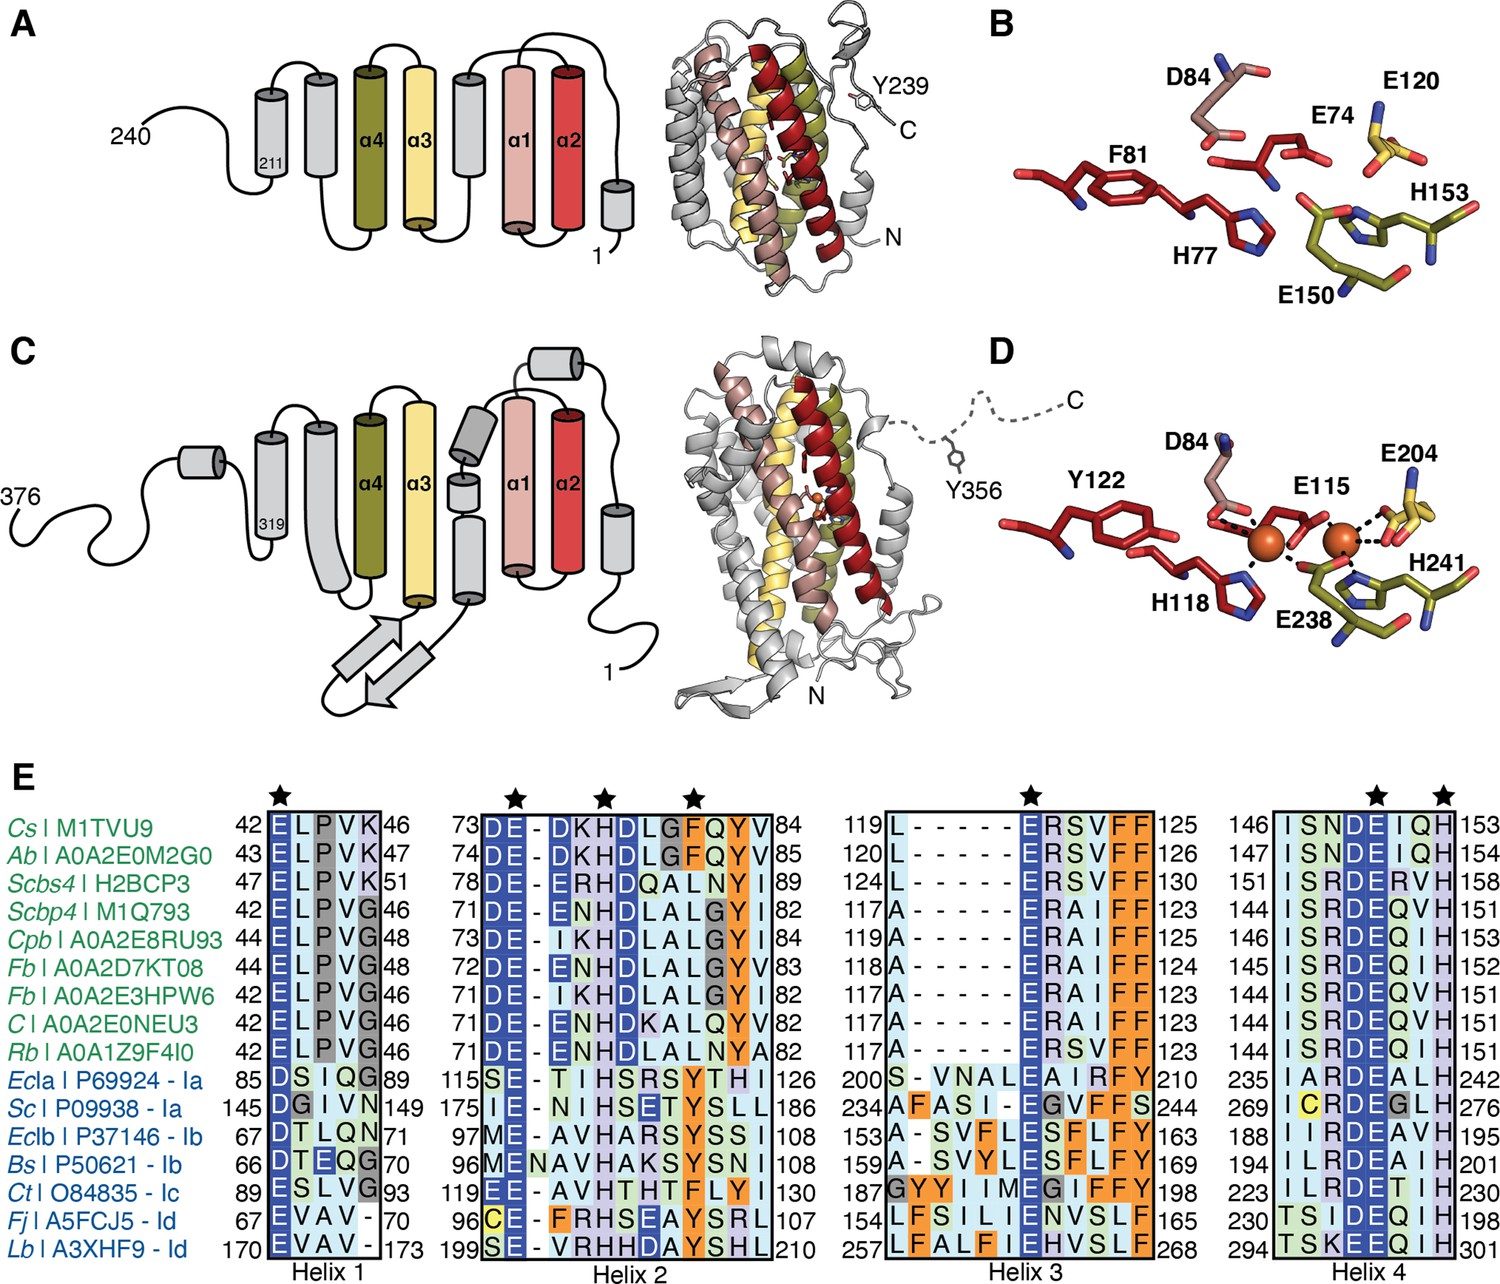
Comparison of class Ø ferritin-like proteins with class I ribonucleotide reductase (RNR) β subunits.
The four-helical bundle of the ferritin fold is colored in red, pink, yellow, and olive. (A) Topology (left) of an AlphaFold2 model (right) of a representative class Ø ferritin-like protein (Unitprot: M1TVU9) and (B) a close-up of the residues that would putatively form the metal-binding motif. In this sequence, a redox-inert phenylalanine (F81) is found in the i+4 position from first histidine in the motif (H77). (C) Topology (left) of the crystal structure (right) of the Escherichia coli class Ia RNR β subunit (PDB: 1piy) and (D) a close-up of the residues that form the diiron center. The site of the radical is a tyrosine (Y122) in the i+4 position from the first histidine in the motif (H118). (E) Sequence alignment of representative class Ø ferritin-like protein and class I RNR β subunits. Class Ø colored in green: Cs, Cyanophage SS120-1; Ab, Alphaproteobacteria bacterium; Scbs4, Synechococcus phage S-CBS4; Scbp4, Synechococcus phage S-CBP4; Cpb, Candidatus Poribacteria bacterium; Fb, Flavobacteriales bacterium; Fb, Flavobacteriaceae bacterium; C, Coraliomargarita sp.; Rb, Rickettsiales bacterium TMED131. Class I colored in blue: Class Ia: EcIa, E. coli (strain K12); Sc, Saccharomyces cerevisiae (strain ATCC 204508/S288c). Class Ib: EcIb, E. coli (strain K12); Bs, Bacillus subtilis (strain 168). Class Ic Ct Chlamydia trachomatis (strain D/UW-3/Cx). Class Id: Fj Flavobacterium johnsoniae (strain ATCC 17061); Lb, Leeuwenhoekiella blandensis (strain CECT 7118). A conserved E/D and EXXH metal-binding motif is observed in each helical pair (1+2; 3+4). The i+4 position from the histidine in helix 2 is Phe or Leu in class Ø ferritin-like proteins, much like in class Ic β subunits.
Tables
Table 1
EM data collection, processing, and refinement.
| Data collection and processing | |
|---|---|
| Microscope | Talos Arctica |
| Camera | K3 |
| Magnification | 79,000 |
| Voltage (keV) | 200 |
| Electron exposure (e- Å−2) | 50 |
| Defocus range (μm) | –0.6 to –2.0 |
| Pixel size (Å) | 1.07 |
| Micrographs used (no.) | 432 |
| Initial particles (no.) | 581,884 |
| Final particles (no.) | 107,885 |
| Symmetry imposed | C2 |
| Map resolution (Å) FSC threshold | 3.46 (0.143) |
| Map resolution range (Å) | 3.0–7.0 (75%) |
| Refinement | |
| Initial model used | AlphaFold2 prediction for UniProt entry M1PRZ0 |
| Model resolution (Å) FSC threshold | 3.6 (0.5) |
| Map sharpening B factor (Å2) | –171 |
| Model composition | |
| Non-hydrogen atoms | 6260 |
| Protein residues | 802 |
| Ligands | TTP |
| B factors (Å2) | |
| Protein | 74.37 |
| Ligand | 67.23 |
| r.m.s. deviations | |
| Bond lengths (Å) | 0.004 |
| Bond angles (°) | 0.937 |
| Validation | |
| MolProbity score | 1.47 |
| Clashscore | 4.69 |
| Poor rotamers (%) | 0.00 |
| Ramachandran plot | |
| Favored (%) | 96.49 |
| Allowed (%) | 3.51 |
| Disallowed (%) | 0.00 |
Additional files
Download links
A two-part list of links to download the article, or parts of the article, in various formats.
Downloads (link to download the article as PDF)
Open citations (links to open the citations from this article in various online reference manager services)
Cite this article (links to download the citations from this article in formats compatible with various reference manager tools)
Comprehensive phylogenetic analysis of the ribonucleotide reductase family reveals an ancestral clade
eLife 11:e79790.
https://doi.org/10.7554/eLife.79790


