Antibacterial potency of type VI amidase effector toxins is dependent on substrate topology and cellular context
- Department of Biochemistry and Biophysics, University of California, San Francisco, United States
- University of Miami, United States
- InBios International, United States
- Pacific Northwest University of Health Sciences, United States
- Department of Biology, Stanford University, United States
- Department of Bioengineering, Stanford University, United States
- Computer Science Department, Washington University in St. Louis, United States
- Centre for Bacterial Cell Biology, Newcastle University, United Kingdom
- Department of Genome Sciences, University of Washington, United States
- Brotman Baty Institute for Precision Medicine, United States
- Independent Researcher, United States
- Division of Biological Sciences, University of California, San Diego, United States
- Université Grenoble Alpes, France
- Chemistry Department, Western Washington University, United States
- Department of Biochemistry, University of Washington, United States
Figures
Figure 1
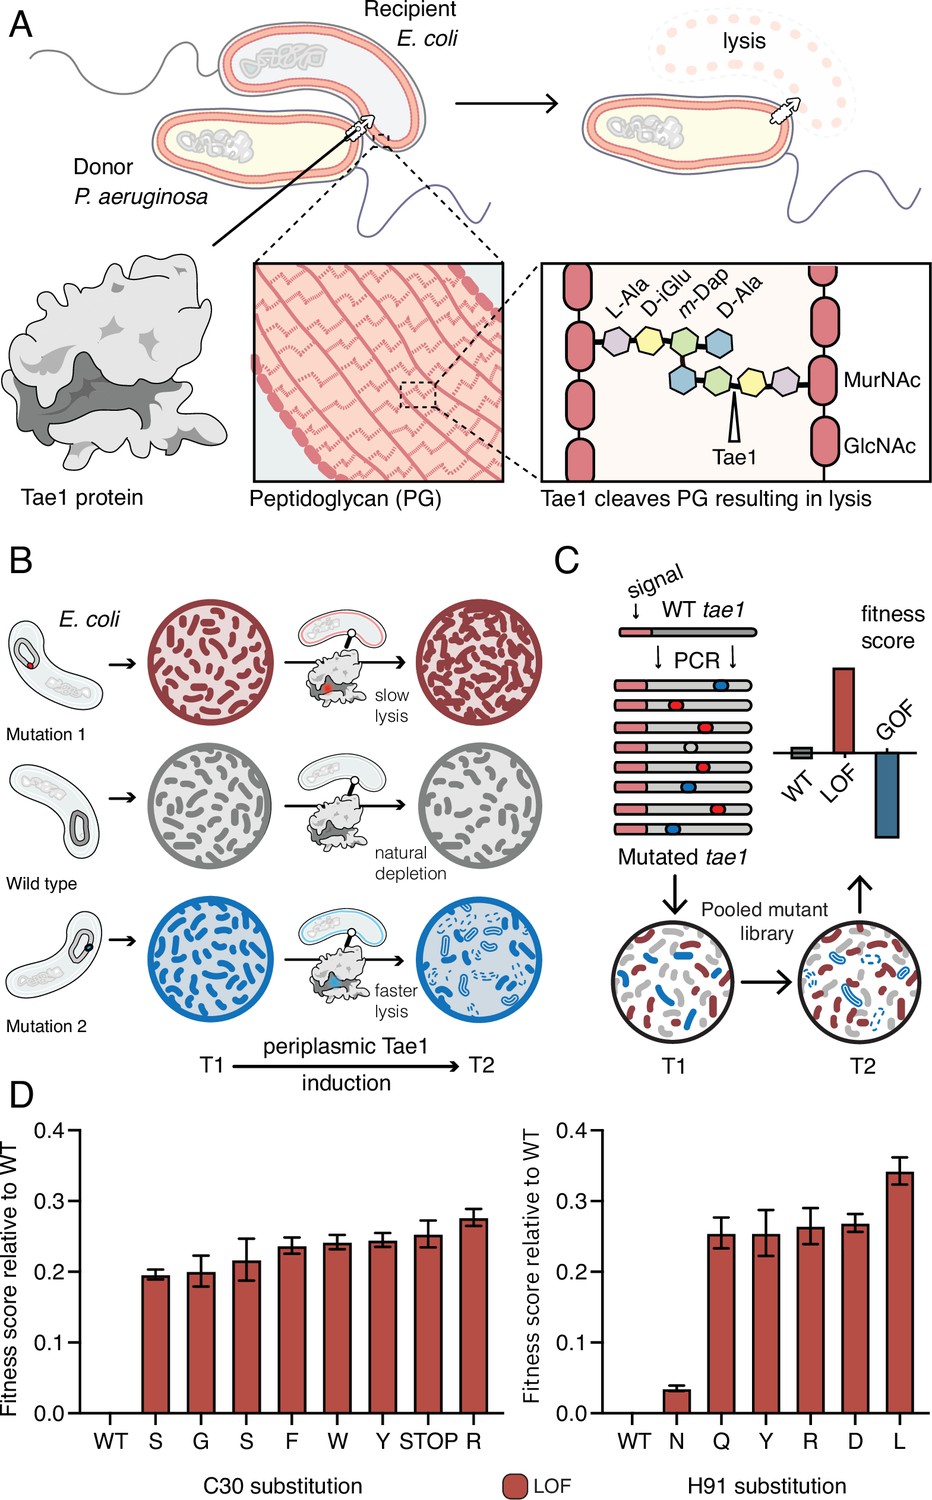
Deep mutational scanning (DMS) identifies amino acid residues important for Tae1 function in vivo.
(A) Illustration of the function of the P. aeruginosa Tae1 toxin in lysis of E. coli. The donor P. aeruginosa cell injects Tae1 into the periplasm of the recipient E. coli cell. Tae1 cleaves cell wall peptidoglycan (PG) at the cleavage site, resulting in cell lysis. (B) Illustration of lysis assays expressing Tae1 in the periplasm of E. coli. When wild-type Tae1 is expressed, cells are depleted over time (gray). When a loss-of-function mutation such as Tae1C30A is expressed, cells grow normally (red). When a gain-of-function mutation is expressed, cells are depleted more quickly over time (blue). T1 = time 1, T2 = time 2. (C) Schematic of DMS screen for functional determinants of Tae1. A library of Tae1 mutants was transformed into E. coli and periplasmic expression of the mutant toxins was induced. The number of mutant cells remaining at T2 compared to the number at T1 yields a fitness score for each variant. Increased fitness indicates loss-of-function mutations in Tae1, which decrease cell lysis, whereas decreased fitness indicates gain-of-function mutations, which increase lysis. (D) DMS-derived relative fitness scores for all substitutions in the library at the Cys30 and His91 positions. Data shown are means ± standard deviation, n = 3. DMS experiment in M9 media was repeated three independent times, each time with at least three technical replicates.
-
Figure 1—source data 1
Data for DMS experiments.
- https://cdn.elifesciences.org/articles/79796/elife-79796-fig1-data1-v2.xlsx
Figure 2 with 1 supplement
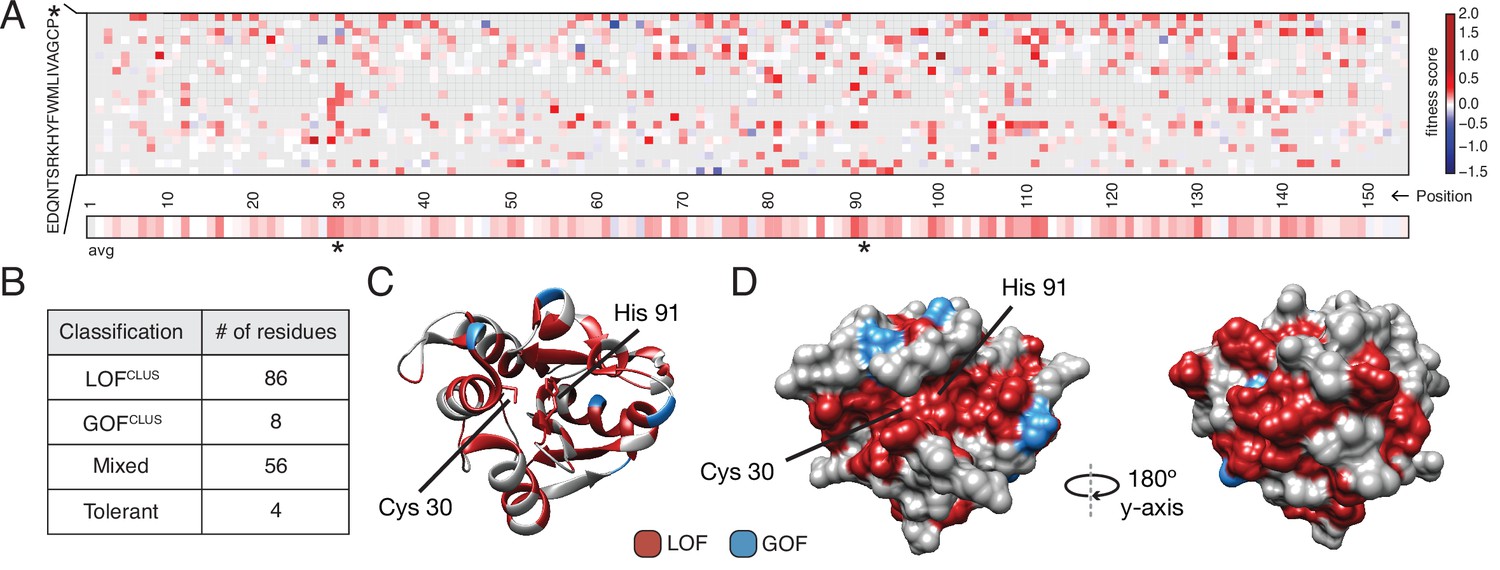
Deep mutational scanning (DMS) identifies functional hotspots extending around the surface of Tae1.
(A) Heatmap representation of fitness scores relative to wild-type Tae1 for all mutations in DMS. Each amino acid position is represented on the x-axis, and each possible amino acid substitution is represented on the y-axis, * indicates stop codon. Each box represents the average fitness score of three replicate experiments. The average fitness score of all substitutions at each residue is depicted across the bottom row. Catalytic residues Cys30 and His91 are indicated with asterisks. Variants in gray were not present in our library. (B) Results of k-means clustering of DMS data. Based on fitness effects, each residue of Tae1 was labeled loss of function (LOFCLUS), gain of function (GOFCLUS), mixed, or tolerant. (C) Ribbon diagram of Tae1 structure. LOFCLUS residues are shown in red, GOFCLUS residues are shown in blue, and all other residues are in gray. The catalytic residues of Tae1 (Cys30 and His91) are indicated. Mutations in the enzyme core lead to LOF phenotypes. (D) Functional residues on the surface of Tae1. The catalytic surface of the enzyme is shown on the left and the opposite surface, after 180° rotation, is on the right. Color code as in (C). LOFCLUS mutations are located in large areas of the surface on both sides of the enzyme, and most GOFCLUS mutations are also found on the surface. See also Figure 2—figure supplement 1.
Figure 2—figure supplement 1
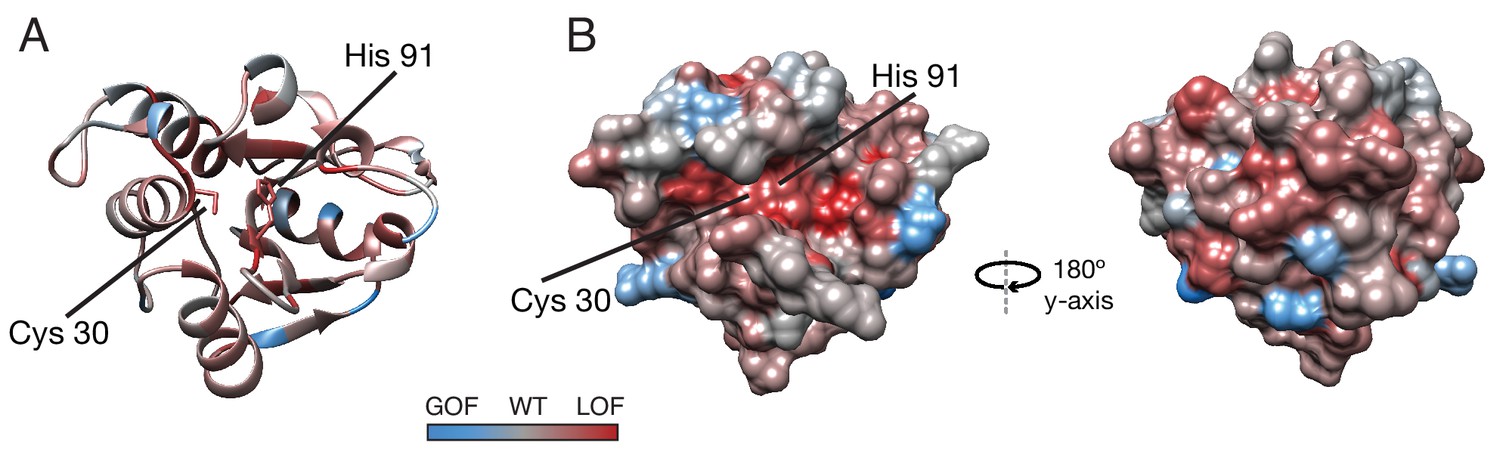
Average fitness score across each residue.
(A) Ribbon diagram and (B) surface diagrams of fitness scores when averaging scores for all substitutions at each residue. Red residues indicate loss of function on average, and blue residues indicate gain of function on average. Cys30 and His91 of the active site are indicated.
Figure 3 with 2 supplements
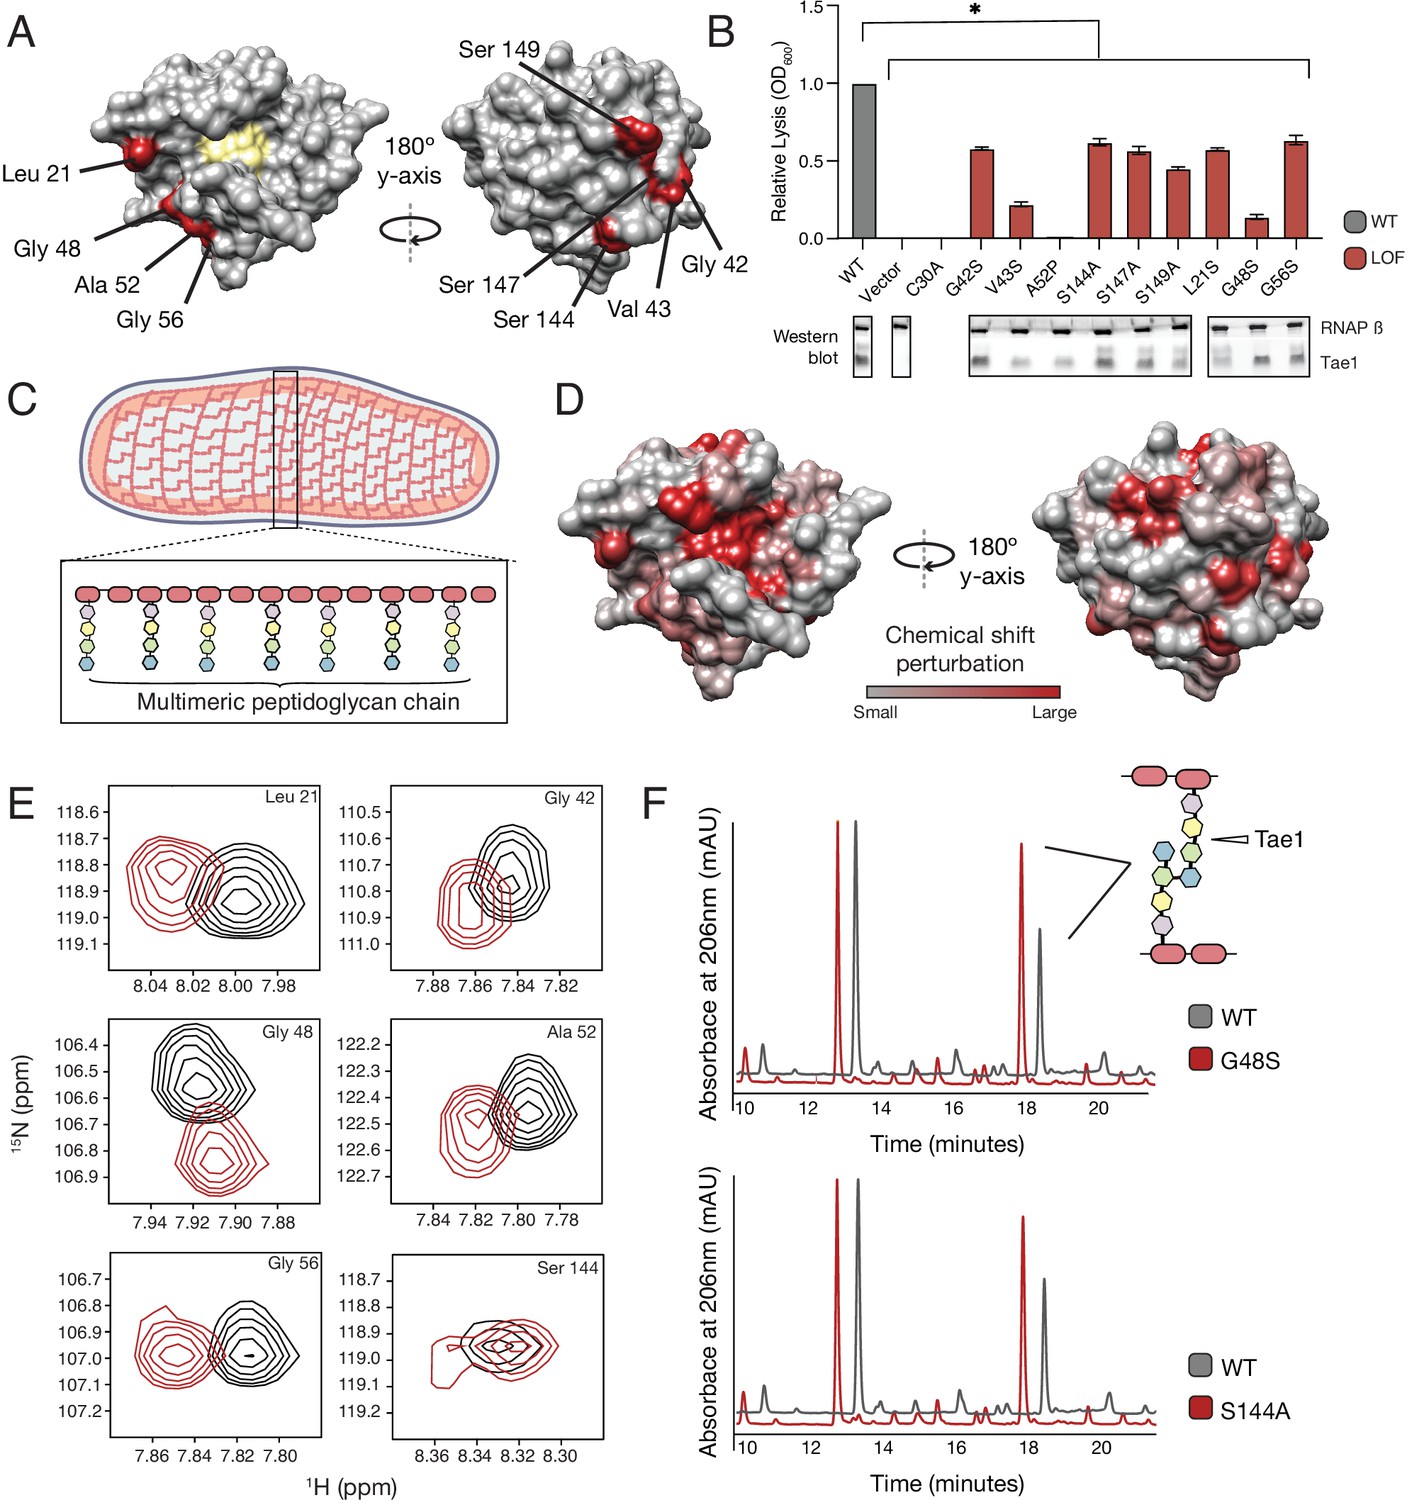
Tae1 surfaces distal from catalytic core mediate binding and hydrolysis of cell wall network.
(A) Nine distal residues on Tae1 that had loss-of-function phenotypes. The catalytic core is highlighted in yellow. (B) Lysis assays measuring relative lysis of E. coli expressing Tae1WT, negative controls (vector and C30A), and loss-of-function single amino acid substitutions (G42S, V34S, A52P, S144A, S149A, L21S, G48S, G56S). Data shown are means ± standard deviation, n = 3, * p<0.05. Induced with 0.25% arabinose. Lysis experiment was repeated three independent times, each time with at least three technical replicates. Western blots below show the beta subunit of RNA polymerase (RNAP β) and Tae1 proteins in each assay. All variants and controls showed reduced lysis when compared to wild-type Tae1. (C) Schematic of the multimeric glycan chains used as the substrate in nuclear magnetic resonance (NMR) experiments. (D) Chemical shift perturbations (CSPs) calculated from NMR spectra of Tae1 with or without multimeric peptidoglycan (PG) chains mapped onto the Tae1 surface structure. Numerous residues on both sides of the Tae1 display CSPs consistent with direct substrate interactions. (E) 1H-15N Best–Trosy NMR spectra from Tae1 alone (black) and Tae1 incubated with multimeric PG chains (red) for six residues from (A) that show CSPs. Residues distal from the Tae1 active site show shifts indicative of interactions with PG. Numerous residues display CSPs consistent with direct substrate interactions. (F) High-performance liquid chromatography (HPLC) traces showing degradation of PG in the presence of wild-type (black, WT) or mutant (red) Tae1 in vitro. Arrows indicate peaks containing the peptide stem that can be cleaved by Tae1. Mutant Tae1 (S144A and G48S) cleaves PG less well than wild-type Tae1 (29.1 ± 3.2% and 36.4 ± 4.2% less PG., respectively). See also Figure 3—figure supplements 1 and 2.
-
Figure 3—source data 1
Full images of Western blots depicted in Figure 3.
- https://cdn.elifesciences.org/articles/79796/elife-79796-fig3-data1-v2.pptx
Figure 3—figure supplement 1
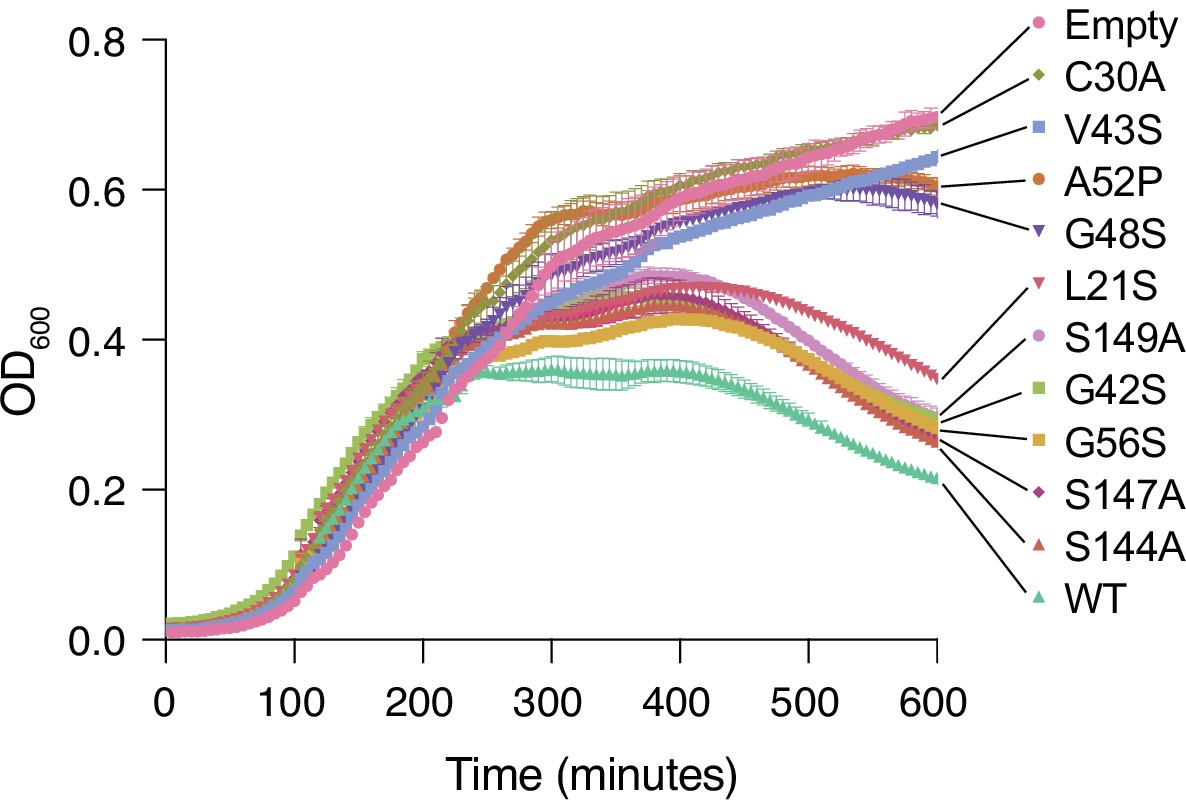
Lysis assay growth curves.
Cell growth as measured by OD600 for Tae1WT, negative controls (Empty, C30A), and the nine distal residues on Tae1 in Figure 3B. Expressing Tae1 proteins containing the nine distal residue substitutions decreases cell lysis, suggesting these are loss-of-function residues.
Figure 3—figure supplement 2
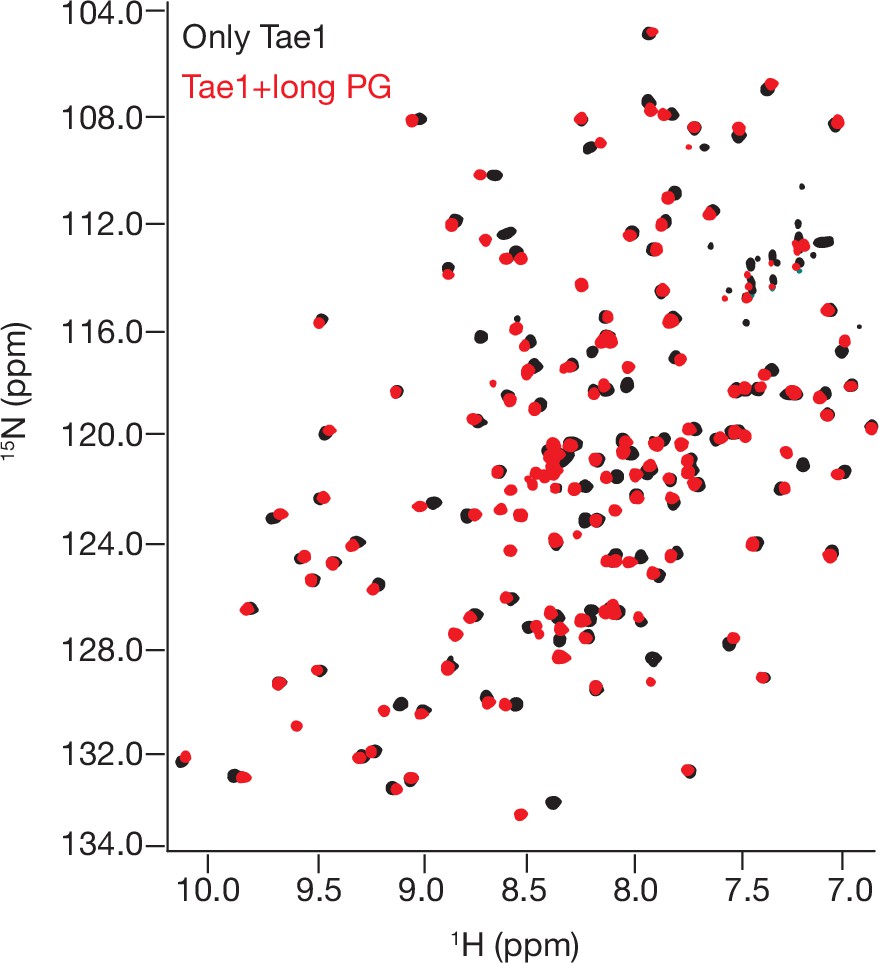
1 H- 15N Best–Trosy nuclear magnetic resonance (NMR) spectra of Tae1 with and without multimeric peptidoglycan (PG).
NMR spectra from Tae1 alone (black) and Tae1 incubated with multimeric PG chains (red). Numerous residues display chemical shift perturbations (CSPs) consistent with direct substrate interactions.
Figure 4 with 2 supplements
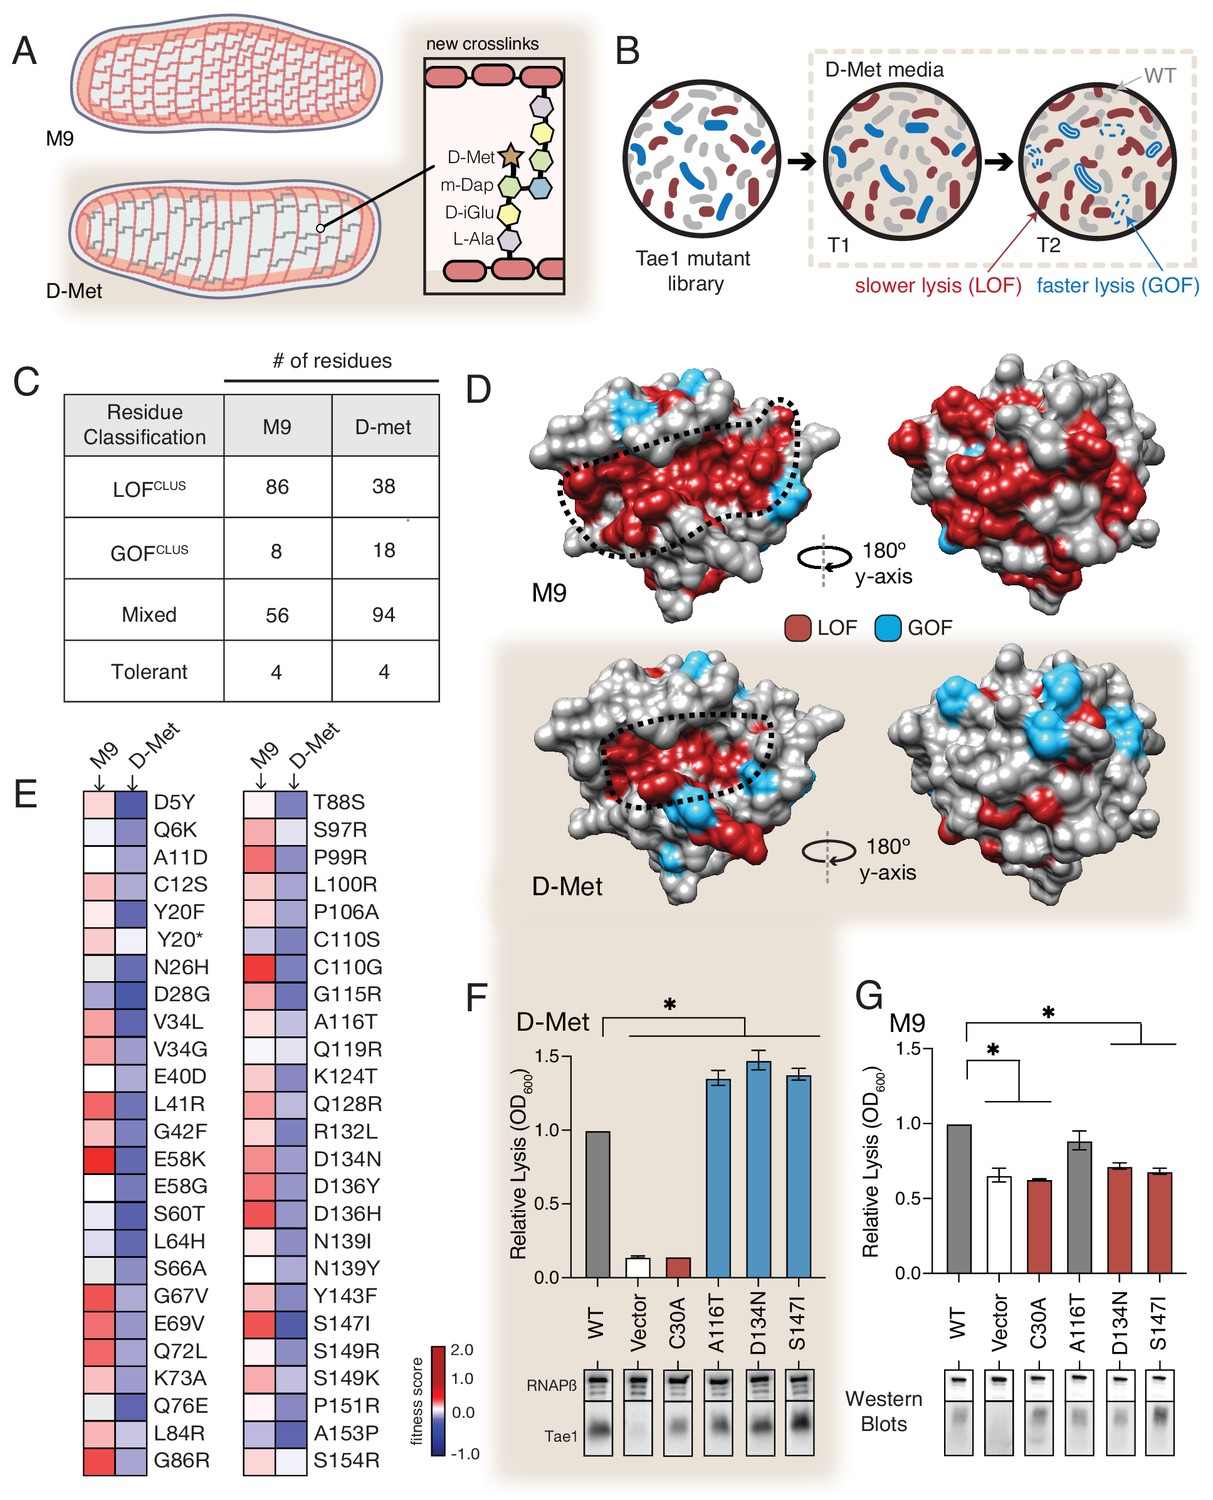
The functional landscape of Tae1 is sensitive to cell wall differences.
(A) Cartoon illustration of cells grown in media containing D-methionine (D-Met) showing altered peptidoglycan (PG) architecture. D-Met becomes incorporated into the peptide stems and there are overall fewer crosslinks in the macromolecule. (B) Schematic of the deep mutational scanning (DMS) experiments performed in media containing D-Met. DMS was completed as in Figure 1 with media containing D-Met. (C) Number of residues classified as each of the four cluster types in D-Met DMS screen. The functional classification of residues is dramatically changed from the original screen. (D) DMS-derived loss- and gain-of-function (GOF) residues mapped onto the surface structure of Tae1 from the initial screen (left) and the D-Met screen (right). Compared with regular media, there were fewer loss-of-function and more gain-of-function residues in the presence of D-Met on both the catalytic face and back of the enzyme. (E) Heatmap representing fitness scores for the top 50 GOF individual amino acid substitutions in D-Met and M9 media. n = 3. DMS in D-Met media was repeated three independent times, each time with at least three technical replicates. The majority of the GOF substitutions in D-Met are condition specific. (F) Lysis assays with wild-type Tae1, empty vector and catalytically inactive Tae1C30A as negative controls, and three GOF Tae1 variants (A116T, D134N, S147I). Data are means ± standard deviation, n = 3, *p<0.05. Induced with 0.0025% arabinose. Lysis experiment was repeated three independent times, each time with at least three technical replicates. Western blots below measure Tae1 protein expression with RNAP as a control. All three GOFs from DMS show increased lysis phenotype in individual lysis assays. (G) Lysis assays with the same Tae1 variants as in (F) but in M9 media. Western blots below measure Tae1 protein expression with RNAP as a control. The three D-Met GOF substitutions are condition specific. See also Figure 4—figure supplements 1 and 2.
-
Figure 4—source data 1
Full images of Western blots depicted in Figure 4.
- https://cdn.elifesciences.org/articles/79796/elife-79796-fig4-data1-v2.pptx
Figure 4—figure supplement 1
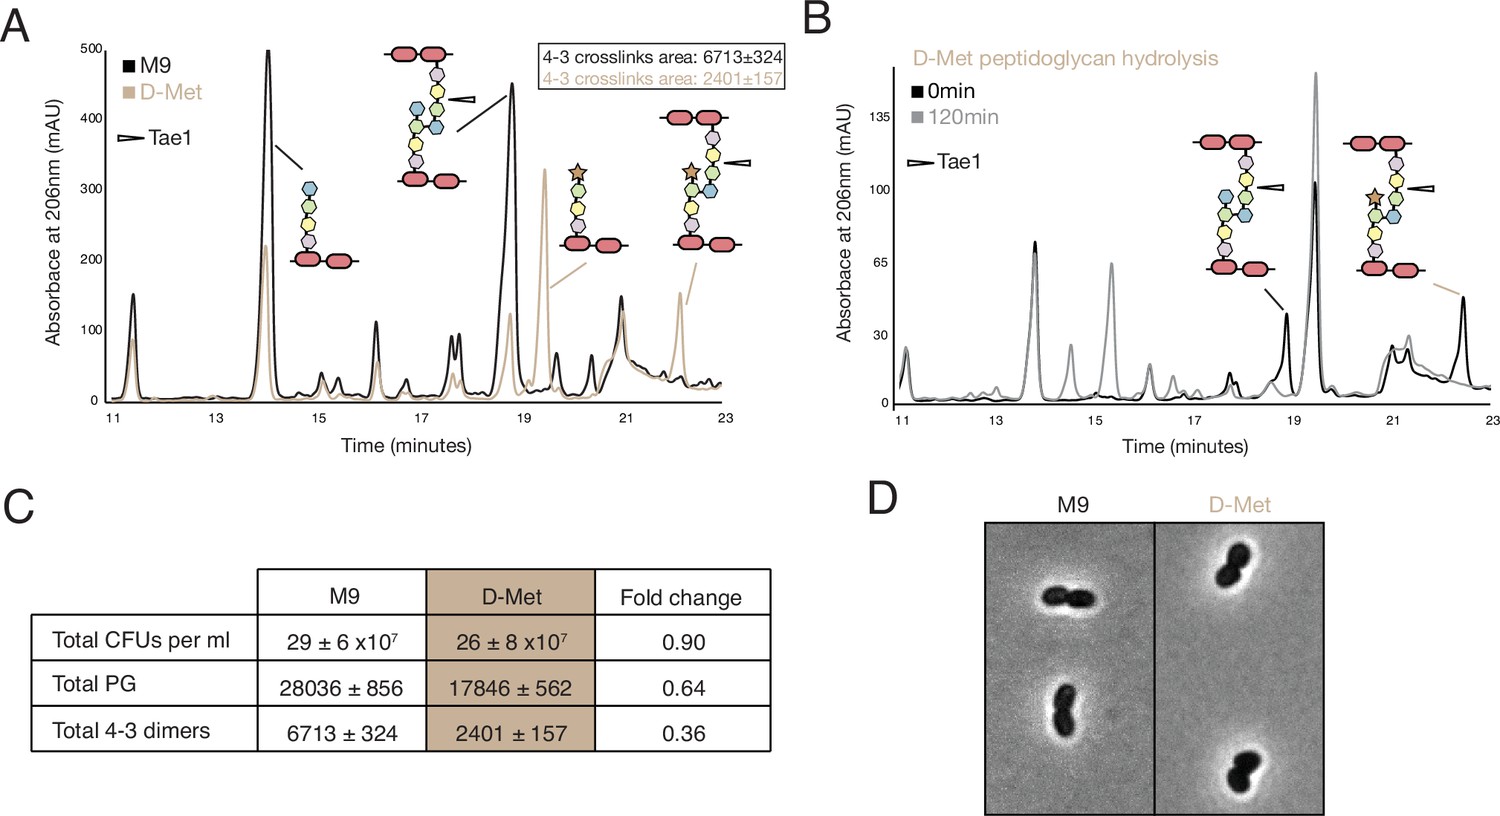
D-methionine (D-met) alters density and type of crosslinks.
(A) High-performance liquid chromatography (HPLC) traces comparing peptidoglycan (PG) from cells grown in either M9 and D-met media. (B) HPLC traces showing Tae1 still degrades peptide crosslinks containing D-met. (C) Summary of PG differences between M9 and D-met media. (D) There are no major morphological changes in the presence of D-met.
Figure 4—figure supplement 2
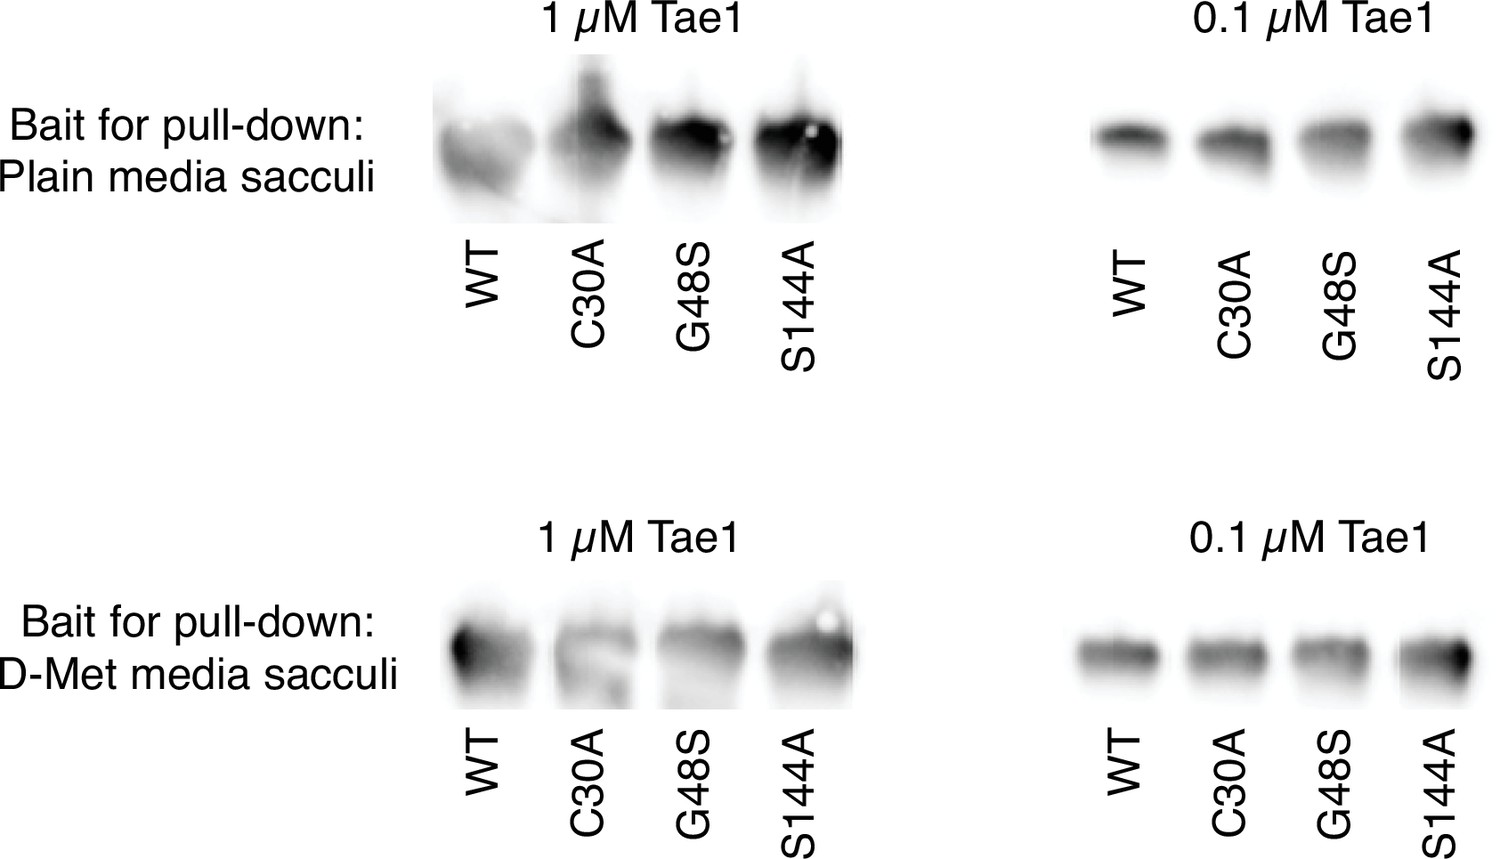
Sacculi architecture does not impact interactions between sacculi and Tae1 enzyme variants.
Sacculi were isolated from cells grown in either plain or D-methionine (D-Met) media. The sacculi were used as ‘bait’ in this pull-down assay to determine any substrate-binding differences between Tae1WT and Tae1C30A, Tae1G48S, and Tae1S144A enzyme variants.
-
Figure 4—figure supplement 2—source data 1
Full images of Western blots depicted in Figure 4—figure supplement 2.
- https://cdn.elifesciences.org/articles/79796/elife-79796-fig4-figsupp2-data1-v2.pptx
Figure 5
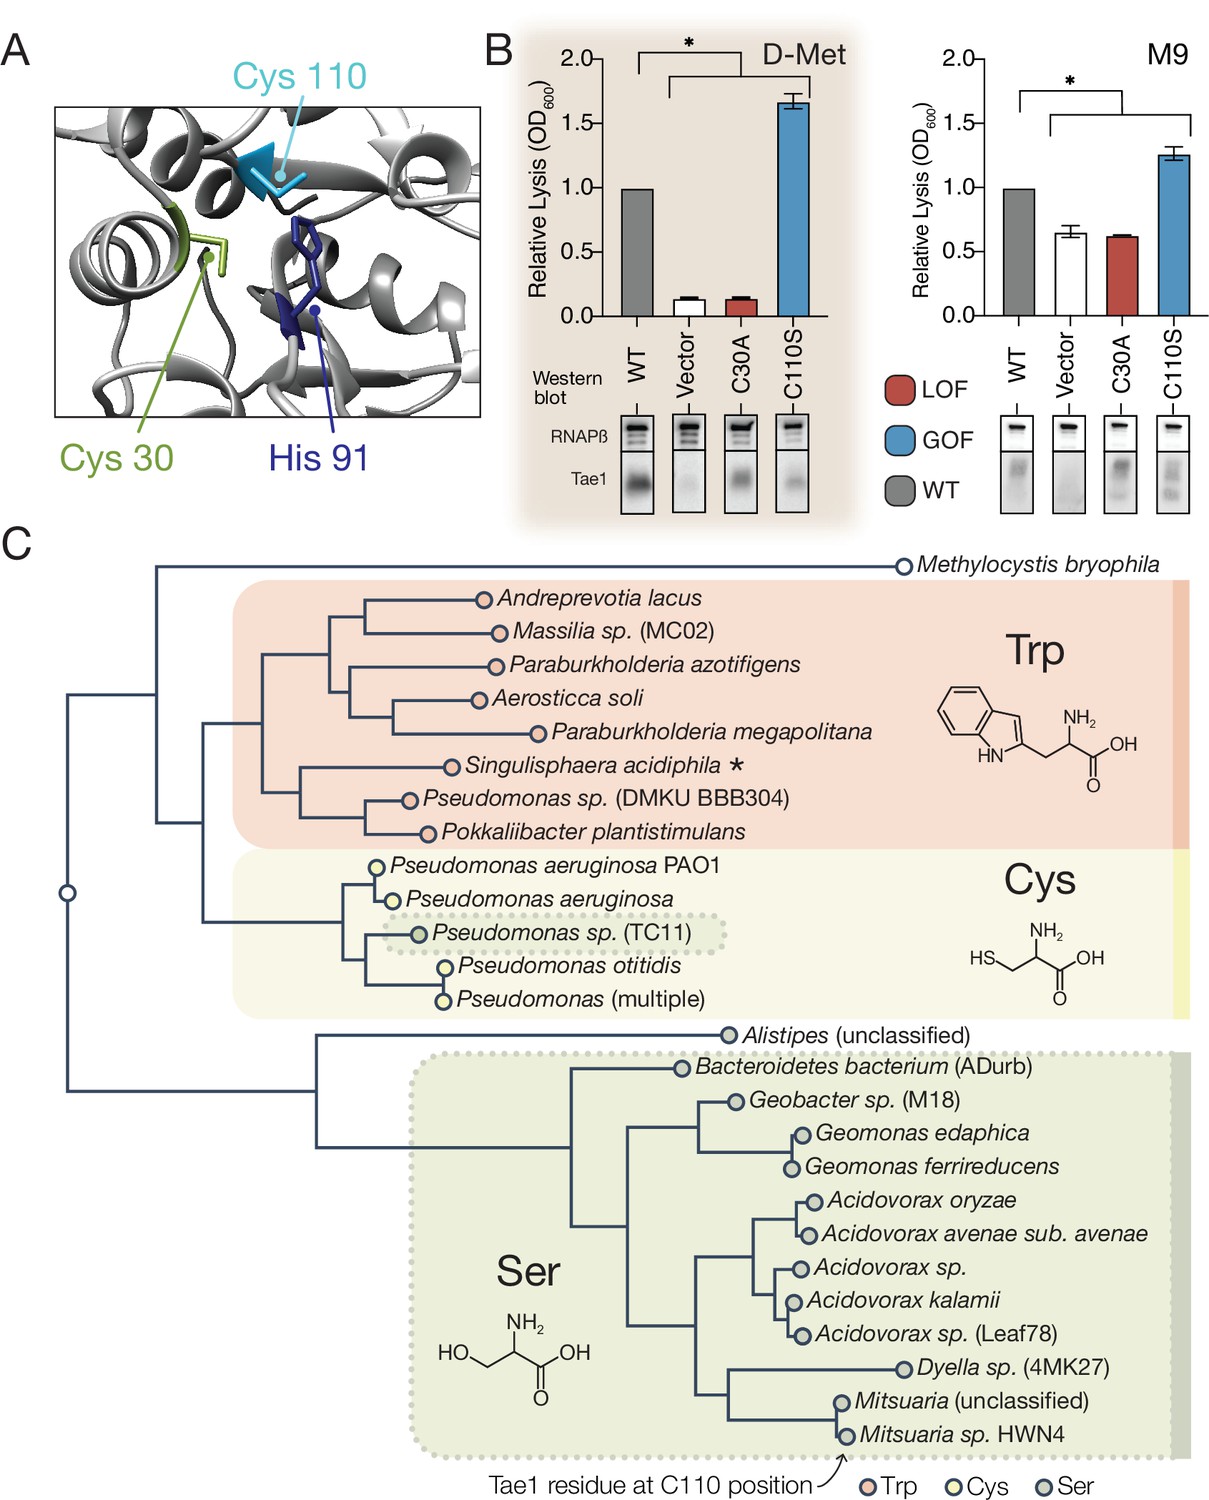
A hyperactive variant of Tae1 is naturally encoded by other tae homologs.
(A) Ribbon structure diagram at the Tae1 catalytic site. Catalytic dyad residues Cys30 and His91 are indicated along with gain-of-function (GOF) Cys110. (B) Lysis assays with wild-type Tae1, empty vector and catalytically inactive Tae1C30A as negative controls, and GOF variant Tae1C110S in D-methionine (D-Met) and M9 media. Data are means ± standard deviation, n = 3, *p<0.05. Induced with 0.0025% arabinose. Lysis experiment was repeated three independent times, each time with at least three technical replicates. Western blots below measure Tae1 protein expression with RNAP as a control. The C110S GOF substitution is not sensitive to the D-Met-induced changes in cell wall architecture. This is part of the same blot shown in Figure 4F. (C) Tae1 family phylogenetic tree. Species with Ser at position 110 are indicated in blue, while those with Cys are in black and those with Trp are in purple. Some but not all Tae1 proteins have evolved to include a Ser at position 110.
-
Figure 5—source data 1
Full images of Western blots depicted in Figure 5.
- https://cdn.elifesciences.org/articles/79796/elife-79796-fig5-data1-v2.pptx
-
Figure 5—source data 2
Tae1 protein sequences used in the phylogenetic tree in Figure 5.
- https://cdn.elifesciences.org/articles/79796/elife-79796-fig5-data2-v2.txt
Figure 6 with 3 supplements
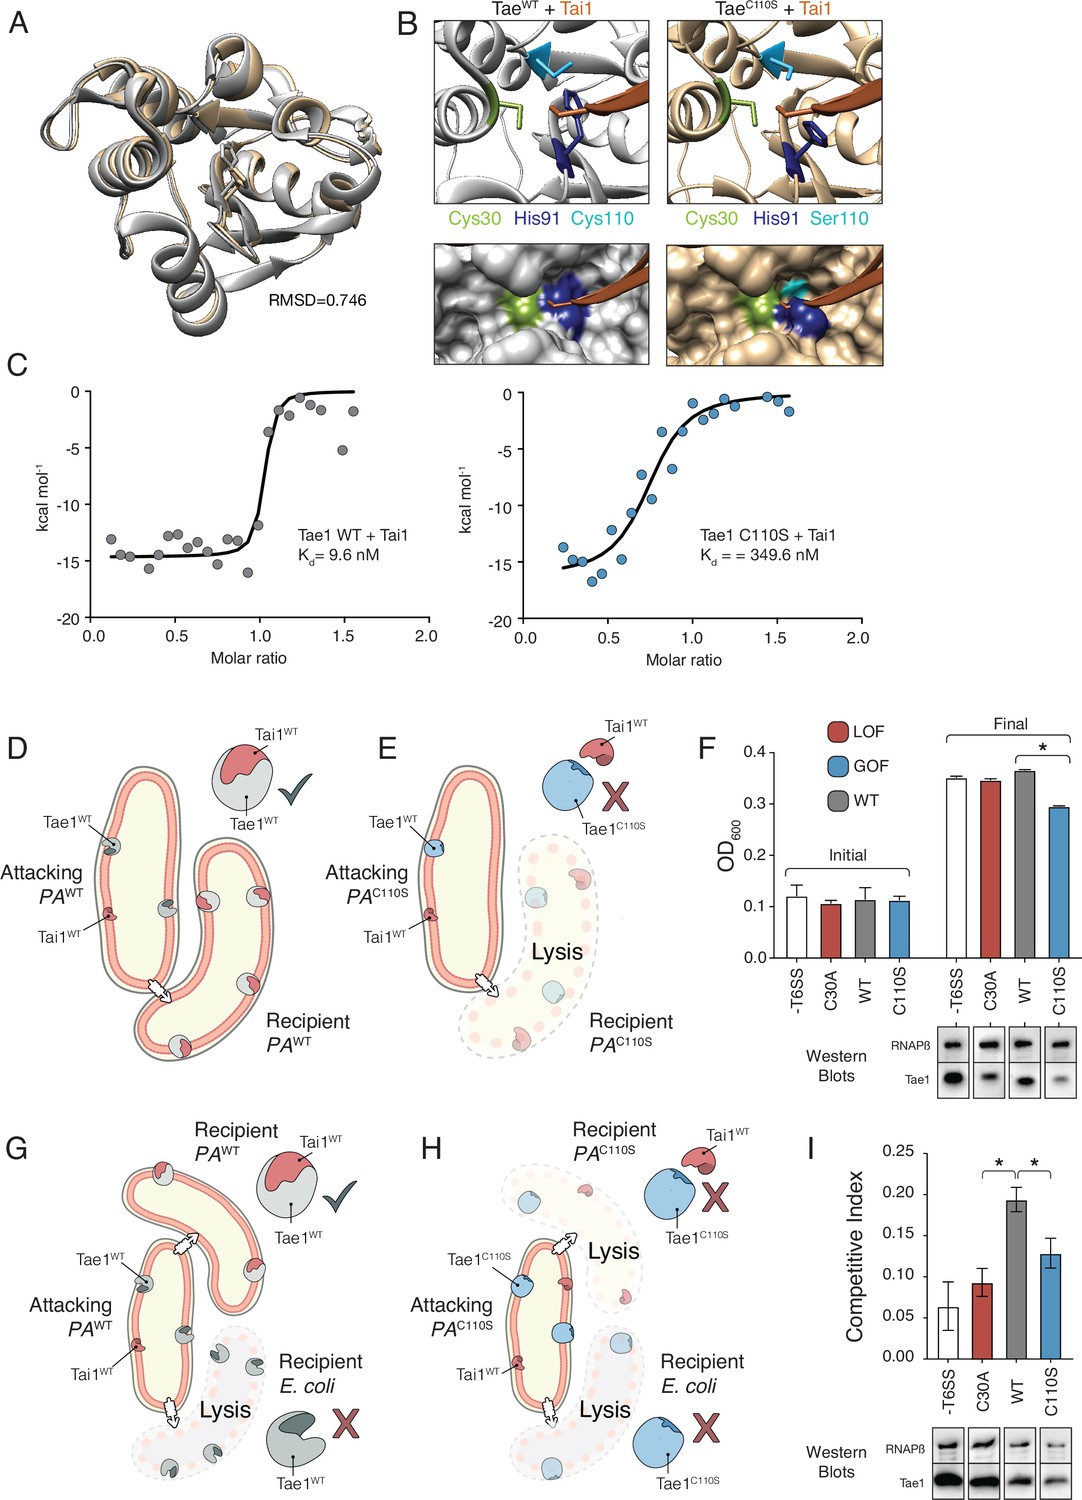
Hyperactive variant Tae1C110S evades binding and inhibition by cognate immunity.
(A) Tae1WT ribbon structure diagram (silver) and Tae1C110S ribbon structure diagram (blue) with the His91 side chain shown. C110S mutation does not cause major structural changes, but alters side chains in the active site. (B) Ribbon diagrams of the active sites of Tae1WT (left) and Tae1C110S (right) in complex with Tai1 (pink). Side chains of Cys30, His91, and Cys110 are indicated in gray, and Ser110 in blue. His91 clashes with Tai1 in the active site. (C) Isothermal titration calorimetry determination of binding constants between wild-type Tae1 and Tai1 (left) and Tae1C110S and Tai1 (right). Tae1C110S binds poorly to Tai1. (D, E) Schematic depicting Tae1 and Tai1 interactions in wild-type P. aeruginosa and Tae1C110S P. aeruginosa. When wild-type Tae1 is injected into a neighboring cell of the same species, Tai1 binds to it, conferring immunity. Tai1 cannot bind Tae1C110S, thus the mutant Tae1 can cause cell lysis. (F) Fitness assays of P. aeruginosa expressing wild-type Tae1 or Tae1C110S from the endogenous locus. P. aeruginosa lacking a type 6 secretion system (-T6SS) or expressing catalytically inactive Tae1 (C30A) were used as controls. Data are means ± standard deviation, n = 3, *p<0.05. Fitness assays were repeated three independent times, each time with at least three technical replicates. Cells expressing Tae1C110S have decreased fitness when compared with wild-type Tae1. See also Figure 6—figure supplements 1–3. (G, H) Schematic depicting contact-dependent competition between E. coli and either wild-type P. aeruginosa or Tae1C110S P. aeruginosa. The key point here is that an attacking P. aeruginosa cell may inject Tae1 effector into a kin cell or into a prey E. coli cell. (I) Competition assays of P. aeruginosa expressing wild-type Tae1 or Tae1C110S from the endogenous locus. P. aeruginosa lacking a -T6SS or expressing catalytically inactive Tae1 (C30A) were used as controls. Data are means ± standard deviation, n = 3, *p<0.05. Competition assays were repeated three independent times, each time with at least three technical replicates. Cells expressing Tae1C110S have a decreased competitive index when compared with wild-type Tae1.
-
Figure 6—source data 1
Full images of Western blots depicted in Figure 6.
- https://cdn.elifesciences.org/articles/79796/elife-79796-fig6-data1-v2.pptx
Figure 6—figure supplement 1
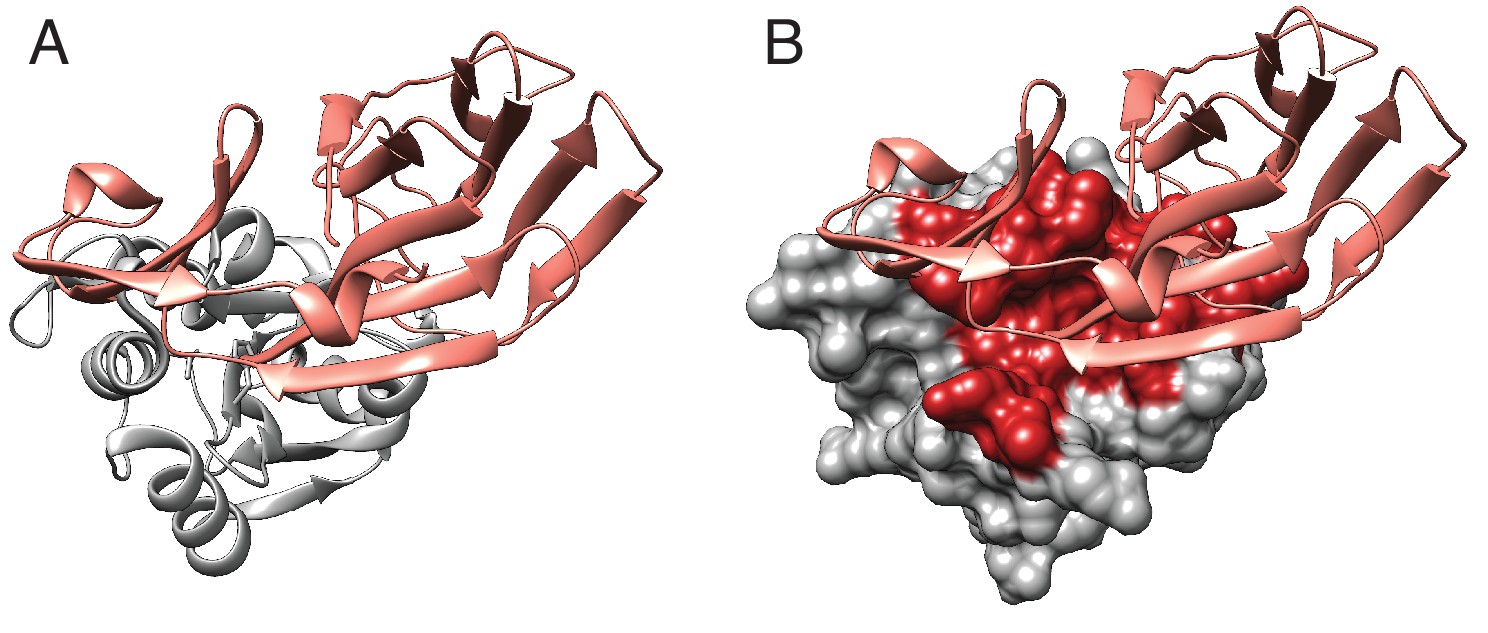
Tae1–Tai1 interactions.
(A) Ribbon diagram of Tae1 (silver) and Tai1 (pink). (B) Tae1 surface diagram, with red residues representing contacts with Tai1. The contacts are based on PDB ID 4EQA.
Figure 6—figure supplement 2
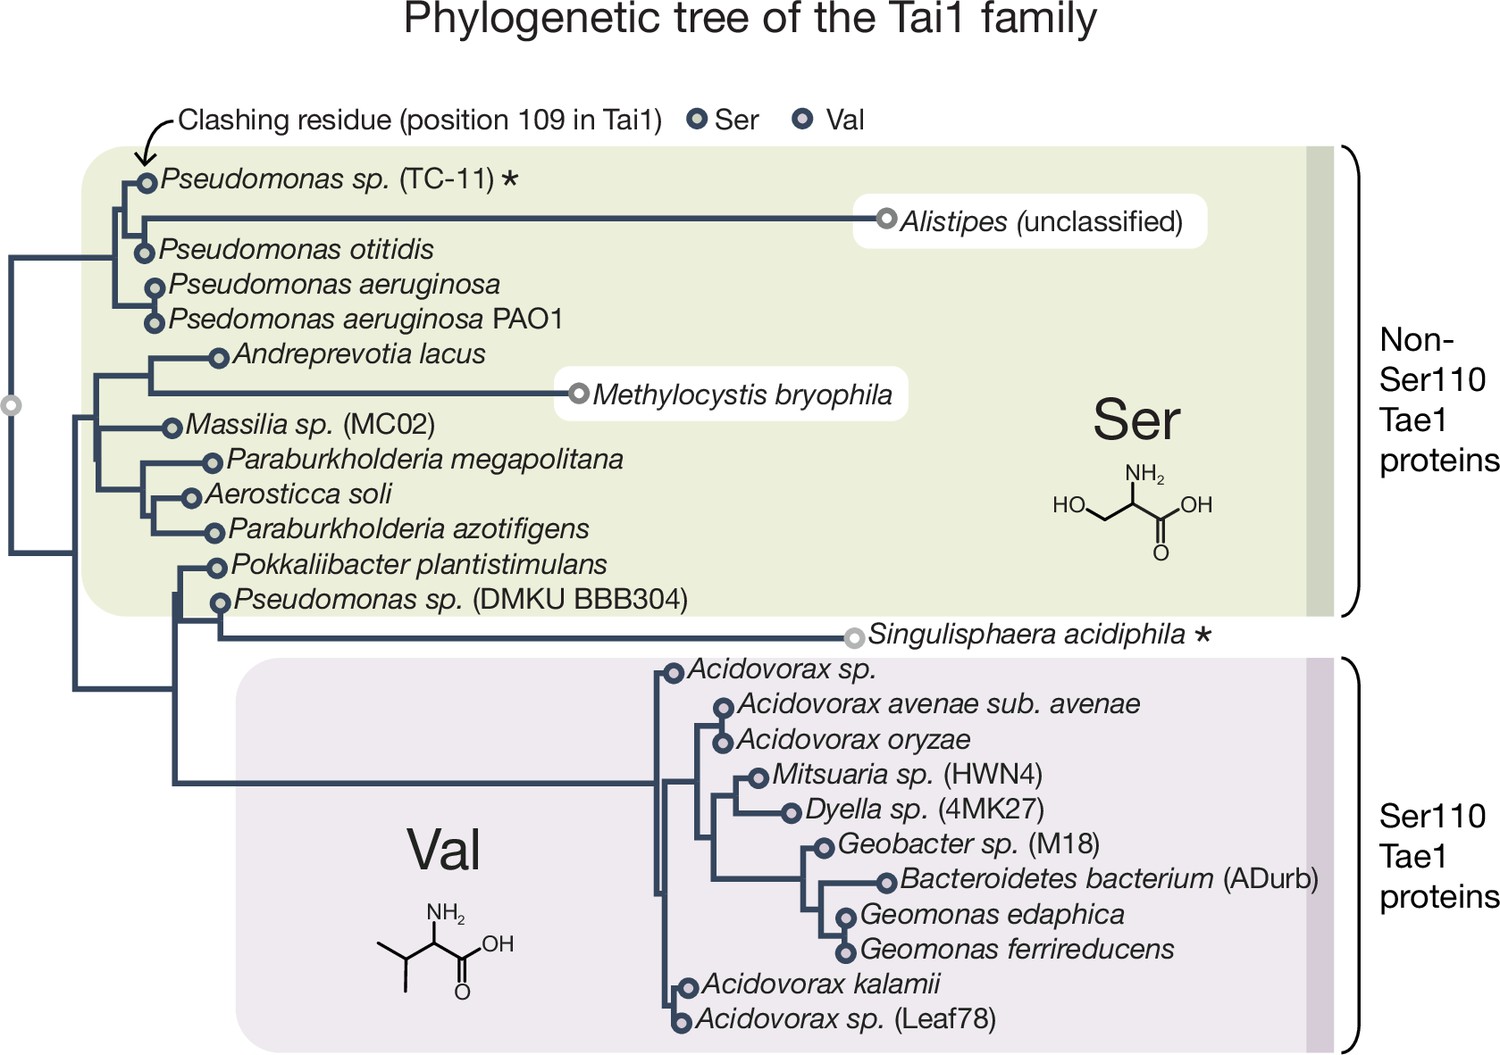
Tai1 family phylogenetic tree.
The residue at position 109 is either a Val (in Tai1s corresponding to Tae1S110 proteins) or a Ser (in Tai1s corresponding to Tae1non-S110 proteins). The tree contains the same species found in the Tae1 tree, except for Mitsuaria (unclassified) and Pseudomonas (multiple). The sequences in the tree were identified using a published heuristic approach that specifically searches for T6S effector immunity proteins. Maximum likelihood (ML) tree was inferred using PhyML v20160115 ran with model JTT and parameters: --alpha e -o tlr --bootstrap –2f m --nclasses 4 --pinv e. Branch supports are the Chi2-based parametric values returned by the approximate likelihood ratio test. Major clades had 90 or higher support values. The species marked with an asterisk have a Ser at position 110 in the corresponding Tae1 protein (for Pseudomonas sp. TC-11) or have an Ala at position 109 for the Tai1 protein (for Singulisphaera acidiphila).
-
Figure 6—figure supplement 2—source data 1
Tai1 protein sequences used in the phylogenetic tree in Figure 6—figure supplement 2.
- https://cdn.elifesciences.org/articles/79796/elife-79796-fig6-figsupp2-data1-v2.txt
Figure 6—figure supplement 3
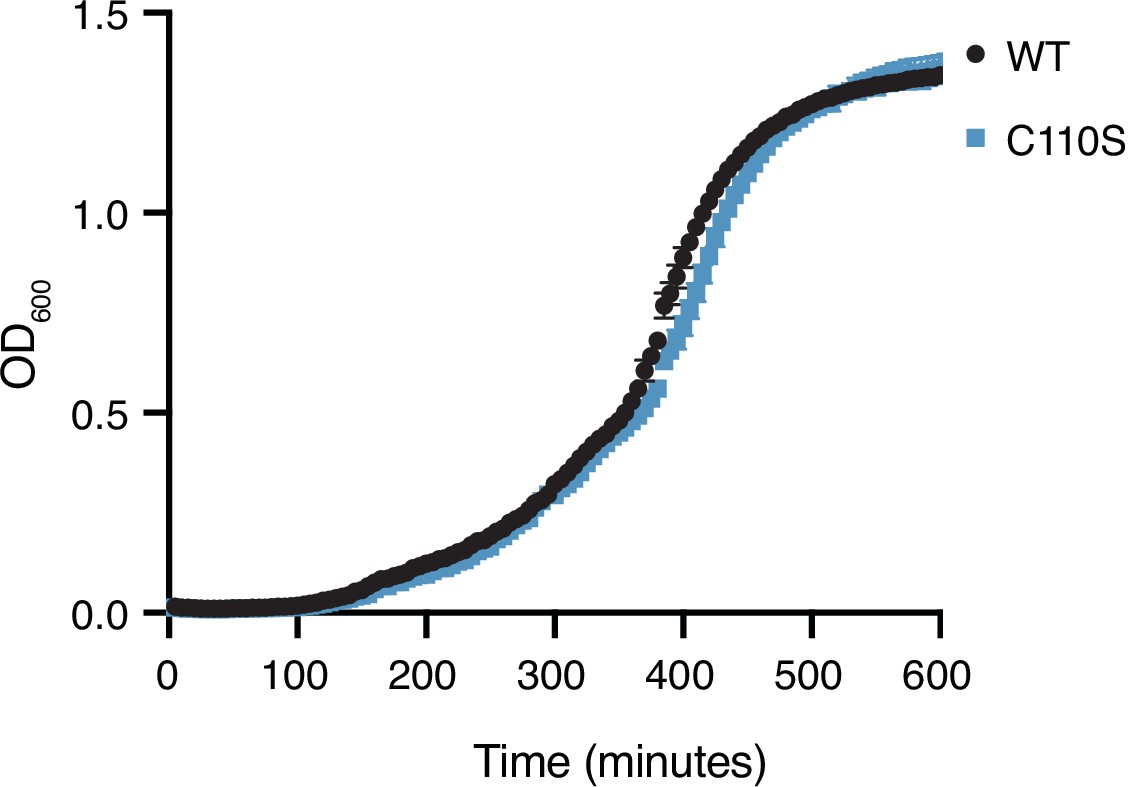
Competition assay in liquid culture.
Growth in P. aeruginosa expressing wild-type Tae1 or Tae1C110S from the endogenous locus in liquid culture. Data are means ± standard deviation, n = 3. Growth experiment was repeated three independent times, each time with at least three technical replicates.
Figure 7
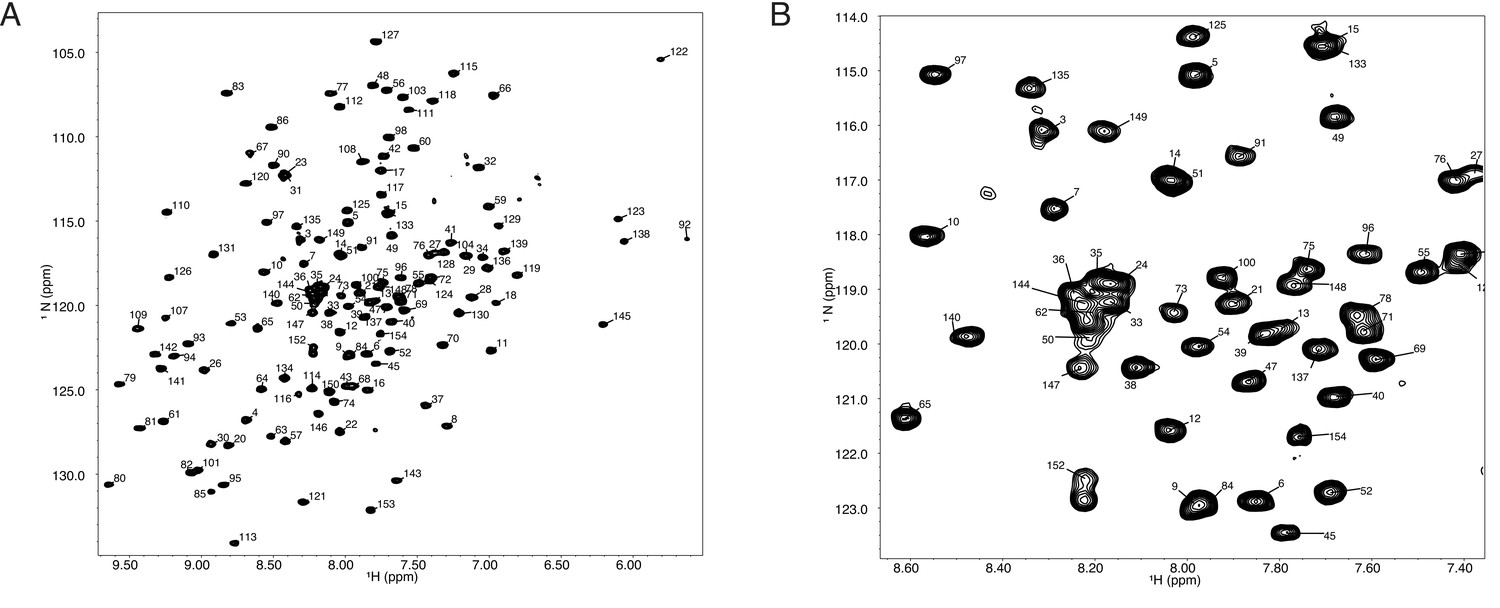
(A) (1H,15N)-TROSY spectrum of 150 mM Tae1 in 20 mM HEPES, 100 mM NaCl, pH 7.0 showing resonance assignments for backbone amides.
(B) Expanded view of a smaller region of the same spectrum.
-
Figure 7—source data 1
Tae1 C30A peak assignments from NMR experiments.
- https://cdn.elifesciences.org/articles/79796/elife-79796-fig7-data1-v2.zip
-
Figure 7—source data 2
Tae1 C30A chemical shift perturbations from NMR experiments.
- https://cdn.elifesciences.org/articles/79796/elife-79796-fig7-data2-v2.xlsx
Tables
Table 1
Primers used in this study.
| Name | Sequence |
|---|---|
| pET22_Tae1_C110S_F1 | CCGATGTGCTGGTCCGGCAGCATCGCCGGC |
| pET22_Tae1_C110S_F2 | GGTGGTGGTGCTCGAG |
| pET22_Tae1_C110S_R1 | GCCGGCGATGCTGCCGGACCAGCACATCGG |
| pET22_Tae1_C110S_R2 | TGGATATCGGAATTAATTCGGATC |
| pET29_Tae1_C110S_F1 | CCGATGTGCTGGTCCGGCAGCATCGCCGGC |
| pET29_Tae1_C110S_F2 | GGTGGTGGTGCTCGAG |
| pET29_Tae1_C110S_R1 | GCCGGCGATGCTGCCGGACCAGCACATCGG |
| pET29_Tae1_C110S_R2 | GGGAATTCCATATGGACAGTCTCGATCAATGC |
| pBAD_Tae1_F | TAGTACAGAGAATTCACCATGAAATACCTGCTGCCGACCGCTGCTGC |
| pBAD_Tae1_R | TCAATCAGTATCTAGATTACTCGAGACTGGCCCTGGGCAGGCTG |
| pEXG2_pppA_F1 | TGTTAAGCTAAAGCTTGTCGGTCGCTATTTCCCGCTGAC |
| pEXG2_pppA_F2 | GCATACCCGGTTAAGGACAACTGATGGTGAACTCGAGCCGCAAGCATGCTGAA |
| pEXG2_pppA_R1 | TCAATCAGTATCTAGAGCCGGTGAGGATCTCGTAGAGCAC |
| pEXG2_pppA_R2 | CCGGAAGTTCTATGTCCATGTCCGTCTCAGAATTCAGCATGCTTGCGGCTCGAGTT |
| pEXG2_retS_F1 | TCAATCAGTATCTAGACGGAAACCCAGCCGATCATGG |
| pEXG2_retS_F2 | AACTCGAGCCGCAAGCATGCTGAAGGCGAAGTCCCTTCGAAGGTG |
| pEXG2_retS_R1 | TGTTAAGCTAAAGCTTCCAGCATCTTCAGGTAGACGC |
| pEXG2_retS_R2 | TTCAGCATGCTTGCGGCTCGAGTTGCCTACTGGGTCGGCGAACGC |
| pEXG2_Tae1C110S_F1 | TCAAGTACTAGAGCTCGTGGTGCACCGCGAGGACATCTC |
| pEXG2_Tae1C110S_F2 | CTGCCACTCCAGCACATCGGGTAC |
| pEXG2_Tae1C110S_R1 | TATCAGAAACCTGCAGGTAGGCCAGCGACTGCATGCCGTAG |
| pEXG2_Tae1C110S_R2 | GATGTGCTGGAGTGGCAGCATCGCC |
| pBAD_Tae1L21S_F | AGCTGGGACAAGAGCTACAGCGCCGGCACCCCG |
| pBAD_Tae1L21S_R | CTTGTTCGGGGTGCCGGCGCTGTAGCTCTTGTC |
| pBAD_Tae1G48S_F | GGCGTACCGATGCCCCGCAGCAACGCCAACGCC |
| pBAD_Tae1G48S_R | GACCATGGCGTTGGCGTTGCTGCGGGGCATCGG |
| pBAD_Tae1G56S_F | GCCAACGCCATGGTCGACAGCCTGGAGCAGAGC |
| pBAD_Tae1G56S_R | GGTCCAGCTCTGCTCCAGGCTGTCGACCATGGC |
| pBAD_Tae1G42S_F | TCGGTGGCCGCCGAGCTGAGCGTACCGATGCCC |
| pBAD_Tae1G42S_R | GCCGCGGGGCATCGGTACGCTCAGCTCGGCGGC |
| pBAD_Tae1V43S_F | GTGGCCGCCGAGCTGGGCAGCCCGATGCCCCGC |
| pBAD_Tae1V43S_R | GTTGCCGCGGGGCATCGGGCTGCCCAGCTCGGC |
| pBAD_Tae1A52P_F | CCCCGCGGCAACGCCAACCCGATGGTCGACGGC |
| pBAD_Tae1A52P_R | CTCCAGGCCGTCGACCATCGGGTTGGCGTTGCC |
| pBAD_Tae1S144A_F | CTCAACTACTACGTCTACGCCCTGGCCAGTTGC |
| pBAD_Tae1S144A_R | CAGGCTGCAACTGGCCAGGGCGTAGACGTAGTA |
| pBAD_Tae1S147A_F | TACGTCTACTCCCTGGCCGCCTGCAGCCTGCCC |
| pBAD_Tae1S147A_R | GGCCCTGGGCAGGCTGCAGGCGGCCAGGGAGTA |
| pBAD_Tae1S149A_F | TACTCCCTGGCCAGTTGCGCCCTGCCCAGGGCC |
| pBAD_Tae1S149A_R | GAGACTGGCCCTGGGCAGGGCGCAACTGGCCAG |
| pBAD_Tae1A116T_F | TGCGGCAGCATCGCCGGCACTGTCGGCCAGAGC |
| pBAD_Tae1A116T_R | GCCCTGGCTCTGGCCGACAGTGCCGGCGATGCT |
| pBAD_Tae1D134N_F | CAGGTGTGGAATCGCACCAACCGCGACCGCCTC |
| pBAD_Tae1D134N_R | GTAGTTGAGGCGGTCGCGGTTGGTGCGATTCCA |
| pBAD_Tae1S147I_F | TACGTCTACTCCCTGGCCATTTGCAGCCTGCCC |
| pBAD_Tae1S147I_R | GGCCCTGGGCAGGCTGCAAATGGCCAGGGAGTA |
| DMS_Lib_Amplify_F | AATGATACGGCGACCACCGAGATCTACACCTTTCGGGCTTTGTTAGCAG |
| DMS_Lib_Amplify_R1 | CAAGCAGAAGACGGCATACGAGATGGAACGGAGTGACTGGAGTTCAGA CGTGTGCTCTTCCGATCTTCGATAGTAGCCTATGAAGCATGCTTACTA |
| DMS_Lib_Amplify_R2 | CAAGCAGAAGACGGCATACGAGATCGGCACATGTGACTGGAGTTCA GACGTGTGCTCTTCCGATCTTCGATAGTAGCCTATGAAGCATGCTTACTA |
| DMS_Lib_Amplify_R3 | CAAGCAGAAGACGGCATACGAGATTACCCTTGGTGACTGGAGTTCA GACGTGTGCTCTTCCGATCTTCGATAGTAGCCTATGAAGCATGCTTACTA |
| DMS_Lib_Amplify_R4 | CAAGCAGAAGACGGCATACGAGATTAGGTGTCGTGACTGGAGTTCA GACGTGTGCTCTTCCGATCTTCGATAGTAGCCTATGAAGCATGCTTACTA |
| DMS_Lib_Amplify_R5 | CAAGCAGAAGACGGCATACGAGATGAATCACTGTGACTGGAGTTCA GACGTGTGCTCTTCCGATCTTCGATAGTAGCCTATGAAGCATGCTTACTA |
| DMS_Lib_Amplify_R6 | CAAGCAGAAGACGGCATACGAGATCATAGAGTGTGACTGGAGTTCA GACGTGTGCTCTTCCGATCTTCGATAGTAGCCTATGAAGCATGCTTACTA |
| DMS_custom_seq_F | GGTGGTGCTCGACGATAGCACGTCTCTGACACCGAATTC |
| DMS_custom_seq_R | GCCCAGCCGGCGATGGCCATGGATATCGGAATTAATTC |
Table 2
X-ray data collection and refinement statistics for Tae1C110S (PDB ID: 7TVH).
| Crystal 1 | |
|---|---|
| Data collection | |
| Space group | P 1 21 1 |
| Cell dimensions | |
| a, b, c (Å) | 39.121 108.512 82.402 |
| Resolution (Å) | 65.56–1.71 (1.77–1.71) |
| Rsym or Rmerge | 0.03896 (0.9019) |
| I / I | 10.48 (0.80) |
| Completeness (%) | 98.45 (87.02) |
| Redundancy CC1/2 | 2.00 (2.00) 0.999 (0.469) |
| Refinement | |
| Resolution (Å) | 65.56–1.71 |
| No. reflections | 72,921 (6436) |
| Rwork/Rfree | 0.2113/0.2430 |
| No. atoms | 4,673 |
| Protein | 4,277 |
| Water | 396 |
| B-factors | |
| Protein | 38.21 |
| Water | 43.00 |
| r.m.s. deviations | |
| Bond lengths (Å) Bond angles | 0.006 0.77 |
| Ramachandran favored (%) | 98.09 |
| Ramachandran allowed (%) Ramachandran outliers (%) Rotamer outliers | 1.91 0 0 |
-
Values in parentheses are for the highest-resolution shell.
Additional files
Download links
A two-part list of links to download the article, or parts of the article, in various formats.
Downloads (link to download the article as PDF)
Open citations (links to open the citations from this article in various online reference manager services)
Cite this article (links to download the citations from this article in formats compatible with various reference manager tools)
Antibacterial potency of type VI amidase effector toxins is dependent on substrate topology and cellular context
eLife 11:e79796.
https://doi.org/10.7554/eLife.79796


