Resource allocation accounts for the large variability of rate-yield phenotypes across bacterial strains
- Université Côte d’Azur, Inria, INRAE, CNRS, Sorbonne Université, France
- Université Côte d’Azur, INRAE, CNRS, Institut Sophia-Agrobiotech, France
- Université Grenoble Alpes, Inria, France
- Montana State University, United States
Figures
Figure 1
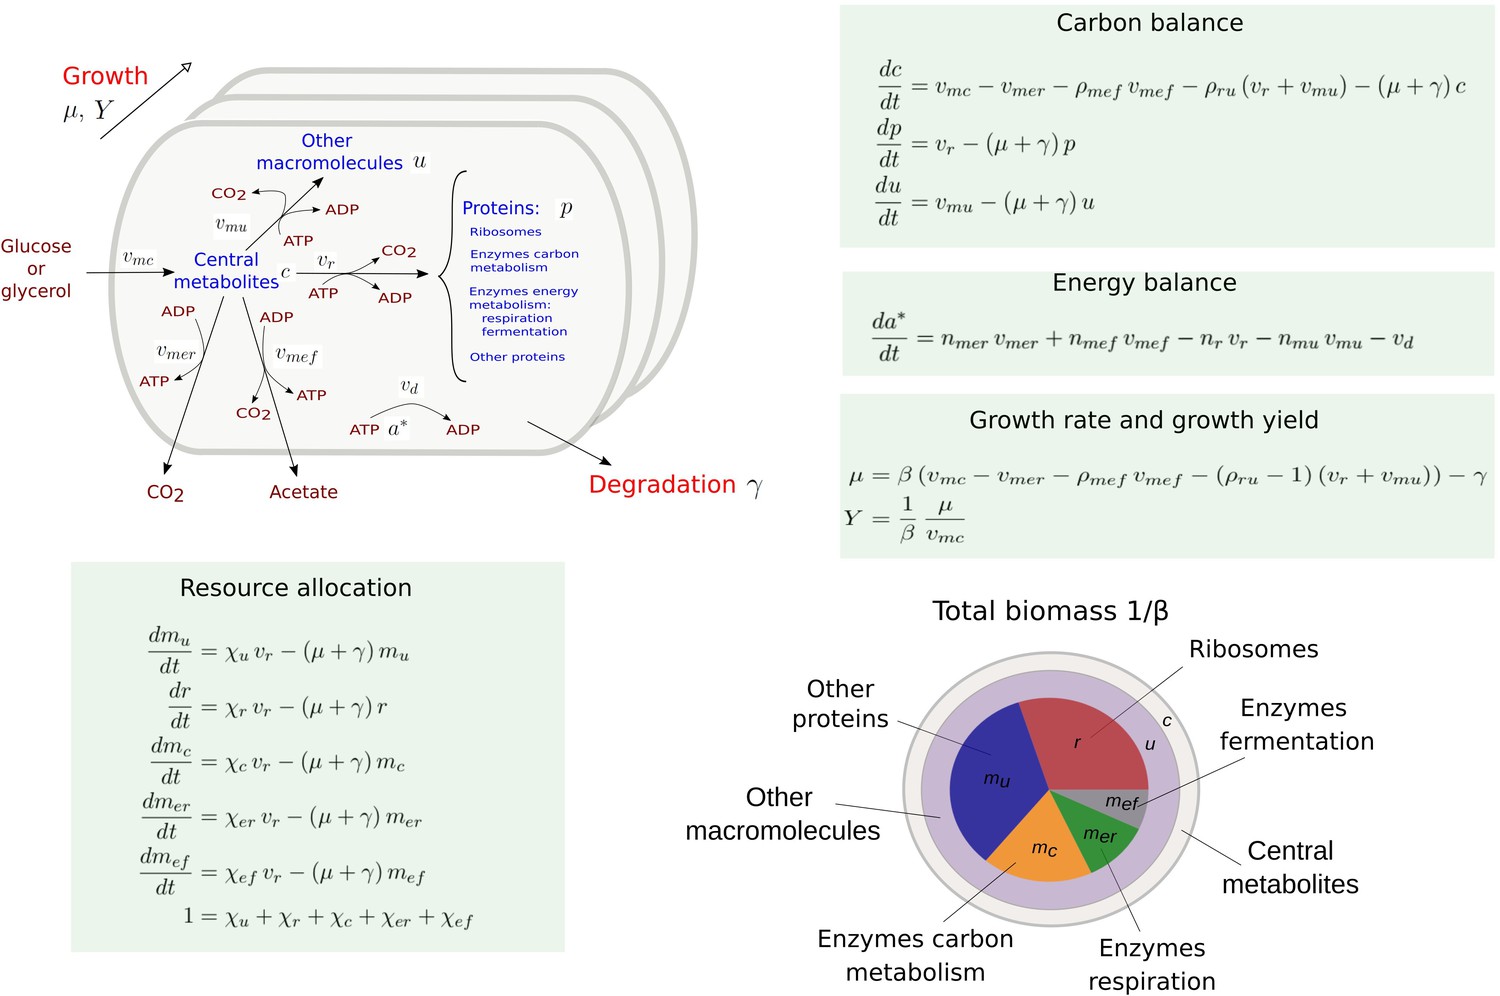
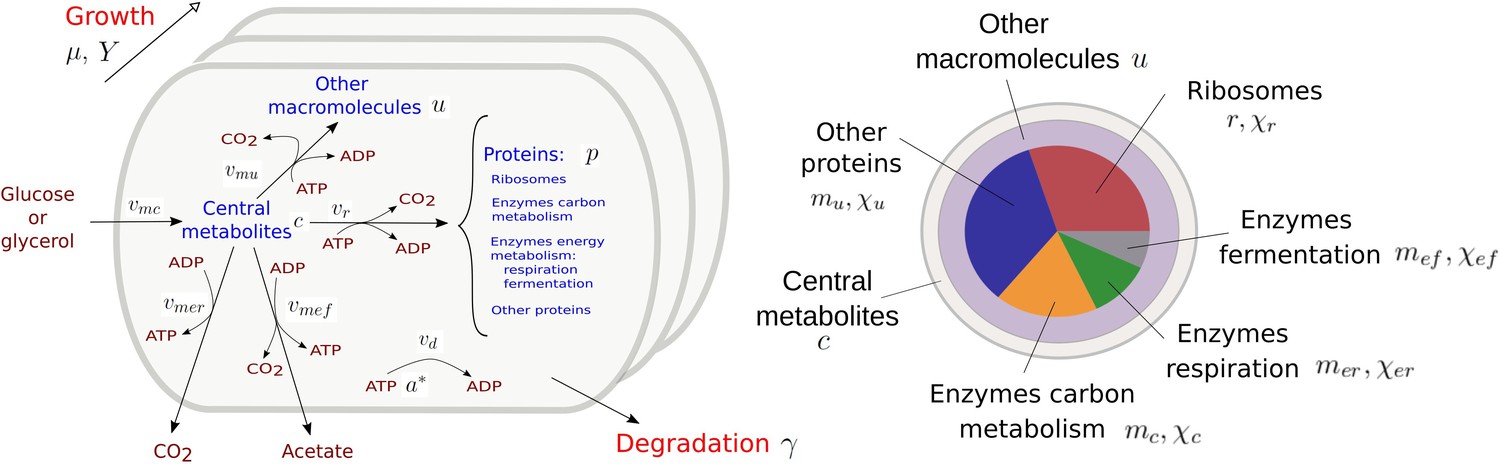
Coarse-grained model of microbial growth with coupled carbon and energy fluxes.
Upper left figure: schematic outline of the model, showing the biomass constituents and the macroreactions, as well as the growth and degradation of biomass. Green boxes: system of differential equations describing the carbon and energy balances, growth rate and growth yield, and resource allocation. The kinetic expressions for the reaction rates can be found in Appendix 1. The growth rate and growth yield are defined in terms of the fluxes of the macroreactions. Lower right figure: biomass composition, including the protein categories considered in resource allocation. The fluxes vr, , , , , vd [Cmmol or mmol gDW-1 hr-1], the variables , , mu, mc, , , , , [Cmmol or mmol gDW-1], the resource allocation parameters , , , , [dimensionless], the degradation rate constant [hr-1], the biomass density [Cmmol gDW-1], the ATP yield and cost factors , , nr, [mmol Cmmol-1], and the correction factors for CO2 loss , [dimensionless] are formally defined in Appendix 1. The values of the parameters are derived in Appendix 2.
Figure 2 with 4 supplements
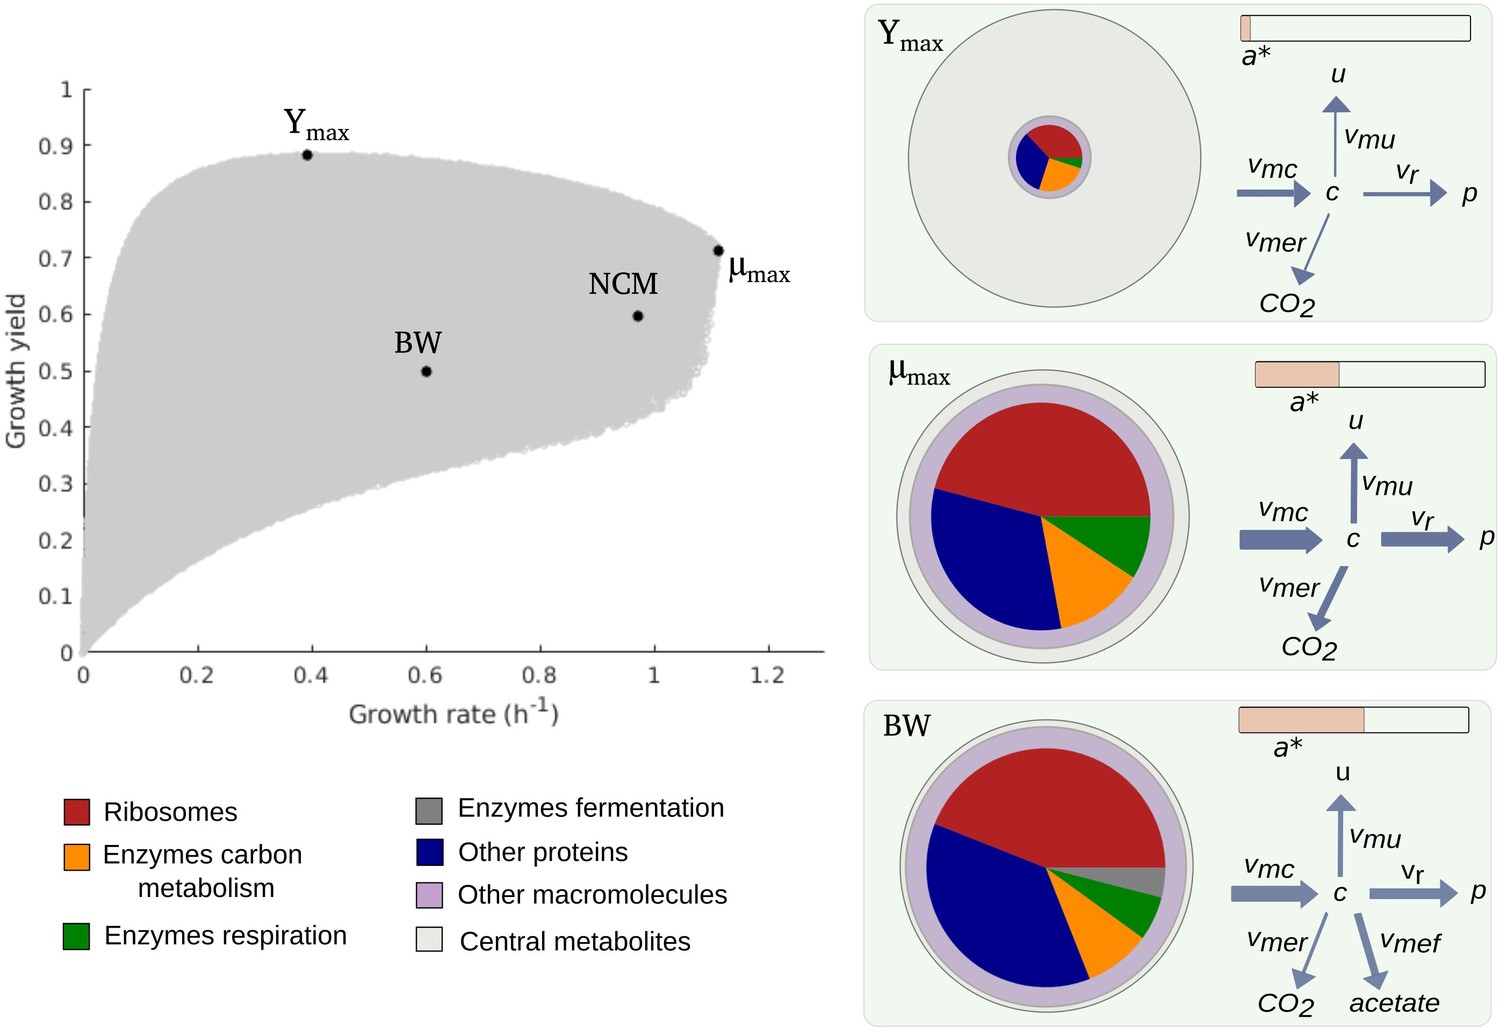
Predicted rate-yield phenotypes and underlying resource allocation strategies.
Predicted rate-yield phenotypes during balanced growth of E. coli on minimal medium with glucose (gray dots). The resource allocation strategy and growth physiology underlying the rate-yield phenotypes are shown for selected points, corresponding to the BW25113 reference strain (BW), predicted maximum growth rate (), and predicted maximum growth yield (Ymax). The pictograms show the biomass composition, flux distribution, and energy charge. Note that by calibration, the predicted and observed resource allocation strategies for the reference strain are identical. We also indicate, for later reference, the rate-yield phenotype of the NCM3722 strain (NCM).
Figure 2—figure supplement 1

Observed allocation of resources to the category of residual proteins in different growth conditions.
Using data for the E. coli BW25113 reference strain (Schmidt et al., 2016), we computed for a large variety of growth conditions the fraction of the proteome consisting of proteins other than ribosomes and translation-affiliated proteins, enzymes in central carbon metabolism, and enzymes in energy metabolism (). The considered conditions concern growth on different limiting carbon sources, different temperatures, different pH, etc. The computations were carried out in the same way as for model calibration (Materials and methods). The solid line corresponds to the mean of the value for over the different conditions and the broken lines to the upper and lower bound of the variation from the mean. In the simulations underlying Figures 2—4 in the main text, the value of was sampled from the interval between the upper and lower bound, .
Figure 2—figure supplement 2
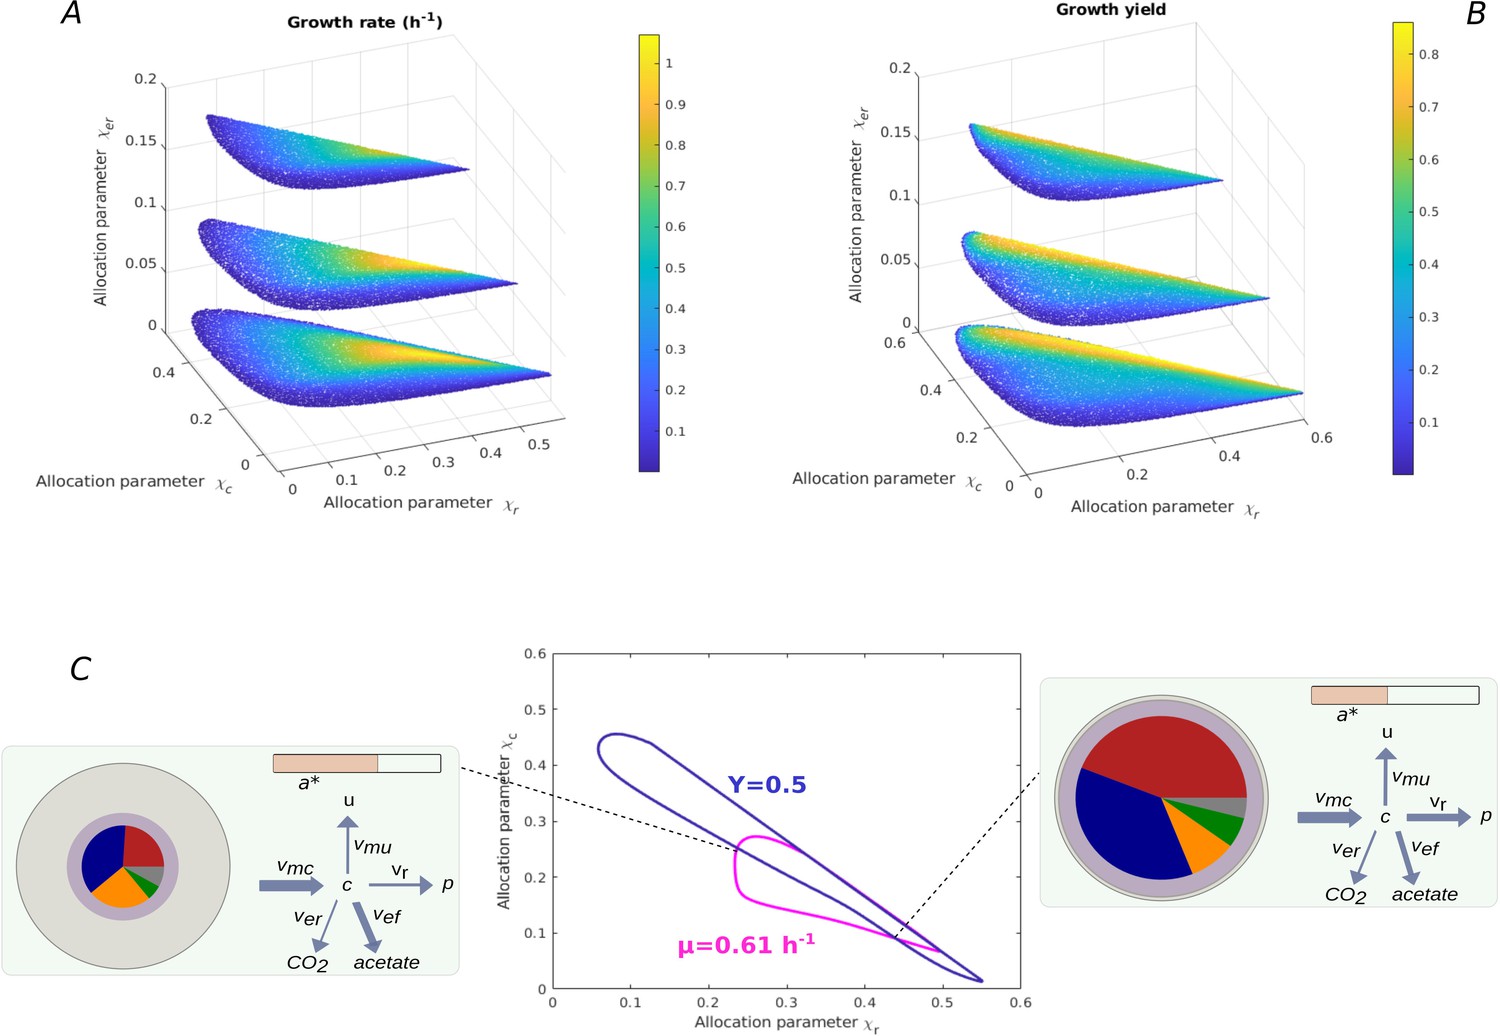
Relation between resource allocation strategies and rate-yield phenotypes.
(A) Predicted dependence of the growth rate on values for for batch growth in minimal medium with glucose. was set to the constant value of 0.37 for the BW25113 reference strain (Appendix 2), while three different values for were explored (0.02, 0.1, 0.2). Note that each combination fixes the remaining value of due to the constraint that the resource allocation parameters sum to 1 (Appendix 1). (B) Idem for the growth yield. Each resource allocation strategy leads to a unique rate-yield phenotype. (C) Rate and yield isoclines in the space for fixed values of and . In particular, the isoclines correspond to a growth rate of 0.61 hr-1 and a growth yield of 0.50, the BW25113 phenotype, for a value of set to 0.062 (Appendix 2). The two isoclines have four intersection points, that is, the specified growth rate and growth yield can be reached for four combinations of values of and. The growth physiology obtained at two of the intersection points is quantitatively different, as illustrated by the two pictograms (see Figure 2 for legend). When allowing to continuously vary over a range of values, an infinite number of resource allocation strategies can account for the specified rate and yield.
Figure 2—figure supplement 3
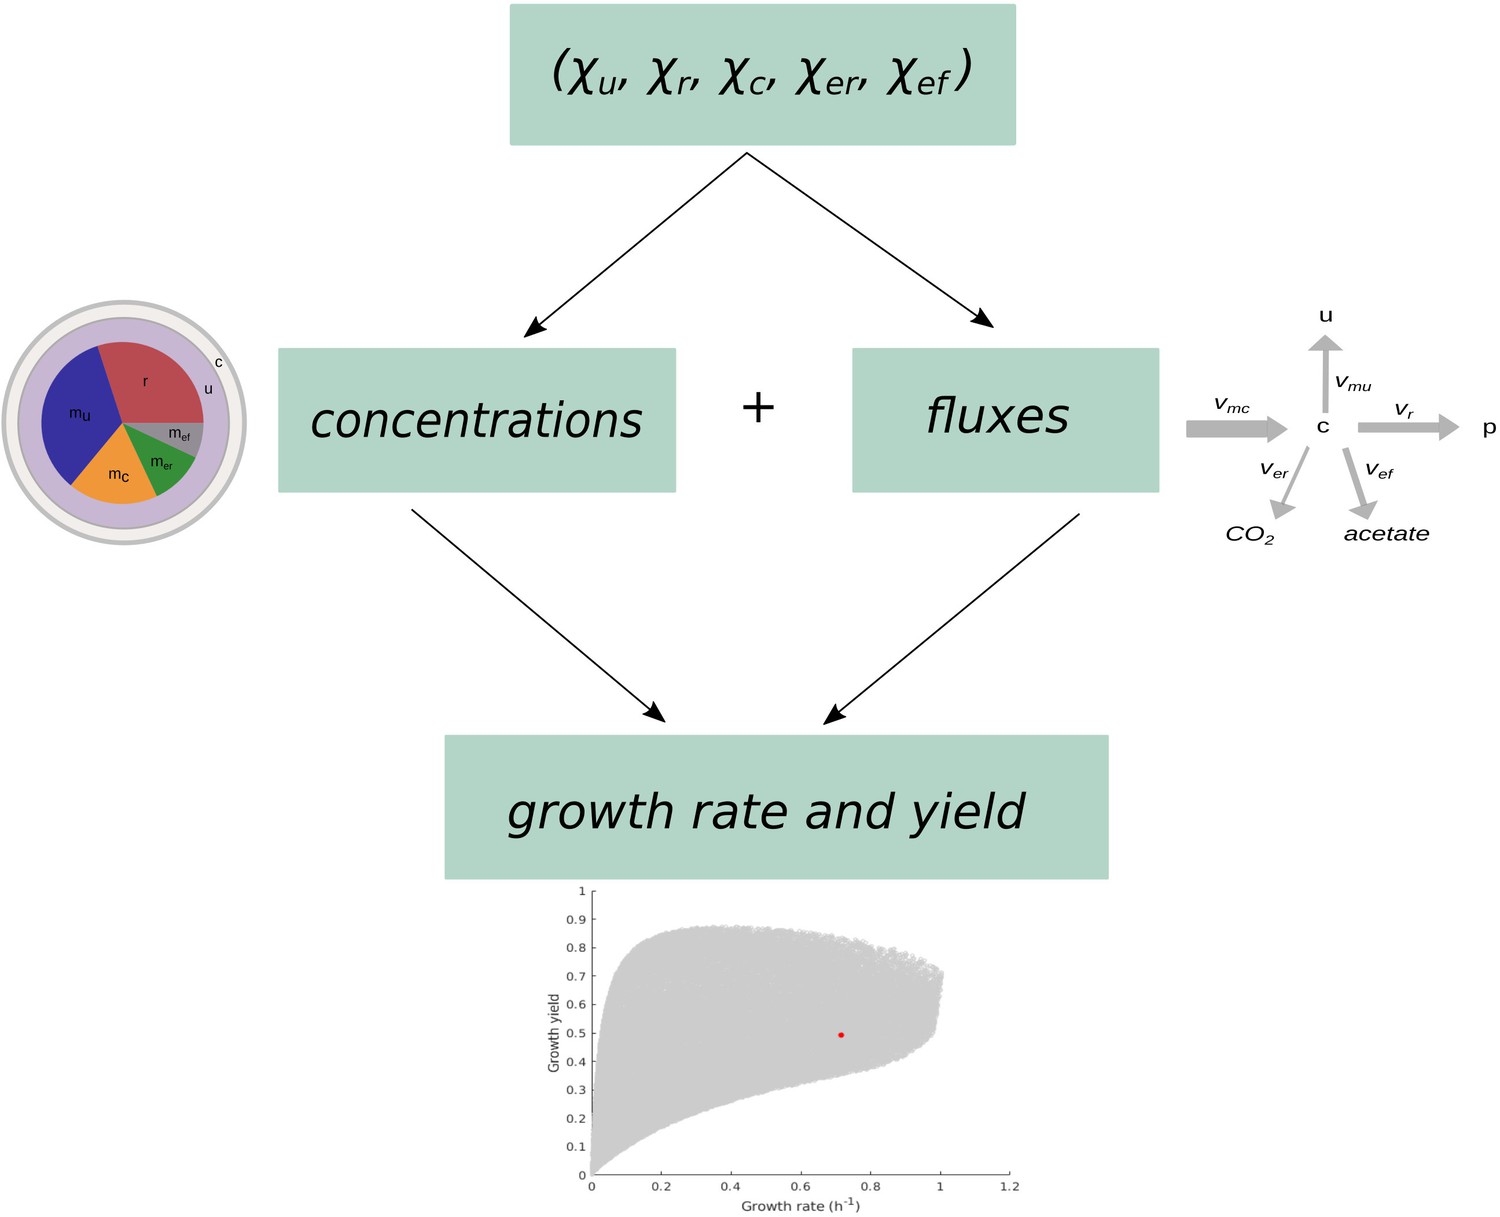
Schematic overview of the computation of growth rate and growth yield from resource allocation strategies.
The computational procedure takes a resource allocation strategy as input and simulates microbial growth until steady state is reached. The fluxes and concentrations at steady state are used to compute the growth rate and growth yield as output.
Figure 2—figure supplement 4
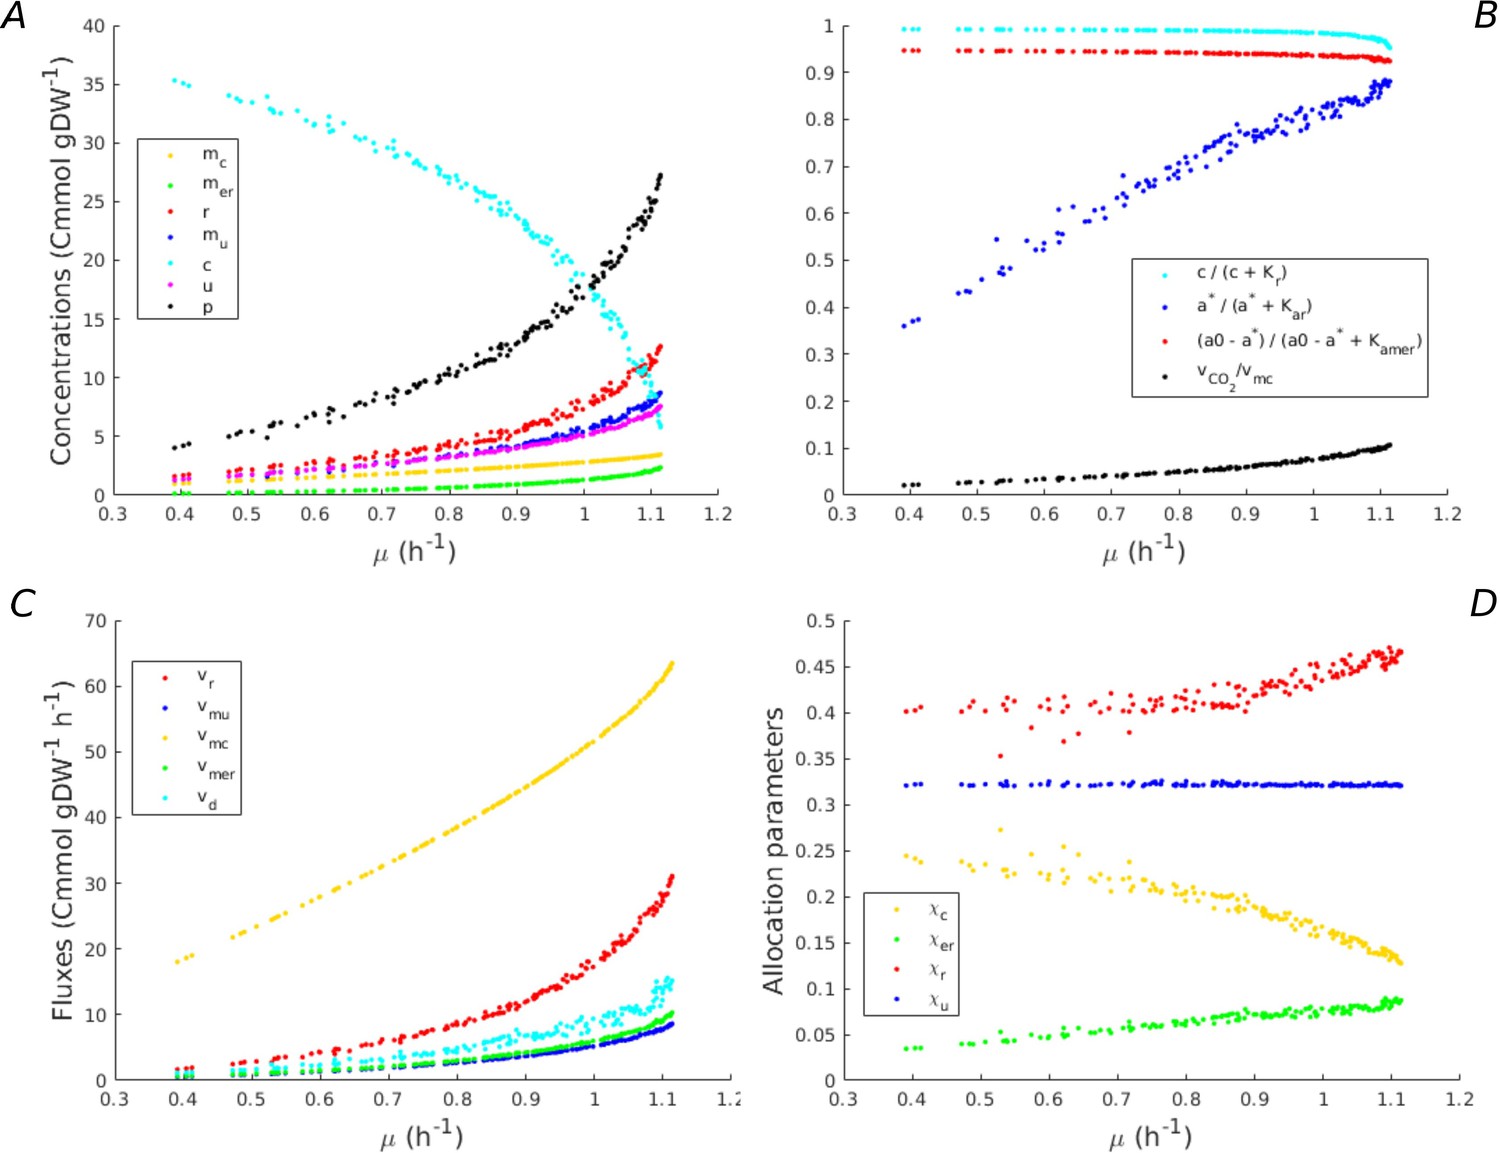
Predicted fluxes, concentrations, and resource allocation along the Pareto frontier of growth rate and growth yield.
(A) Concentrations along the Pareto frontier in Figure 2. The concentrations of macromolecules increase, whereas the concentration of central carbon metabolites decreases. (B) Saturation of kinetic expressions for central carbon metabolites and energy cofactors (ADP, ATP), and loss of CO2 during macromolecular synthesis. The latter loss is proportionally low as compared to the total flux of carbon through the growing bacteria. Whereas the concentrations of central carbon metabolites and ADP are saturating, this is not the case for ATP. (C) Fluxes along the Pareto frontier. All fluxes increase with the growth rate, as expected. (D) Resource allocation parameters along the Pareto frontier. Whereas the fraction of other proteins remains constant and low, the fraction of energy proteins increases and the fraction of enzymes in central metabolism decreases. Interestingly, the fraction of ribosomal proteins only increases at the highest growth rate. At lower growth rates, an increase of the protein synthesis rate is obtained by a higher ATP driving force.
Figure 3 with 1 supplement

Predicted rate-yield phenotypes and comparison with experimental data.
(A) Measured proteome fractions of the protein categories in the model, corresponding to resource allocation strategies during balanced growth, for the BW25113 reference strain used for model calibration (Schmidt et al., 2016 and Appendix 2). (B) Predicted and observed combinations of growth rate and growth yield for balanced batch growth of E. coli in minimal medium with glucose. The rate-yield phenotypes concern the reference strain, other wild-type strains, mutant strains obtained by directed mutagenesis, and mutant strains from adaptive laboratory evolution (ALE) experiments. (C) Idem for continuous growth in a chemostat in minimal medium with glucose at different dilution rates (0.2, 0.35, and 0.5 hr-1). The predicted yields are shown for the indicated dilution rates ±10%. (D) Idem for batch growth of E. coli in minimal medium with glycerol. All predictions were made using the model in Figure 1, calibrated for the different growth conditions, and varying the resource allocation parameters as described in the text (90,000–160,000 samples). The measurements of rate and yield reported in the source literature have been converted to units hr-1 (growth rate) and a dimensionless unit corresponding to (growth yield) (see Materials and methods and Supplementary files 1 and 2 for details).
Figure 3—figure supplement 1
Robustness of rate-yield predictions for alternative model calibration and alternative model assumption.
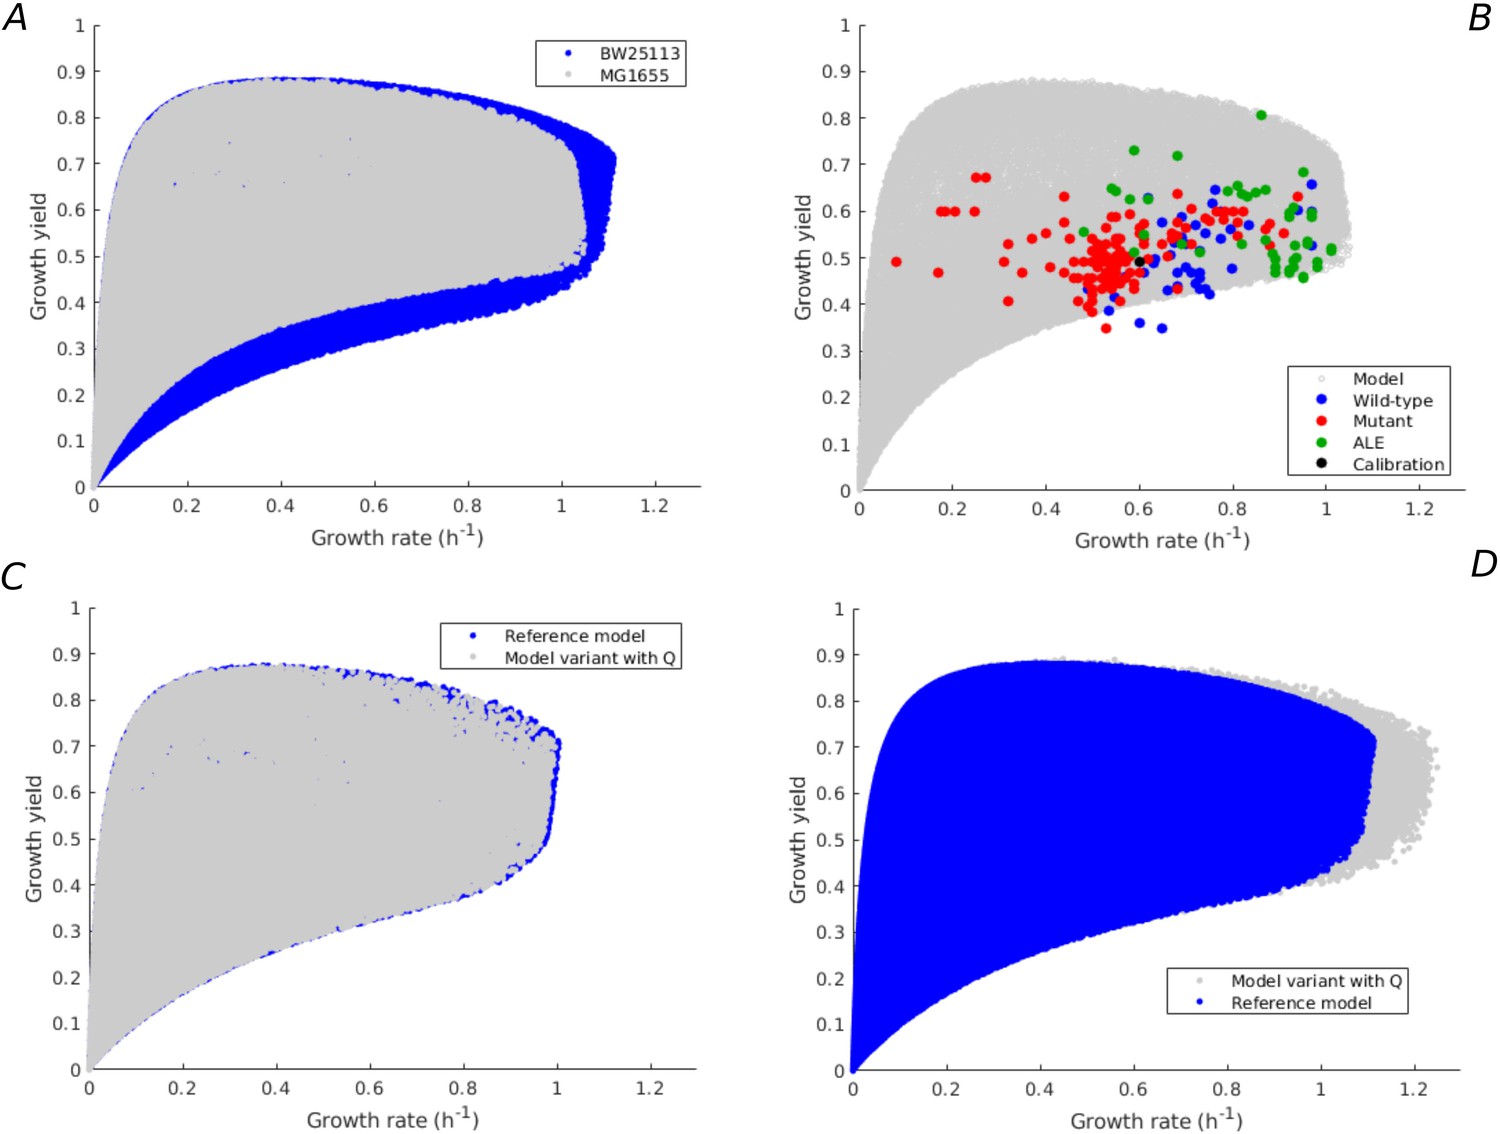
(A) Rate-yield predictions (gray) for the same model as in Figure 1, but calibrated by means of experimental data for the MG1655 instead of BW25113 strain, in the case of minimal growth on glucose (see Appendix 2 for details). The blue dots correspond to the predictions for the model calibrated by means of data for the BW reference strain. (B) Comparison of the rate-yield predictions from the alternative model in panel A with the experimental data from Figure 3B. The rate-yield variability predicted by the model calibrated with the MG data agrees with both the predicted variability of the reference model and the observed rate-yield phenotypes. (C) Rate-yield predictions (gray) for a model variant having a growth-rate-independent protein category with fixed resource allocation parameter (see Appendix 1 for details). The model was calibrated using data for the BW strain (Appendix 2—table 3), in the case of batch growth on glucose. The blue dots correspond to the predictions for the reference model in Figure 1. (D) Idem, when the value of is allowed to vary by 10%, corresponding to the observed difference between the BW25113 and NCM3722 strains. In both cases the clouds of blue and gray dots largely overlap, indicating that the model predictions are robust for an alternative model hypothesis and an alternative model calibration.
Figure 4 with 2 supplements
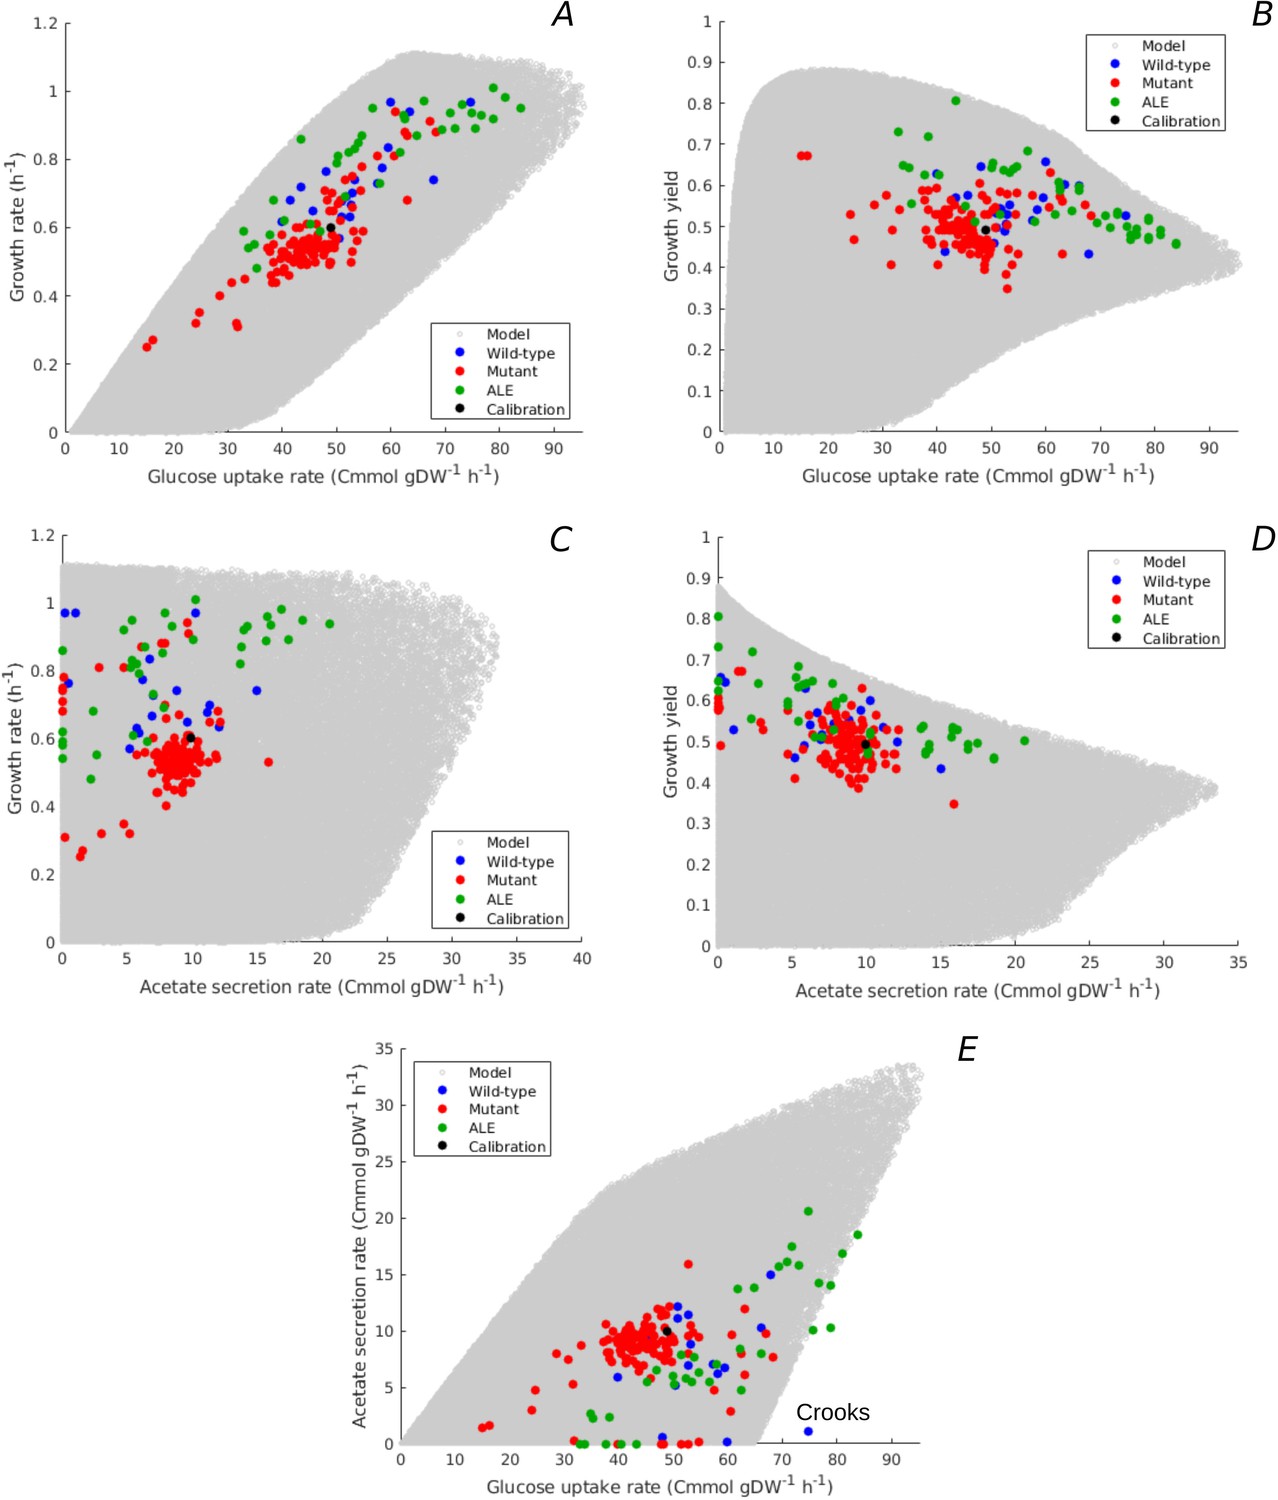
Predicted uptake-secretion phenotypes and comparison with experimental data.
(A) Predicted and observed glucose uptake rates and growth rates for the case of batch growth of E. coli on minimal medium with glucose. (B) Idem for glucose uptake rates and growth yields. (C) Idem for acetate secretion rates and growth rates. (D) Idem for acetate secretion rates and growth yields. (E) Idem for glucose uptake and acetate secretion rates. The predicted uptake-secretion phenotypes and were taken from the simulations giving rise to Figure 3B. The measurements of glucose uptake and acetate secretion rates reported in the source literature have been converted to units Cmmol gDW-1 hr-1 (see Materials and methods and Supplementary files 1 and 2 for details). The Crooks strain, labeled in panel E, shows an uptake-secretion phenotype deviating from the range of predicted phenotypes.
Figure 4—figure supplement 1
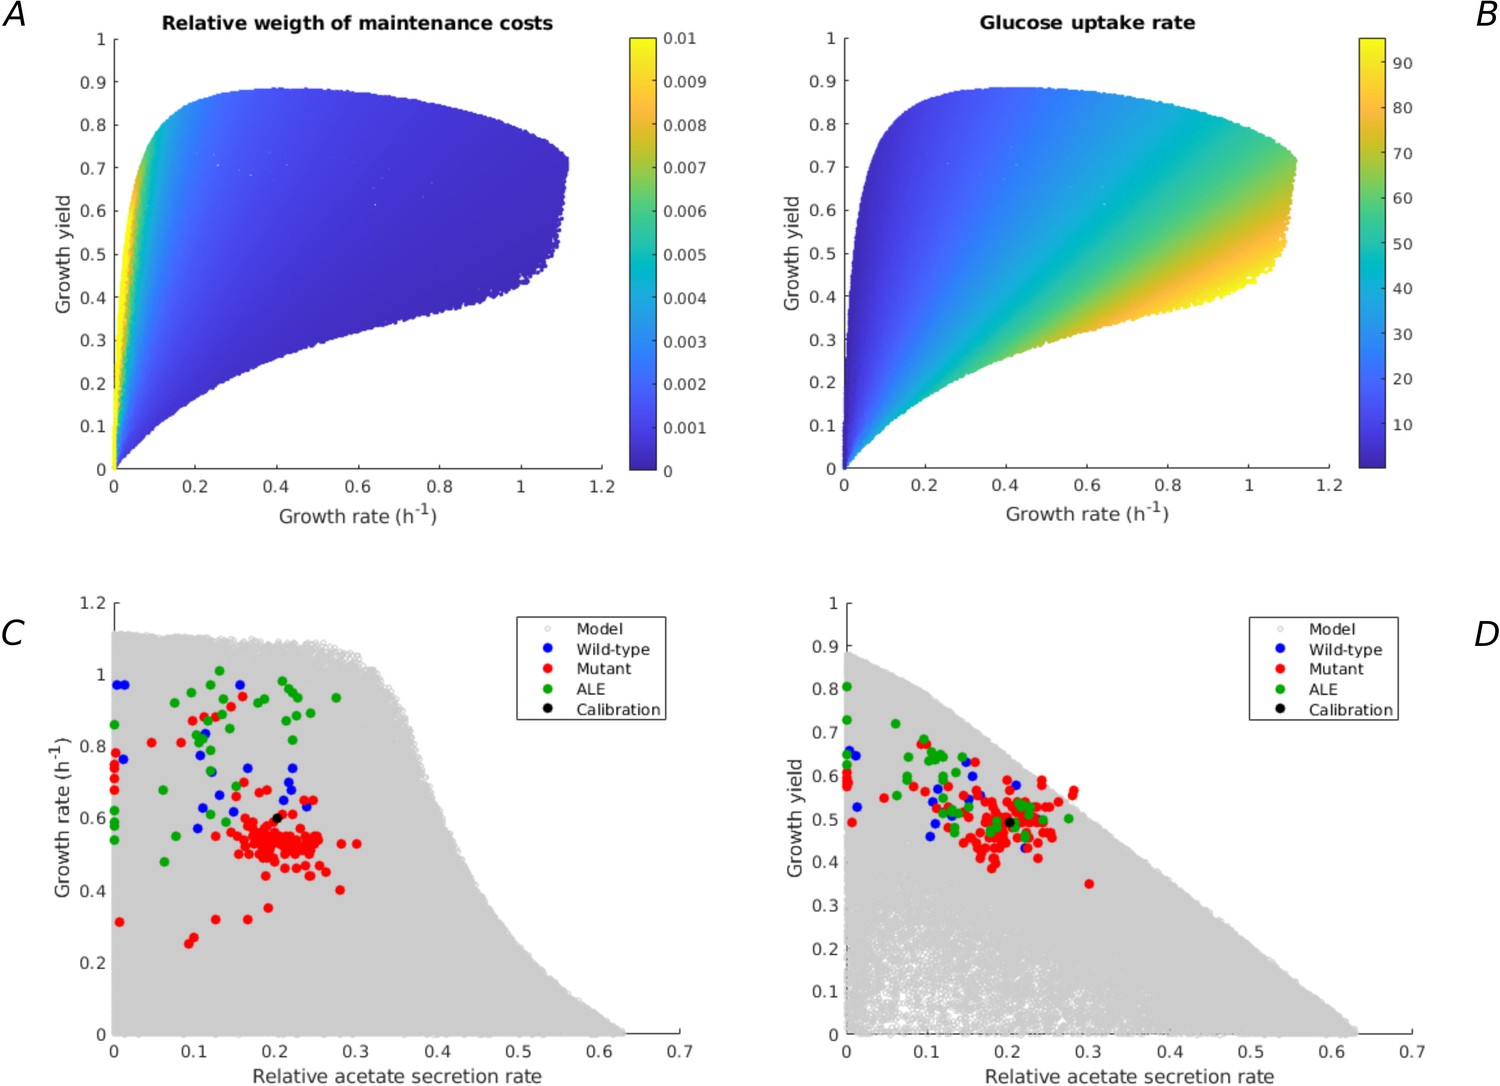
Additional model predictions of rate-yield and uptake-secretion phenotypes and their comparison with experimental data.
All predictions concern the case of E. coli growing on minimal medium with glucose (Figure 2). (A) Relative weight of maintenance costs due to degradation of macromolecules () for predicted rate-yield phenotypes. (B) Glucose uptake rates corresponding to predicted rate-yield phenotypes. (C) Predicted and observed relative acetate secretion rates vs growth rates. (D) Predicted and observed relative acetate secretion rates vs growth yields.
Figure 4—figure supplement 2

Variation of normalized acetate secretion rate with growth rate in experiments with a single E. coli strain growing in different environments.
The plot shows data from Basan et al., 2015a, and Cheng et al., 2019, concerning batch growth of an NCM strain with a modified, titrable uptake system in minimal medium with glucose, data from Nanchen et al., 2006, concerning continuous growth in a chemostat of the MG1655 strain in minimal medium with glucose, data from Holms, 1996, concerning batch growth of the ML308 strain in minimal medium with various carbon sources, data from Gerosa et al., 2015, concerning batch growth of the BW25113 strain in minimal medium with various carbon sources, and data from Valgepea et al., 2010, and Peebo et al., 2015, concerning continuous growth in a chemostat of the MG1655 and BW25113 strains, respectively, in minimal medium with glucose. The relative acetate uptake rate, defined as the ratio of the acetate secretion rate (in unit Cmmol gDW-1 hr-1) and the glucose uptake rate (in the same unit), has a tendency to increase with the growth rate. This indicates a proportionally higher loss of carbon, and therefore lower yield, corresponding to a gradual shift of ATP production from respiration to fermentation.
Figure 5 with 1 supplement
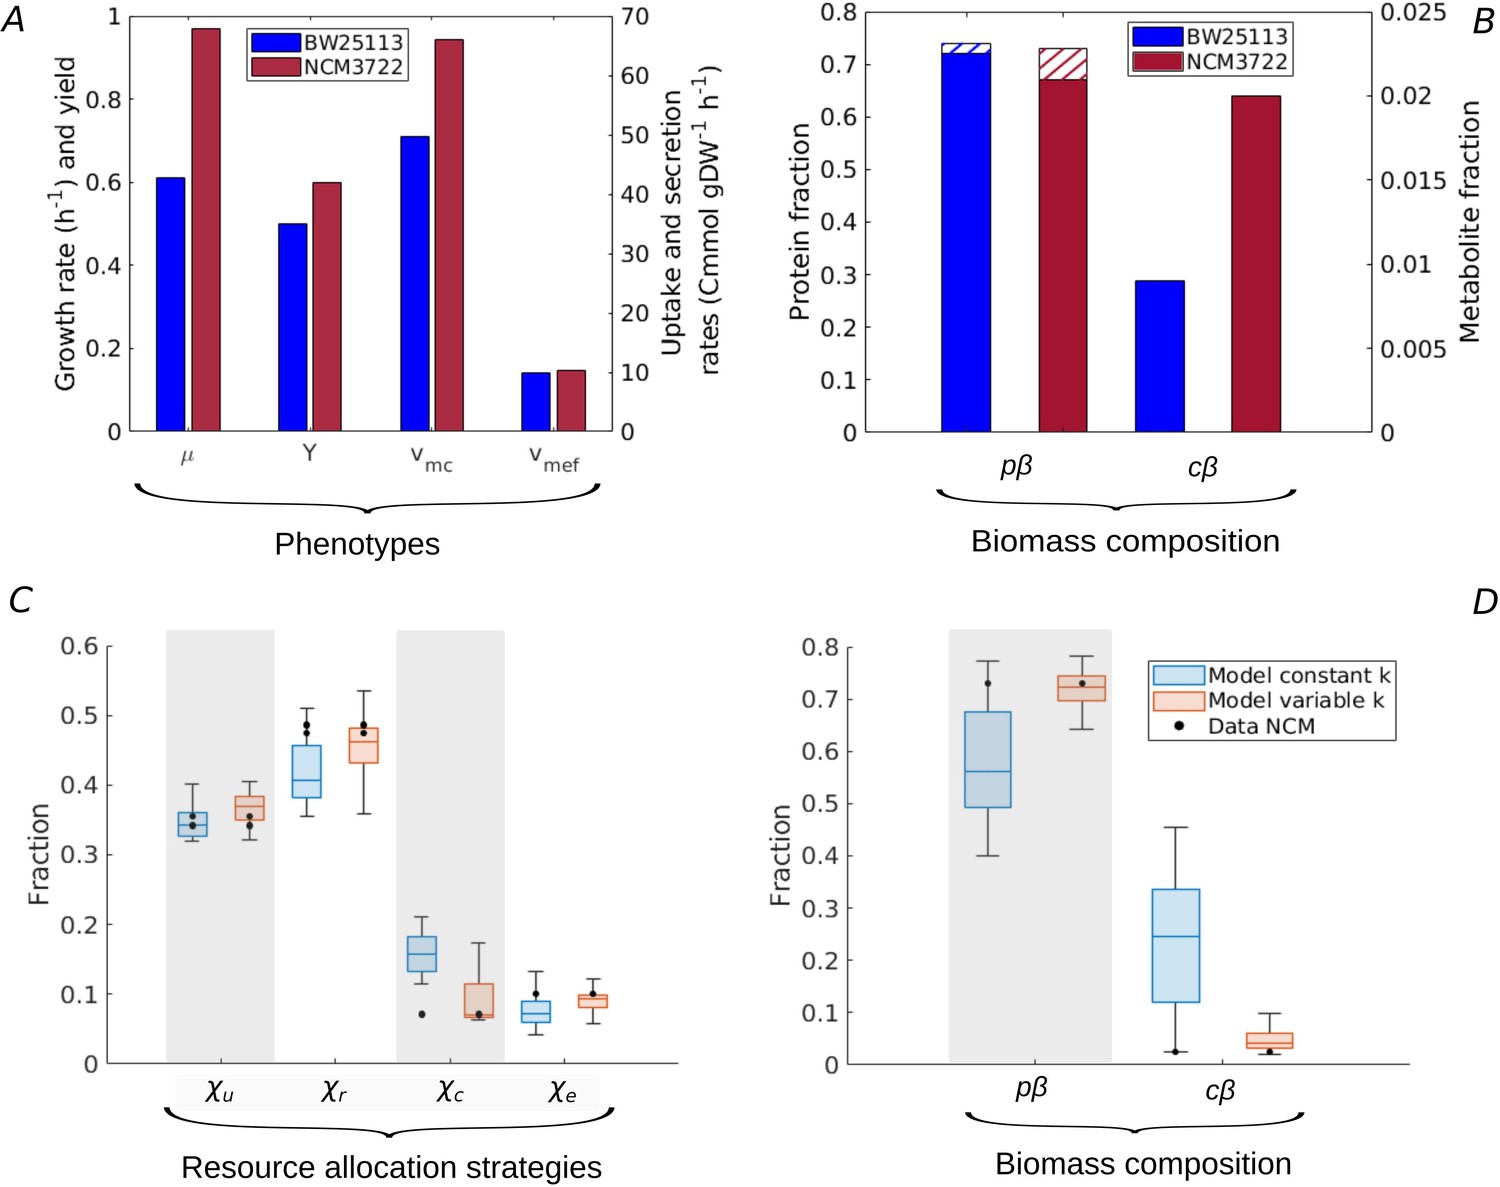
Resource allocation strategies underlying high-rate, high-yield phenotypes.
(A) Characterization of the physiology of the NCM3722 strain in comparison with the BW25113 strain during batch growth on glucose (data from Appendix 2—table 1 and Appendix 2—table 5). (B) Comparison of total protein and metabolic fractions in NCM and BW. The total protein fraction includes amino acids (Figure 1), which is indicated by the hatched pattern. (C) Predicted resource allocation strategies for a strain with the NCM phenotype, in the case of the model with fixed catalytic constants (blue boxplot) or a model variant in which catalytic constants are allowed to vary twofold (red boxplot). The observed resource allocation strategy for NCM (Schmidt et al., 2016, black dots) corresponds with the strategies predicting the NCM phenotype when catalytic constants are allowed to vary, that is, when metabolic regulation in addition to resource allocation is taken into account. The model predictions summarized in the boxplot concern strategies with simulated rate-yield and uptake-secretion phenotypes within 5% of the observed values for NCM. The black dots correspond to three independent replicates of the proteomic measurements (Schmidt et al., 2016). (D) Predicted and observed biomass composition for high-rate, high-yield growth of E. coli, with data for NCM (Appendix 2—table 5). Regulation of enzyme activity leads to a very good match of predicted and observed total protein and metabolite concentrations, here indicated as fractions of the total biomass ( and ).
Figure 5—figure supplement 1

Relative changes in kinetic parameters for resource allocation strategies reproducing the observed phenotypes of the NCM3722 strain during minimal growth on glucose.
We repeated the sampling procedure explained in the Materials and methods section while allowing the values of the catalytic constants, , , and to vary by maximally twofold (higher or lower). A total of 200,000 simulations were run. The plot shows the combinations of parameter values, relative to the values for the BW25113 reference strain (Appendix 2), that allow growth rate μ, growth yield , glucose uptake rate, , and acetate secretion rate of the NCM3722 strain to be reproduced (within a 5% margin) by resource allocation strategies that are close to those observed for NCM (within a 5% margin). The resource allocation strategy of NCM was computed from the data from Schmidt et al., 2016 (Materials and methods) and the phenotype data are shown in Figure 5A. Agreement between resource allocation strategies allowing the observed NCM growth phenotype to be reproduced is obtained for an increased value of (higher activity of glycolytic enzymes). The increase in enzyme activity allows resources to be liberated for augmenting the concentrations of other proteins and central carbon metabolites (), thus increasing growth rate and growth yield. Changes in and may fine-tune these effects, but are not necessary.
Appendix 1—figure 1
Resource allocation model of coupled carbon and energy fluxes in microorganisms.
The figure shows the biomass categories and macroreactions, together with the concentration variables, reaction rates, and growth and degradation rates.
Appendix 2—figure 1

Protein dry mass fraction for different growth rates of E. coli.
The protein dry mass fraction (g gDW-1) as a function of the steady-state growth rate was computed from data for the NCM3722 wild-type strain grown in different media (red dots) or for a strain carrying a plasmid for the gratuitous overexpression of a protein (blue dots) (Appendix Table S4 in Basan et al., 2015b). We interpolated the data (black line) to provide an estimate of the protein dry mass fractions at the growth rates corresponding to batch growth of the BW25113 strain in minimal medium with either glucose or glycerol ( hr-1 or hr-1, respectively).
Appendix 2—figure 2
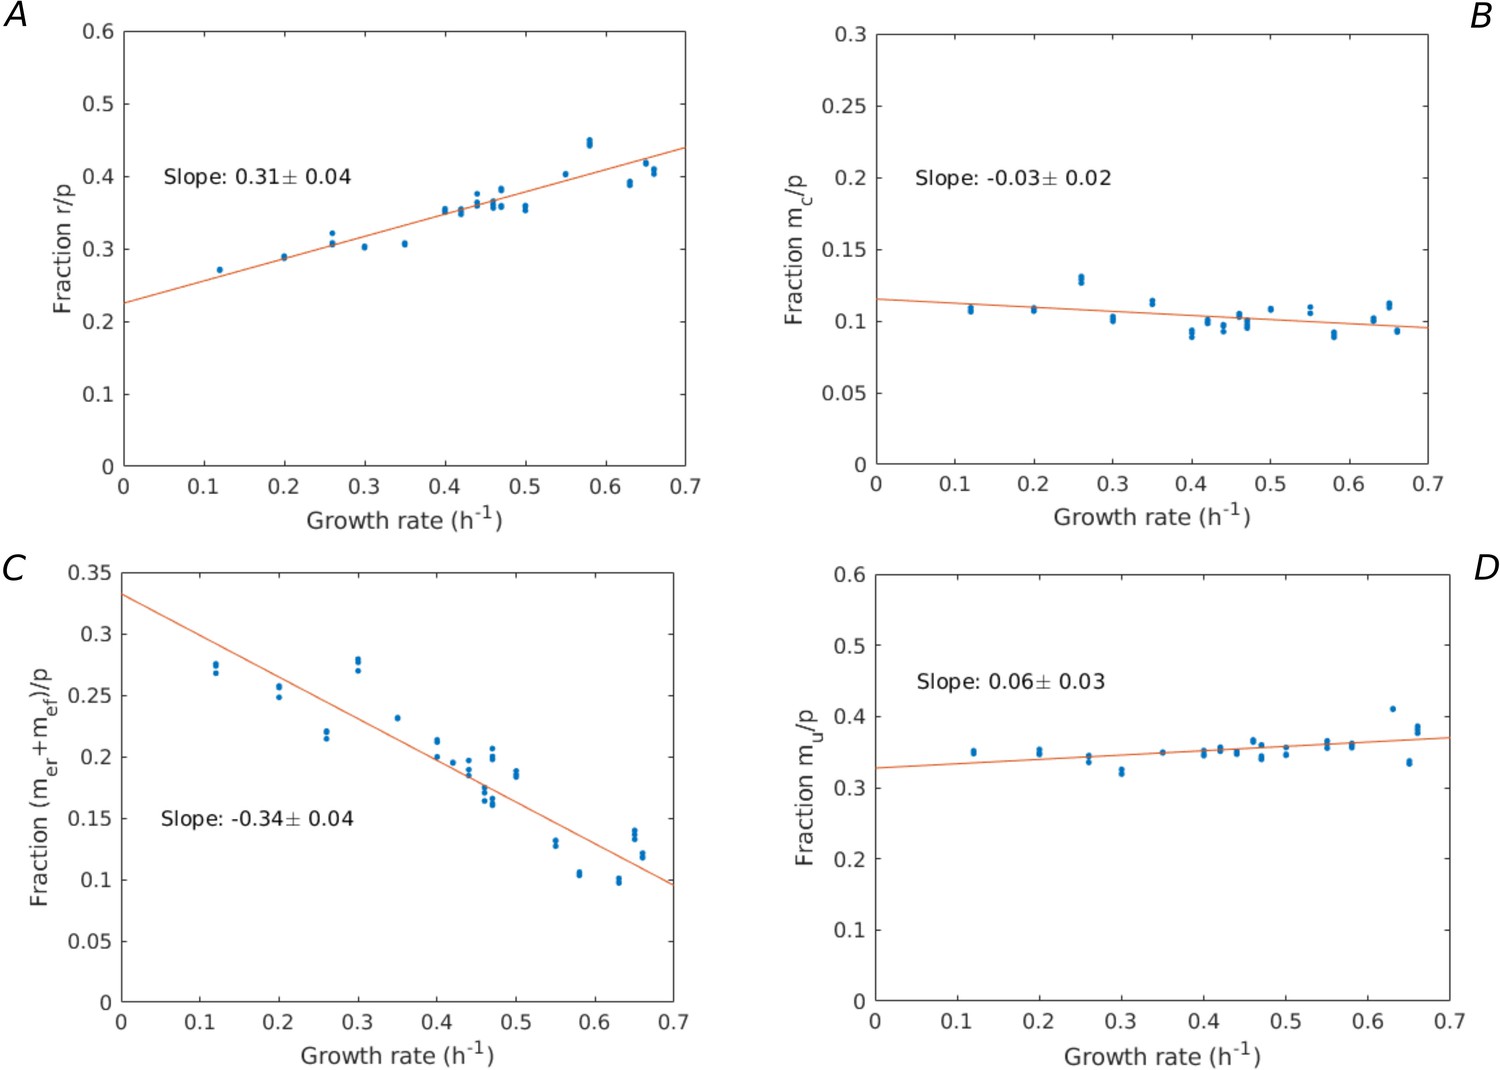
Growth-rate dependency of proteome fractions.
Using the data from Schmidt et al., 2016, the proteome fractions over a large variety of growth conditions (growth on different limiting carbon sources, different temperatures, different pH, etc.) are plotted for the categories: (A) ribosomes and translation-affiliated proteins (), (B) enzymes in central carbon metabolism (), (C) enzymes in energy metabolism (), and (D) other proteins (). A linear regression is performed, giving rise to slopes (A) 0.31 ± 0.04, (B) –0.03 ± 0.02, (C) –0.34 ± 0.04, and (D) 0.06 ± 0.03, showing that only the fraction significantly increases with the growth rate.
Tables
Appendix 1—table 1
Model variables and rates.
The units Cmmol and gDW refer to mmol carbon and gram dry weight, respectively.
| Model | Description | Unit |
|---|---|---|
| Macromolecule concentrations | ||
| Total proteins | Cmmol gDW-1 | |
| Ribosomes | Cmmol gDW-1 | |
| mc | Enzymes in central carbon metabolism | Cmmol gDW-1 |
| Enzymes in energy metabolism (respiration) | Cmmol gDW-1 | |
| Enzymes in energy metabolism (fermentation) | Cmmol gDW-1 | |
| mu | Other proteins | Cmmol gDW-1 |
| Other macromolecules | Cmmol gDW-1 | |
| Metabolite concentrations | ||
| Central carbon metabolites | Cmmol gDW-1 | |
| ADP | mmol gDW-1 | |
| ATP | mmol gDW-1 | |
| Reaction rates | ||
| Carbon uptake and central metabolism | Cmmol gDW-1 hr-1 | |
| Energy metabolism (respiration) | Cmmol gDW-1 hr-1 | |
| Energy metabolism (fermentation) | Cmmol gDW-1 hr-1 | |
| vr | Protein synthesis | Cmmol gDW-1 hr-1 |
| Synthesis of other macromolecules | Cmmol gDW-1 hr-1 | |
| vd | Energy dissipation | mmol gDW-1 hr-1 |
| Other rates and yield | ||
| μ | Growth rate | hr-1 |
| γ | Degradation rate | hr-1 |
| Y | Growth yield | – |
Appendix 1—table 2
Model parameters.
| Model | Description | Unit |
|---|---|---|
| Resource allocation parameters | ||
| Fraction of ribosomal proteins | – | |
| Fraction of enzymes in central carbon metabolism | – | |
| Fraction of enzymes in respiratory energy metabolism | – | |
| Fraction of enzymes in fermentation energy metabolism | – | |
| Fraction of other proteins | – | |
| ATP factors | ||
| ATP yield from respiration | mmol Cmmol-1 | |
| ATP yield from fermentation | mmol Cmmol-1 | |
| nr | ATP cost of protein synthesis | mmol Cmmol-1 |
| ATP cost of synthesis of other macromolecules | mmol Cmmol-1 | |
| Correction factors | ||
| Correction for CO2 loss during fermentation | – | |
| Correction for CO2 loss during biosynthesis | – | |
| Total biomass concentration | Cmmol gDW-1 |
Appendix 2—table 1
Reconstruction of growth and degradation rates, fluxes, and concentrations from published datasets for the case of batch growth of E. coli in minimal medium with glucose or glycerol, as explained in the text.
The uncertainty intervals for the rates, fluxes, and metabolite concentrations are standard deviations reported in the source publications, after unit conversion. The uncertainty interval for the total biomass concentration was obtained by propagating the errors of the measurements in the right-hand side of (Morin et al., 2016). The uncertainty interval for the total protein concentration was obtained by combining the latter error with the standard error of the mean for the total protein fraction predicted by the linear model fitted to the data in Appendix 2—figure 1. The resulting error was distributed over the individual protein categories according to their mass fractions. References: Haverkorn van Rijsewijk et al., 2011, Gerosa et al., 2015, Esquerré et al., 2014, Farmer and Jones, 1976, Morin et al., 2016, Basan et al., 2015b, Schmidt et al., 2016, Park et al., 2016.
| Rates | Unit | Glucose | Glycerol | Reference |
|---|---|---|---|---|
| 0.027 | 0.032 | |||
| Uptake, secretion, biosynthesis fluxes | ||||
| 4.6 | 7.3 | Derived | ||
| 6.5 | 5.3 | Derived | ||
| 19.2 | 15.8 | Derived | ||
| Total biomass concentration | ||||
| Protein concentrations | ||||
| 1.9 | 4.4 | Derived | ||
| 1.1 | 0.47 | Derived | ||
| Metabolite concentrations | ||||
| Concentration of other biomass | ||||
| 10.2 | 10.2 | Derived | ||
Appendix 2—table 2
Estimation of the values of the kinetic parameters in the model, in the case of batch growth of E. coli in minimal medium with glucose or glycerol, as explained in the text.
| Parameter | Glucose | Glycerol | Unit |
|---|---|---|---|
| 1.17 | 1.17 | – | |
| 1.5 | 1.5 | – | |
| 2.9 | 3.6 | ||
| 1.2 | 1.3 | ||
| 18.3 | 11.2 | ||
| 5.0 | 4.4 | ||
| 17.4 | 6.7 | ||
| 2279 | 6462 | ||
| 0.29 | 0.28 | ||
| 0.29 | 0.28 | ||
| 0.29 | 0.28 | ||
| 0.29 | 0.28 | ||
| 0.0009 | 0.0005 | ||
| 0.0011 | 0.001 | ||
| 0.0011 | 0.001 | ||
| 0.0009 | 0.0005 | ||
| 4.3 | 4.7 | ||
| 2.0 | 2.3 | ||
| 0.77 | 0.09 | ||
| 0.65 | 0.65 |
Appendix 2—table 3
Reconstruction of growth and degradation rates, fluxes, and concentrations from published datasets for the case of continuous growth of E. coli in minimal medium with glucose at different dilution rates (D0.2: 0.2 hr-1, D0.35: 0.35 hr-1, D0.5: 0.5 hr-1).
For the error bars, see Appendix 2—table 1. References: a Peebo et al., 2015, b Esquerré et al., 2014, c Morin et al., 2016, d Basan et al., 2015b, e Schmidt et al., 2016, f Gerosa et al., 2015, g Park et al., 2016.
| Rates | Unit | D0.2 | D0.35 | D0.5 | Reference |
|---|---|---|---|---|---|
| hr-1 | o.2 | 0.35 | 0.5 | ||
| hr-1 | 0.027 | 0.027 | 0.027 | ||
| Uptake, secretion, and biosynthesis fluxes | |||||
| 16.0 | 26.2 | 37.4 | |||
| 5.3 | 8.1 | 9.4 | Derived | ||
| 0.02 | 0.16 | 2.0 | |||
| 1.9 | 3.4 | 5.2 | Derived | ||
| 7.3 | 11.8 | 16.1 | Derived | ||
| Total biomass concentration | |||||
| Protein concentrations | |||||
| 7.9 | 7.1 | 5.2 | Derived | ||
| 0.05 | 0.1 | 0.6 | Derived | ||
| Metabolite concentrations | |||||
| 0.005 | 0.006 | 0.008 | |||
| 0.011 | 0.015 | 0.016 | |||
| 0.016 | 0.021 | 0.024 | |||
| Concentration of other biomass | |||||
| 8.2 | 9.0 | 9.8 | Derived | ||
Appendix 2—table 4
Estimation of the values of the kinetic parameters in the model, in the case of continuous growth of E. coli in minimal medium with glucose at different dilution rates (D0.2: 0.2 hr-1, D0.35: 0.35 hr-1, D0.5: 0.5 hr-1), as explained in the text.
| Parameter | D0.2 | D0.35 | D0.5 | Unit |
|---|---|---|---|---|
| 1.16 | 1.17 | 1.17 | – | |
| 1.5 | 1.5 | 1.5 | – | |
| 1.6 | 2.5 | 2.9 | ||
| 0.33 | 0.61 | 1.0 | ||
| 4.5 | 7.6 | 11.2 | ||
| 1.3 | 2.3 | 3.6 | ||
| 0.77 | 2.98 | 6.8 | ||
| 3203 | 4001 | 3633 | ||
| 0.29 | 0.29 | 0.29 | ||
| 0.29 | 0.29 | 0.29 | ||
| 0.29 | 0.29 | 0.29 | ||
| 0.29 | 0.29 | 0.29 | ||
| 0.0005 | 0.0006 | 0.0008 | ||
| 0.0011 | 0.0015 | 0.0016 | ||
| 0.0011 | 0.0015 | 0.0016 | ||
| 0.0005 | 0.0006 | 0.0008 | ||
| 4.3 | 4.3 | 4.3 | ||
| 2.0 | 2.0 | 2.0 | ||
| 0.77 | 0.77 | 0.77 | ||
| 0.65 | 0.65 | 0.65 |
Appendix 2—table 5
Reconstruction of growth and degradation rates, uptake and secretion fluxes, and protein and metabolite concentrations from published datasets for E. coli MG1655 and NCM3722 strains for the case of batch growth in glucose minimal medium.
The uncertainty intervals for the rates, fluxes, and metabolite concentrations are standard deviations reported in the source publications, after unit conversion. For the NCM3722 strain, as an example of a fast-growing strain with a higher growth yield than the BW25113 reference strain, we only use a subset of observed values in the main text. References: aCheng et al., 2019, bBasan et al., 2015a, cEsquerré et al., 2014, dFarmer and Jones, 1976, eMonk et al., 2017, fBasan et al., 2015b, gSchmidt et al., 2016, hPark et al., 2016, iMcCloskey et al., 2018.
| Rates | Unit | MG1655 | NCM3722 | Reference |
|---|---|---|---|---|
| 0.027 | – | |||
| Uptake, secretion, and biosynthesis fluxes | ||||
| 5.7 | – | Derived | ||
| 7.0 | – | Derived | ||
| 21.7 | – | Derived | ||
| Total biomass concentration | ||||
| – | ||||
| Protein concentrations | ||||
| – | ||||
| – | ||||
| – | ||||
| – | ||||
| – | Derived | |||
| – | Derived | |||
| Metabolite concentrations | ||||
| 0.046 | – | |||
| 0.008 | – | |||
| 0.054 | – | |||
| Concentration of other biomass | ||||
| 9.4 | – | Derived | ||
Appendix 2—table 6
Estimation of the values of the kinetic parameters in the model for the E. coli MG1655 strain during batch growth in glucose minimal medium from data in Appendix 2—table 5, as explained in the text.
Idem for a model variant with an additional category of growth-rate-independent proteins (), using data for the BW25113 strain from Appendix 2—table 1.
| Parameter | MG1655 | Model variant with Q | Unit |
|---|---|---|---|
| 1.17 | 1.17 | – | |
| 1.5 | 1.5 | – | |
| 2.5 | 6.1 | ||
| 0.9 | 2.5 | ||
| 21.0 | 38.0 | ||
| 4.1 | 10.3 | ||
| 20.4 | 36.1 | ||
| 412 | 2278 | ||
| 0.24 | 0.29 | ||
| 0.24 | 0.29 | ||
| 0.24 | 0.29 | ||
| 0.24 | 0.29 | ||
| 0.005 | 0.0009 | ||
| 0.0008 | 0.0011 | ||
| 0.0008 | 0.0011 | ||
| 0.005 | 0.0009 | ||
| 4.3 | 4.3 | ||
| 2.0 | 2.0 | ||
| 0.77 | 0.77 | ||
| 0.65 | 0.65 |
Additional files
-
Supplementary file 1
Database with reported rate-yield pairs for Escherichia coli grown on glucose minimal medium (excel file).
- https://cdn.elifesciences.org/articles/79815/elife-79815-supp1-v2.xlsx
-
Supplementary file 2
Database with reported rate-yield pairs for Escherichia coli grown on glycerol minimal medium (excel file).
- https://cdn.elifesciences.org/articles/79815/elife-79815-supp2-v2.xlsx
-
Supplementary file 3
Half-saturation constants for reactions in central carbon metabolism of Escherichia coli (excel file).
- https://cdn.elifesciences.org/articles/79815/elife-79815-supp3-v2.xlsx
-
Supplementary file 4
Classification of energy proteins (excel file).
- https://cdn.elifesciences.org/articles/79815/elife-79815-supp4-v2.xlsx
-
MDAR checklist
- https://cdn.elifesciences.org/articles/79815/elife-79815-mdarchecklist1-v2.docx
Download links
A two-part list of links to download the article, or parts of the article, in various formats.
Downloads (link to download the article as PDF)
Open citations (links to open the citations from this article in various online reference manager services)
Cite this article (links to download the citations from this article in formats compatible with various reference manager tools)
Resource allocation accounts for the large variability of rate-yield phenotypes across bacterial strains
eLife 12:e79815.
https://doi.org/10.7554/eLife.79815


