A nucleation barrier spring-loads the CBM signalosome for binary activation
- Stowers Institute for Medical Research, United States
- Department of Molecular and Integrative Physiology, University of Kansas Medical Center, United States
Figures
Figure 1 with 3 supplements
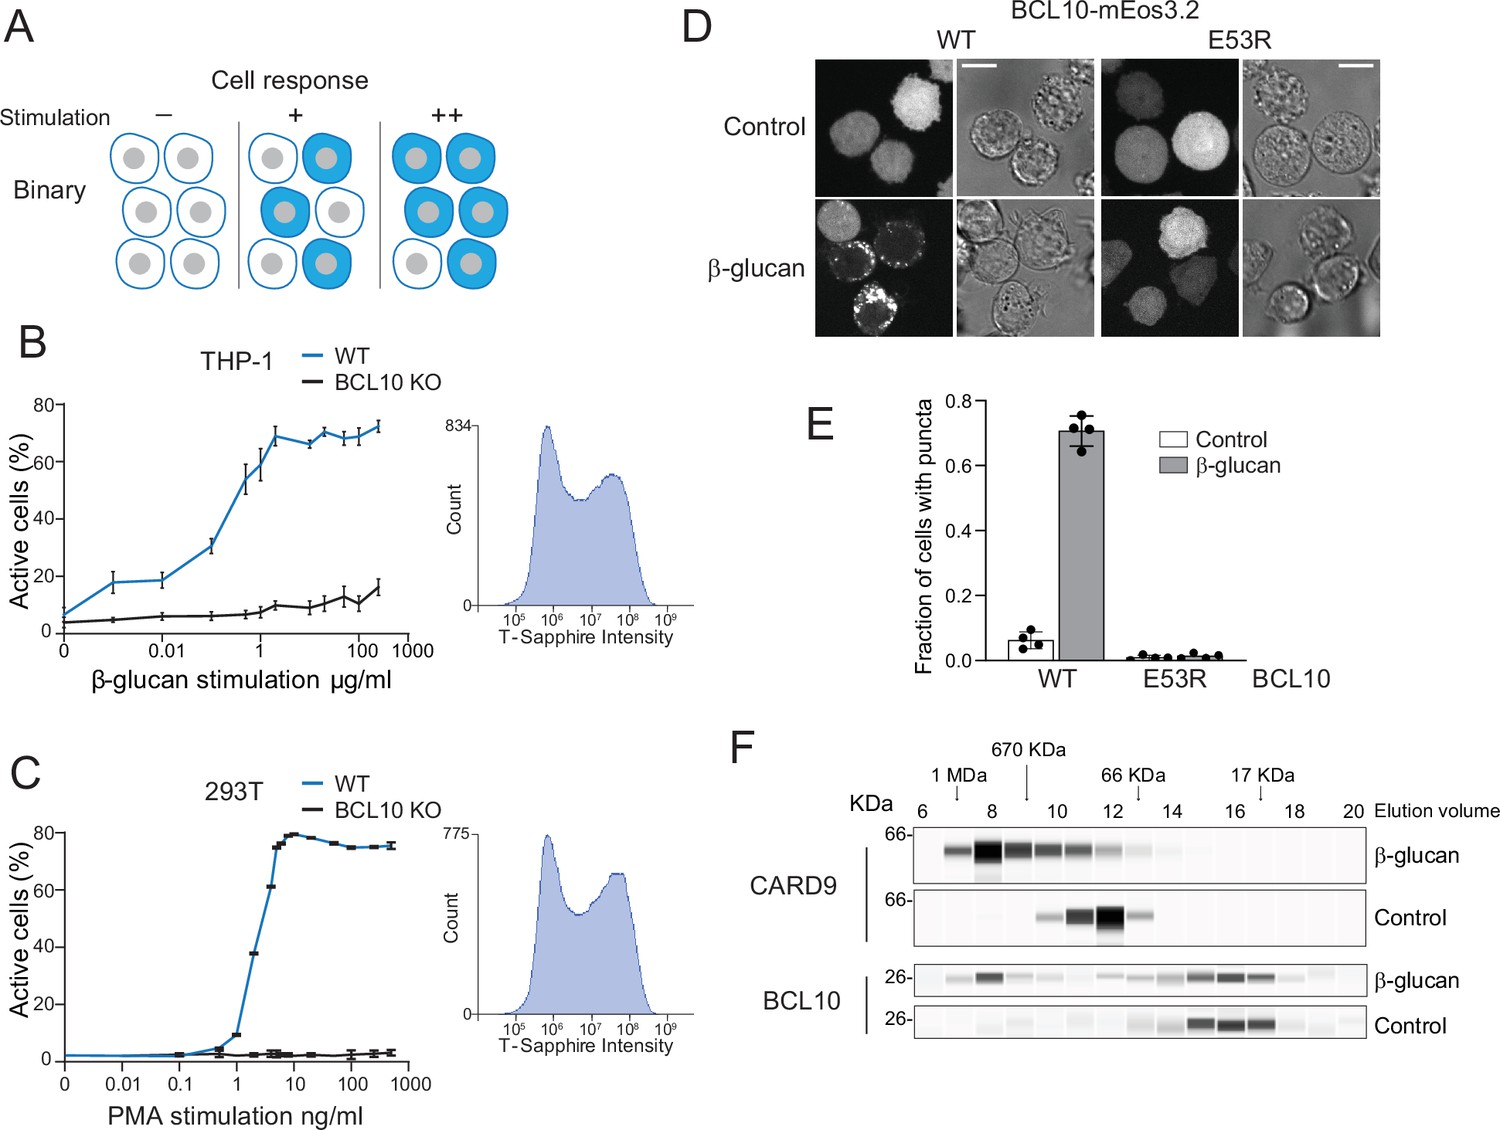
Assembly of the CARD-BCL10-MALT1 (CBM) signalosome drives all-or-none activation of nuclear transcription factor-κB (NF-κB).
(A) Schematic diagram of binary activation in a population of cells. Higher doses of stimulation increase the probability, but not the magnitude, of activation by each cell. (B) β-Glucan stimulation of THP-1 WT and BCL10-KO monocytes transduced with an NF-κB transcriptional reporter. Monocytes were stimulated for 24 hr then measured for T-Sapphire expression via flow cytometry. The graph shows the mean ± standard deviation (SD) fraction of cells positive for NF-κB expression of three biological replicates. The inset shows the histogram of T-Sapphire expression indicating the distinct negative and positive populations of THP-1 WT cells upon stimulation with 10 μg/ml β-glucan. (C) HEK293 WT and BCL10-KO cells were transduced with an NF-κB transcriptional reporter and stimulated with PMA for 24 hr then measured for T-Sapphire expression via flow cytometry. The inset shows the histogram of T-Sapphire expression indicating the distinct negative and positive populations of HEK293T WT cells upon stimulation with 5 ng/ml PMA. Shown are means ± SD of three biological replicates. (D) THP-1 BCL10-KO monocytes were transduced with a doxycycline-inducible BCL10-mEos3.2 construct. Cells were imaged for BCL10 expression 24 hr after Dox induction. Images show BCL10 puncta only in cells treated with β-glucan for 16 hr (see also Figure 1—figure supplement 3). In contrast, BCL10 E53R does not form puncta regardless of stimulation. Scale bar: 10 µm. (E) Quantification of the number of THP-1 cells with BCL10 puncta after β-glucan stimulation. Each dot represents the average of 4 independent experiments with more than 50 cells each. Shown are means ± SD. (F) Endogenous untagged CARD9 and BCL10 form high molecular weight species in THP-1 cells stimulated with β-glucan for 24 hr. After treatment, cells were lysed, and the protein extracts were resolved by size exclusion chromatography followed by capillary immunodetection.
-
Figure 1—source data 1
Full image of protein immunodetection for CARD9 in lysates of THP-1 cells treated with β-glucan.
- https://cdn.elifesciences.org/articles/79826/elife-79826-fig1-data1-v2.zip
-
Figure 1—source data 2
Full image of protein immunodetection for CARD9 in lysates of untreated THP-1 cells.
- https://cdn.elifesciences.org/articles/79826/elife-79826-fig1-data2-v2.zip
-
Figure 1—source data 3
Full image of protein immunodetection for BCL10 in lysates of THP-1 cells treated with β-glucan.
- https://cdn.elifesciences.org/articles/79826/elife-79826-fig1-data3-v2.zip
-
Figure 1—source data 4
Full image of protein immunodetection for BCL10 in lysates of untreated THP-1 cells.
- https://cdn.elifesciences.org/articles/79826/elife-79826-fig1-data4-v2.zip
Figure 1—figure supplement 1

A single-cell nuclear transcription factor-κB (NF-κB) reporter reveals binary activation in both HEK293T and THP-1 cells.
(A) Schematic of the NF-κB reporter integrated into 293T and THP-1 cell lines. The reporter contains four minimal response elements of the NF-κB transcription factor followed by the coding sequence of the fluorescence protein T-Sapphire. Cells were selected for hygromycin resistance after lentiviral transduction. (B) Histograms of T-Sapphire expression for 293T WT cells containing the NF-κB reporter after 24 hr of stimulation with the indicated doses of PMA. (C) Microscopy images of 293T cells containing the NF-κB reporter after 24 hr of stimulation with the indicated doses of PMA, showing a binary pattern of activation wherein the frequency of cells responding, but not the magnitude of the response, increases with the dose. Scale bar: 100 µm.
Figure 1—figure supplement 2
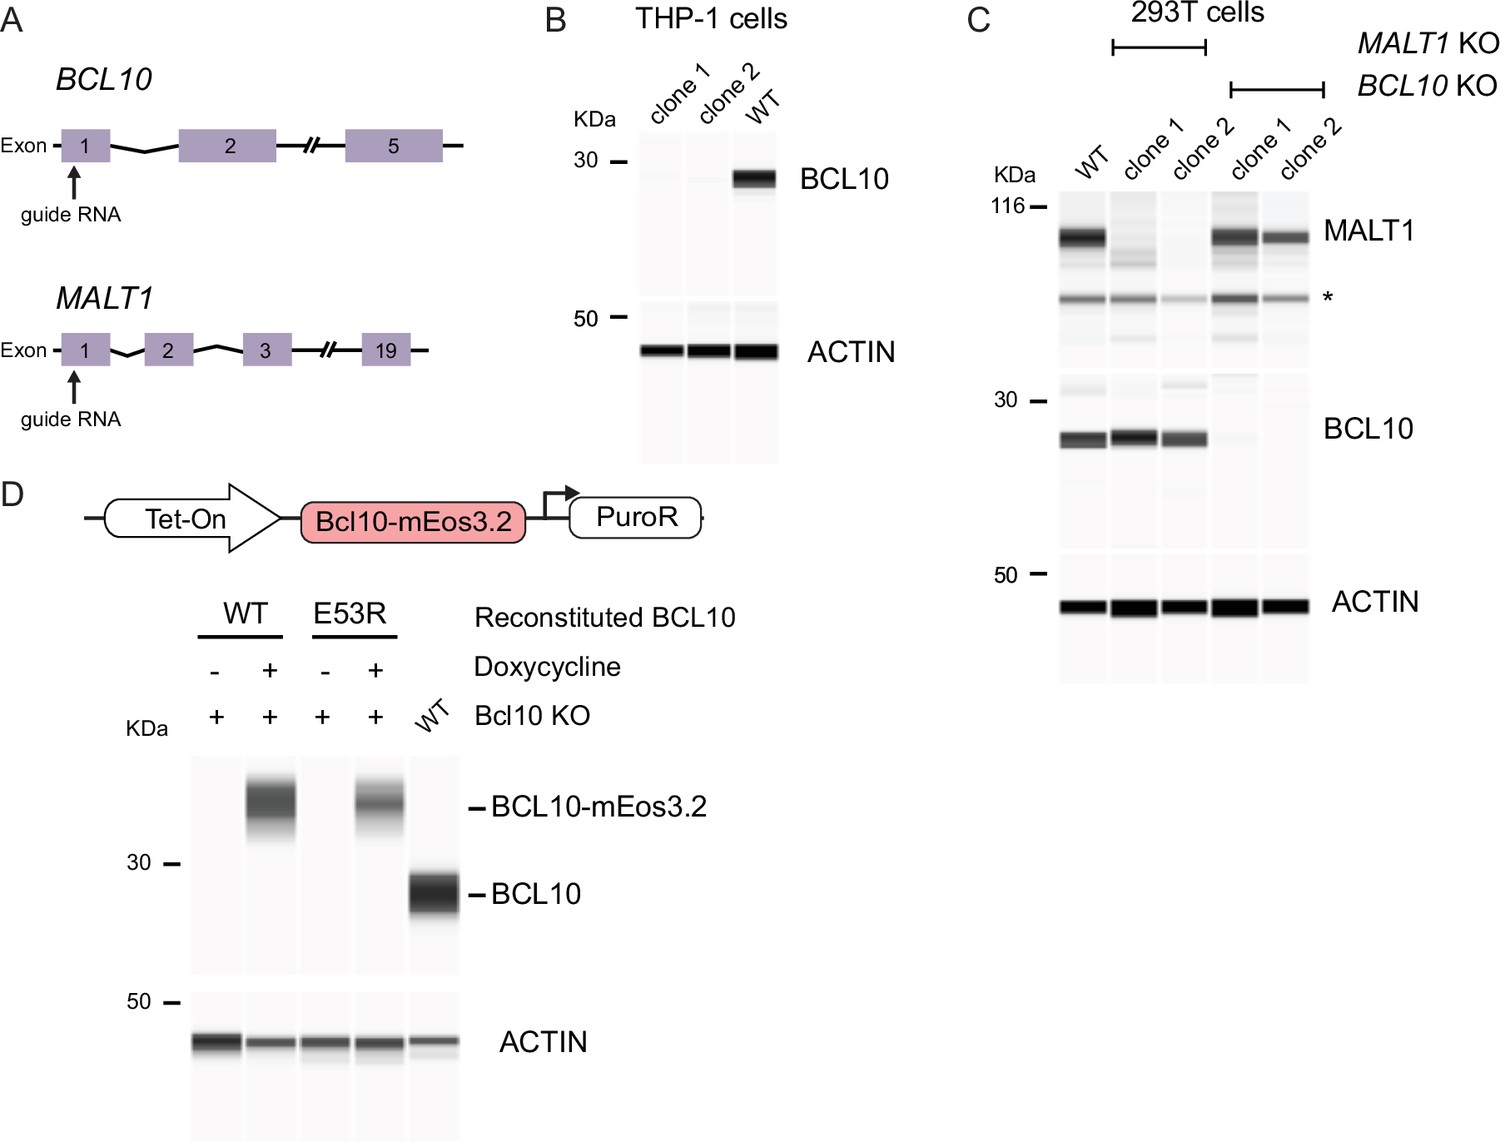
Generation and validation of reconstituted BCL10 and MALT1 KO cell lines.
(A) Schema of the BCL10 and MALT1 loci indicating the respective sites targeted by guide RNA for CRISPR-Cas9-mediated knockout approaches. After transfection of plasmids containing Cas-9 expression with the respective guide RNA, we verified the correct KO by targeted deep sequencing and western blot. (B) Capillary immunodetection of BCL10 protein in lysates of THP-1 cells. We selected two independent clones to perform experiments and confirm complete ablation of BCL10 expression after CRISPR-Cas9-mediated KO. (C) Capillary immunodetection of BCL10 and MALT1 proteins in 293T cells. We selected two clones that completely lost the expression of BCL10 and MALT1. (D) Top, schematic of the lentiviral construct integrated into THP-1 BCL10-KO cells to reconstitute the expression of BCL10 fused to mEos3.2. Bottom, capillary immunodetection of BCL10 in cells following doxycycline (1 µg/ml) treatment, showing tight control over BCL10 expression.
-
Figure 1—figure supplement 2—source data 1
Full image of protein immunodetection for BCL10 and actin in lysates of THP-1 WT and BCL10-KO cells.
- https://cdn.elifesciences.org/articles/79826/elife-79826-fig1-figsupp2-data1-v2.zip
-
Figure 1—figure supplement 2—source data 2
Full image of protein immunodetection for BCL10, actin and MALT1 in lysates of HEK293T WT, BCL10-KO, and MALT1-KO cells.
- https://cdn.elifesciences.org/articles/79826/elife-79826-fig1-figsupp2-data2-v2.zip
-
Figure 1—figure supplement 2—source data 3
Full image of protein immunodetection for BCL10 and actin in lysates of THP-1 WT cells and BCL10-KO cells reconstituted with BCL10-mEos3.2.
- https://cdn.elifesciences.org/articles/79826/elife-79826-fig1-figsupp2-data3-v2.zip
Figure 1—figure supplement 3
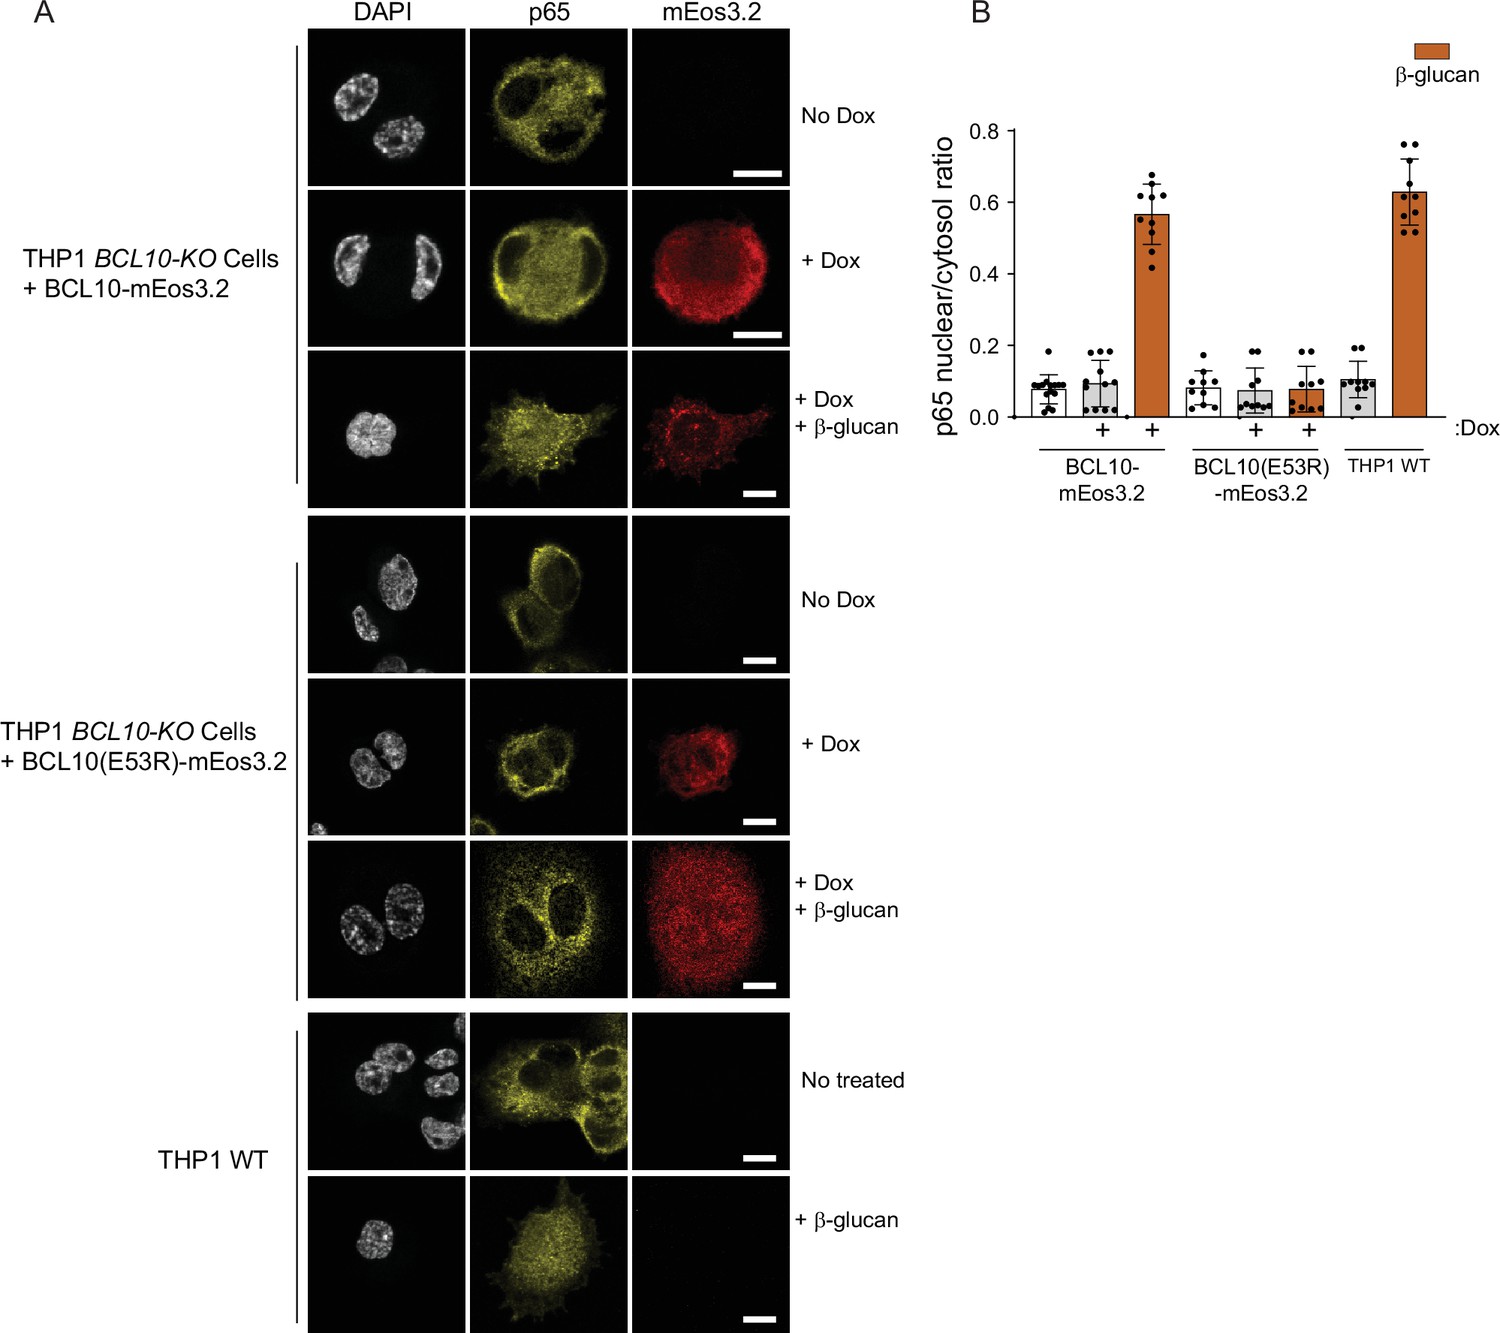
BCL10 assembly underlies nuclear transcription factor-κB (NF-κB) activation in monocytes.
(A) Microscopy images of THP-1 BCL10-KO cells reconstituted with BCL10-mEos3.2 WT or E53R versions. After doxycycline induction, cells were stimulated with 10 μg/ml of β-glucan and stained for p65. Images show a representative case for each condition. (B) Analysis of p65 nuclear to cytoplasm ratio of images in D. THP-1 BCL10-KO cells reconstituted with BCL10-mEos3.2 show comparable levels of nuclear p65 as WT cells. Shown are means ± standard deviation (SD).
Figure 2 with 2 supplements
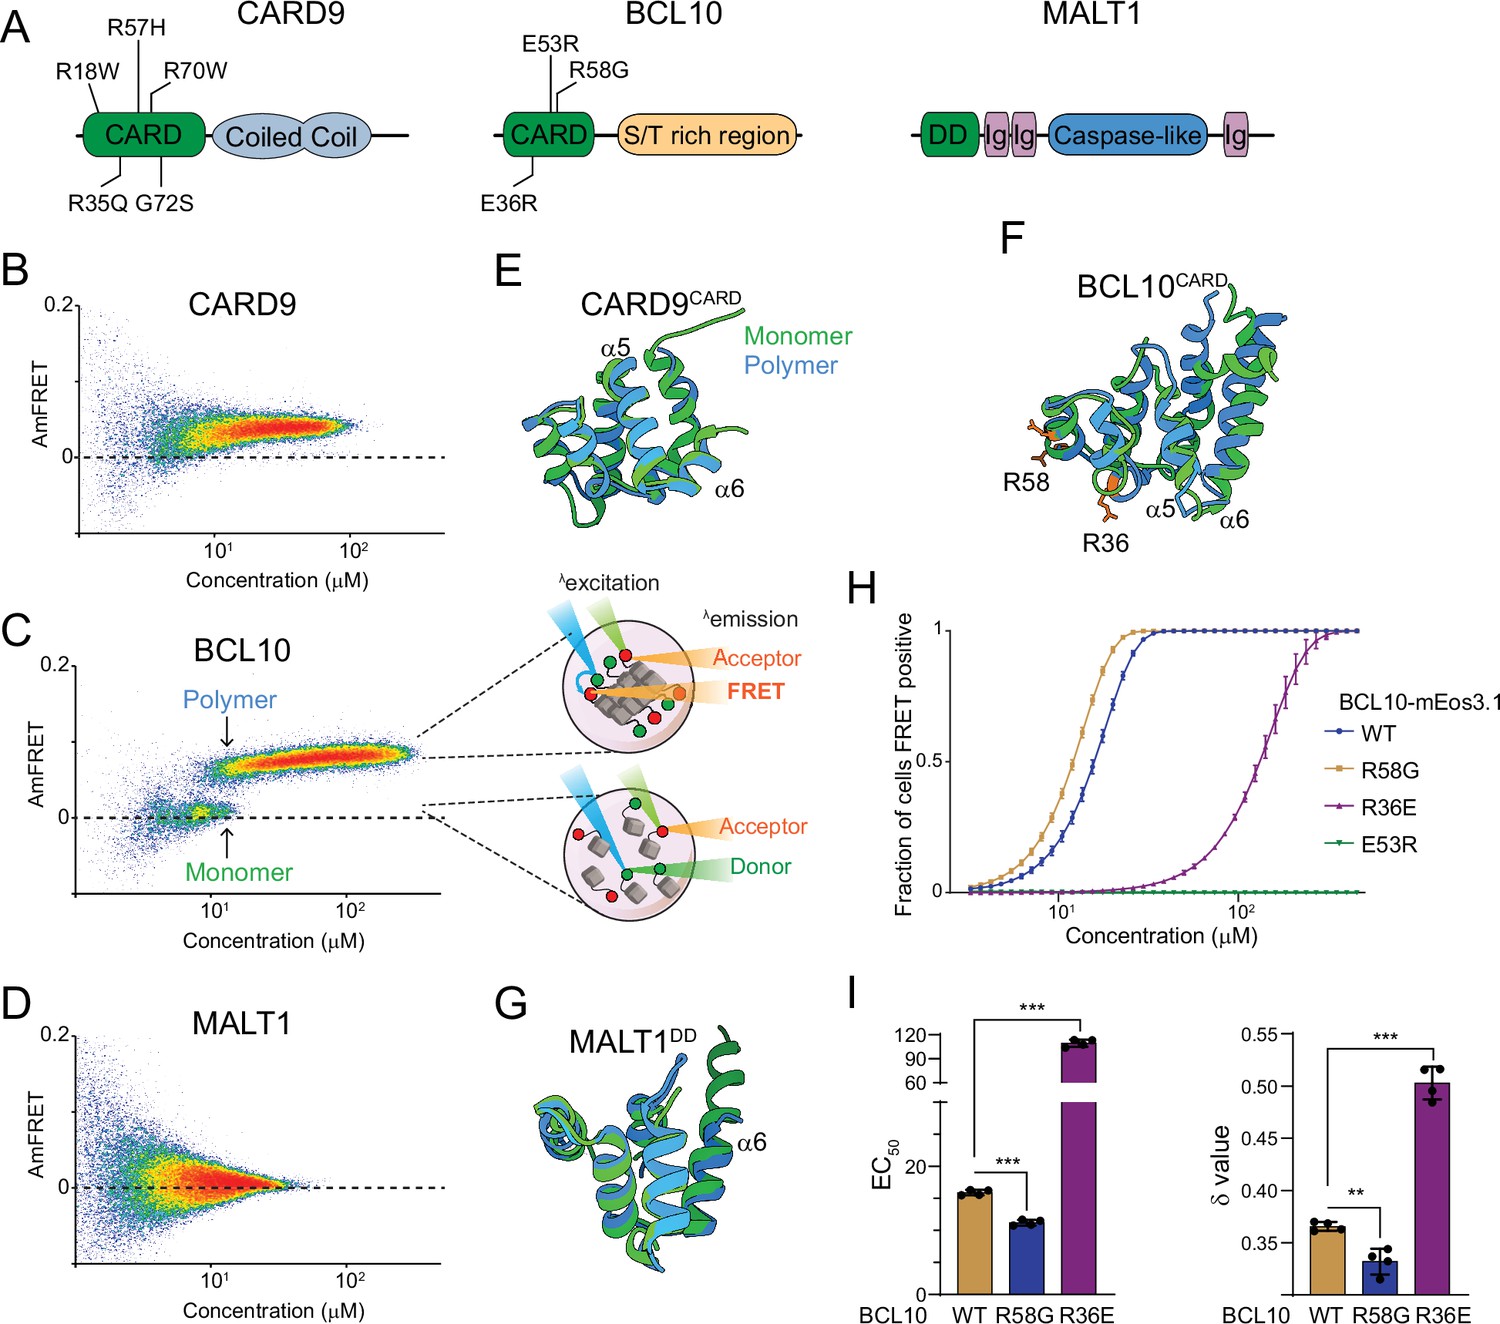
The adaptor protein BCL10 creates a nucleation-mediated switch.
(A) Domain architecture of CARD-BCL10-MALT1 (CBM) proteins. Death fold domains are colored green. Mutations discussed in the text are indicated. (B) DAmFRET plot of CARD9 expressed in yeast cells, showing moderate AmFRET indicative of oligomer formation at all concentrations. (C) Left, DAmFRET plot of BCL10 expressed in yeast cells, showing a bimodal distribution between cells containing only monomers and cells containing polymers. The discontinuity and overlapping range of protein concentration for the two populations indicates that polymerization is rate limited by a nucleation barrier. Right, schema of cells in the two populations, showing how self-assembly of partially photoconverted mEos3.1-fused proteins causes a FRET signal. (D) DAmFRET plot of MALT1 expressed in yeast cells, showing no AmFRET, indicating a monomeric state of the protein at all concentrations. (E) Structural alignment of CARD9CARD monomers in its soluble (6E26, green) or polymerized (6N2P, blue) forms, showing no major conformational differences between them. (F) Structural alignment of BCL10CARD monomers in its soluble (2MB9, green) or polymerized (6BZE, blue) forms, showing multiple conformational differences that span a-helices 1, 2, 5, and 6. (G) Structural alignment of MALT1DD monomers in its soluble (2G7R, green) and polymerized (together with BCL10, 6GK2, blue) forms, showing no major conformational differences. (H) Weibull fits to DAmFRET plots of WT and mutant BCL10, showing how each mutation affects polymerization as quantified in (I). (I) EC50 (left) and ẟ (right) values derived from the fits in (H). EC50 describes the median concentration at which nucleation occurs. The slope parameter ẟ is a dimensionless proxy for the conformational free energy of nucleation. The R36E and E53R mutations, which lie in separate polymer interfaces, prevent the protein from polymerizing at low concentrations. The cancer-associated R58G mutation decreases the nucleation barrier, resulting in more frequent spontaneous nucleation relative to the WT protein. Shown are means ± standard deviation (SD) of three replicates. t-Test ***p < 0.001, **p < 0.005.
Figure 2—figure supplement 1
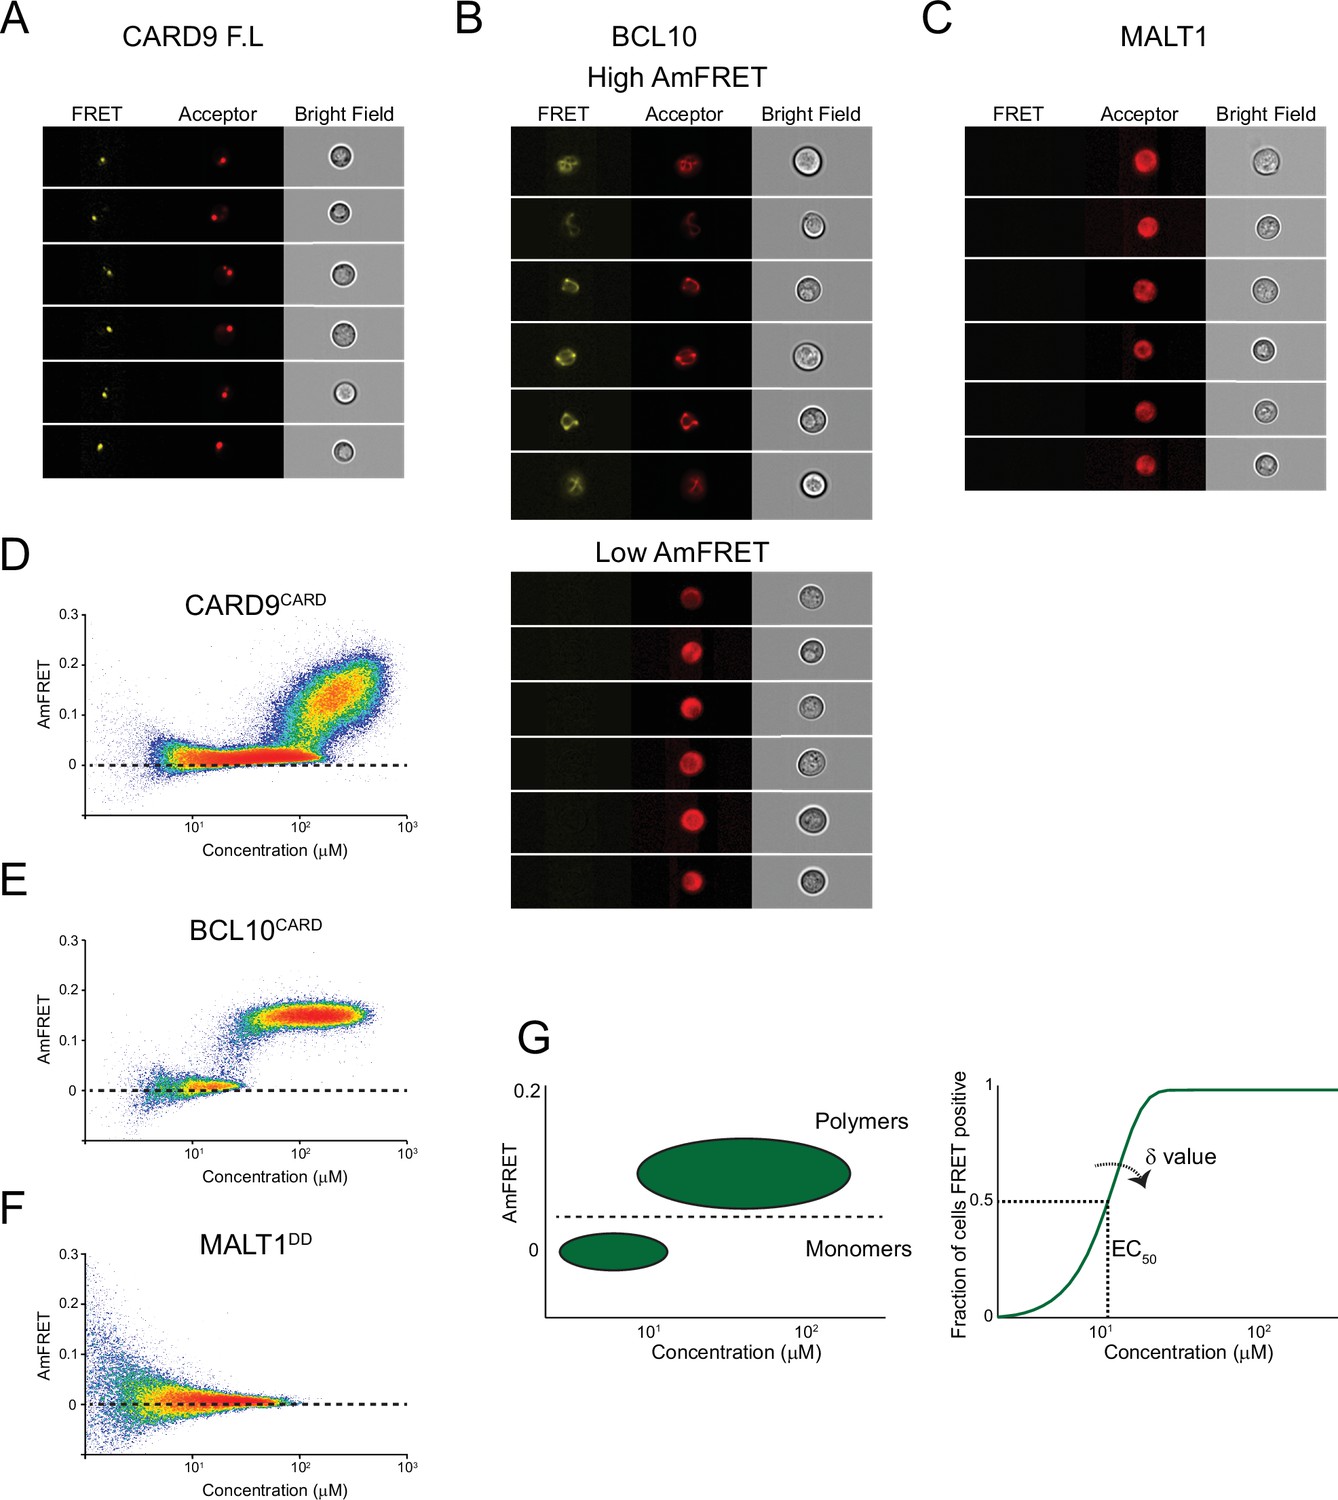
DAmFRET reveals the assembly mechanism of CARD-BCL10-MALT1 (CBM) components.
(A) Imaging flow cytometry images from the DAmFRET experiment in Figure 2B, showing that FL CARD9 localizes to a punctum in yeast cells. (B) Imaging flow cytometry images from the DAmFRET experiment in Figure 2C, showing that FL BCL10 is polymerized in cells with high AmFRET (top), but is diffuse in cells with low AmFRET. (C) Imaging flow cytometry images from the DAmFRET experiment in Figure 2D, showing a diffuse distribution of FL MALT1. (D) DAmFRET plot of CARD9CARD showing the onset of polymerization, with only a small discontinuity, at approximately 100 µM. (E) DAmFRET plot of BCL10CARD showing a discontinuous distribution of cells between low- and high-AmFRET populations, indicating nucleation-limited polymerization. (F) DAmFRET plot of MALT1DD showing that the protein does not self-associate. (G) Schematic representation of DAmFRET Weibull fit analysis. DAmFRET plots are gated to define populations of cells containing monomer or polymers. After obtaining the fraction of cells FRET positive across the expression range, we fit the data to a Weibull function to derive two parameters, EC50 and ẟ. The parameter ẟ quantifies the independence of nucleation on concentration.
Figure 2—figure supplement 2
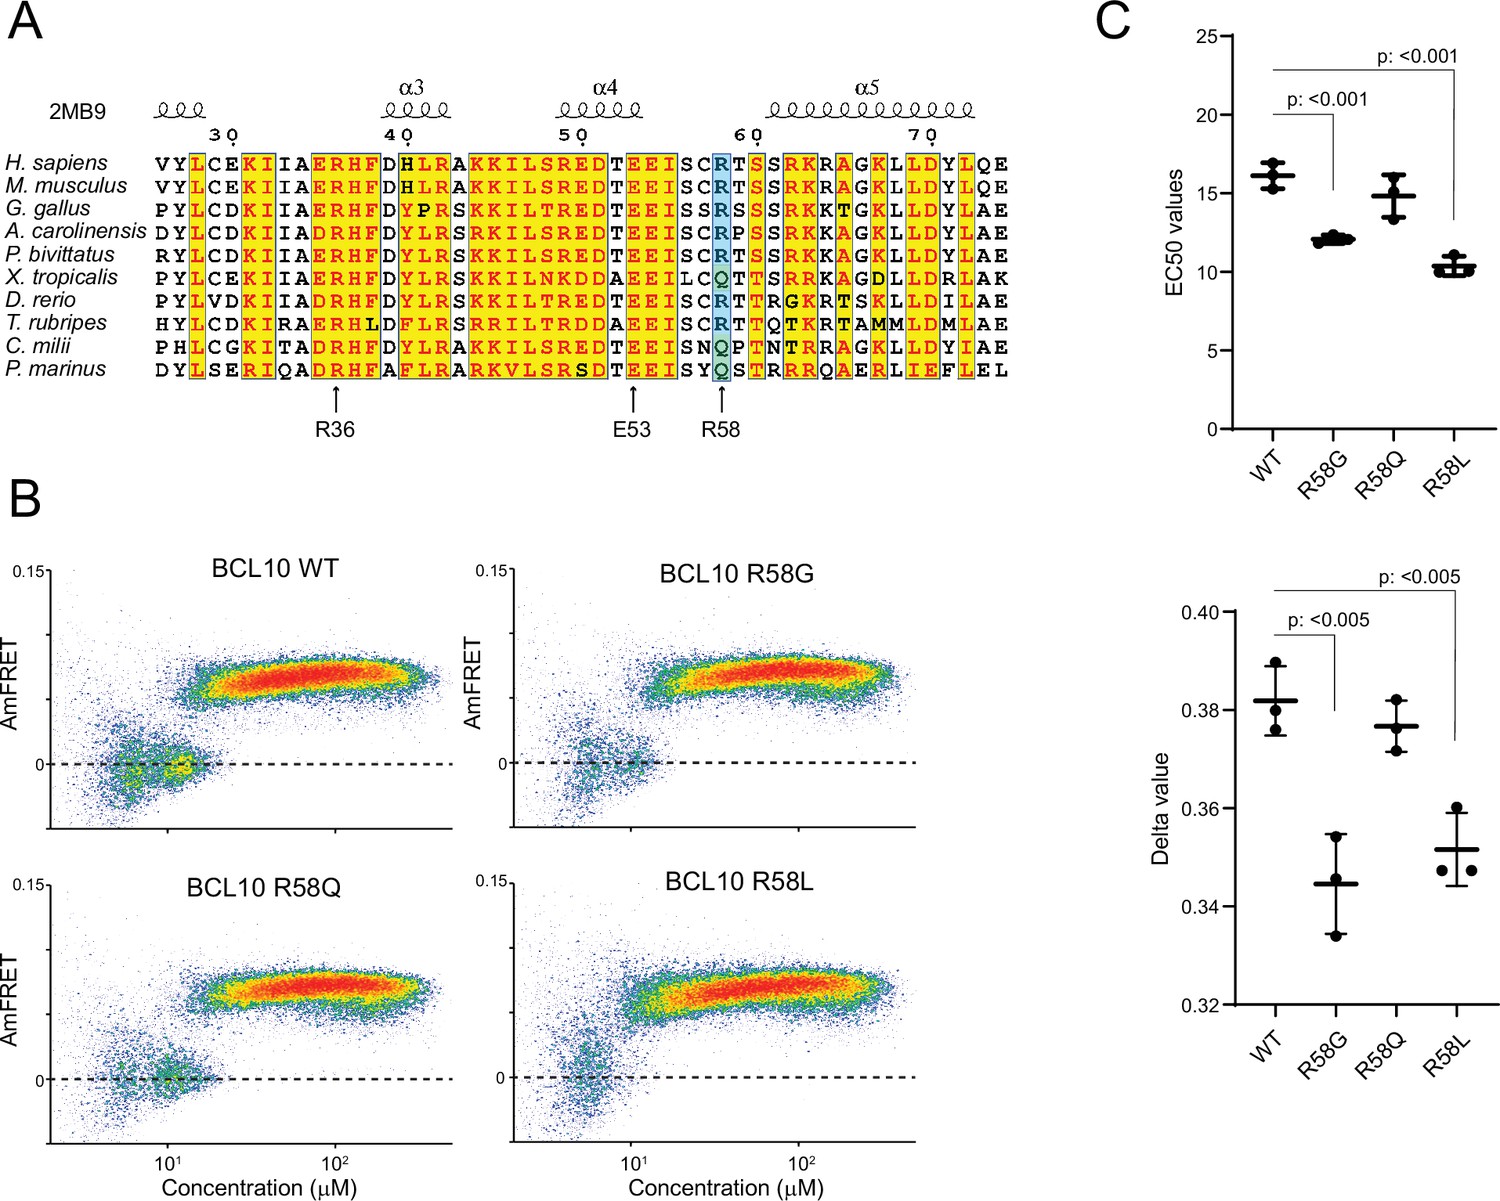
BCL10 sequence conservation reveals selection for nucleation barrier.
(A) Multiple sequence alignment of vertebrate BCL10 homologs. Arrows indicate the positions of mutations characterized herein. (B) DAmFRET plots of yeast cells expressing the indicated mutants of FL BCL10. (C) EC50 (top) and ẟ (bottom) values of Weibull fits to DAmFRET plots of BCL10 mutants. Comparisons were made with the unpaired t-test. Shown are means ± standard deviation (SD) from three independent experiments. t-Test statistical comparisons.
Figure 3 with 3 supplements
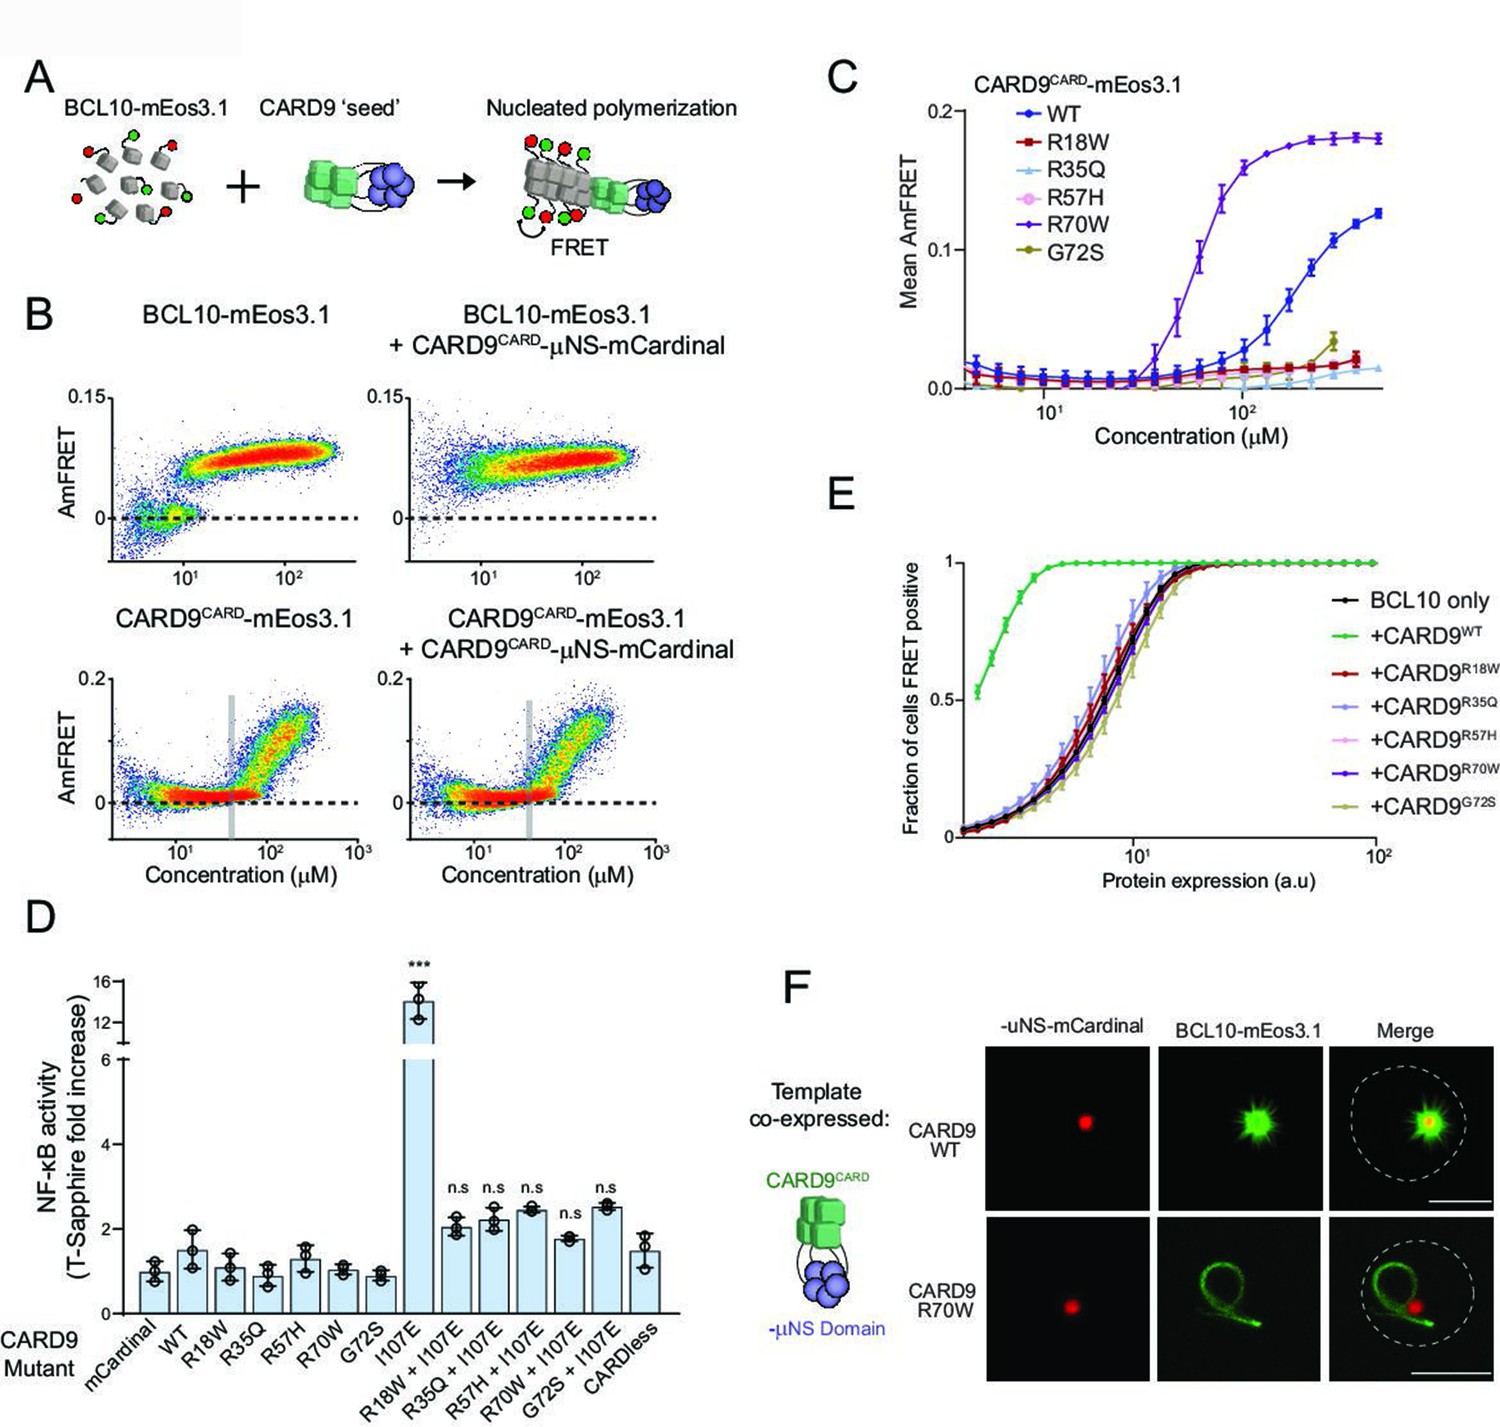
Pathogenic mutations disrupt BCL10 template formation within CARD-CC multimers.
(A) Schematic of the DAmFRET experiment used to test for nucleating interactions between CARD-BCL10-MALT1 (CBM) components. Artificial ‘seeds’ are created by expressing the putative nucleating protein as a fusion to the homo-oligomerizing module, μNS (purple). (B) DAmFRET plots of BCL10 (top) or CARDCARD (bottom) in the absence (left) or presence (right) of CARD9CARD seeds expressed in trans. For BCL10, the presence of seeds shifted all low-AmFRET cells to high-AmFRET, indicating that the protein had been supersaturated and is nucleated by CARD9CARD. In contrast, the seeds had no effect on CARD9CARD DAmFRET, suggesting that CARD9CARD only polymerizes at high concentrations and does not become supersaturated. The vertical line denotes the phase boundary for CARD9 CARD polymerization. (C) Graph of spline fits of AmFRET values for CARD9CARD mutants. All of the pathogenic mutations within the CARD domain disrupted polymer formation except for R70W, which stabilized polymers. (D) Effect of CARD9 mutations in the full-length protein context with autorepression eliminated by the I107E mutation. 293T cells transduced with the nuclear transcription factor-κB (NF-κB) reporter were transfected with the indicated CARD9-mCardinal constructs and analyzed for T-Sapphire expression at 48-hr post-transfection. T-Sapphire expression was normalized to that of cells transfected with plasmid expressing mCardinal alone. Shown are means ± standard deviation (SD). Analysis of variance (ANOVA) with post hoc Tukey test ***p < 0.0001. (E) Weibull fits to DAmFRET plots of BCL10 coexpressed with mutant CARD9 seeds, showing that only WT CARD9 nucleates BCL10 while none of the pathogenic mutants do so. (F) Images of yeast cells expressing the respective CARD9 seeds (red punctum) and BCL10-mEos3.1 (green). CARD9 WT seeds nucleate BCL10 polymers, resulting in a starburst-like structure. Conversely, CARD9-mutant R70W does not nucleate BCL10; BCL10 instead forms a single long filament that is detached from the ‘seed’, indicating that it polymerizes spontaneously in these cells. Scale bar: 5 µm.
Figure 3—figure supplement 1

Dissection of CARD9 multimerization reveals a critical role of its coiled-coil region.
(A) Schematic of the CARD9 protein, indicating the boundaries of truncated versions tested herein. (B) DAmFRET plots for truncated versions of CARD9. This analysis reveals the contribution of the coiled-coil domain to the higher-order assembly of CARD9. Even in the absence of the CARD, CARD9 still retains comparable FRET levels as the full-length version. (C) Median AmFRET values from four independent replicates of the region delimited in plots in (B). Shown are means ± standard deviation (SD) of three independent measurements. (D) Imaging flow cytometry images show that CARD91–142 is diffuse despite appreciable AmFRET, consistent with its expected dimerization. (E) DAmFRET plots of CARD9 FL and CARD9 I107E show that the I107E mutation increases assembly at low concentrations. Inset shows the histogram of AmFRET values obtained from the gates shown in the DAmFRET plots. (F) Representative images of cells from confocal microscopy showing that the I107E mutant forms relatively irregular puncta.
Figure 3—figure supplement 2
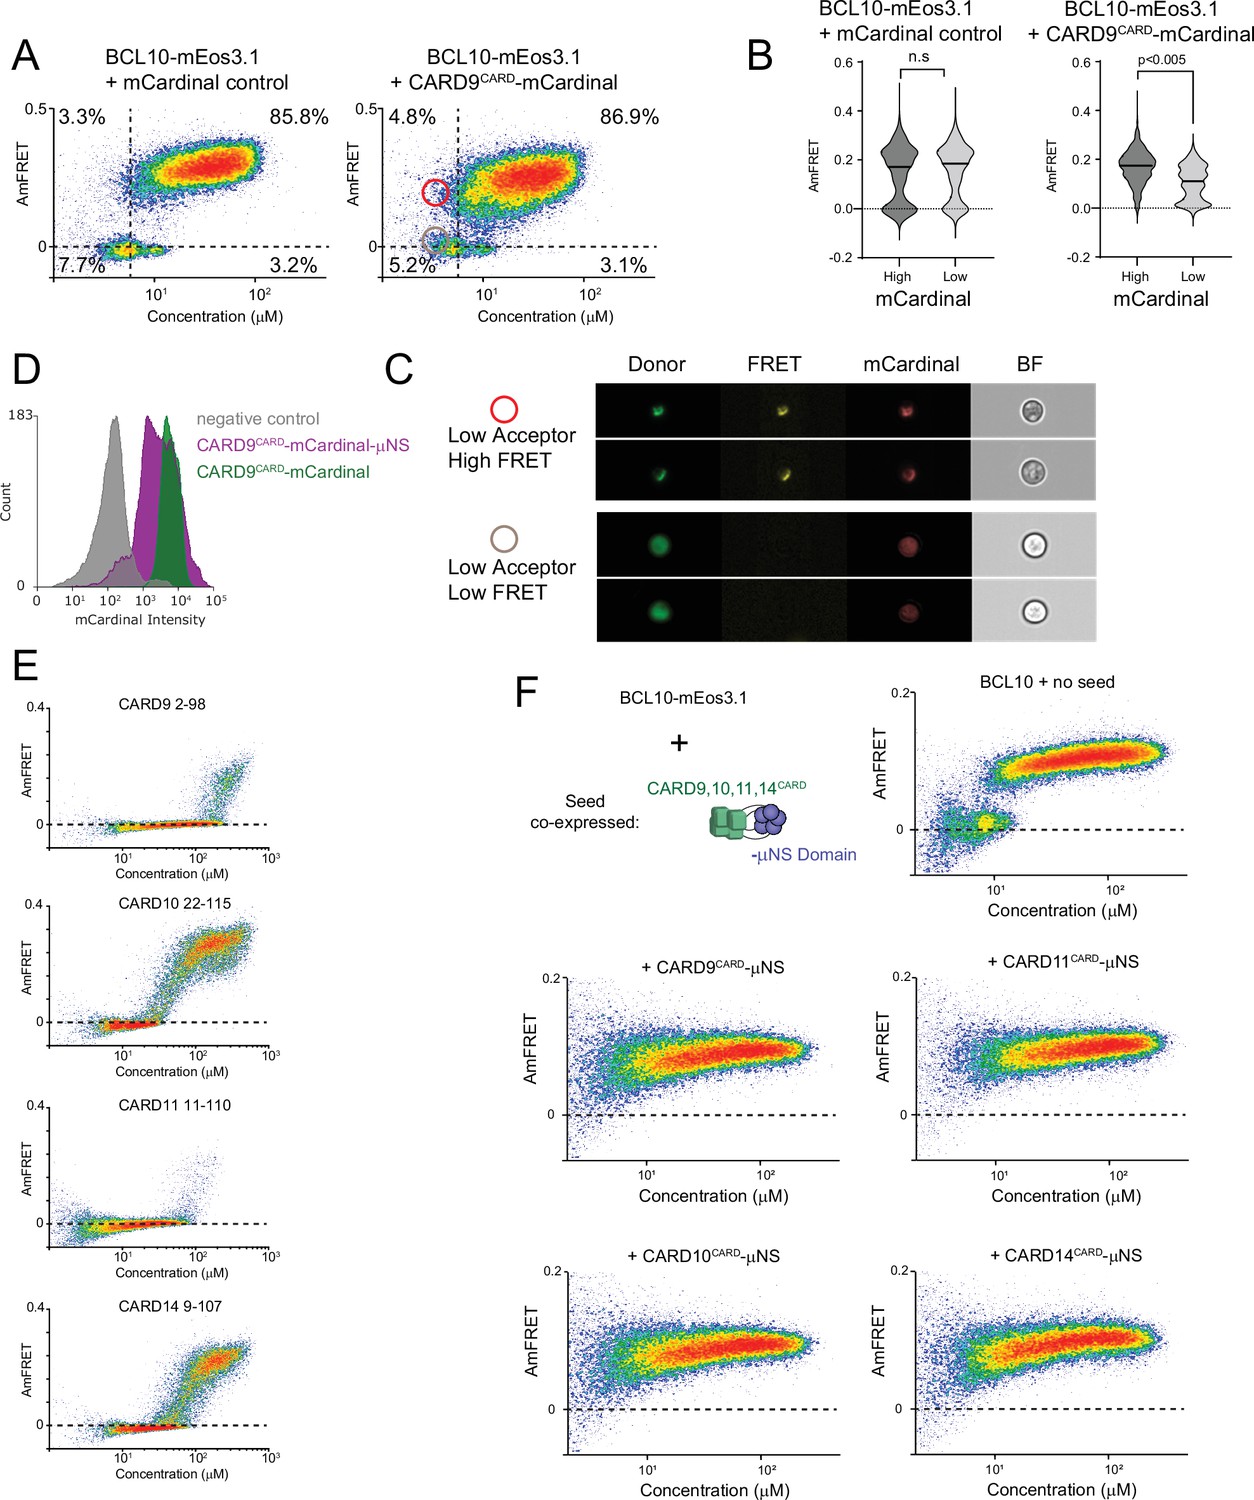
CARD9CARD polymers and other CARD-CC proteins can nucleate BCL10.
(A) DAmFRET plots of BCL10-mEos3.1 expressed in yeast together with mCardinal (left) or CARD9CARD-mCardinal (right). The horizontal line marks zero AmFRET, and the vertical line approximates the expression level at which BCL10 appreciably nucleates in the absence of seed. Cells in the red and gray circled areas were examined in (C). (B) Analysis of the distribution of AmFRET levels as a function of seed expression level. Based on the DAmFRET plots of CARD9CARD-mEos3.1 (Figure 3B), we assume that cells with mCardinal fluorescence intensities in the top 20% (‘high’) contain CARD9CARD-mCardinal in a polymerized form, whereas cells with intensities in the bottom 20% will contain only monomeric CARD9CARD-mCardinal. The violin plots compare the distributions of AmFRET between these ‘high’ and ‘low’ cells in the same population, confirming that CARD9CARDeliminates the BCL10 nucleation barrier when it is expressed to polymerizing concentrations. p values are from an unpaired t-test. (C) Cell images from Imagestream DAmFRET analysis from the regions circled in (A). Cells from the red circle, with high AmFRET, contain punctate BCL10-mEos3.1 and CARD9CARD-mCardinal, whereas cells from the gray circle, with low AmFRET but the same expression level as in the red circle, contain diffuse BCL10-mEos3.1 and CARD9CARD-mCardinal. (D) Histogram of mCardinal intensities from yeast strains expressing the respective versions of CARD9. The levels of protein expression of the CARD9 µNS fusion protein overlap with that of CARD9CARD-mCardinal. (E) DAmFRET plots for the CARDs of the CARD-CC family members, CARD9, CARD10, CARD11, and CARD14, showing that all four polymerize in a concentration-dependent fashion with a negligible nucleation barrier. (F) Schematic and DAmFRET plots showing the nucleation of BCL10-mEos3.1 by the CARDs of either CARD9, 10, 11, or 14 fused to μNS. All CARDs eliminated the low-AmFRET population of cells expressing BCL10-mEos3.1.
Figure 3—figure supplement 3
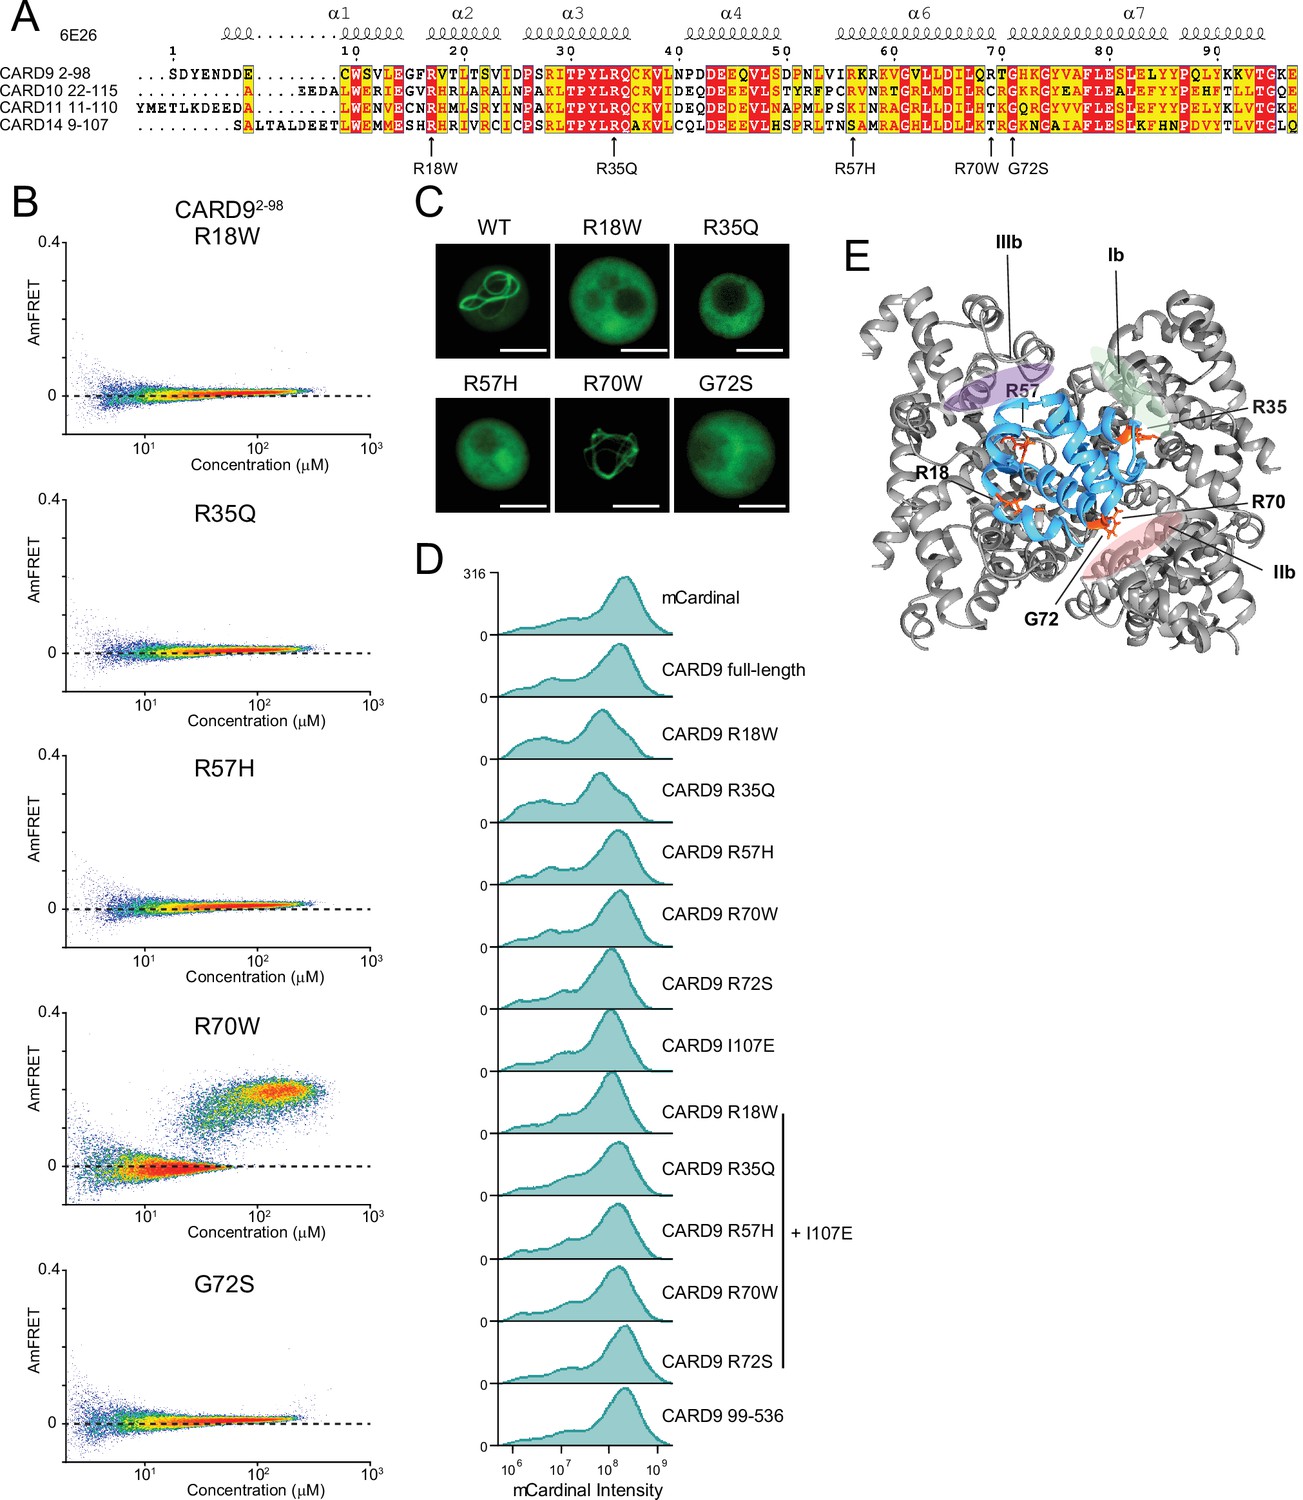
Pathogenic mutations in CARD9CARD reveal the structural basis of functional CARD-BCL10-MALT1 (CBM) signalosome formation.
(A) Sequence alignment of the human CARD-CC family members. Arrows indicate pathogenic mutations in CARD9. (B) DAmFRET plots for CARD9CARD mutants, related to the analysis in Figure 2H. (C) Fluorescence microscopy images of yeast cells expressing CARD9CARD-mEos3.1 showing that the pathogenic mutations, except for R70W, disrupt assembly. Scale bar: 5 µm. (D) Histograms of mCardinal fluorescence intensities corresponding to the expression levels of CARD9 mutants 48 hr after transfection into 293T nuclear transcription factor-κB (NF-κB) reporter cells. (E) Structure of the CARD9CARD polymer (6N2P) highlighting the residues (orange) whose mutation causes susceptibility to fungal infections, with respect to polymer interfaces.
Figure 4 with 4 supplements
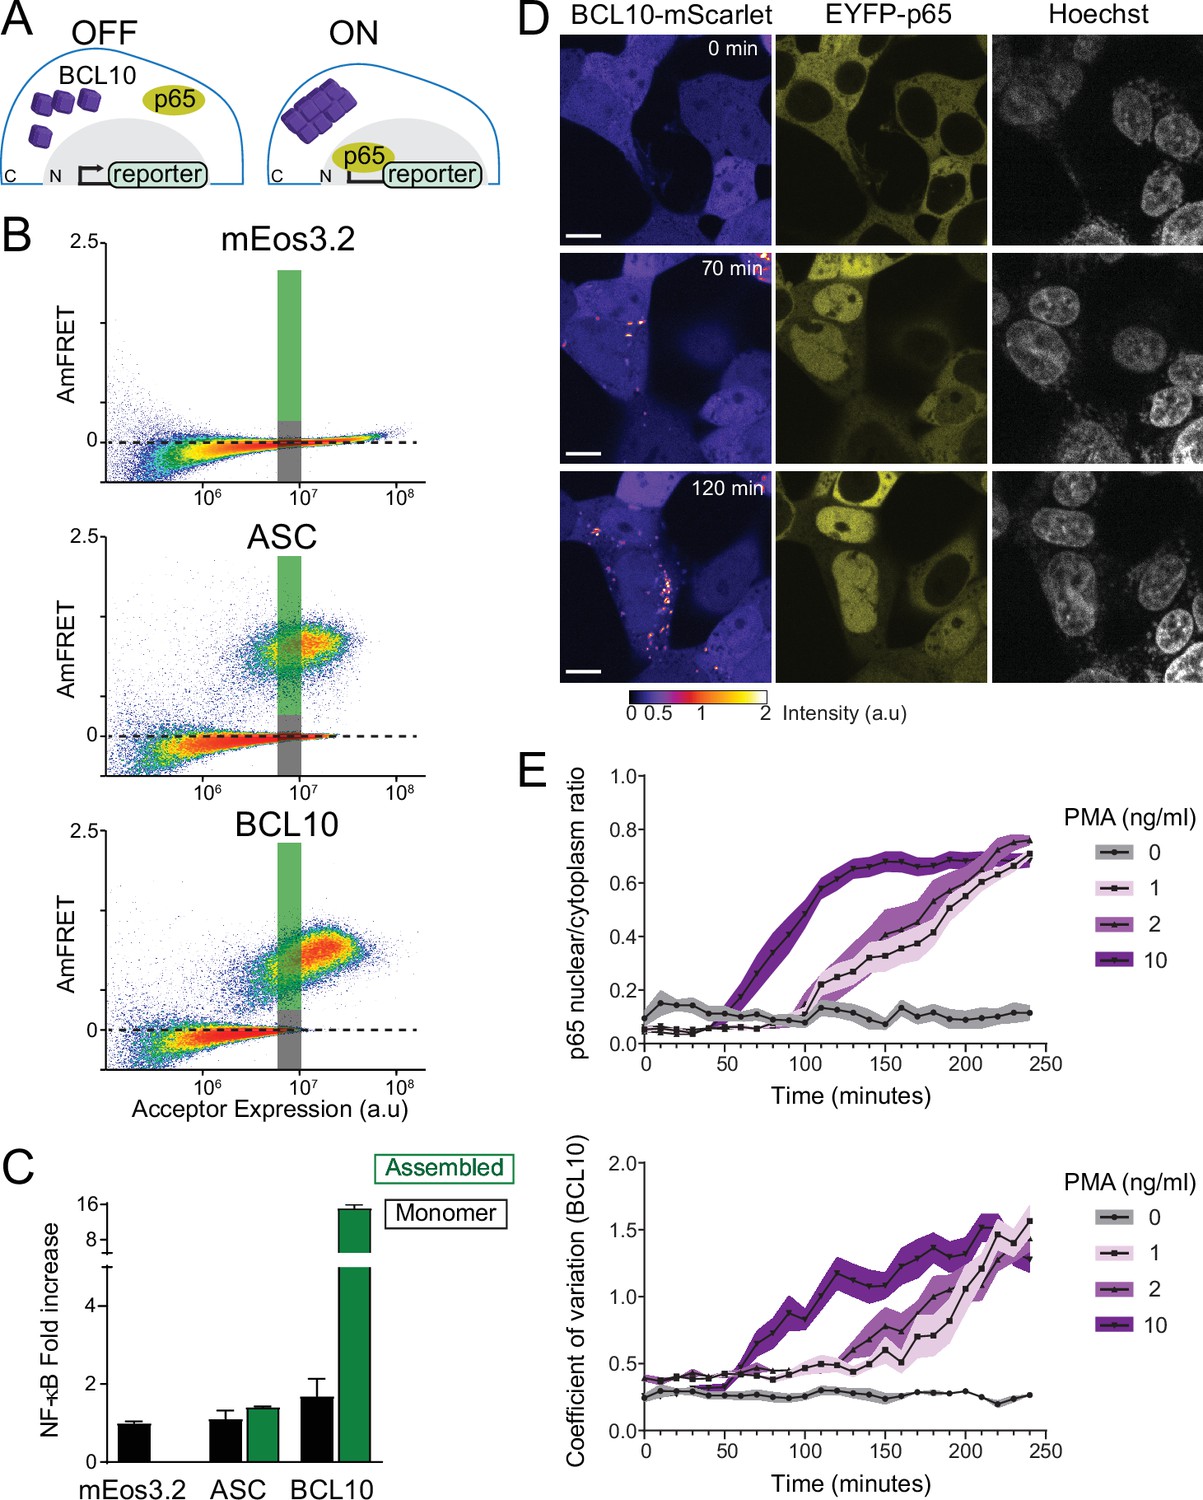
The BCL10 nucleation barrier causes binary activation of nuclear transcription factor-κB (NF-κB).
(A) Schematic of experiments to determine if BCL10 polymerization activates NF-κB in 293T cells. In the OFF state, BCL10 is dispersed in the cell and the p65 NF-κB subunit is localized to the cytosol. In the ON state, BCL10 is polymerized and p65 relocates to the nucleus, where it induces the transcription of NF-κB response genes. (B) DAmFRET plots of the indicated proteins expressed in 293T cells containing the NF-κB reporter, 48 hr after transfection. The reporter mEos3.2 remains in the monomeric state and does not activate NF-κB. The gray and green boxes designate the regions gated for cells containing either monomer or polymerized protein, respectively, and analyzed for T-Sapphire expression in (C). (C) Quantification of T-Sapphire expression in the gated areas of the DAmFRET plots shown in (B). Shown are means ± standard deviation (SD). Only cells that contained BCL10 polymers, but not cells containing the same concentration of monomeric BCL10 nor cells containing ASC polymers, activated NF-κB. (D) Time-lapse microscopy of 293T BCL10-KO cells reconstituted with BCL10-mScarlet and EYFP-p65. Cells were stimulated with 10 ng/ml PMA and imaged every 10 min. BCL10 and p65 are distributed throughout the cytosol at 0 min, but respectively relocalize to cytosolic puncta and the nucleus over the course of the experiment. Scale bar: 10 µm. (E) Top, ratios of EYFP fluorescence intensities in the nucleus versus cytosol; and bottom, values of the coefficient of variation of mScarlet pixel intensities, over the time course of cells stimulated with PMA at the indicated concentrations. BCL10 polymerization produced visible puncta within approximately 50 min of PMA stimulation. More than 40 cells were tracked and analyzed for each treatment condition. Shown are means ± SD.
Figure 4—figure supplement 1
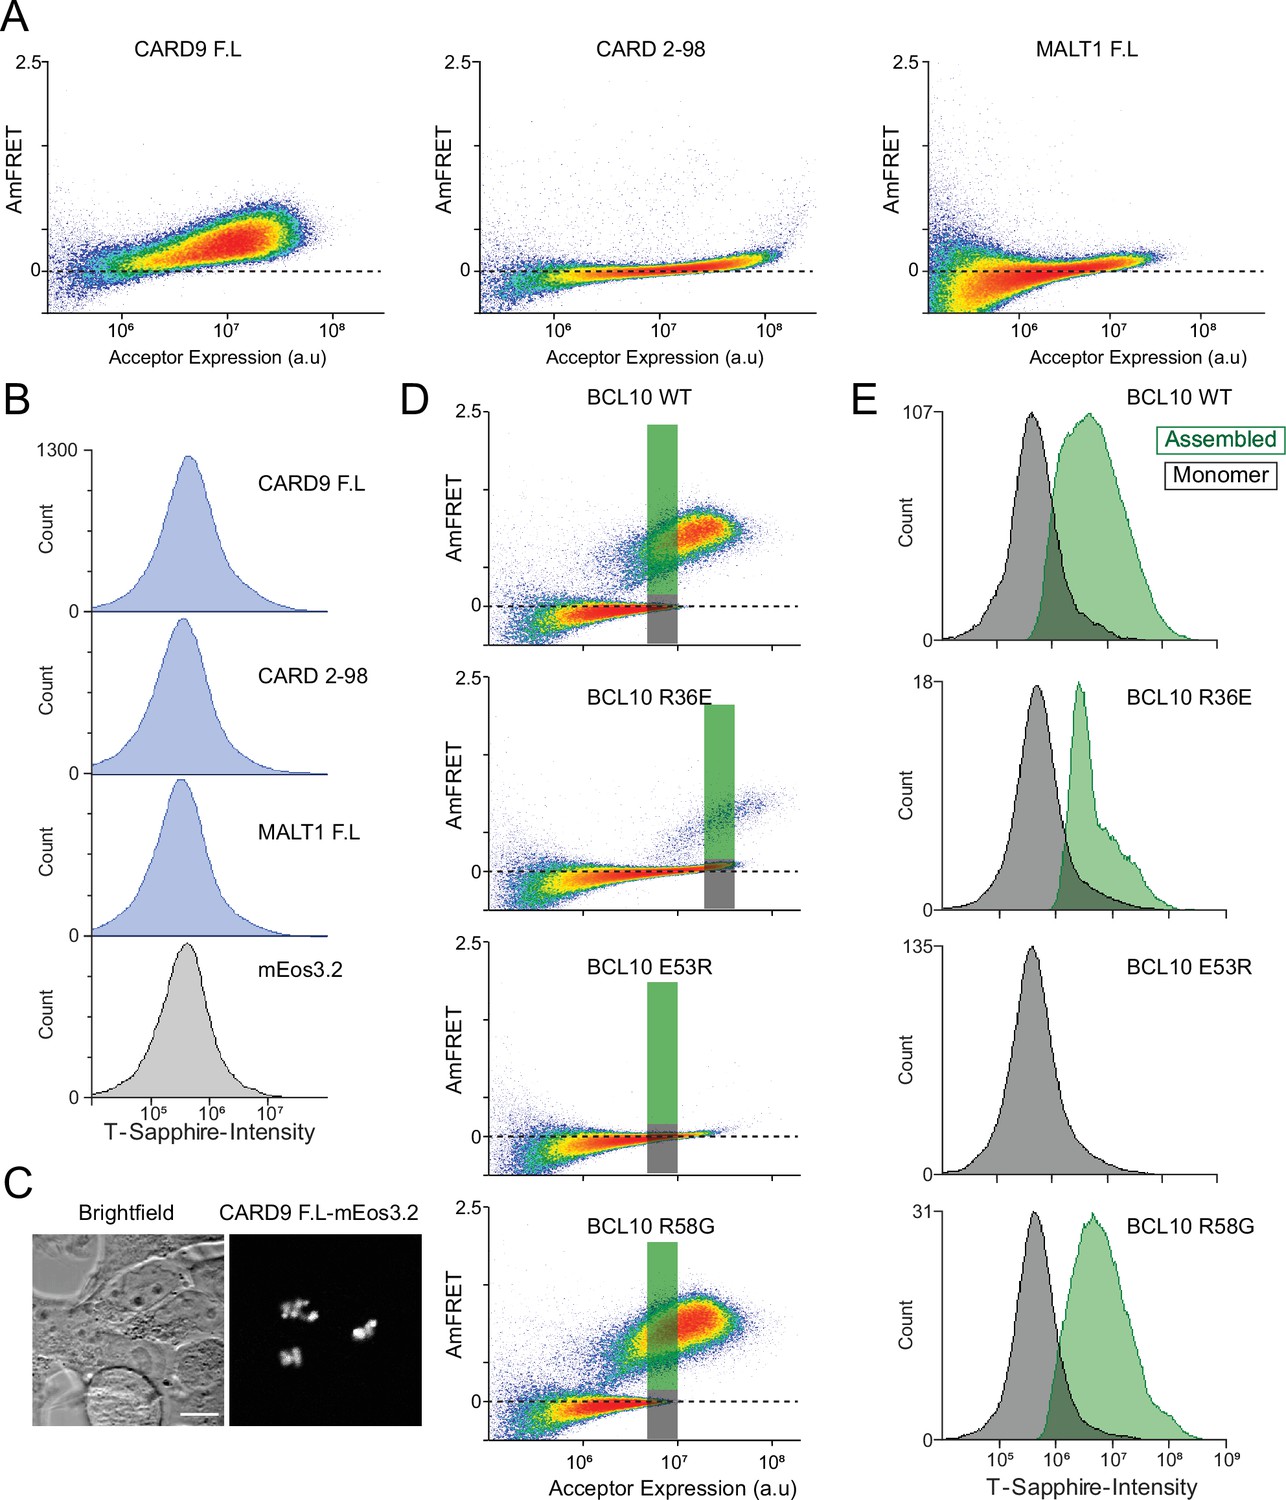
DAmFRET coupled with nuclear transcription factor-κB (NF-κB) single-cell reporter cell line reveals CARD-BCL10-MALT1 (CBM) signalosome components contribution to binary activation.
(A) DAmFRET plots of CARD9 full-length, CARD9CARD, or MALT1 full-length tagged with mEos3.2 48-hr post-transfection in 293T NF-κB reporter cells. (B) Histograms of T-Sapphire fluorescence in the 293T NF-κB reporter cells expressing the indicated proteins. Neither CARD9 nor MALT1 were able to induce activation of NF-κB. (C) Microscopy images of CARD9-mEos3.2 expressed in 293T cells, showing puncta formation even in the absence of stimulation. (D) DAmFRET plots of 293T BCL10-KO cells containing the NF-κB reporter 48 hr after transfection with the indicated BCL10 constructs. The green and gray rectangles indicate the gated regions evaluated for T-Sapphire intensity in (E). (E) Histograms of T-Sapphire fluorescence for cells expressing the same concentration of BCL10 in either a monomer (gray) or polymerized (green) form.
Figure 4—figure supplement 2
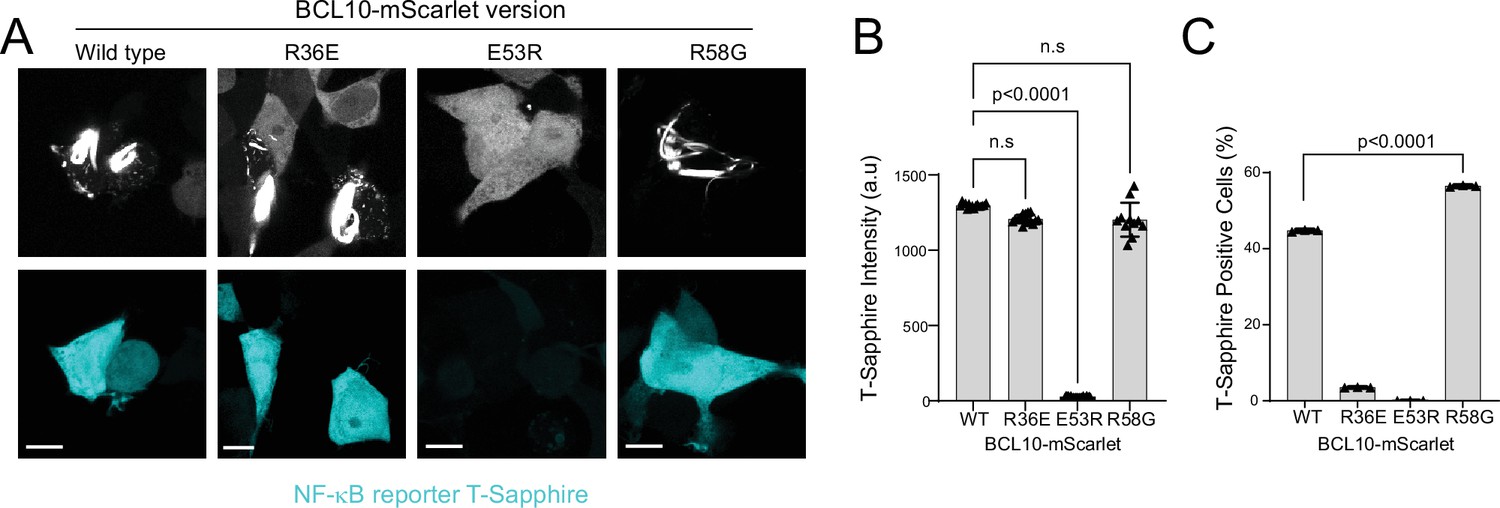
BCL10 intrinsic nucleation barrier dictates binary activation of nuclear transcription factor-κB (NF-κB).
(A) Confocal microscopy images of 293T BCL10-KO cells containing the NF-κB transcriptional reporter 48 hr after transfection with the indicated BCL10 constructs, showing that cells containing BCL10 polymers express T-Sapphire indicative of NF-κB activation. Scale bar: 10 µm. (B) T-Sapphire intensity normalized by cell area for each of the corresponding BCL10 constructs. This analysis includes >30 cells per sample from 3 independent experiments. T-Sapphire is expressed to the same level in all cells with polymers, reflecting the binary activation of NF-κB. t-Test statistical comparisons. (C) Percentage of cells with T-Sapphire expression. For this analysis, we included four randomly selected imaging fields from three independent experiments. Groups contain >300 cells each and were compared using an unpaired t-test.
Figure 4—figure supplement 3
Reconstitution of HEK293T BCL10-KO cells allows for testing BCL10 endogenous supersaturation.
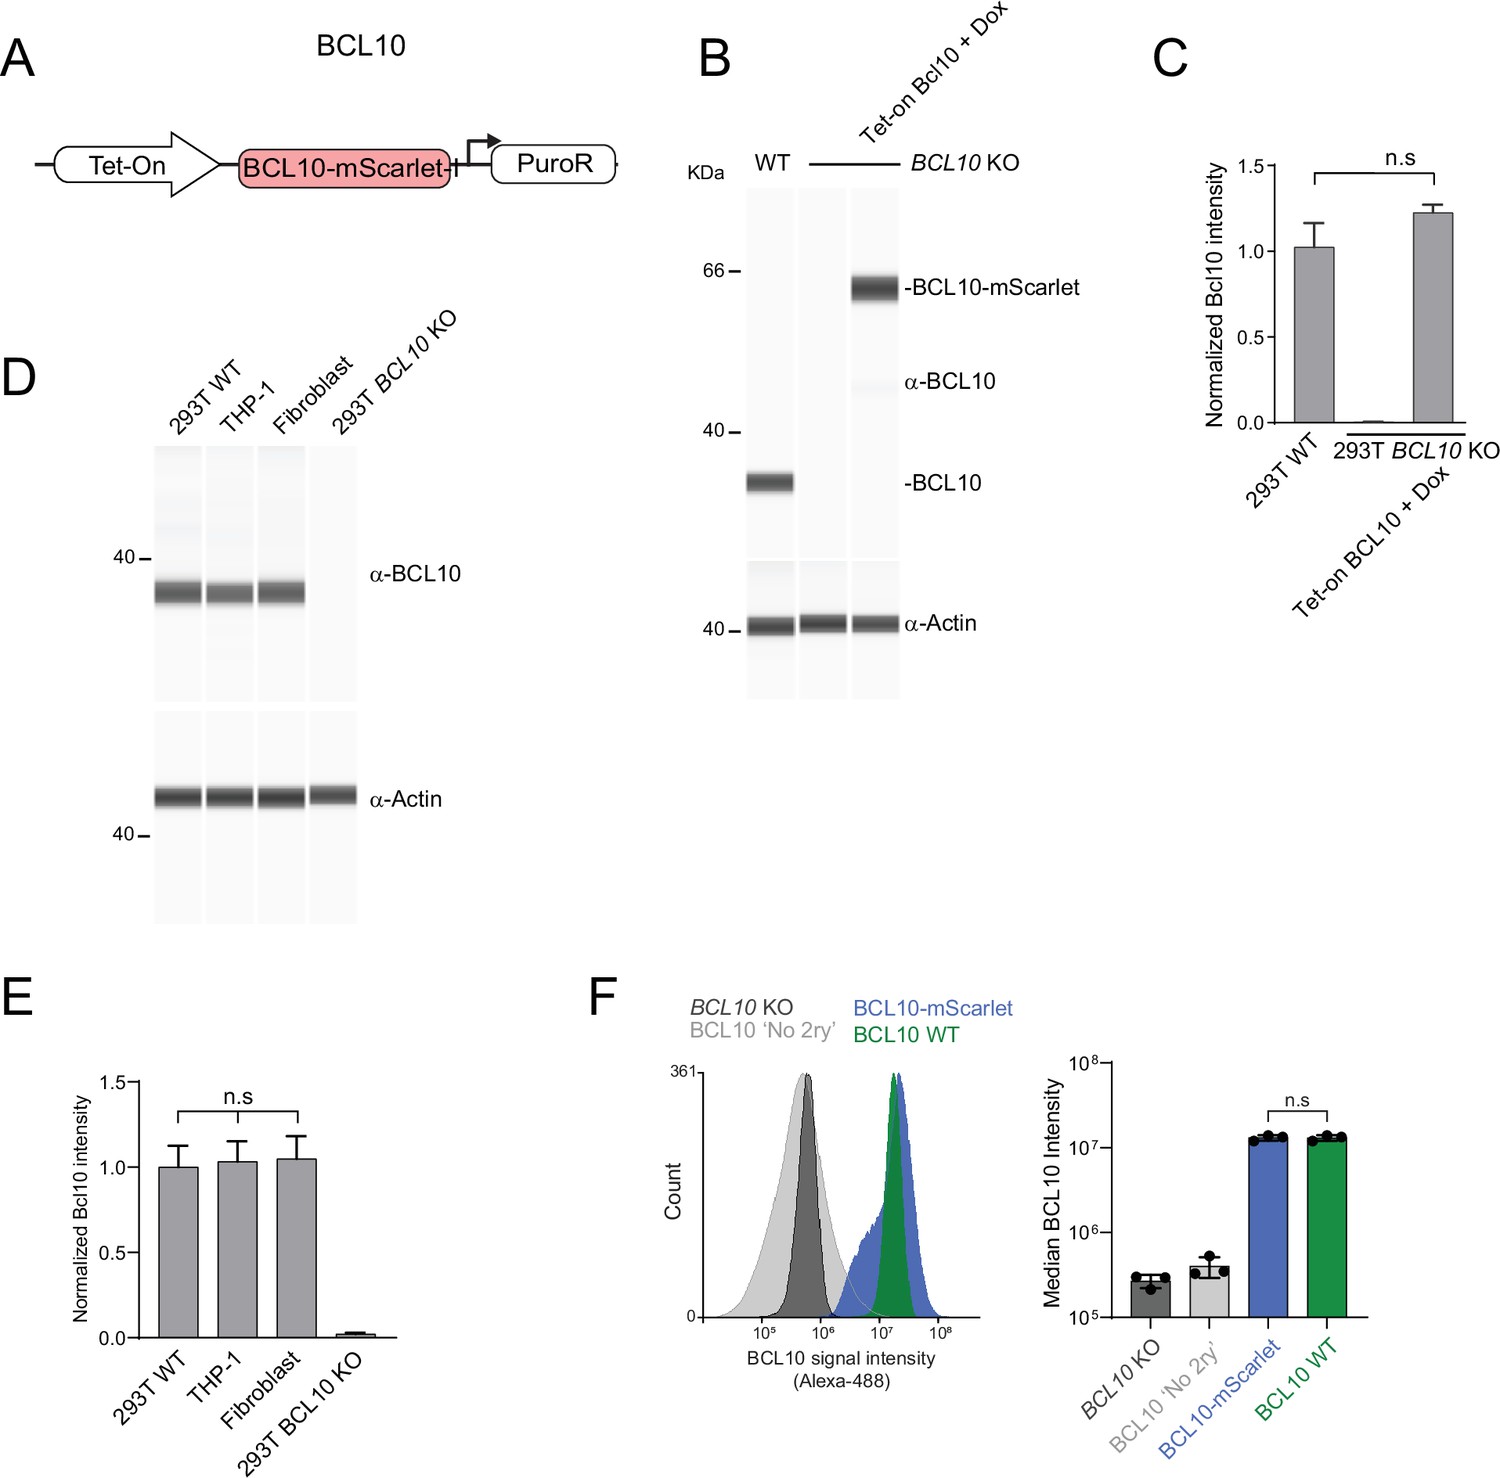
(A) Schematic of the lentivirus construct to reconstitute BCL10 expressed as a fusion to mScarlet. (B) Capillary immunodetection of BCL10 levels in WT, KO, and reconstituted 293T cells. The latter were stimulated with 1 µg/ml Dox for 24 hr. Lysates were generated from 2 million cells in each case. (C) Quantification of BCL10 protein levels from three independent experiments as shown in (B). BCL10 intensities were normalized to that of actin in each lane. Reconstituted cells express approximately endogenous levels of BCL10, fused to mScarlet. Statistical comparisons were made using unpaired t-test. Shown are means ± standard deviation (SD) of three measurements. (D) Capillary immunodetection of BCL10 in 293T WT cells, THP-1 cells, and primary human fibroblasts. Lysates were generated from 1 million cells in each case. (E) Quantification of BCL10 protein levels from three independent experiments as shown in (D). BCL10 is expressed to the same level in these diverse human cells. Statistical comparisons were made using unpaired t-test. Shown are means ± SD of three measurements. (F) Left, flow cytometry histograms of anti-BCL10 staining for the indicated cell lines. 293T BCL10-KO cells reconstituted with BCL10-mScarlet were stimulated with 1 µg/ml Dox for 24 hr. Right, median BCL10 intensity of three independent experiments. Wildtype and BCL10-mScarlet expressed to approximately the same level. Shown are means ± SD of three measurements.
-
Figure 4—figure supplement 3—source data 1
Full image of protein immunodetection for BCL10 and actin in lysates of HEK293T WT cells and BCL10-KO cells reconstituted with BCL10-mScarlet.
- https://cdn.elifesciences.org/articles/79826/elife-79826-fig4-figsupp3-data1-v2.zip
-
Figure 4—figure supplement 3—source data 2
Full image of protein immunodetection for BCL10 and actin in lysates of HEK293T WT, THP-1, fibroblasts, and HEK293T BCL10-KOcells.
- https://cdn.elifesciences.org/articles/79826/elife-79826-fig4-figsupp3-data2-v2.zip
Figure 4—figure supplement 4
BCL10 supersaturation is necessary and sufficient to activate nuclear transcription factor-κB (NF-κB).
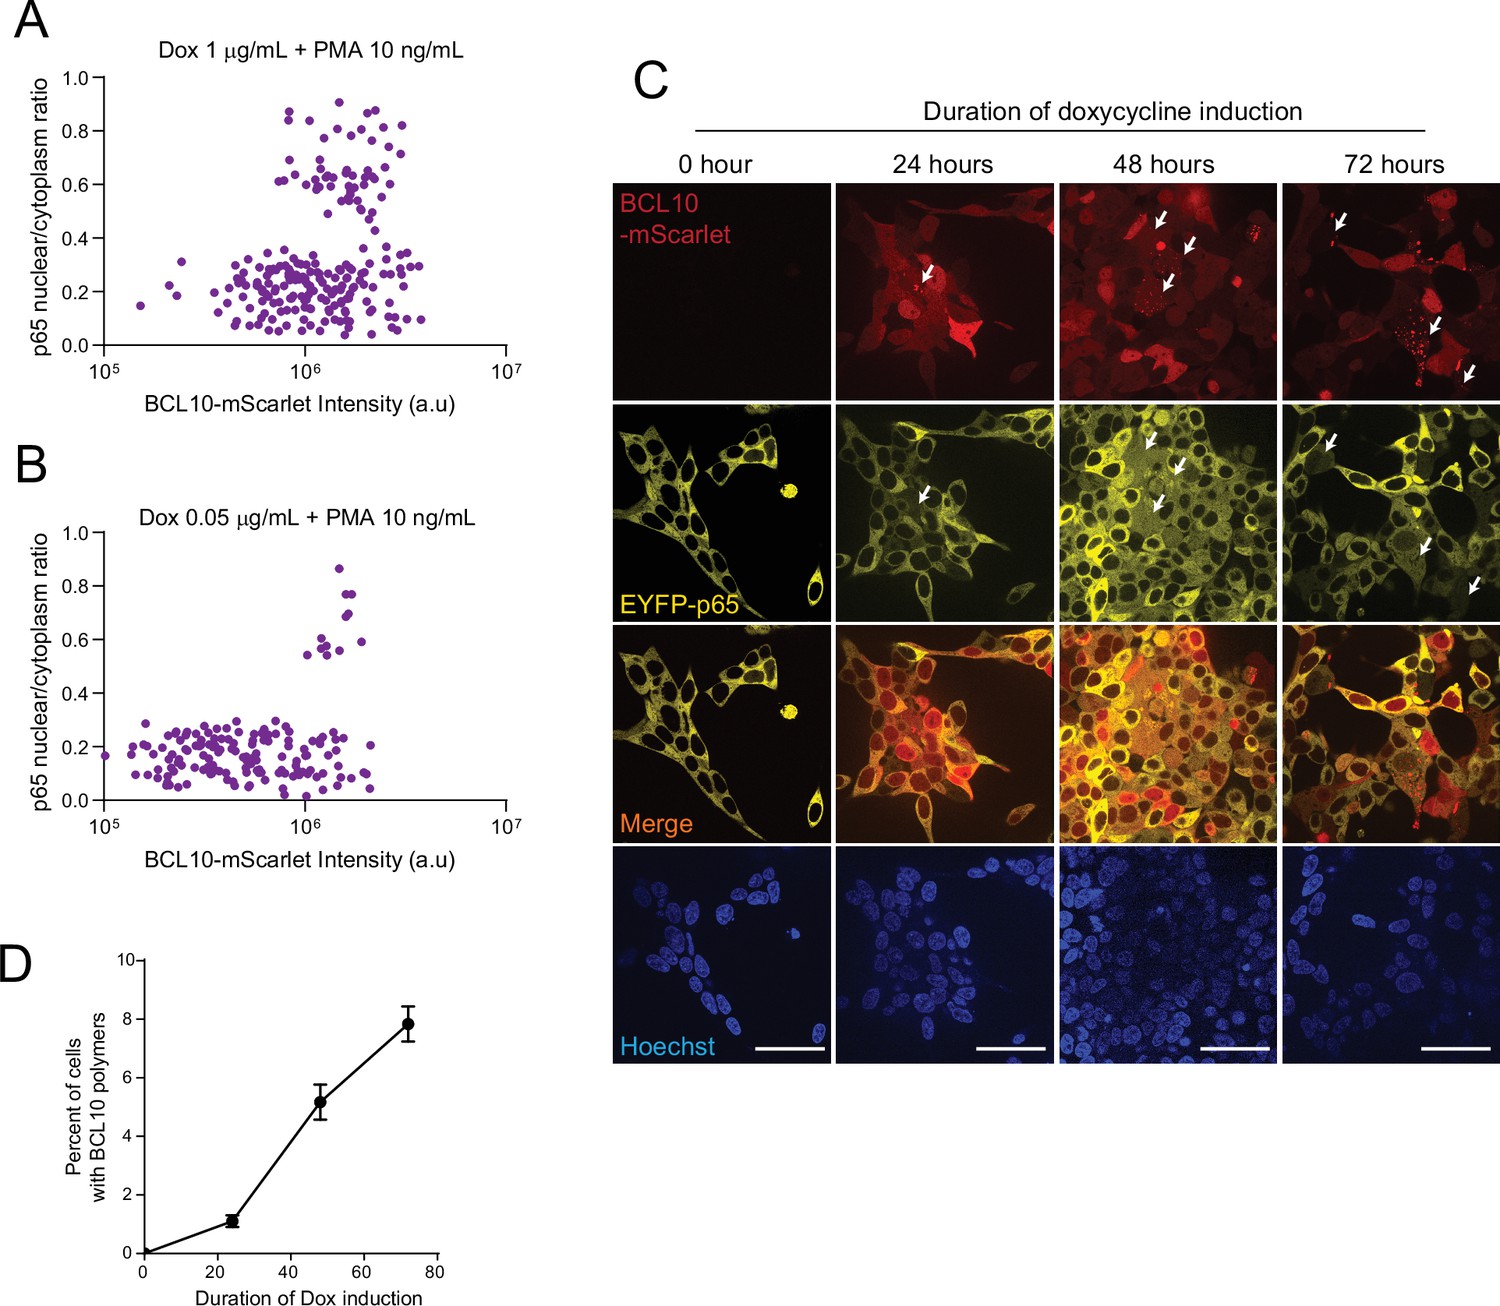
(A) Plot of p65 nuclear translocation and BCL10-mScarlet intensities from HEK293T BCL10KO cells reconstituted with BCL10-mScarlet expressing EYFP-p65. Cells were treated with Dox 1 µg/ml for 16 hr then treated with PMA 10 ng/ml. Images were captured after 4.5 hr of PMA treatment. n = 221. (B) HEK293T BCL10KO cells reconstituted with BCL10-mScarlet expressing EYFP-p65. Cells were treated with Dox 0.05 µg/ml for 16 hr then treated with PMA 10 ng/ml. Images were captured after 4.5 hr of PMA treatment. n = 157. (C) Images of HEK293T BCL10-KO cells reconstituted with BCL10-mScarlet expressing EYFP-p65. Cells were stimulated with dox for the respective duration and were tracked for BCL10 assembly status as well as p65 localization. Arrows indicate representative cases of spontaneous nucleation of BCL10-mScarlet and the corresponding EYFP-p65 nuclear translocation. Scale bar: 50 µm. (D) Quantification of the percentage of cells containing BCL10-mScarlet polymers. The analysis includes three independent measurements with over 300 cells quantified for each condition. Shown are means ± standard deviation (SD).
Figure 5 with 2 supplements
Endogenous BCL10 is constitutively supersaturated.
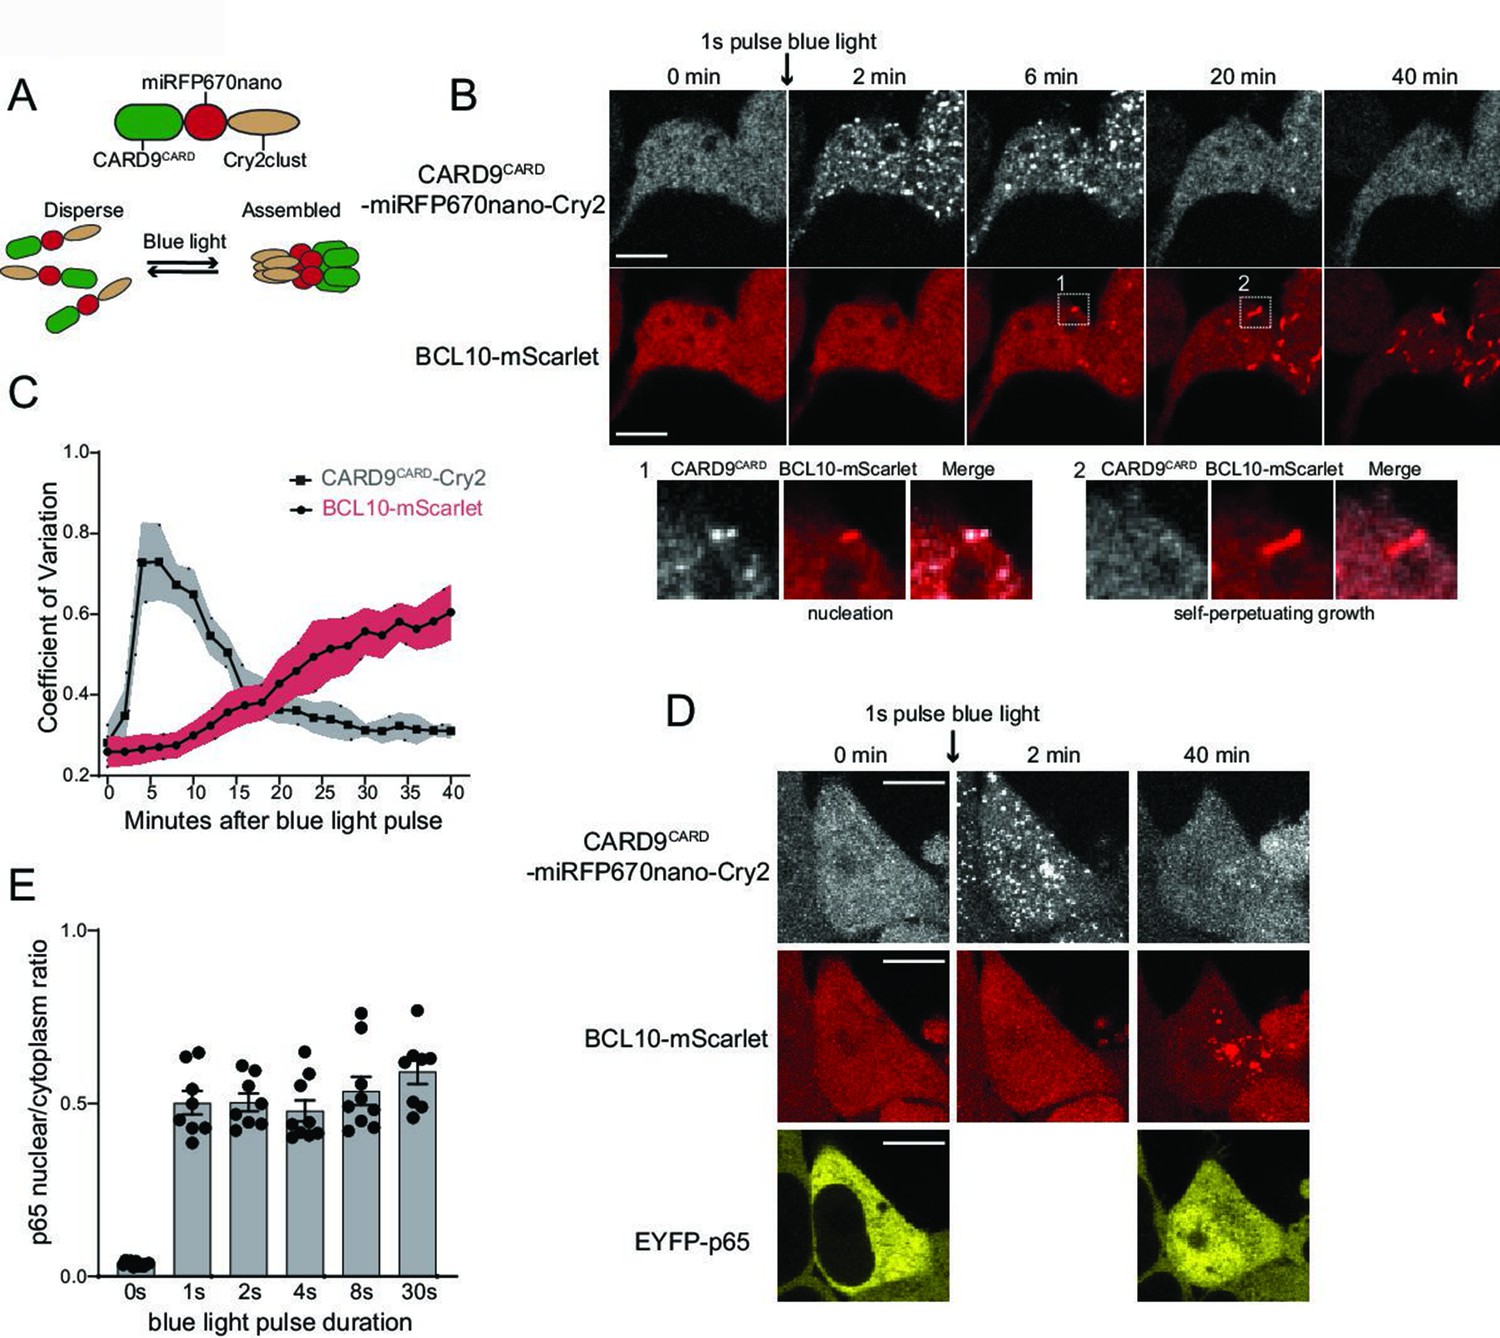
(A) Schematic of the optogenetic nucleation experiment. CARD9CARD is expressed as a fusion to the near-infrared fluorescent protein miRFP670nano and the light-controlled homomultimerizing module Cry2clust. Upon blue light exposure, Cry2clust forms reversible multimers that constrain the fused CARD9CARD domains to a local concentration sufficient to form a polymeric template for BCL10. (B) Microscopy images of 293T BCL10-KO cells stably expressing CARD9CARD-miRFP670nano-Cry2clust and BCL10-mScarlet. Cells were maintained at 37°C with 5% CO2 and imaged every 2 min followed by a short pulse of 488-nm light stimulation. Inset number 1, at 6-min post-stimulation, shows BCL10 colocalizing with a CARD9CARD cluster. Inset number 2, at 20 min, shows that the CARD9CARD cluster has dissolved, while the BCL10 punctum has instead elongated into a filament. Scale bar: 10 µm. (C) Values of the coefficient of variation of mIRFP670nano and mScarlet pixel intensities over time. The data are from 40 cell measurements. Shown are means ± standard deviation (SD). (D) Microscopy images of cells expressing CARD9CARD seeds, BCL10-mScarlet and EYFP-p65. Images were taken every 2 min following blue light stimulation. For technical reasons, EYFP-p65 was imaged only at the first and last time points. Scale bar: 10 µm. (E) Ratios of EYFP fluorescence intensities in the nucleus versus cytosol after blue light stimulation for the indicated durations. Shown are measurements from each cell, along with the means ± standard error of the mean (SEM).
Figure 5—figure supplement 1
BCL10 nucleation depends on the proper interaction with CARD9 optogenetic clusters.
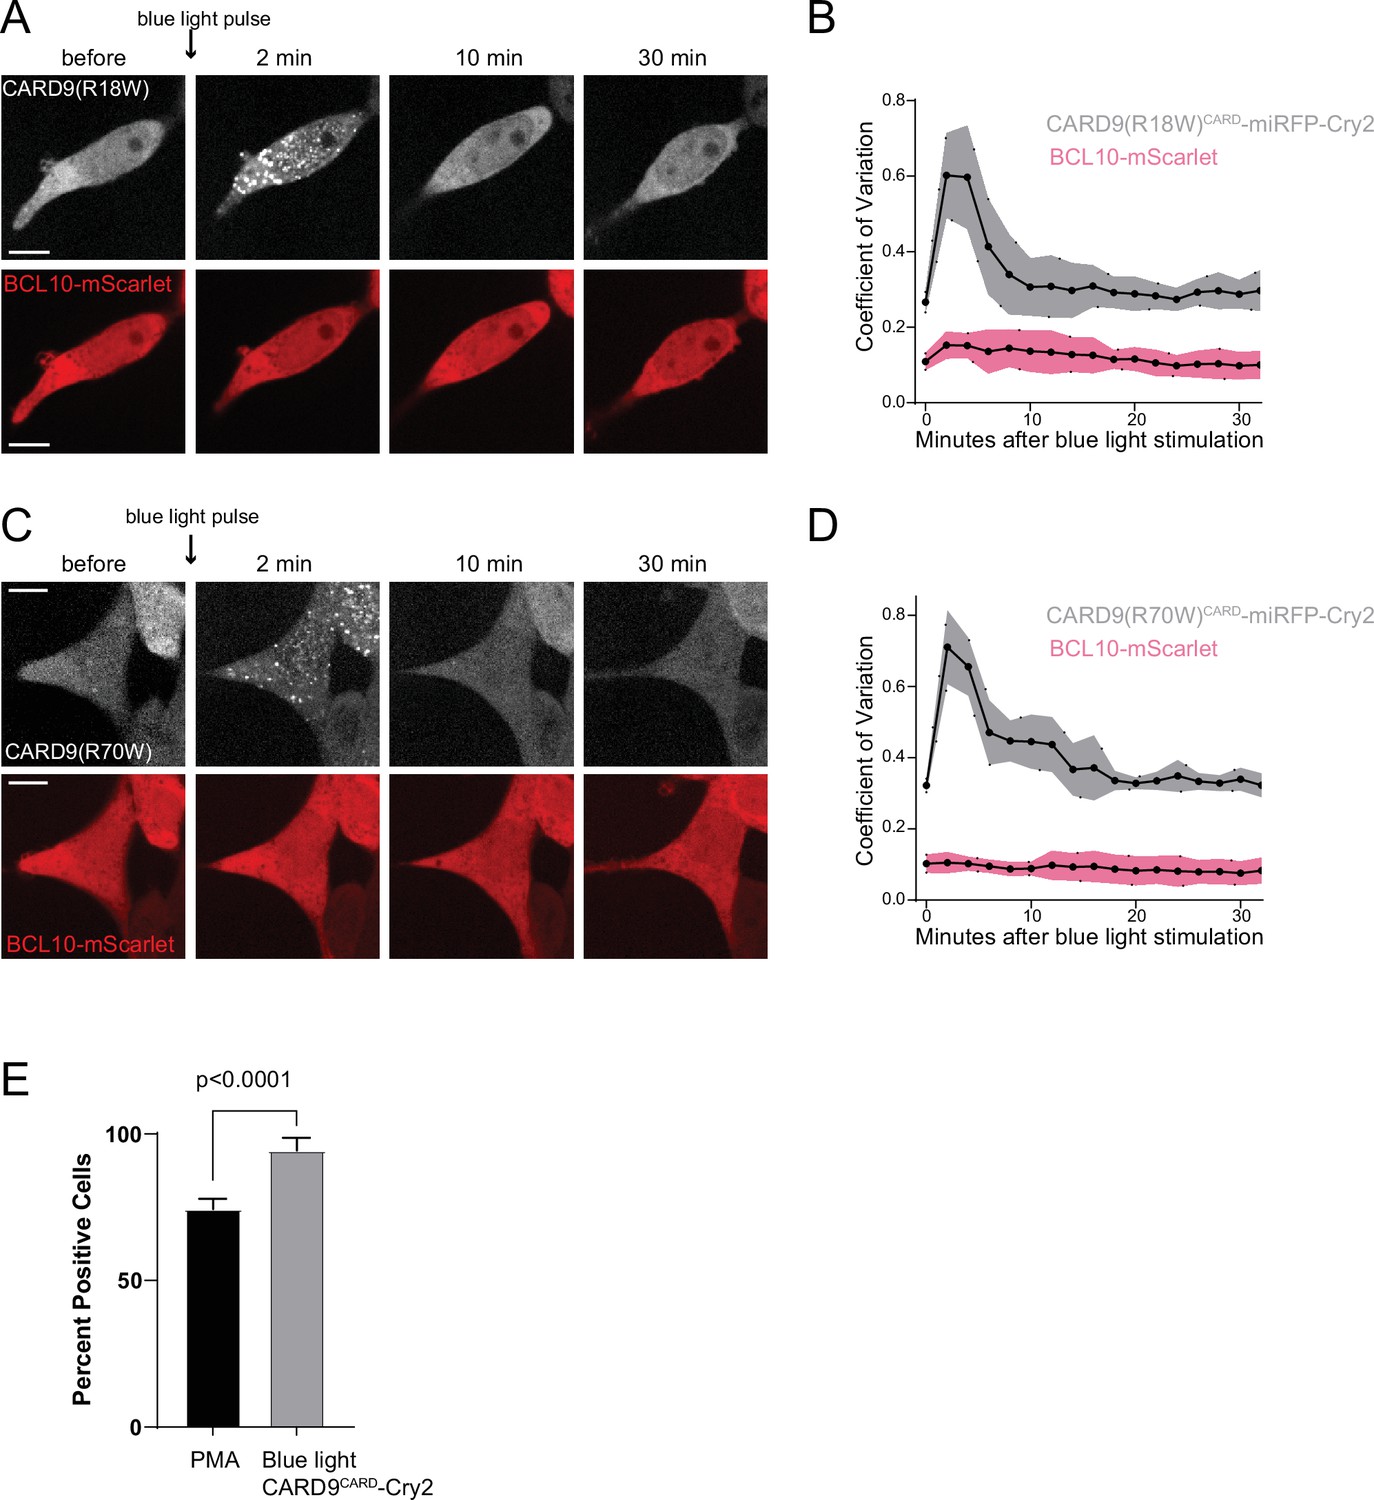
(A) Time-lapse microscopy of 293T BCL10-KO cells stably expressing CARD9(R18W)CARD-miRFP670nano-Cry2clust and BCL10-mScarlet. Cells were maintained at 37°C with 5% CO2. Images were taken every 2 min following 1-s exposure of 488-nm light stimulation. Scale bar: 10 µm. (B) Values of the coefficient of variation of mScarlet and miRFP670nano pixel intensities over time. Shown are means ± standard deviation (SD) from 20 cells. (C) Time-lapse microscopy of 293T BCL10-KO cells stably expressing CARD9(R70W)CARD-miRFP670nano-Cry2clust and BCL10-mScarlet. Images were taken every 2 min following a short pulse of 488-nm light stimulation. Scale bar: 10 µm. (D) Values of the coefficient of variation of mScarlet and miRFP670nano pixel intensities over time. Shown are means ± SD from 20 cells. (E) Quantification of the percentage of cells that become positive for nuclear transcription factor-κB (NF-κB) activation after either PMA or blue light stimulation of CARD9CARD-Cry2. Cells were treated with PMA 10 ng/ml and assayed for expression of NF-κB transcriptional reporter after 12 hr. The analysis of blue light activated NF-κB included measurements of three independent experiments for a total of 50 cells analyzed. Shown are means ± SD.
Figure 5—figure supplement 2
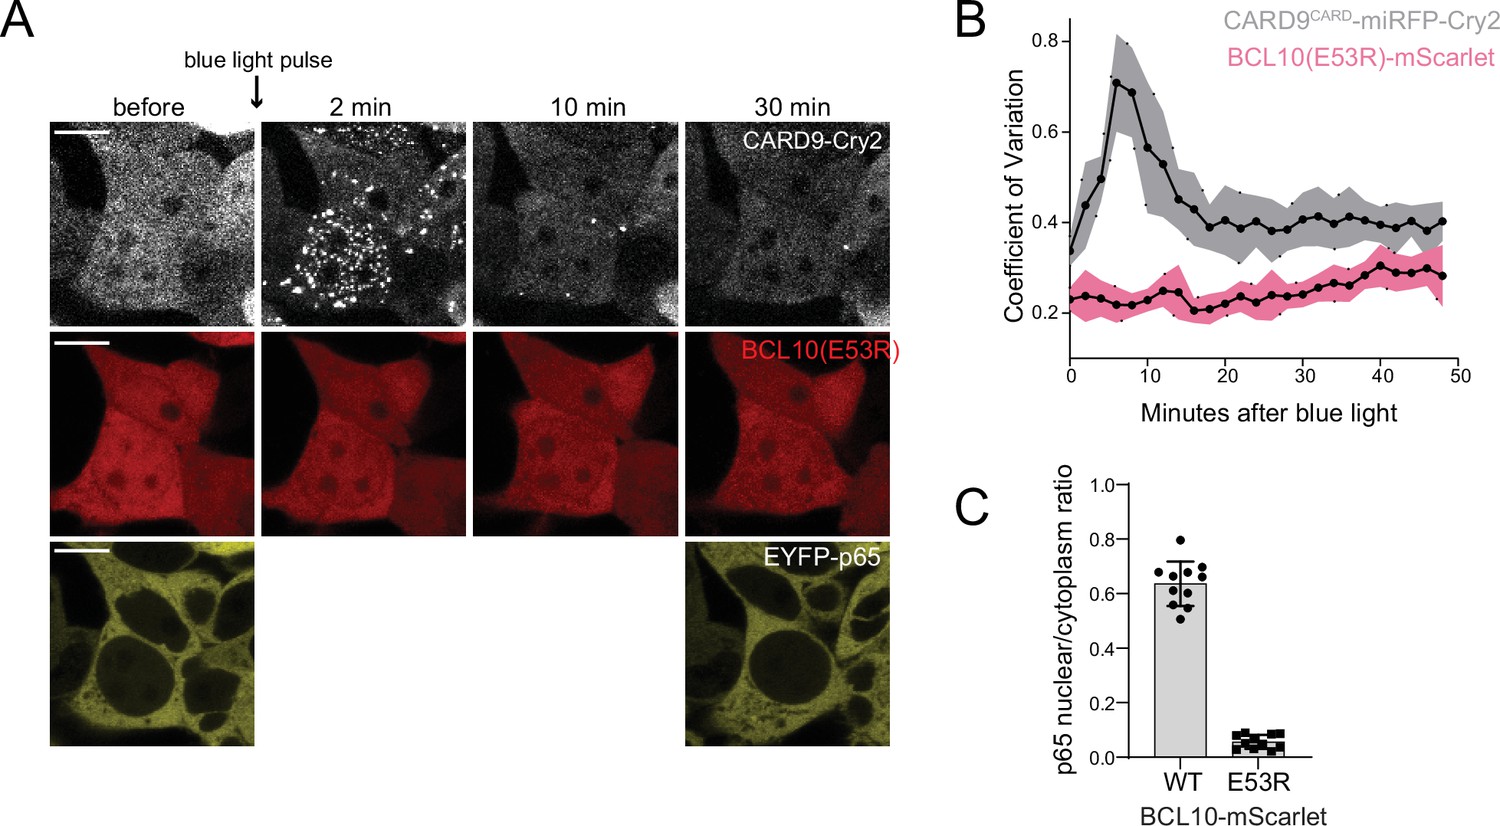
BCL10-mutant E53R fails to nucleate or induce nuclear transcription factor-κB (NF-κB) activity upon CARD9CARD optogenetic activation.
(A) Time-lapse microscopy of 293T BCL10-KO cells stably expressing CARD9CARD-miRFP670nano-Cry2clust, BCL10(E53R)-mScarlet, and EYFP-p65. Cells were maintained at 37°C with 5% CO2 and imaged every 2 min following a short pulse of 488-nm light stimulation. Scale bar: 10 µm. To avoid undesired Cry2clust activation, EYFP-65 was imaged only at the beginning and end of the time course. (B) Values of the coefficient of variation of mScarlet and miRFP670nano pixel intensities over time. Shown are means ± standard deviation (SD) from 20 cells. (C) Ratios of EYFP fluorescence intensities in the nucleus versus cytosol 30 min after blue light stimulation in (A). Shown are means ± SD from at least 10 cells per group.
Figure 6 with 1 supplement
MALT1 clustering suffices for activation and does not depend on an ordered structure of BCL10 polymers.
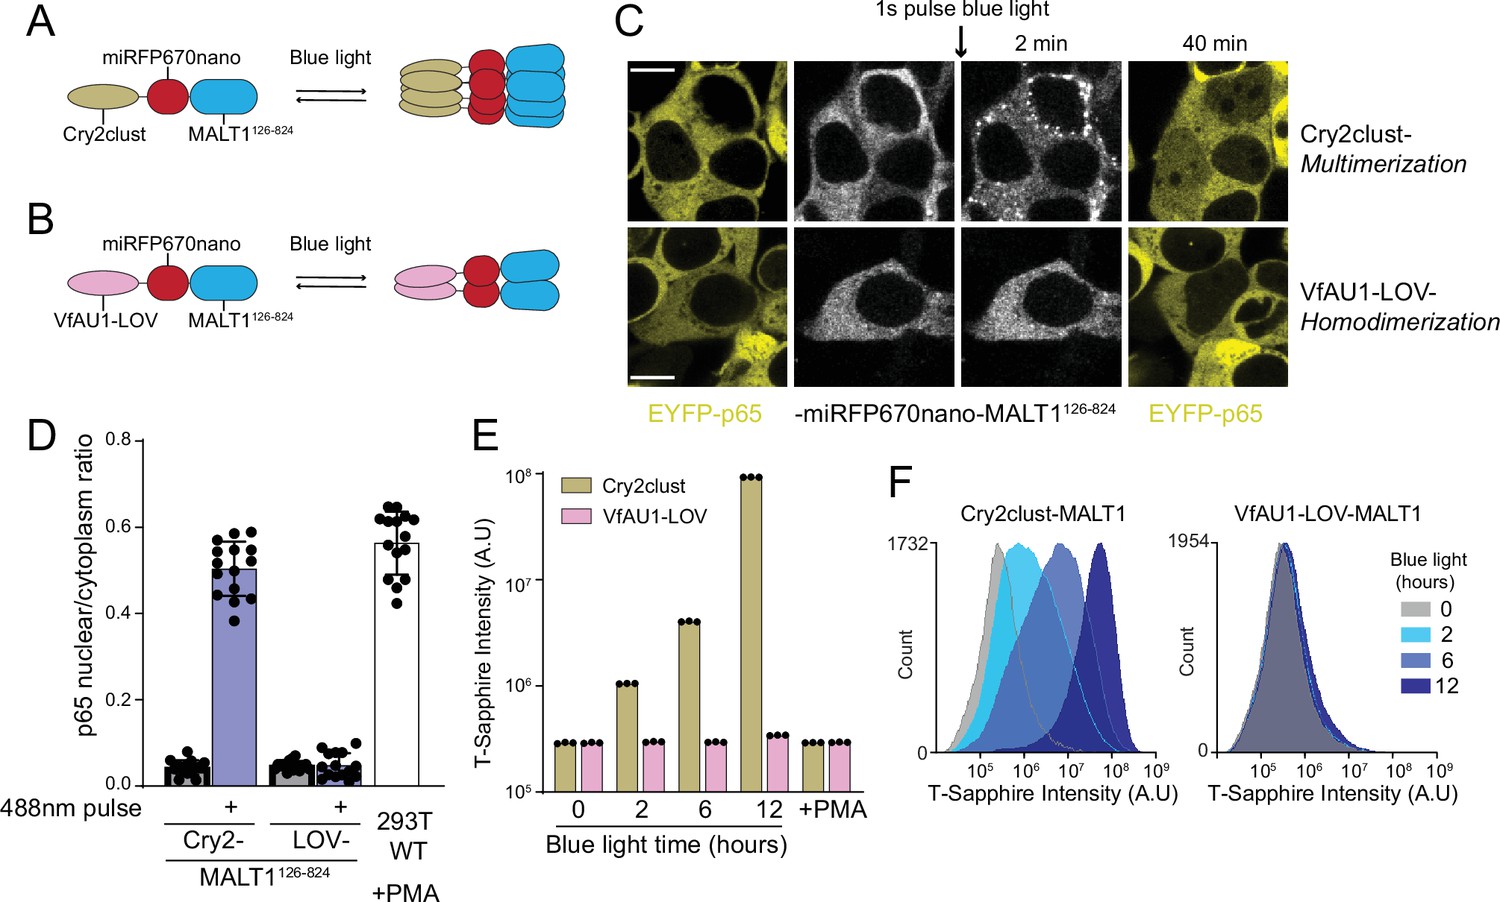
(A) Schematic of the optogenetic MALT1 activation experiment. A fragment of MALT1 lacking its death domain (MALT1126-824) is expressed as a fusion to mIRFP670nano and Cry2clust, allowing for its oligomerization upon blue light exposure. (B) Schematic of optogenetic MALT1 dimerization experiment. As for (A), but with Cry2clust replaced with the light-controlled dimerizing module, VfAU1-LOV. (C) Microscopy images of 293T cells expressing EYFP-p65 transfected with either the construct in (A) or (B). Images were taken every 2 min following a single pulse of blue light. EYFP-p65 was imaged before blue light stimulation and again 40 min after stimulation, showing that it translocated to the nucleus only in cells in which MALT1 had multimerized. Scale bar: 10 µm. (D) Ratios of EYFP fluorescence intensities in the nucleus versus cytosol at the 40 min time point for the experiments in (C). As a control, 293T WT expressing EYFP-p65 were treated with PMA 5 ng/ml. Shown are measurements from all cells, along with means ± standard deviation (SD) of three replicates. (E) Nuclear transcription factor-κB (NF-κB) activation in 293T MALT1-KO NF-κB reporter cells transfected with the constructs in (A) and (B) and stimulated with continuous blue light for the indicated durations. Cells were treated with PMA at 5 ng/ml. Data represent medians of three independent measurements. (F) Flow cytometry histograms of T-Sapphire fluorescence for the experiment in (E).
Figure 6—figure supplement 1

Validation of optogenetic modules using CASP8 triggered cell death.
(A) Microscopy images of 293T cells transfected with either Cry2clust or VfAU1-LOV fused to CASP8180-479, which lacks the death domain. One day after transfection, cells were exposed to constant blue light stimulation from a blue LED source while being maintained at 37°C and 5% CO2. Prior to imaging, cells were treated with the LIVE/DEAD cell marker DRAQ7. Scale bar: 10 µm. (B) Percentage of dead cells from the experiment in A. Data are from three independent experiments with >200 cells counted per replicate. Shown are means ± standard deviation (SD).
Figure 7 with 1 supplement
Ancient origin of the sequence-encoded nucleation barrier in BCL10.
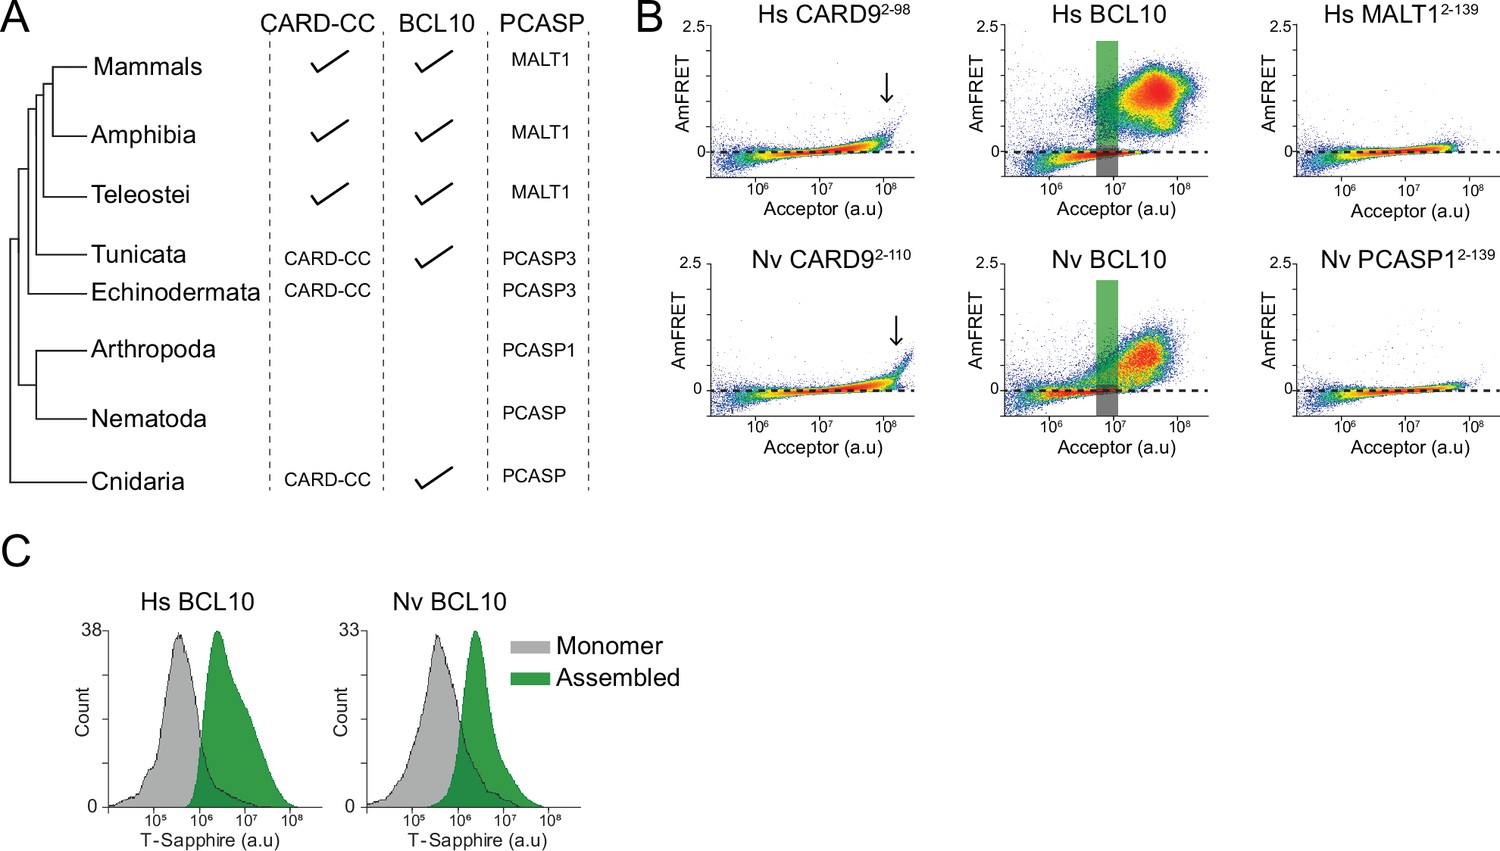
(A) Phylogenetic tree of CARD-BCL10-MALT1 (CBM) signalosome components in the major metazoan clades. One or more CARD-CC proteins occur in all clades, as does a MALT1-like paracaspase. BCL10 was present in the common ancestor to chordates and cnidarians. (B) DAmFRET plots of 293T cells expressing CARD9CARD, BCL10, or MALT1DD from human (top) or the sea anemone Nematostella vectensis (bottom). The gray and green boxes designate the regions gated for cells containing either monomer or polymerized protein, respectively, and analyzed for T-Sapphire expression in (C). (C) Flow cytometry histograms of T-Sapphire fluorescence in 293T BCL10-KO nuclear transcription factor-κB (NF-κB) reporter cells 48 hr after transfection with either human or N. vectensis BCL10-mEos3.2. Gray and green shading represent cells containing either monomeric or polymerized BCL10, respectively, from the corresponding gates illustrated in (B). Data are representative of three independent experiments.
Figure 7—figure supplement 1
The BCL10 CARD domain structure is conserved between human and N. vectensis orthologs.
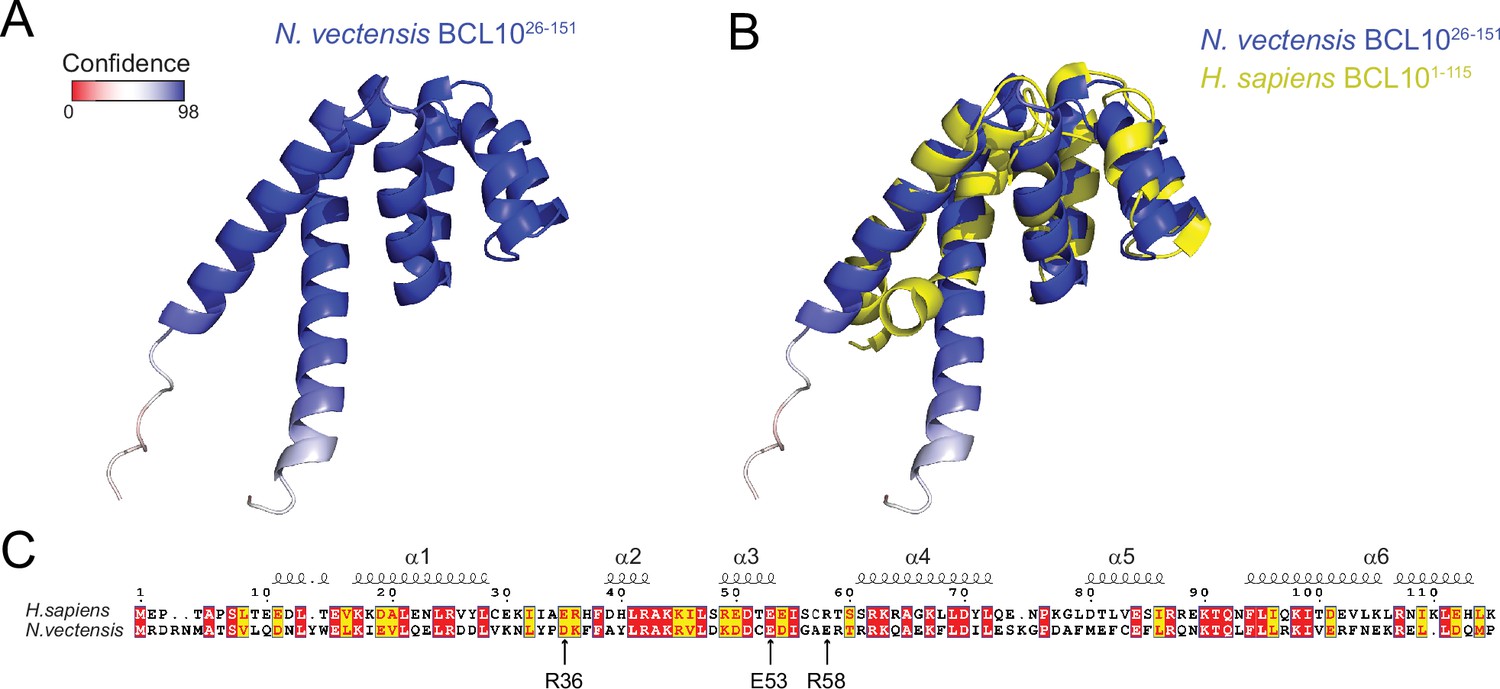
(A) Structure predicted by AlphaFold2 (Jumper et al., 2021) of Nematostella vectensis BCL10 (A7SSM3). The selected model shows a very high degree of confidence throughout the CARD. (B) Alignment of the predicted structure of Nv BCL10 with human BCL10 (2MB9). The structural alignment produces an RMSD of 2.912. (C) Sequence alignment for the CARD of Nv and human BCL10. Arrows indicate the mutations in human BCL10 that perturb nucleation.
Videos
Video 1
BCL10 nucleation instructs p65 nuclear translocation.
This video shows HEK293T BCL10-KO cells reconstituted with BCL10-mScarlet expressing EYFP-p65. Upon addition of PMA, cells acquire BCL10 puncta (left panel) and p65 nuclear translocation (middle panel). Right panel, Hoechst staining. Scale bar: 10 µm.
Video 2
Optogenetic activation of CARD9CARD reveals BCL10 supersaturation.
This video shows optogenetic induction of CARD9CARD-miRFP670-Cry2 clusters (top panel). After a few frames, CARD9 clusters induce BCL10-mScarlet (bottom panel) nucleation, which goes on to polymerize independently of CARD9 clusters. Thus, revealing a pre-existing state of supersaturation. Scale bar: 10 µm.
Tables
Key resources table
| Reagent type (species) or resource | Designation | Source or reference | Identifiers | Additional information |
|---|---|---|---|---|
| Cell line (Homo sapiens) | HEK293T | American Type Culture Collection | # CRL-3216 | |
| Cell line (Homo sapiens) | THP-1 | American Type Culture Collection | # TIB-202 | |
| Strain, strain background (Saccharomyces cerevisiae) | rhy1713 | Khan et al., 2018 | Parent strain for DAmFRET experiments | |
| Strain, strain background (Saccharomyces cerevisiae) | rhy1734 | Khan et al., 2018 | Parent strain for DAmFRET experiments | |
| Transfected construct (Homo sapiens) | m1.0151 | This paper | Plasmid for expressing Hs CARD9-(G4S)-mCardinal from CMV promoter | |
| Transfected construct (Homo sapiens) | m1.0012 | This paper | Plasmid for expressing Hs BCL10-(EA3R)4-mEos3.2 from CMV promoter | |
| Antibody | anti-BCL10 (Rabbit polyclonal) | Cell Signaling Technology | C78F1 | Simple Western (1:10) |
| Antibody | anti-CARD9 (Mouse monoclonal) | Santa Cruz Biotechnology | B-12: sc-46677 | Simple Western (1:150) |
| Recombinant DNA reagent | pCW57.1 | Addgene | #41393 | |
| Recombinant DNA reagent | pLV-EF1a-IRES-Hygro | Addgene | #85134 | |
| Chemical compound, drug | PMA | BioVision | 1544–5 | |
| Software, algorithm | GraphPad Prism | Version 9 for Windows |
Additional files
-
Transparent reporting form
- https://cdn.elifesciences.org/articles/79826/elife-79826-transrepform1-v2.pdf
-
Supplementary file 1
List of plasmids and the amino acid sequences of the relevant ORFs used in this study.
- https://cdn.elifesciences.org/articles/79826/elife-79826-supp1-v2.xlsx
-
Supplementary file 2
List of S. cerevisiae strains used in this study.
- https://cdn.elifesciences.org/articles/79826/elife-79826-supp2-v2.xlsx
Download links
A two-part list of links to download the article, or parts of the article, in various formats.
Downloads (link to download the article as PDF)
Open citations (links to open the citations from this article in various online reference manager services)
Cite this article (links to download the citations from this article in formats compatible with various reference manager tools)
A nucleation barrier spring-loads the CBM signalosome for binary activation
eLife 11:e79826.
https://doi.org/10.7554/eLife.79826


