Predicting mechanisms of action at genetic loci associated with discordant effects on type 2 diabetes and abdominal fat accumulation
- Department of Biomedical Engineering, University of Virginia, United States
- Center for Public Health Genomics, University of Virginia, United States
- Department of Genetics and Genomic Sciences, Icahn School of Medicine at Mount Sinai, United States
- Department of Medicine, Karolinska Institutet, Huddinge, Sweden
Figures
Figure 1

Analysis summary and discordant variant characteristics.
(A) Summary of analysis pipeline and generated results. Details of data sources are available in Supplementary file 1. (B) Effect size (WHRadjBMI) and odds ratio (T2DadjBMI) of lead genetic variant at discordant association signals. (C) Phenome-wide association study (PheWAS) of lead discordant genetic variant effect sizes on glycemic and anthropometric traits. From left to right: random glucose (RG), fasting glucose (FG), FG adjusted for body mass index (BMI) (FGadjBMI), fasting insulin adjusted for BMI (FIadjBMI), glycated hemoglobin (HBA1C), pancreatic fat percentage (PF), trunk fat ratio (TFR), visceral adipose tissue (VAT), VAT adjusted for BMI and height (VATadjBMIHeight), VAT to abdominal subcutaneous adipose tissue (VATtoASAT), VAT to gluteofemoral fat (VATtoFGAT), waist circumference, waist circumference adjusted for BMI (WCadjBMI), waist-to-hip ratio (WHR), and BMI. (D) Variant effect prediction of 99% credible set variants in discordant genetic loci.
-
Figure 1—source data 1
Genetic, transcriptomic, and epigenomic data sources in Figure 1.
- https://cdn.elifesciences.org/articles/79834/elife-79834-fig1-data1-v1.xlsx
Figure 2
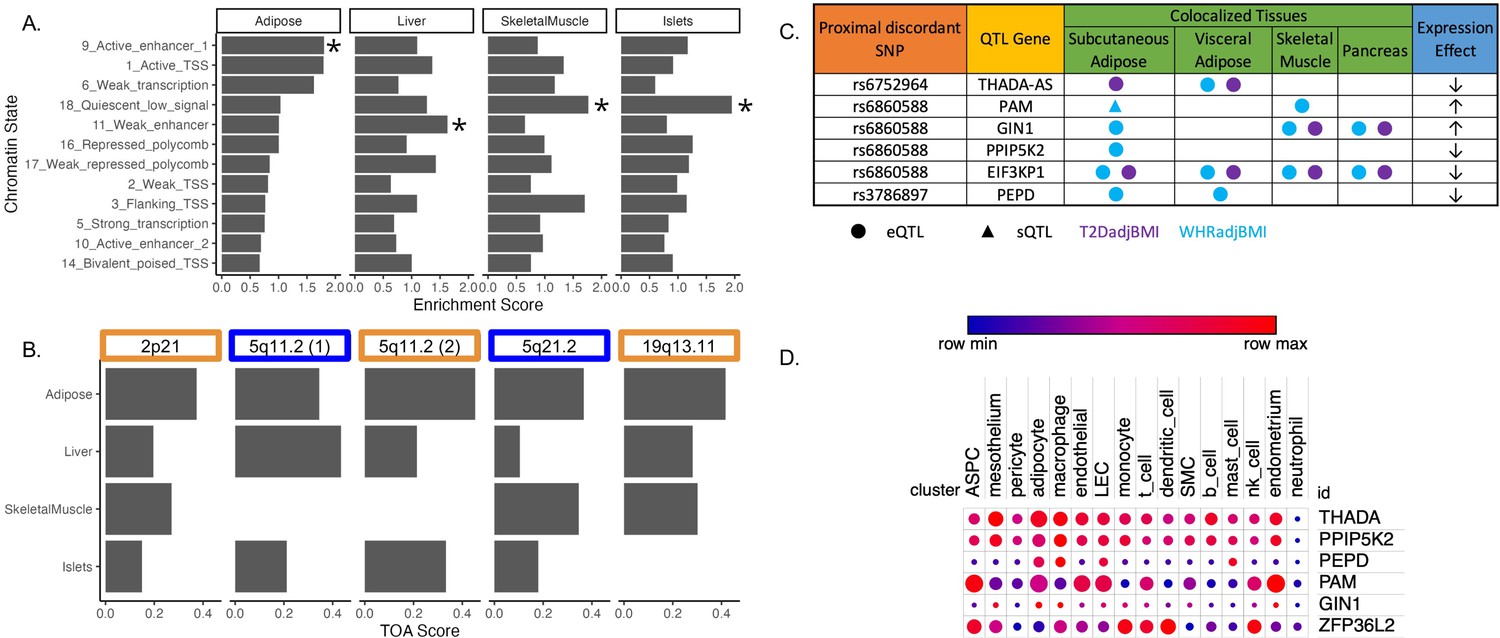
Predicting functional tissues and effector genes at discordant loci.
(A) Tissue-specific enrichment of chromatin states of variants in the 99% credible set of colocalized variants. (B) Tissue of action scores for association signals in the five discordant loci. Orange coloration indicates predicted adipose tissue of action at the locus, and blue coloration indicates shared tissue of action assignment at the locus. (C) Summary table of the expression quantitative trait loci (eQTL) and splicing QTL (sQTL) colocalizations with waist-to-hip circumference adjusted for the body mass index (WHRadjBMI) and T2DadjBMI for discordant loci. The expression effect direction is with respect to the protective type 2 diabetes allele. (D) Expression of predicted effector genes in discordant loci across cell types. From left to right: adipocyte progenitor stem cells (ASPC), lymphatic endothelial cells (LEC), smooth muscle cells (SMC), and natural killer cells (nk). Data was obtained from Emont et al., 2022.
-
Figure 2—source data 1
Genetic, transcriptomic, and epigenomic data sources used in Figure 2.
- https://cdn.elifesciences.org/articles/79834/elife-79834-fig2-data1-v1.xlsx
Figure 3

Predicted physiological and cellular effects of effector genes (eGenes) on metabolic phenotypes and adipogenesis.
(A) Biweight midcorrelation of adipose tissue eGenes expression with metabolic phenotypes (false discovery rate [FDR] <5%). From left to right: Homeostatic model assessment of insulin resistance (HOMA-IR), high-density lipoproteins (HDL), low-density lipoproteins (LDL), interleukin-1 receptor agonist (IL1RA), C-reactive protein (CRP). (B) Dynamic expression of adipose tissue eGenes over 16-day adipogenesis time course in Simpson-Golabi-Behmel syndrome (SGBS) cells. We performed the likelihood ratio test (LRT) to evaluate if each gene was dynamically expressed over the time course. The p-value of the LRT is included.
-
Figure 3—source data 1
Genetic, transcriptomic, and epigenomic data sources in Figure 3.
- https://cdn.elifesciences.org/articles/79834/elife-79834-fig3-data1-v1.xlsx
Figure 4 with 2 supplements
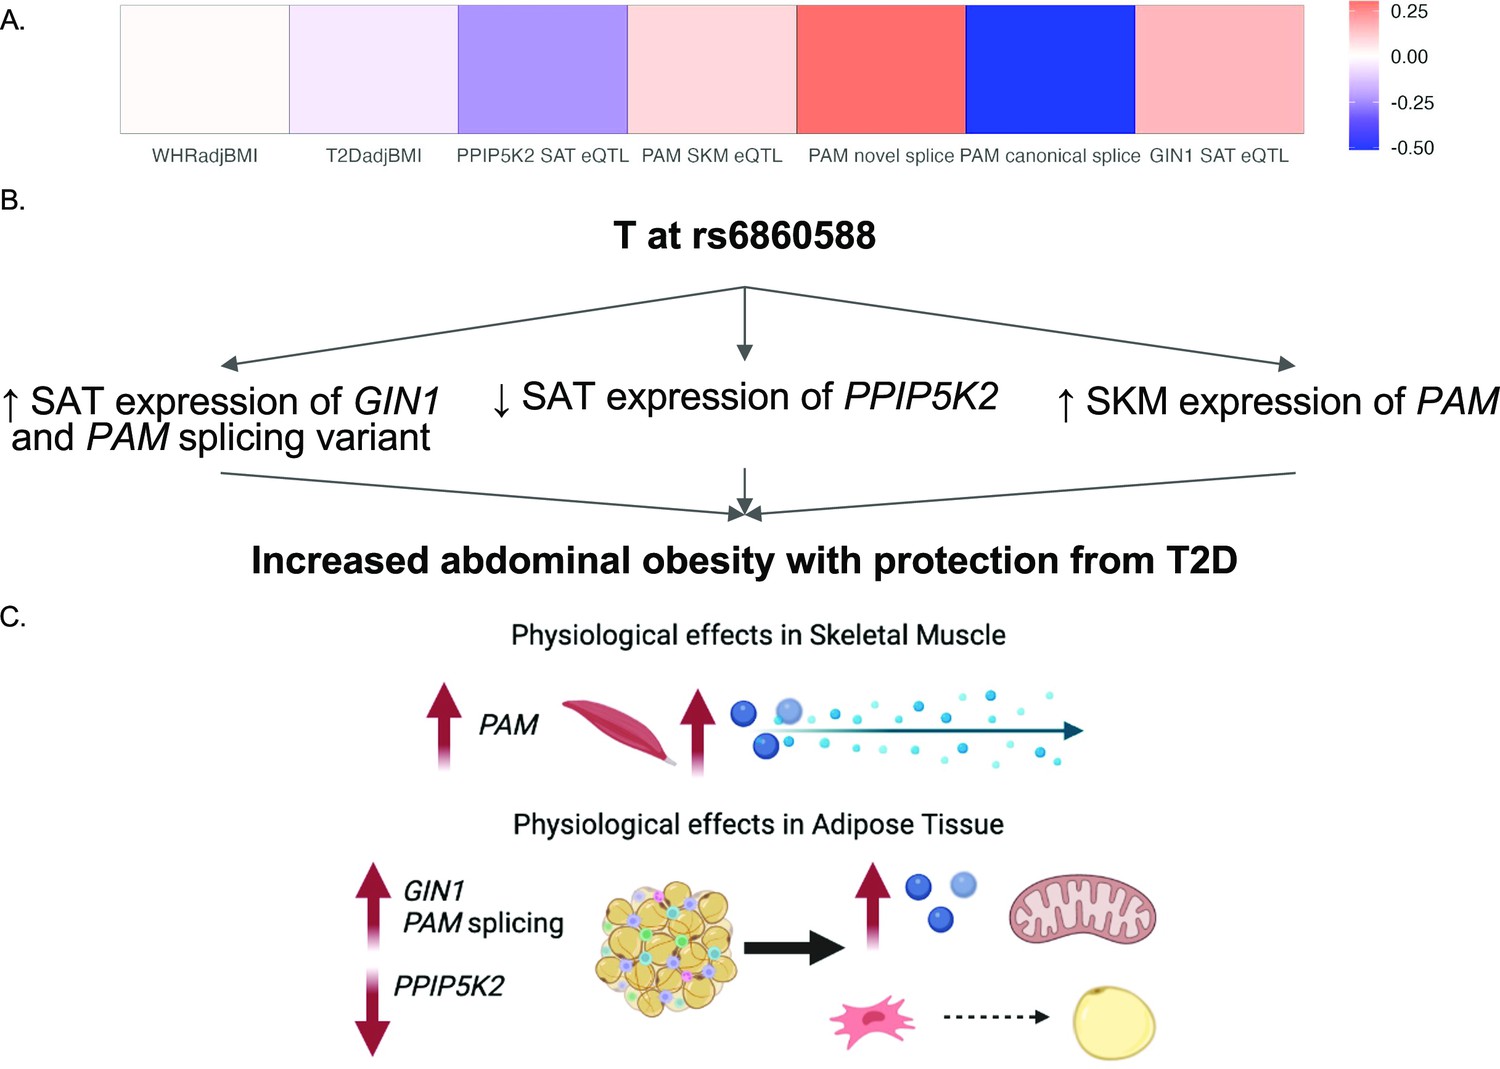
Predicted model of effects associated with T allele at rs6860588.
(A) β of the T allele of discordant variant rs6860588 with respect to waist-to-hip circumference adjusted for the body mass index (WHRadjBMI), T2DadjBMI, and colocalized effector genes (eGenes). (B) Summary of associations with T allele at rs6860588. (C) Integrated model reconciling metabolic discordance with eGene-associated phenotypes in two tissues of action. Created with BioRender.com.
-
Figure 4—source data 1
Genetic, transcriptomic, and epigenomic data sources in Figure 4 and Figure 4—figure supplements 1 and 2 .
- https://cdn.elifesciences.org/articles/79834/elife-79834-fig4-data1-v1.xlsx
Figure 4—figure supplement 1
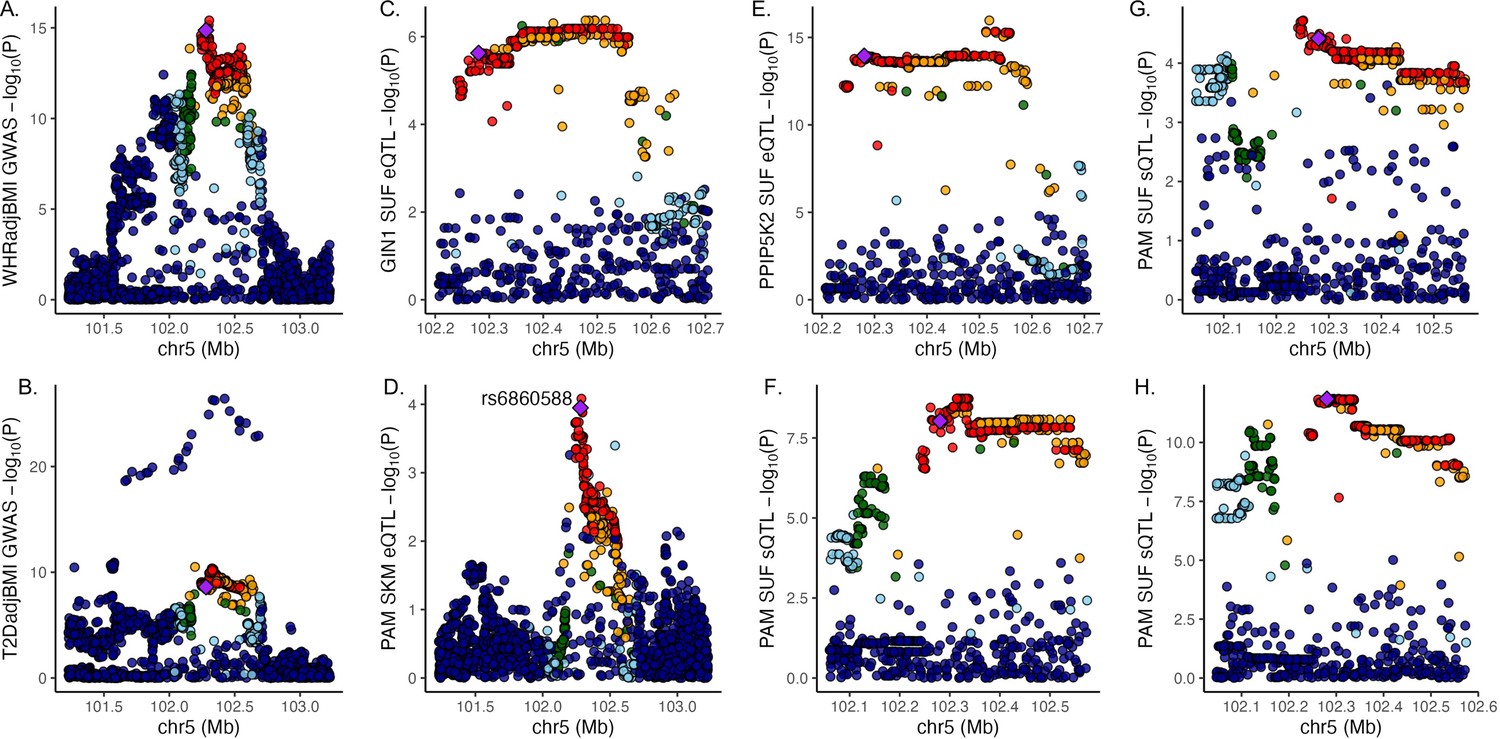
Discordant variant rs6860588 is associated with pleiotropic effects on gene regulation in multiple tissues.
Manhattan plot of associations at the 5q21.1 locus containing lead variant rs6860588 for (A) waist-to-hip circumference adjusted for the body mass index (WHRadjBMI) genome-wide association studies (GWAS), (B) T2DadjBMI, (C) subcutaneous adipose tissue (SAT) expression of GIN1, (D) SKM expression of PAM, (E) SAT expression of PPIP5K2, (F) SAT expression of PAM splice variant that skips exon 14, (G) SAT expression of canonical PAM splice junction between exons 13 and 14, and (H) SAT expression of canonical PAM splice junction between exons 14 and 15.
Figure 4—figure supplement 2
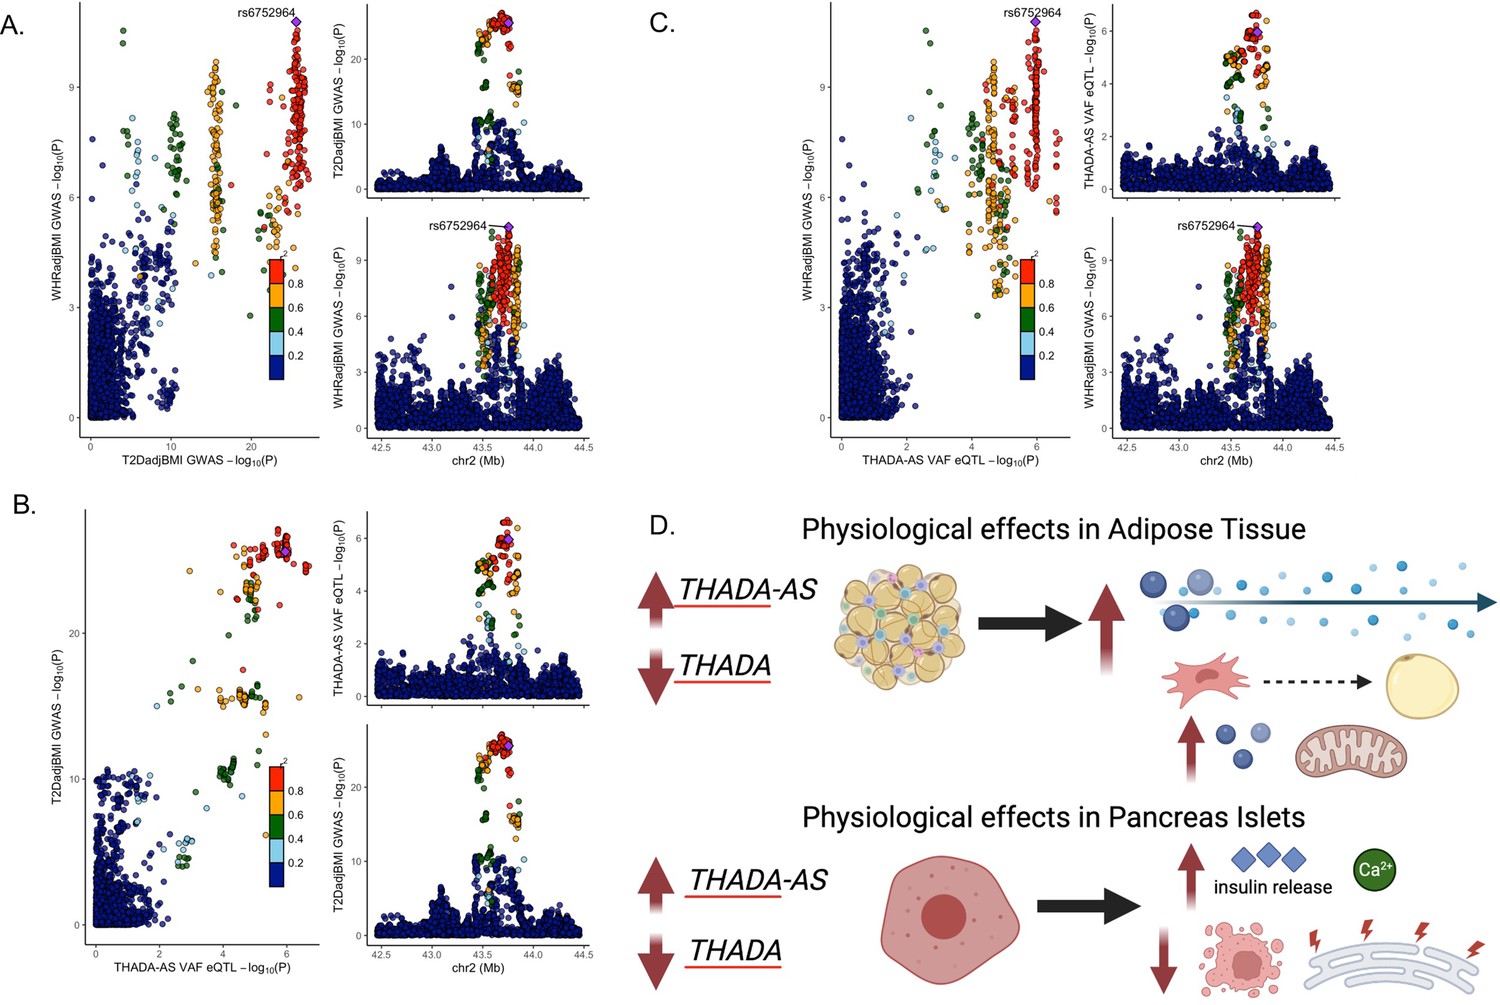
Discordant variant rs6752964 is associated with pleiotropic effects on gene regulation in multiple tissues.
LocusCompare plot of associations with rs6752964 for (A) waist-to-hip circumference adjusted for the body mass index (WHRadjBMI) genome-wide association studies (GWAS) with T2DadjBMI GWAS, (B) T2DadjBMI GWAS with adipose tissue expression quantitative trait loci (eQTL), and (C) WHRadjBMI GWAS with adipose tissue eQTL. (D) The proposed model reconciles the metabolic discordance observed in 2p21 with the associated lead variant rs6752964. Created with BioRender.com.
Additional files
-
Supplementary file 1
Credible set of genetic variants in T2DadjBMI and WHRadjBMI colocalized loci.
- https://cdn.elifesciences.org/articles/79834/elife-79834-supp1-v1.xlsx
-
Supplementary file 2
Finemapping analysis of association signals in loci containing discordant association signals.
- https://cdn.elifesciences.org/articles/79834/elife-79834-supp2-v1.xlsx
-
Supplementary file 3
Multi-trait colocalization of body fat distribution component traits in discordant loci.
- https://cdn.elifesciences.org/articles/79834/elife-79834-supp3-v1.xlsx
-
Supplementary file 4
Variant effect predictions of discordant variants.
- https://cdn.elifesciences.org/articles/79834/elife-79834-supp4-v1.xlsx
-
Supplementary file 5
Tissue of action scores at colocalized loci.
- https://cdn.elifesciences.org/articles/79834/elife-79834-supp5-v1.xlsx
-
Supplementary file 6
Significant eQTL and sQTL colocalization results in coloc.
- https://cdn.elifesciences.org/articles/79834/elife-79834-supp6-v1.xlsx
-
Supplementary file 7
Significant eQTL and sQTL colocalization results in SMR.
- https://cdn.elifesciences.org/articles/79834/elife-79834-supp7-v1.xlsx
-
MDAR checklist
- https://cdn.elifesciences.org/articles/79834/elife-79834-mdarchecklist1-v1.pdf
Download links
A two-part list of links to download the article, or parts of the article, in various formats.
Downloads (link to download the article as PDF)
Open citations (links to open the citations from this article in various online reference manager services)
Cite this article (links to download the citations from this article in formats compatible with various reference manager tools)
Predicting mechanisms of action at genetic loci associated with discordant effects on type 2 diabetes and abdominal fat accumulation
eLife 12:e79834.
https://doi.org/10.7554/eLife.79834


