Impact of energy limitations on function and resilience in long-wavelength Photosystem II
- Department of Life Sciences, Imperial College London, United Kingdom
- Photosyntesis Research Unit, Consiglio Nazionale delle Ricerche, Italy
- Physics Department, Freie Universität Berlin, Germany
- Institut de Biologie Physico-Chimique, UMR CNRS 7141 and Sorbonne Université, France
- Institut de Biologie Intégrative de la Cellule, UMR9198, CEA Saclay, France
Figures
Figure 1
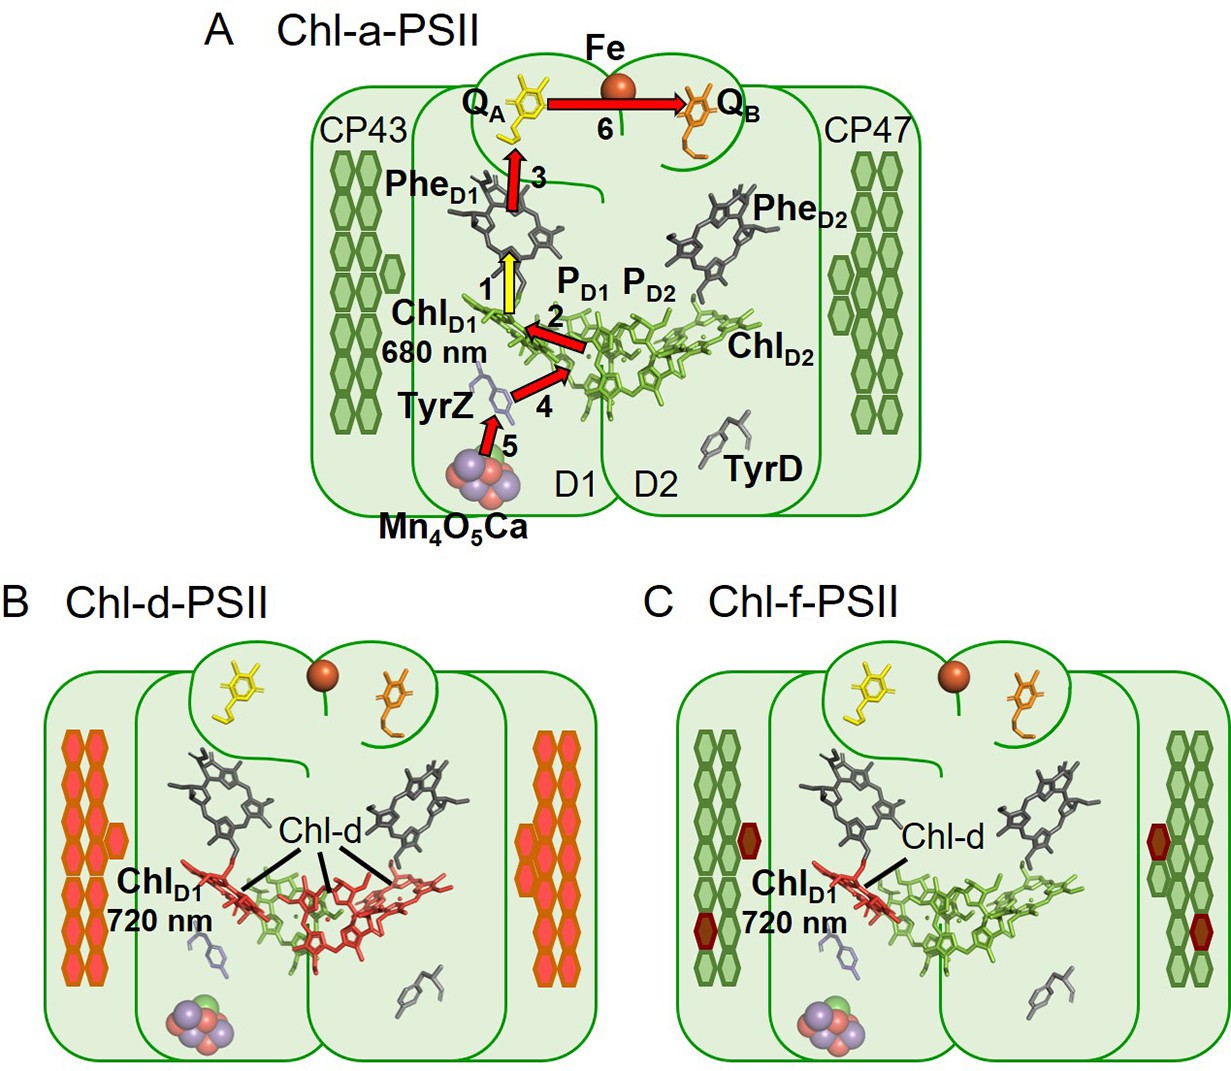
The three types of PSII.
(A) Chl-a-PSII with the key cofactors of the reaction centre, located in the subunits D1 and D2, labelled. Besides the PD1, PD2, ChlD1, and ChlD2 chlorophylls and the two pheophytins, PheD1 and PheD2, these cofactors include the quinones, QA and QB, and the non-heme iron (Fe) on the acceptor side and the two redox-active tyrosines TyrZ and TyrD and the manganese cluster (Mn4O5Ca) on the donor side. The arrows represent the electron transfer steps and the numbers the order of the steps. The yellow arrow is the primary charge separation, with other steps shown as red arrows. The primary donor is shown as ChlD1. (B) and (C) Chl-d-PSII and Chl-f-PSII, with the far-red chlorophylls in the reaction centres highlighted and the wavelength of the primary donor, assumed to be ChlD1, indicated. The hexagons on the sides of each reaction centre represent the chlorophylls of the respective antennas, located in the subunits CP43 and CP47. Chl-a is represented in green, Chl-d in orange and Chl-f in brown. In (C) the single Chl-d is located in the ChlD1 position, reflecting the assignment of the single Chl-d as the primary donor (Gisriel et al., 2022), leaving the remaining 4 Chl-f molecules as peripheral antenna. For all three types of PSII, the model of the reaction centre cofactors was made based on the crystal structure of PSII from the cyanobacterium Thermosynechococcus vulcanus (PDB ID: 3WU2, Umena et al., 2011).
Figure 2 with 1 supplement
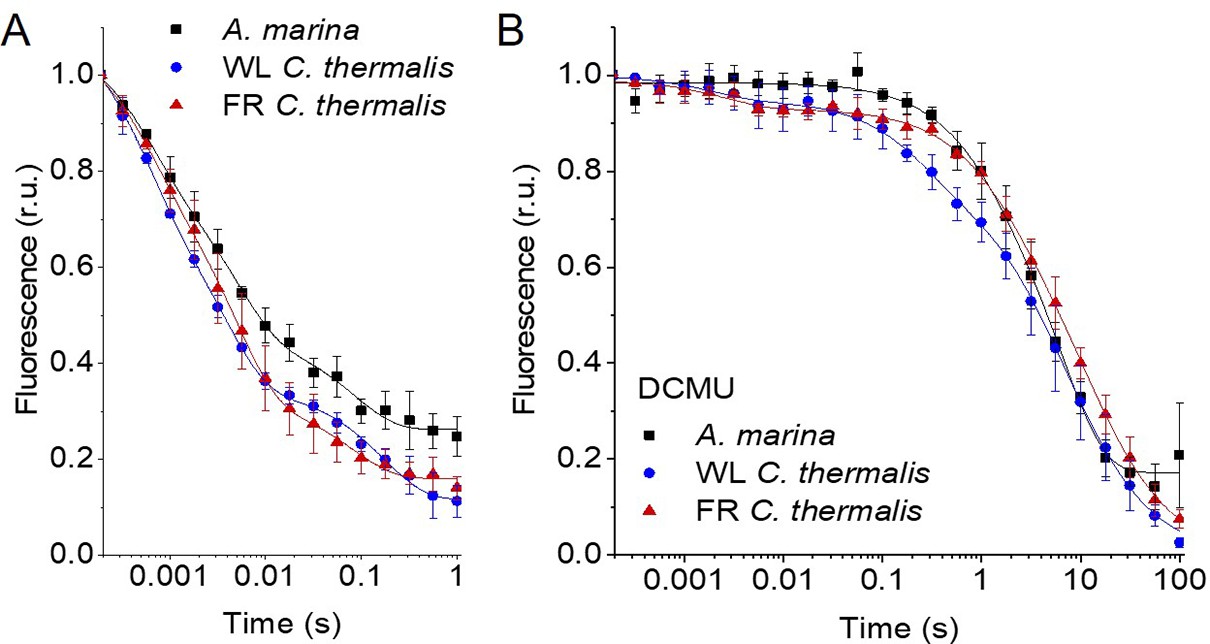
Fluorescence decay kinetics after a saturating flash in membranes of A. marina, WL C. thermalis and FR C. thermalis with no additions (A) and in presence of DCMU (B).
The datapoints represent the averages of three biological replicates,± s.d. (provided in Figure 2—source data 1), the lines represent the fits of the experimental data. All traces are normalized on the initial variable fluorescence (Fm-F0, with Fm measured 190 μs after the saturating flash). The full 100 s traces of the data in (A) are shown in Figure 2—figure supplement 1.
-
Figure 2—source data 1
Fluorescence decay kinetics.
- https://cdn.elifesciences.org/articles/79890/elife-79890-fig2-data1-v2.xlsx
Figure 2—figure supplement 1
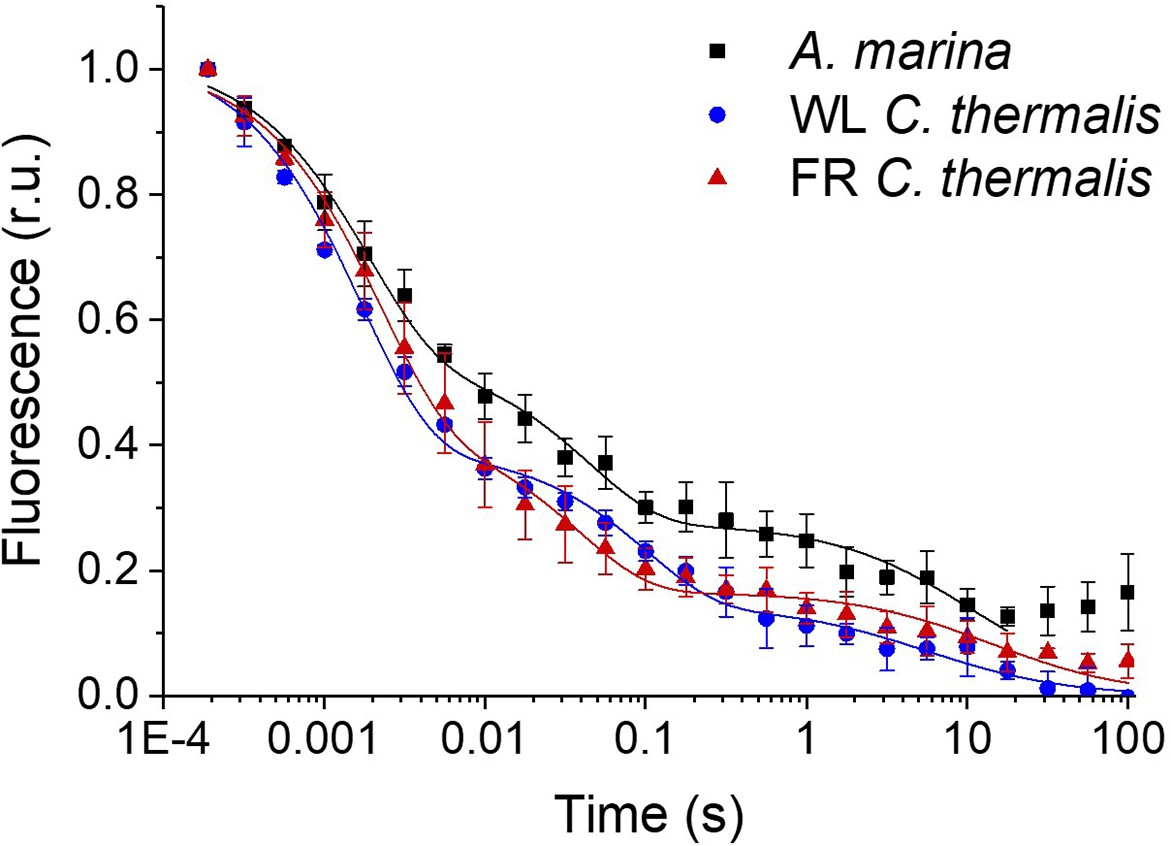
Fluorescence decay kinetics after a short saturating light pulse in isolated membranes of A. marina, WL C. thermalis and FR C. thermalis.
These are the same traces as in Figure 2A but here including all points up to 100 s. The datapoints represent the averages of three biological replicates,±s.d., while the lines represent the fits of the experimental data. All traces are normalized on the initial variable fluorescence (Fm-F0, with Fm measured 190 μs after the saturating flash). Note that the fluorescence rise observed at the end of the A. marina decay is present in only one of the three replicates used to do the averages (see Figure 2—source data 1) and is considered to be a measurement artefact.
Figure 3 with 1 supplement
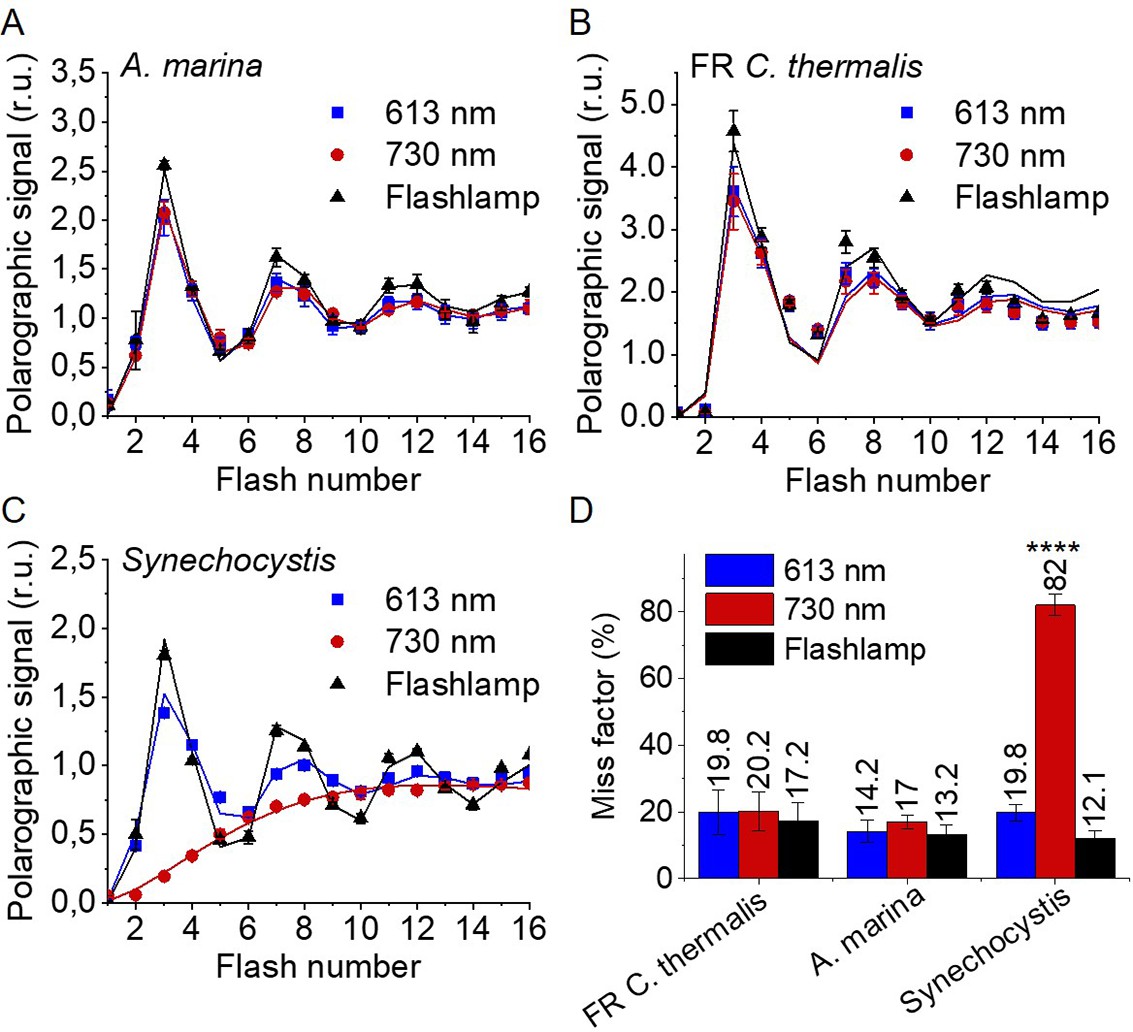
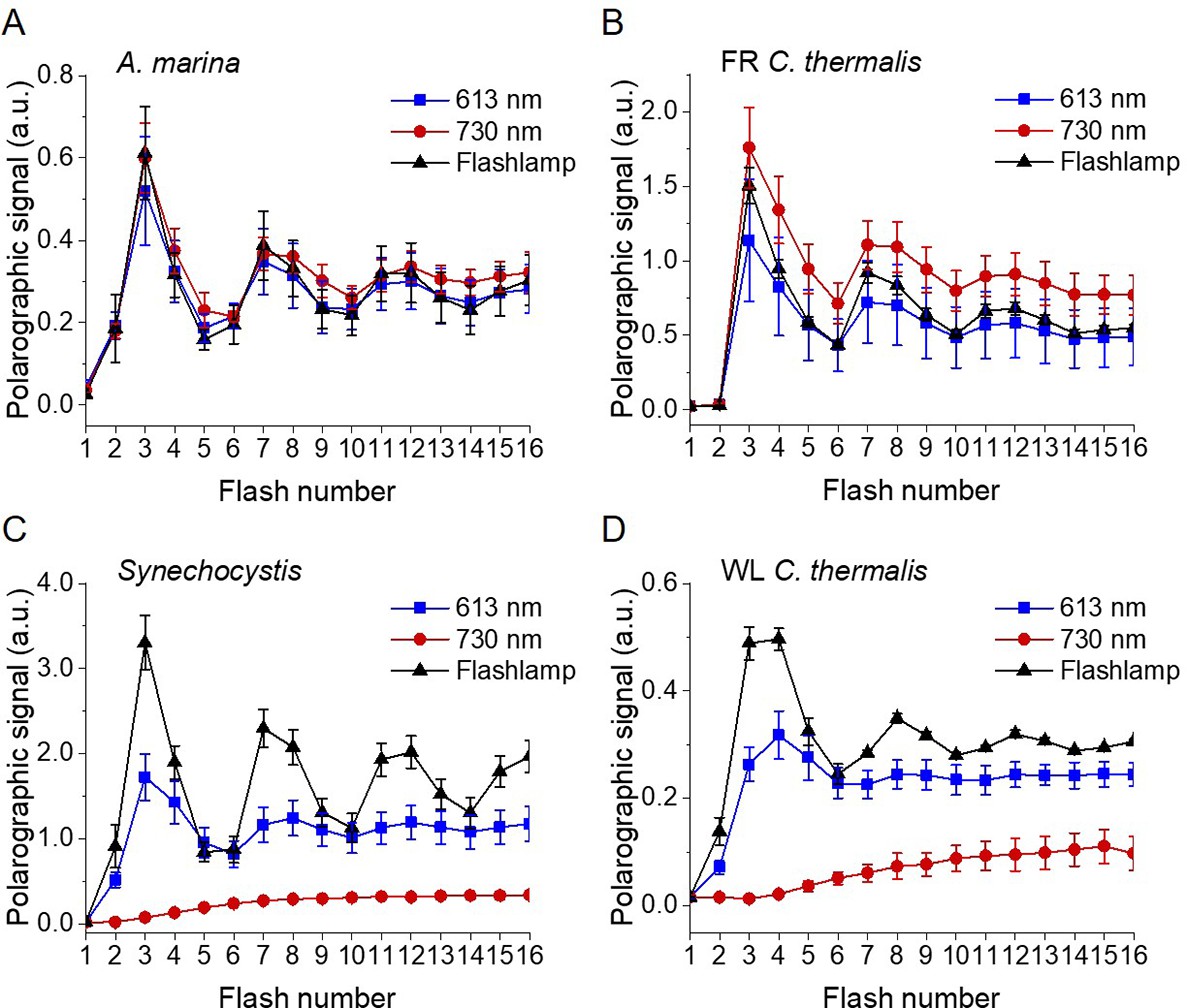
Flash-induced release of O2 measured by polarography.
(A–C) Patterns of oxygen release in A. marina, FR C. thermalis and Synechocystis membranes. Flashes were given at 900 ms intervals and the O2 produced after each flash was measured. Flashes were provided by a white xenon flash lamp, a red LED centered at 613 nm, and a far-red LED centered at 730 nm. The data represent the averages of 3 biological replicates ±s.d. The lines represent the fits of the experimental data. The data were normalized to the O2 yield of the last of the 40 flashes sequence. The non-normalized data are shown in Figure 3—figure supplement 1. Normalized and non-normalized data are provided in Figure 3—source data 1. (D) Miss factors (in %) calculated from the data shown in (A–C). The miss factor in Synechocystis membranes flashed at 730 nm is significantly higher than in A. marina and FR C. thermalis membranes according to Student’s t-test, as indicated with asterisks (****p≤0.0001).
-
Figure 3—source data 1
Flash-dependent oxygen evolution.
- https://cdn.elifesciences.org/articles/79890/elife-79890-fig3-data1-v2.xlsx
Figure 3—figure supplement 1
Flash-induced release of O2 measured by polarography.
(A–D) Patterns of oxygen release in A. marina, FR C. thermalis, Synechocystis, and WL C. thermalis membranes, with 10 µg of chlorophyll used for each sample. Flashes were given at 900 ms intervals and the O2 produced after each flash was measured. Flashes were provided by a white xenon flash lamp (pulse length of 10 µs, 540 µJ), a red LED centered at 613 nm (pulse length of 40 µs, 270 µJ), and a far-red LED centered at 730 nm (pulse length of 40 µs, 270 µJ). The data represent the averages of 3 biological replicates ±s.d. The lines represent the fits of the experimental data. The data in panels A, B, and C are the same as the normalized ones represented in Figure 3.
Figure 4
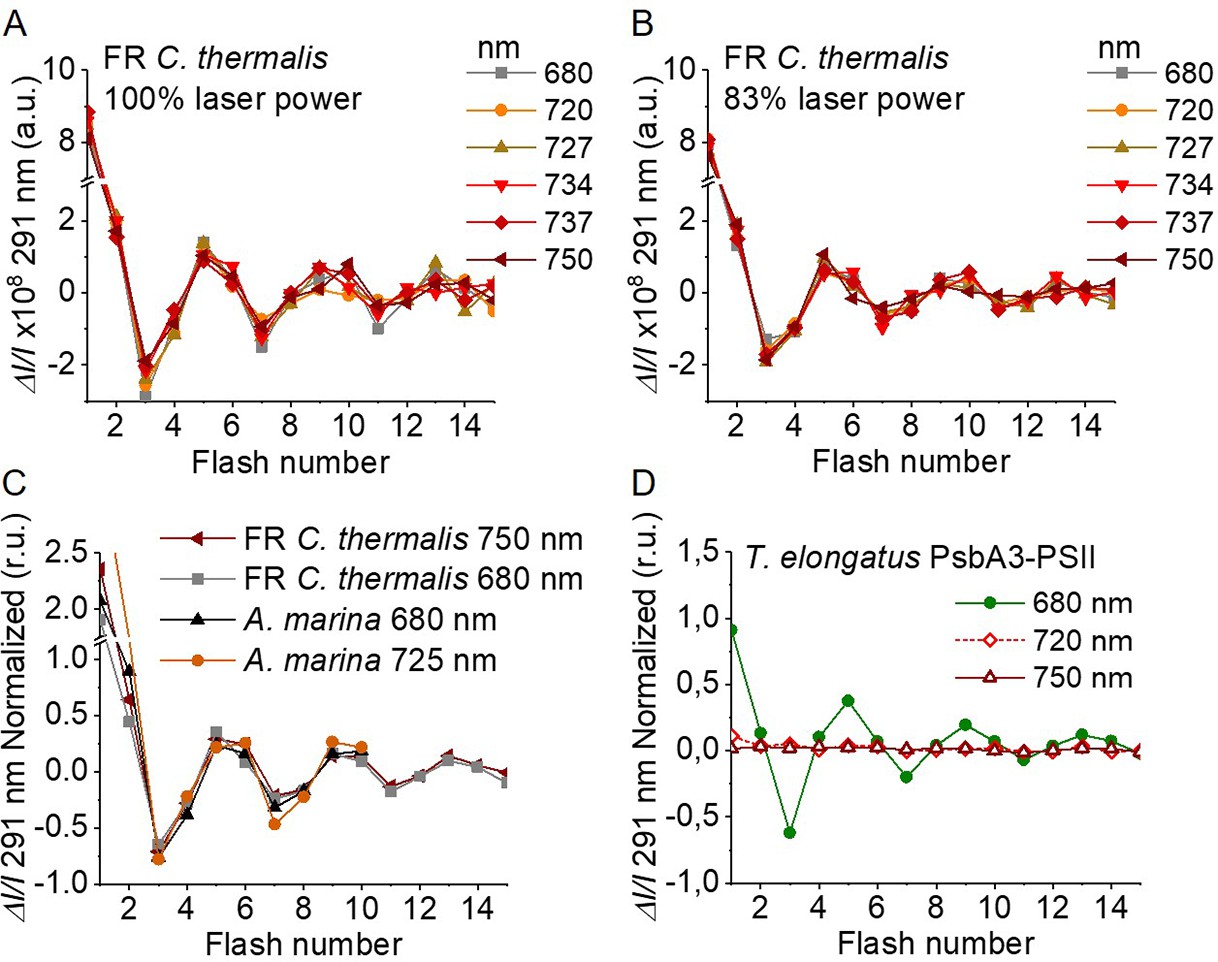
Flash-induced S-state turnover in FR C. thermalis PSII cores, A. marina membranes, and T. elongatus PsbA3-PSII cores.
Absorption changes were measured at 291 nm at 100 ms after each of a series of single-turnover saturating flashes fired with a 300 ms time interval. (A) and (B) Measurements in FR C. thermalis PSII cores using flashes at the indicated wavelengths with 100% and 83% laser power (the power of the laser at the different wavelengths is reported in Appendix 7). (C) Comparison between the absorption changes obtained in FR C. thermalis PSII cores and A. marina membranes using flashes at the indicated wavelengths (100% laser power). The traces in (C) were normalized on the maximal oscillation amplitude (3rd minus 5th flash). The breaks in the vertical axes in panels (A–C) allow the oscillation pattern to be re-scaled for clarity, because the absorption change on the first flash contains a large non-oscillating component (Lavergne, 1991) that was not included in the fits. (D) Measurements in isolated T. elongatus PsbA3-PSII cores using flashes at the indicated wavelengths. All data are provided in Figure 4—source data 1.
-
Figure 4—source data 1
Flash-dependent UV absorption.
- https://cdn.elifesciences.org/articles/79890/elife-79890-fig4-data1-v2.xlsx
Figure 5 with 2 supplements

Thermoluminescence and luminescence measured in A. marina, WL C. thermalis and FR C. thermalis membranes.
(A) and (B) TL measured in the absence of inhibitors (S2QB-) or in the presence of DCMU (S2QA-), respectively. The signal intensities are normalized on the content of O2-evolving PSII of each sample, measured as the maximal oxygen evolution rates under saturating illumination. The dashed vertical lines indicate the two peak positions of the C. thermalis samples. (C) Plots of the total S2QA- luminescence emission (integrated area below the curves), normalized on the maximal oxygen evolution rate of each sample, at 10, 20, and 30°C. (D) Plots of the average S2QA- luminescence decay lifetimes (τav), calculated from the decay phases attributed to S2QA- recombination, as a function of temperature. In (C) and (D) each point represents the average of 3 biological replicates ±s.d. Statistically significant differences according to Student’s t-tests are indicated with asterisks (*p≤0.05, **p≤0.01, ***p≤0.001, ****p≤0.0001).
Figure 5—figure supplement 1
Thermoluminescence in A. marina, WL C. thermalis and FR C. thermalis membranes.
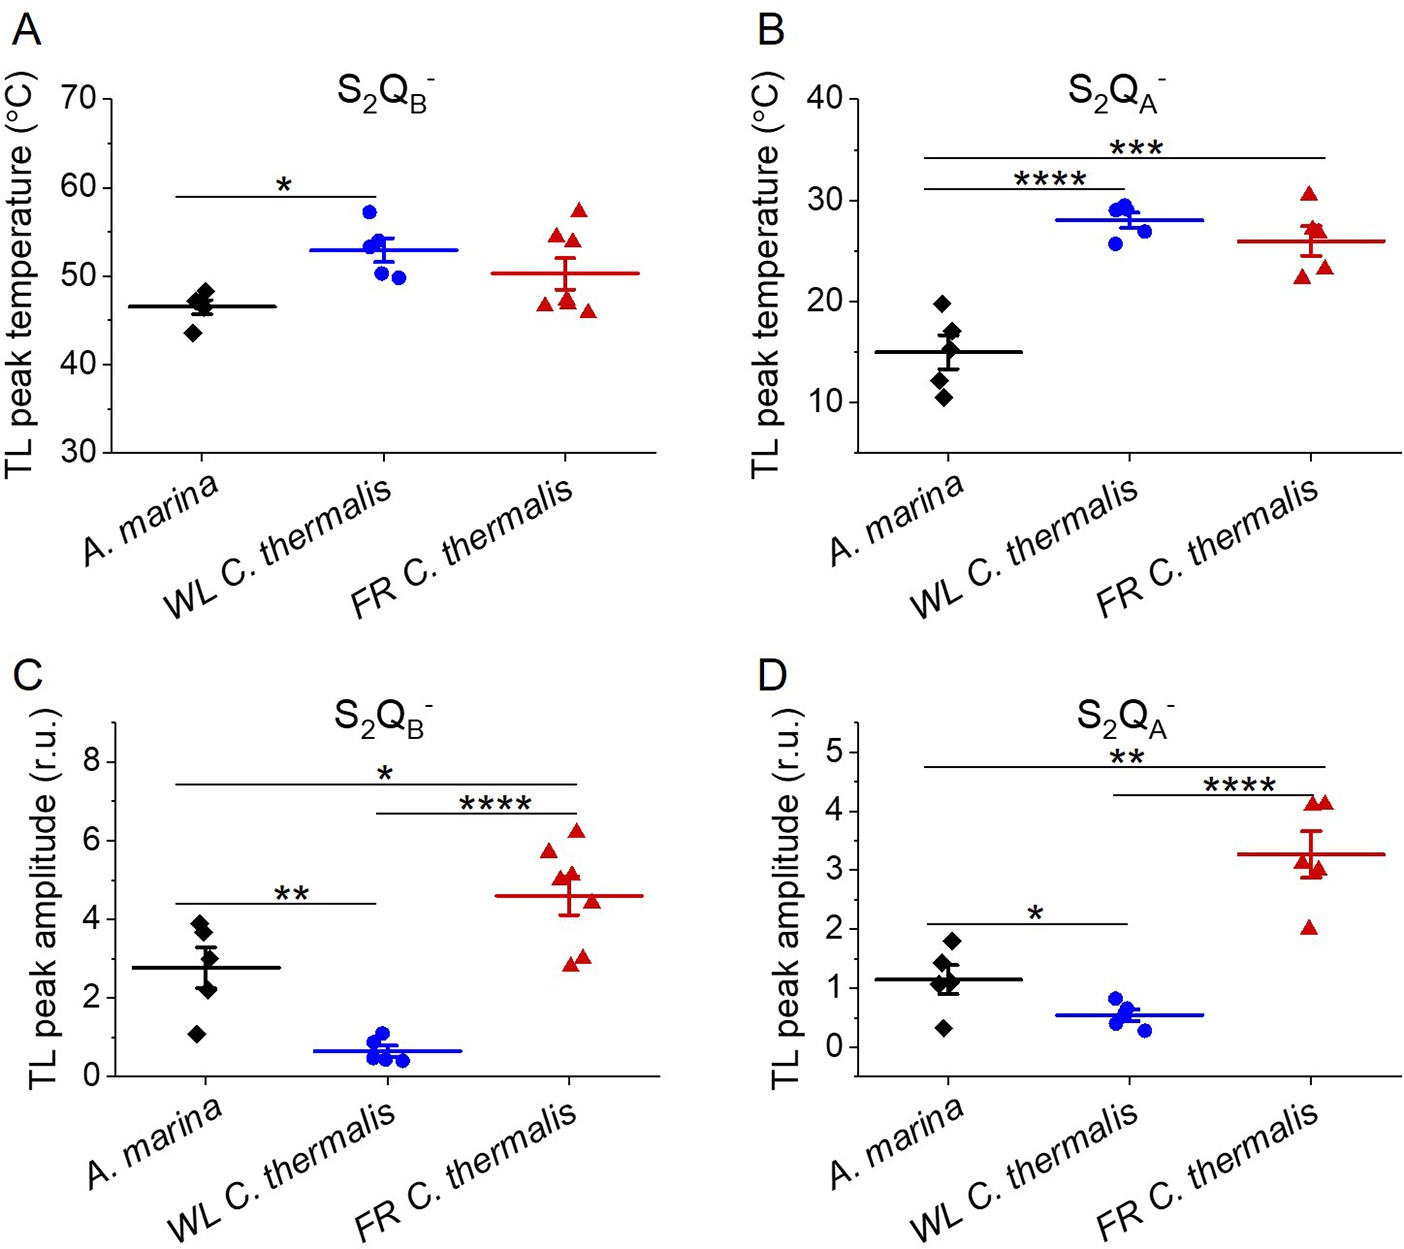
Plots of the temperatures (A and B) and of the normalized amplitudes (C and D) of the thermoluminescence peaks deriving from S2QB- and from S2QA- back-reaction, including the examples shown in Figure 5A and B. In C and D, the TL peak amplitudes are normalized on the content of O2-evolving PSII of each sample, measured as the maximal oxygen evolution rates under saturating illumination. Each point represents an independent biological replicate, the horizontal lines represent the mean values ± standard error (for S2QB-: A. marina n=5, WL C. thermalis n=5, FR C. thermalis n=7; for S2QA-: A. marina n=5, WL C. thermalis n=5, FR C. thermalis n=5). All curves are provided in Figure 5—figure supplement 1—source data 1. Statistically significant differences according to Student’s t-tests are indicated with asterisks (*p≤0.05, **p≤0.01, ***p≤0.001, ****p≤0.0001).
-
Figure 5—figure supplement 1—source data 1
Thermoluminescence curves.
- https://cdn.elifesciences.org/articles/79890/elife-79890-fig5-figsupp1-data1-v2.xlsx
Figure 5—figure supplement 2
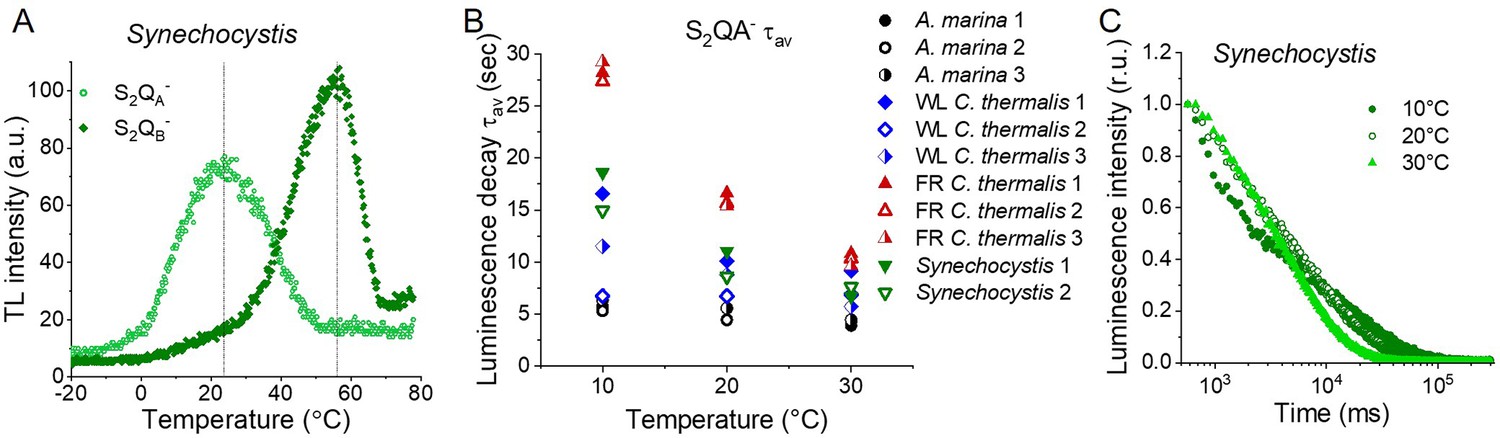
Thermoluminescence and luminescence in Synechocystis membranes.
(A) Thermoluminescence measured in the absence of inhibitors (S2QB-) or in the presence of DCMU (S2QA-) in Synechocystis membranes. The dashed vertical lines indicate the two peak positions. (B) Plots of the average S2QA- luminescence decay lifetimes (τav) in A. marina, WL C. thermalis, FR C. thermalis and Synechocystis membranes. Each series of data corresponds to an independent biological replicate. The A. marina, WL C. thermalis and FR C. thermalis datasets are those used to calculate the average decay values plotted in Figure 5D. (C) Representative S2QA- luminescence decay curves measured in Synechocystis membranes at 10, 20, and 30°C, after normalization on the initial intensities. The luminescence decays were measured for 300 s after the flash and plotted on a logarithmic scale. All Synechocystis curves are provided in Figure 5—figure supplement 2—source data 1.
-
Figure 5—figure supplement 2—source data 1
Synechocystis (thermo)luminescence curves.
- https://cdn.elifesciences.org/articles/79890/elife-79890-fig5-figsupp2-data1-v2.xlsx
Figure 6 with 1 supplement

1O2 production and PSII sensitivity to high light in A. marina, WL C. thermalis and FR C. thermalis membranes.
All samples were used at a chlorophyll concentration of 5 µg ml–1. (A) 1O2 production in presence of DCMU measured as the rate of histidine-dependent consumption of O2 induced by saturating illumination (xenon lamp, 7100 µmol photons m–2 s–1, saturation curves in Appendix 6). The data are averages (± s.d.) of six biological replicates for A. marina and FR C. thermalis and three replicates for WL C. thermalis for the DCMU +His samples, and of four biological replicates for FR C. thermalis and three replicates for A. marina and WL C. thermalis for the DCMU samples. For each replicate, the rates of oxygen consumption were normalized to the maximal oxygen evolution rates measured in presence of DCBQ and ferricyanide. The non-normalized rates of each replicate are provided in Appendix 6. All traces are provided in Figure 6—source data 1. (B) Maximal PSII activities, measured as in (A), after 30 min illumination with saturating red light (660 nm LED, 2600 µmol photons m–2 s–1) relative to the maximal activities measured in control samples kept in darkness (provided in Figure 6—source data 2). The light used for the 30 min treatment was as saturating as the xenon lamp used in (A) (see Appendix 6). The data are averages of three biological replicates ±s.d. Statistically significant differences according to Student’s t-tests are indicated with asterisks (*p≤0.05, **p≤0.01, ***p≤0.001).
-
Figure 6—source data 1
Singlet oxygen production membranes.
- https://cdn.elifesciences.org/articles/79890/elife-79890-fig6-data1-v2.xlsx
-
Figure 6—source data 2
Photoinhibition membranes.
- https://cdn.elifesciences.org/articles/79890/elife-79890-fig6-data2-v2.xlsx
Figure 6—figure supplement 1
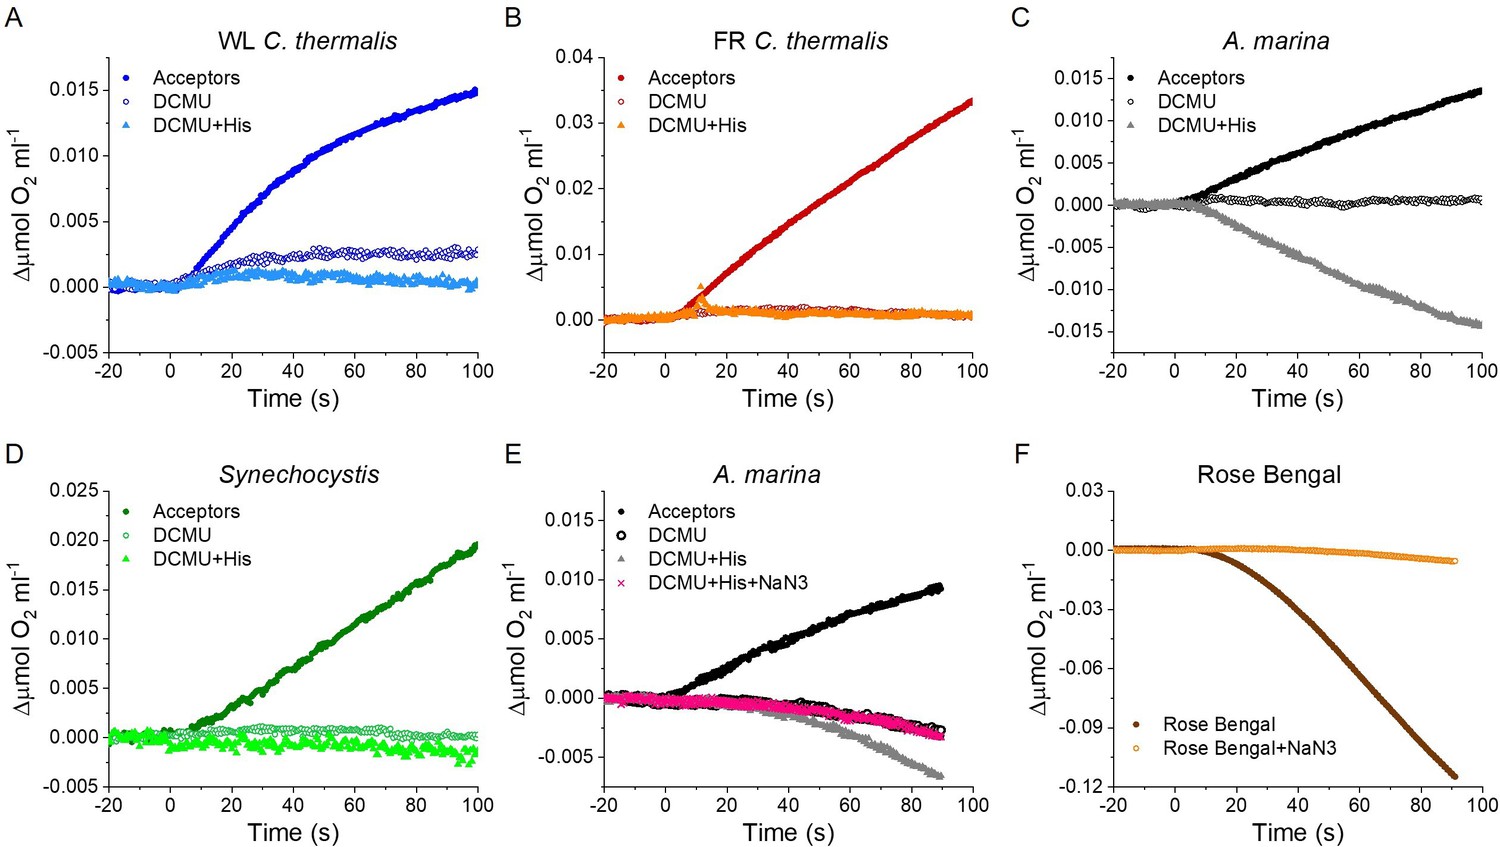
Singlet oxygen production in A. marina, WL C. thermalis, FR C. thermalis and Synechocystis membranes.
All samples were used at a chlorophyll concentration of 5 µg ml–1. (A, B, C and D) Representative O2 electrode traces monitoring O2 evolution and uptake. 1O2 production in presence of DCMU was measured as the rate of histidine-dependent consumption of O2 induced by saturating illumination (xenon lamp, 7100 µmol photons m–2 s–1). Measurements were performed in in presence of DCBQ and ferricyanide (Acceptors), or in presence of DCMU, with or without the addition of histidine (His). Synechocystis traces are provided in Figure 6—figure supplement 1—source data 1. (E and F) 1O2 production in a different A. marina membrane preparation and when using Rose Bengal to generate 1O2, respectively, showing the effect of sodium azide (NaN3) (traces in Figure 6—figure supplement 1—source data 1). Sodium azide is a 1O2 quencher that regenerates O2 in competition with 1O2 scavenging by histidine. All traces are shown after subtraction of the dark baseline.
-
Figure 6—figure supplement 1—source data 1
Singlet oxygen Synechocystis, A. marina sodium azide, Rose Bengal.
- https://cdn.elifesciences.org/articles/79890/elife-79890-fig6-figsupp1-data1-v2.xlsx
Figure 7
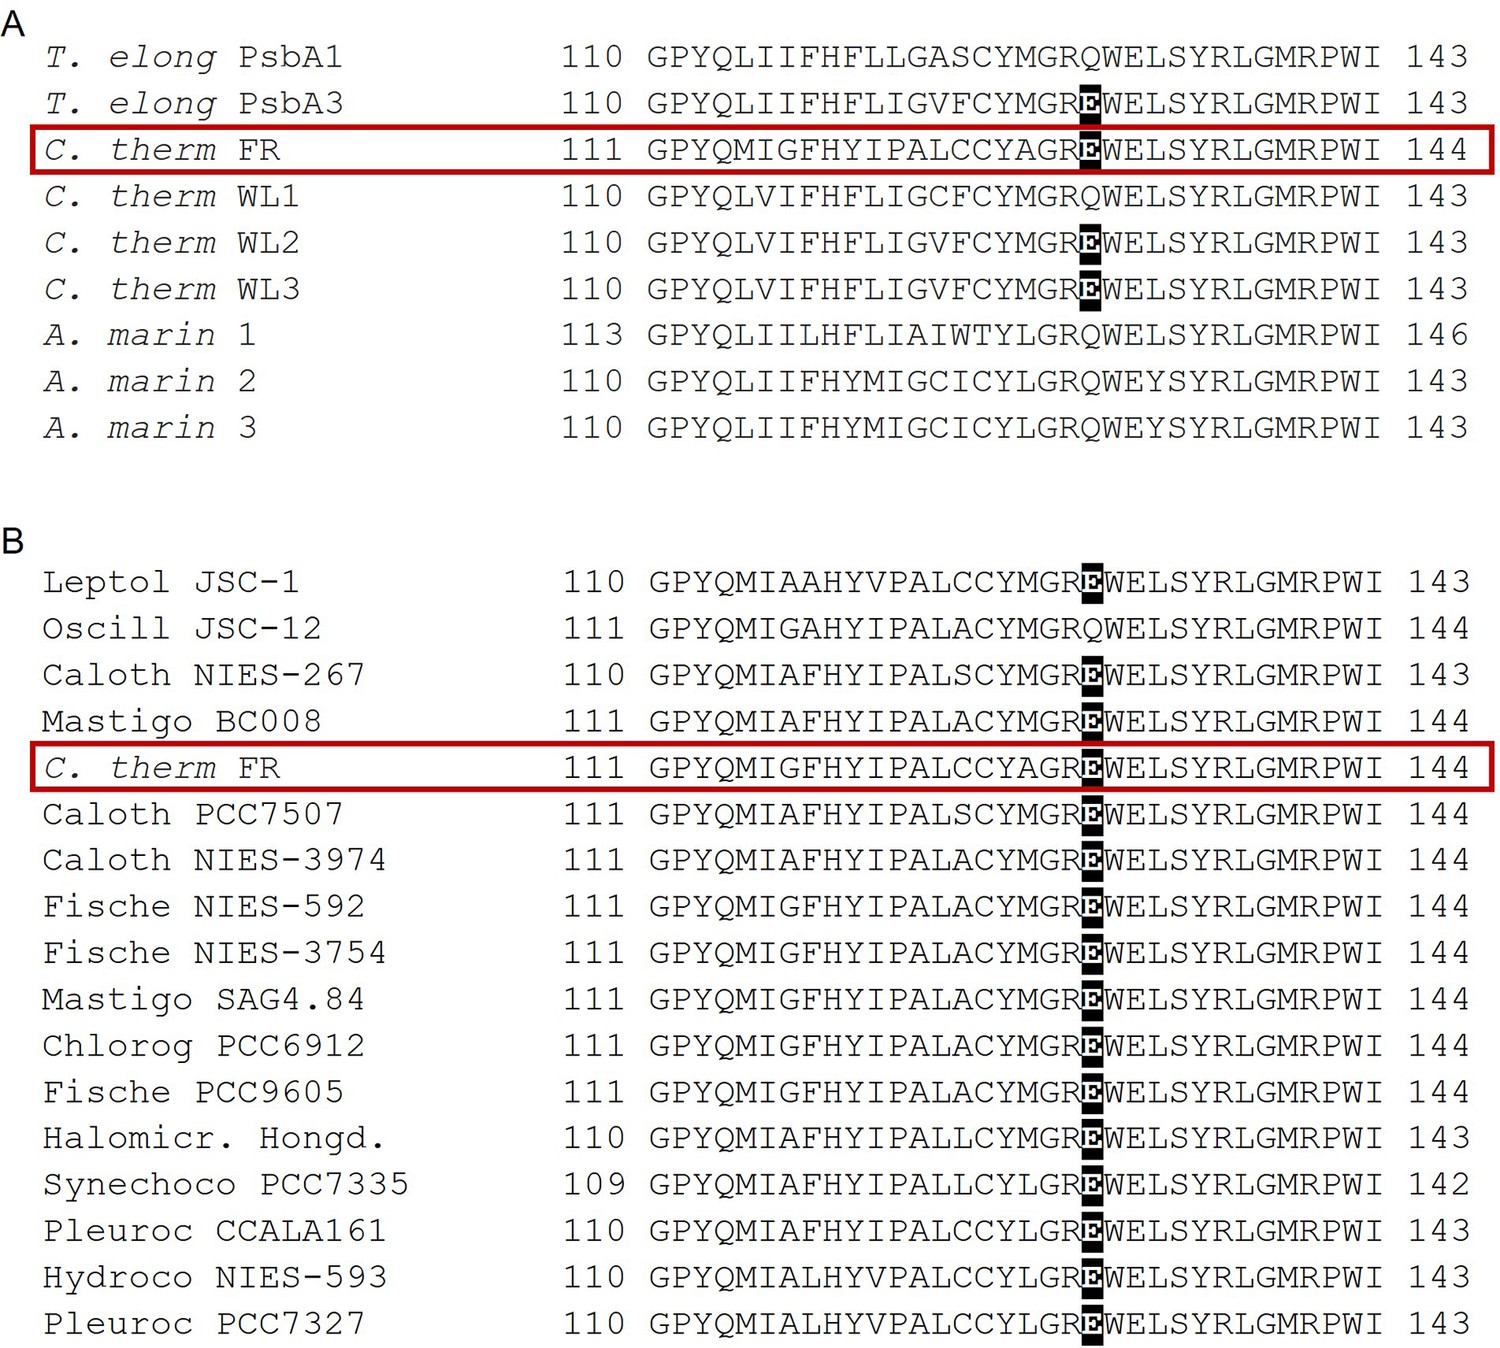
Occurrence of the high light-associated D1-Q130E substitution in the different types of PSII.
(A) Multi-alignment of the D1 proteins of T. elongatus, C. thermalis and A. marina. The Q130E substitution is present also in the far-red light-induced D1 isoform of C. thermalis (C. therm FR) and in two out of three of its non-far-red induced D1 isoforms (C. therm WL2 and 3) but is not present in any of the three D1 isoforms of A. marina. (B) Multi-alignment of the far-red light induced D1 isoforms of C. thermalis and other Chl-f species. The presence of E130 is conserved in the far-red light induced D1 isoforms of most of the cyanobacteria species capable of far-red light photo-acclimation. Both alignments were done using Clustal Omega (Sievers et al., 2011), the sequences were retrieved from the KEGG (https://www.kegg.jp/) and NCBI (https://www.ncbi.nlm.nih.gov/) databases. For each alignment only a 33 amino acid region is shown, the start and end positions with respect to each full sequence are indicated with numbers. The Q130E substitution is highlighted as white font on black background. The far-red D1 sequence from C. thermalis is framed in red. All sequences used for the multi-alignments are provided in Figure 7—source data 1.
-
Figure 7—source data 1
D1 sequences used for multi-alignments.
- https://cdn.elifesciences.org/articles/79890/elife-79890-fig7-data1-v2.txt
Figure 8
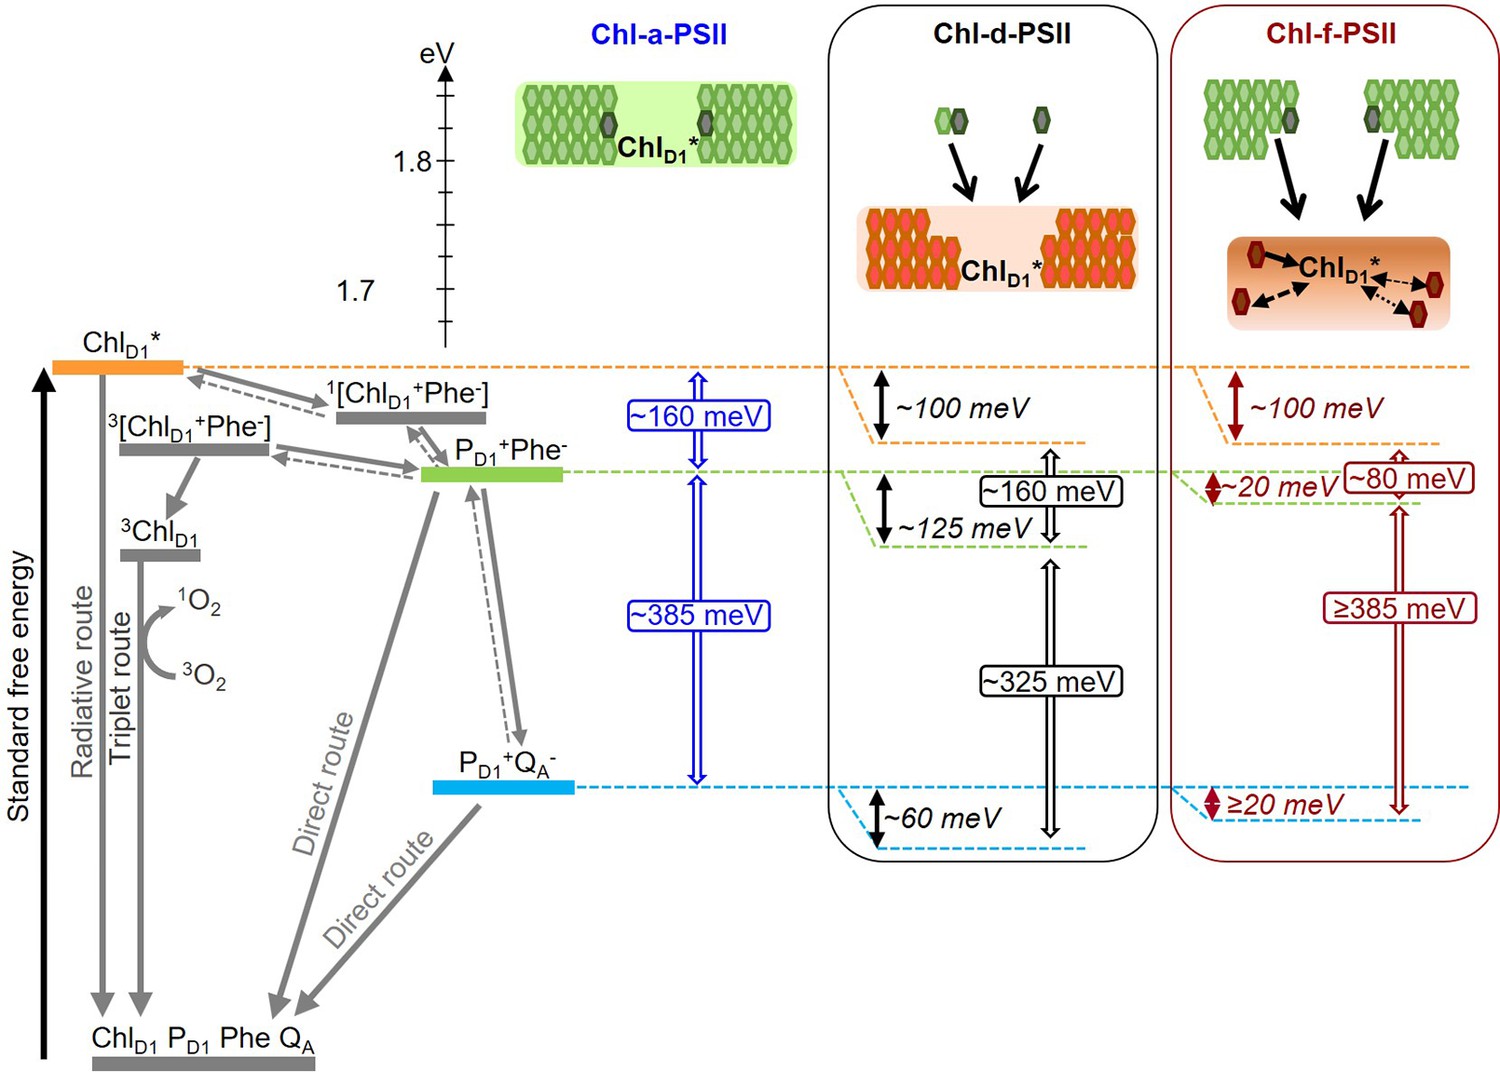
Model of the energy differences in Chl-a-PSII, Chl-d-PSII and Chl-f-PSII.
The top part of the figure represents the localization of the excitation energy over the antenna pigments and ChlD1* (energies in eV, scale on the left side). The localization of the excitation energy is indicated by the coloured boxes (green for Chl-a, orange for Chl-d and brown for Chl-f), without necessarily assuming a full equilibration (see main text). In Chl-a-PSII, the excitation is distributed over ChlD1, 34 antenna Chl-a (light green) and 2 pheophytin a (Phe-a, dark grey); in Chl-d-PSII, the excitation is distributed over ChlD1 and 31 antenna Chl-d (orange) but not over the 1 Chl-a and 2 Phe-a, that transfer excitation downhill to the Chl-d pigments (black arrows); in Chl-f-PSII, the excitation is distributed only over ChlD1 and 4 antenna Chl-f (brown), while the remaining 29 Chl-a and 2 Phe-a transfer excitation energy downhill to the far-red pigments. In Chl-f-PSII, 3 of the far-red antenna pigments are at longer wavelength than ChlD1, so transfer of excitation energy from them to ChlD1 is less efficient (dashed and dotted black arrows, representing the possible heterogeneity in excitation energy transfer kinetics). The grading of the coloured box for Chl-f represents uncertainty in the degree of excited state sharing between the longest wavelength chlorophylls and ChlD1. The bottom part of the figure represents, on the left, the energetics of the radical pairs and the recombination routes in PSII (direct route: via electron tunnelling; triplet route: via the formation of the triplet state of the primary electron donor; radiative route: via luminescence emission), with the electron transfer steps between PD1 and the Mn-cluster omitted for clarity. The solid and dashed grey arrows represent exergonic and endergonic electron transfer, respectively. The horizontal dashed lines represent the standard free energies of ChlD1* (orange), PD1+Phe- (light green) and PD1+QA- (light blue). The PD1+Phe- radical pair, when formed from the backreaction of PD1+QA-, can be either in the singlet state or in the triplet state. 1[PD1+Phe-] recombines via 1[ChlD1+Phe-] and ChlD1*, while 3[PD1+Phe-] recombines via 3[ChlD1+Phe-] and 3ChlD1. The free energy gaps between ChlD1* and PD1+Phe- and between PD1+Phe- and PD1+QA- in Chl-a-PSII (blue) and our current estimates for Chl-d-PSII (black) and Chl-f-PSII (dark red) are represented on the right.
Appendix 1—figure 1
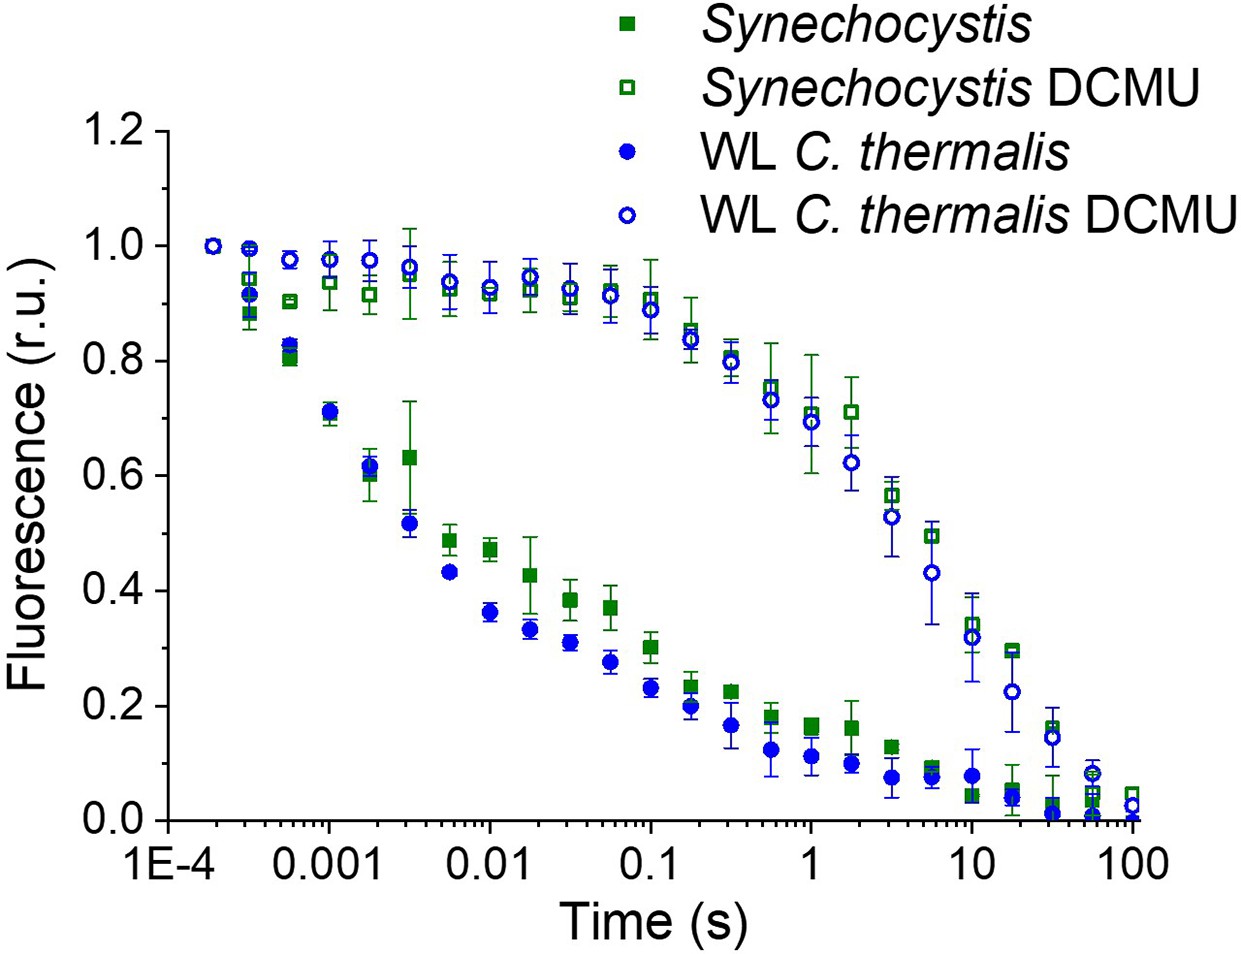
Fluorescence decay kinetics after a short saturating light pulse in isolated membranes of Synechocystis and WL C. thermalis in absence and presence of DCMU.
The WL C. thermalis data are the same as those in Figure 2 and Figure 2—figure supplement 1. The Synechocystis datapoints represent the averages of two biological replicates,±s.d. (provided in Appendix 1—figure 1—source data 1). All traces are normalized on the initial variable fluorescence (Fm-F0, with Fm measured 190 μs after the saturating flash).
-
Appendix 1—figure 1—source data 1
Fluorescence decay kinetics Synechocystis.
- https://cdn.elifesciences.org/articles/79890/elife-79890-app1-fig1-data1-v2.xlsx
Appendix 2—figure 1
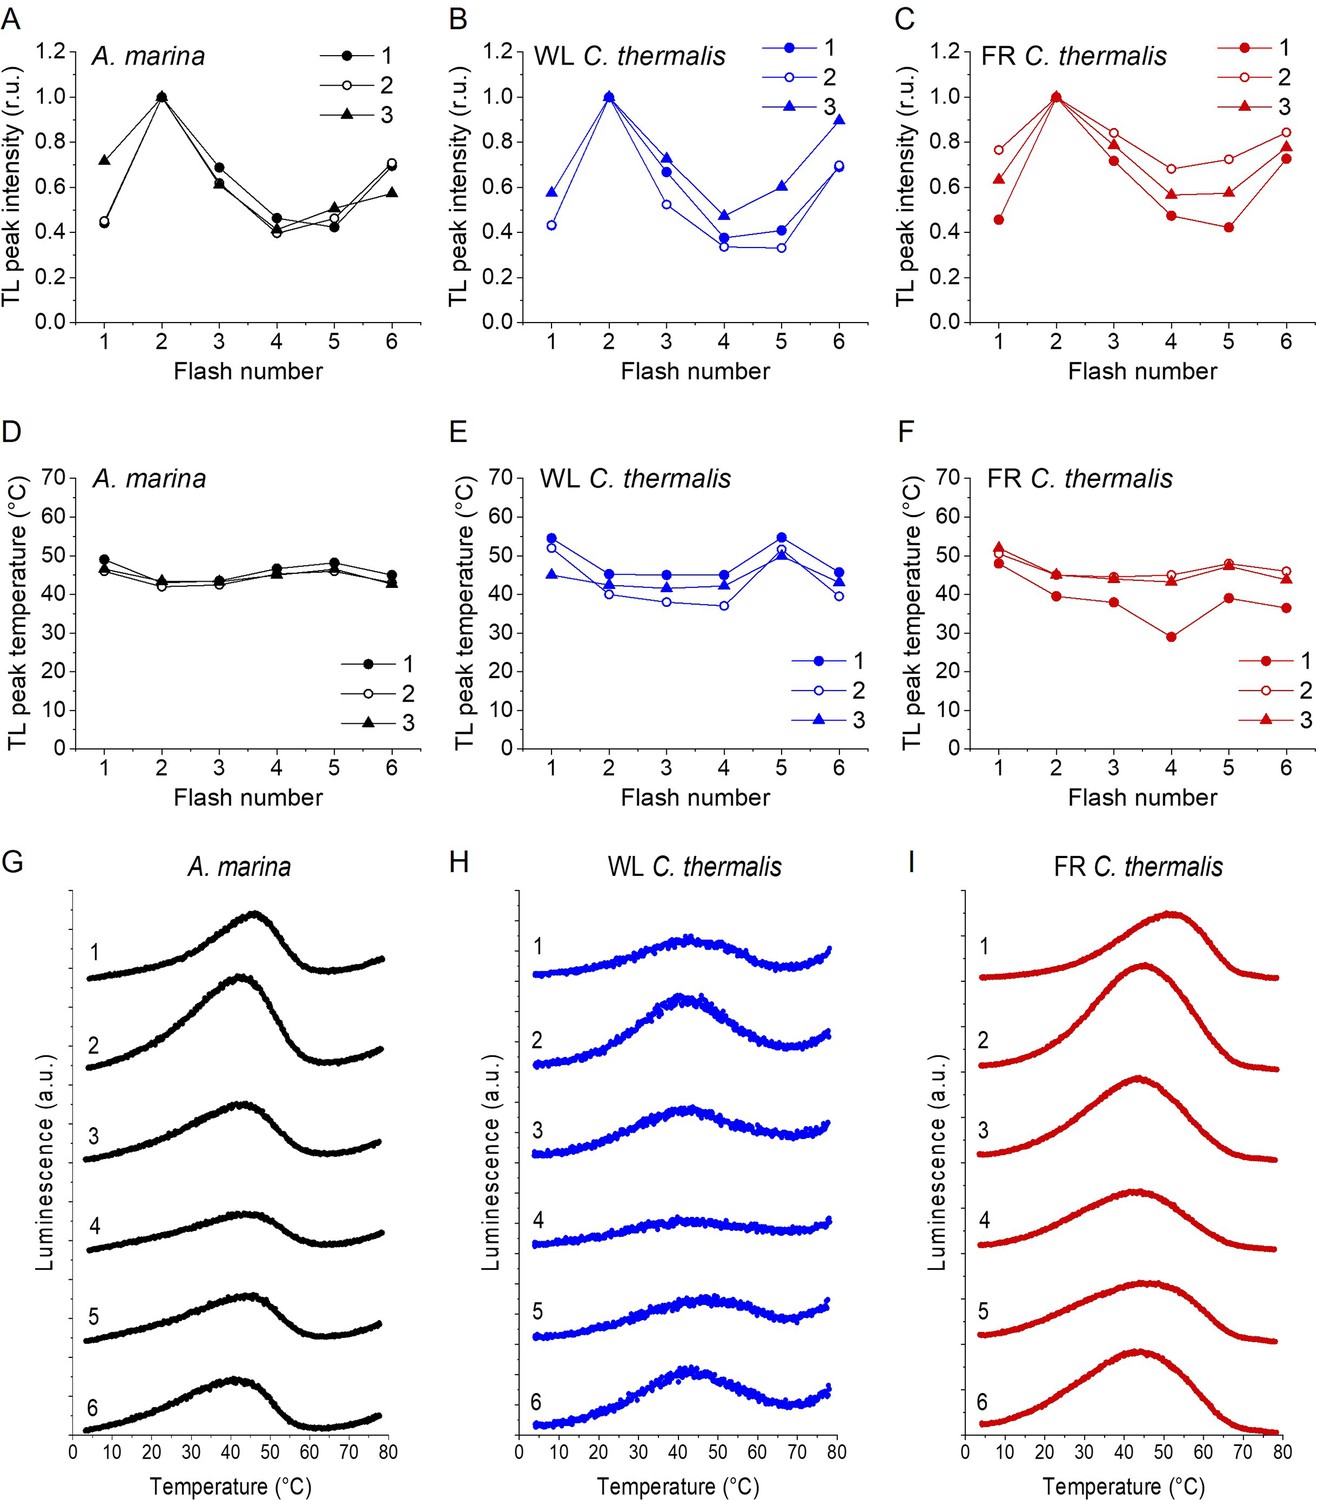
Plots of the flash-induced oscillations of the thermoluminescence peak amplitudes (A, B and C) and temperatures (D, E and F) measured in A. marina, WL C. thermalis and FR C. thermalis membranes.
The TL peak amplitudes and temperatures are plotted as a function of the number of flashes given before measuring the thermoluminescence glow curve. Peak amplitudes were normalized to the amplitude value measured after 2 flashes. The membranes, at a final concentration of 5 µg Chl ml–1, were pre-illuminated for ~10 s at room temperature and subsequently dark-adapted on ice for 1 h before the measurements. The flashes were fired at 4 °C at 1 s time intervals, and the samples were then heated from 4°C to 80°C at 1 °C s–1. Each series of data points corresponds to the TL amplitudes and temperatures measured in an independent biological replicate (numbered 1–3, traces in Appendix 2—figure 1—source data 1). (G, H and I) Representative thermoluminescence glow curves recorded after a train of flashes (from 1 to 6, as indicated by the number next to each curve) in one of the three membrane samples in panels A-F for each strain.
-
Appendix 2—figure 1—source data 1
Flash dependent thermoluminescence.
- https://cdn.elifesciences.org/articles/79890/elife-79890-app2-fig1-data1-v2.xlsx
Appendix 3—figure 1
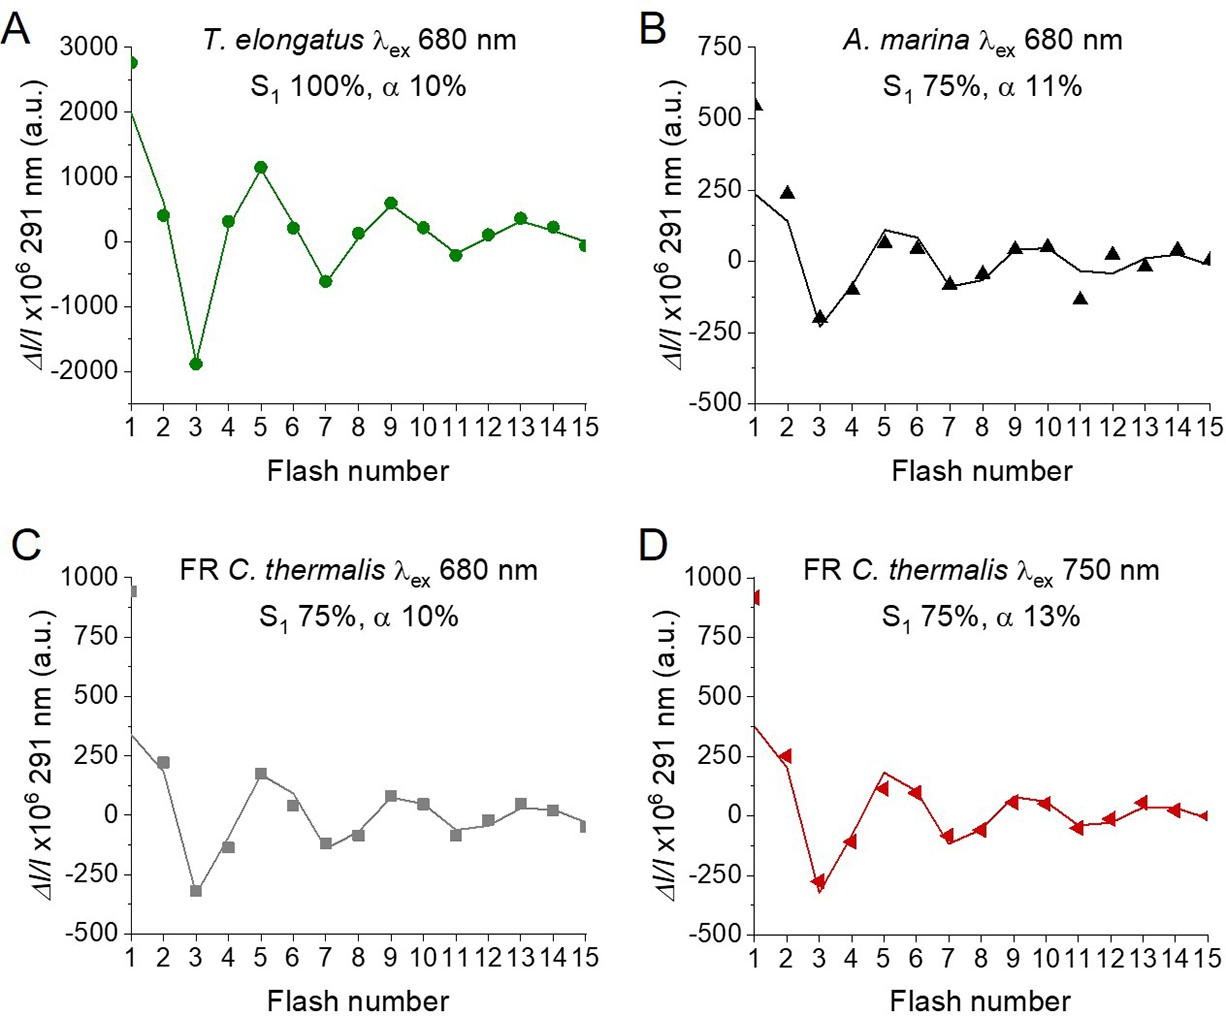
Fits of the flash-induced S-state turnover measured as absorption changes at 291 nm in T. elongatus PsbA3-PSII cores (A), A. marina membranes (B) and FR C. thermalis PSII cores (C) with laser excitation at 680 nm and in FR C. thermalis PSII cores with laser excitation at 750 nm (D).
Absorption changes were measured at 100ms after each of a series of saturating flashes fired with a 300 ms time interval. The data are the same as those reported in Figure 4, while the lines represent the fits of the experimental data. The initial fraction of PSII in S1 state and the miss factors are indicated (in %).
Appendix 5—figure 1
Luminescence decay kinetics.
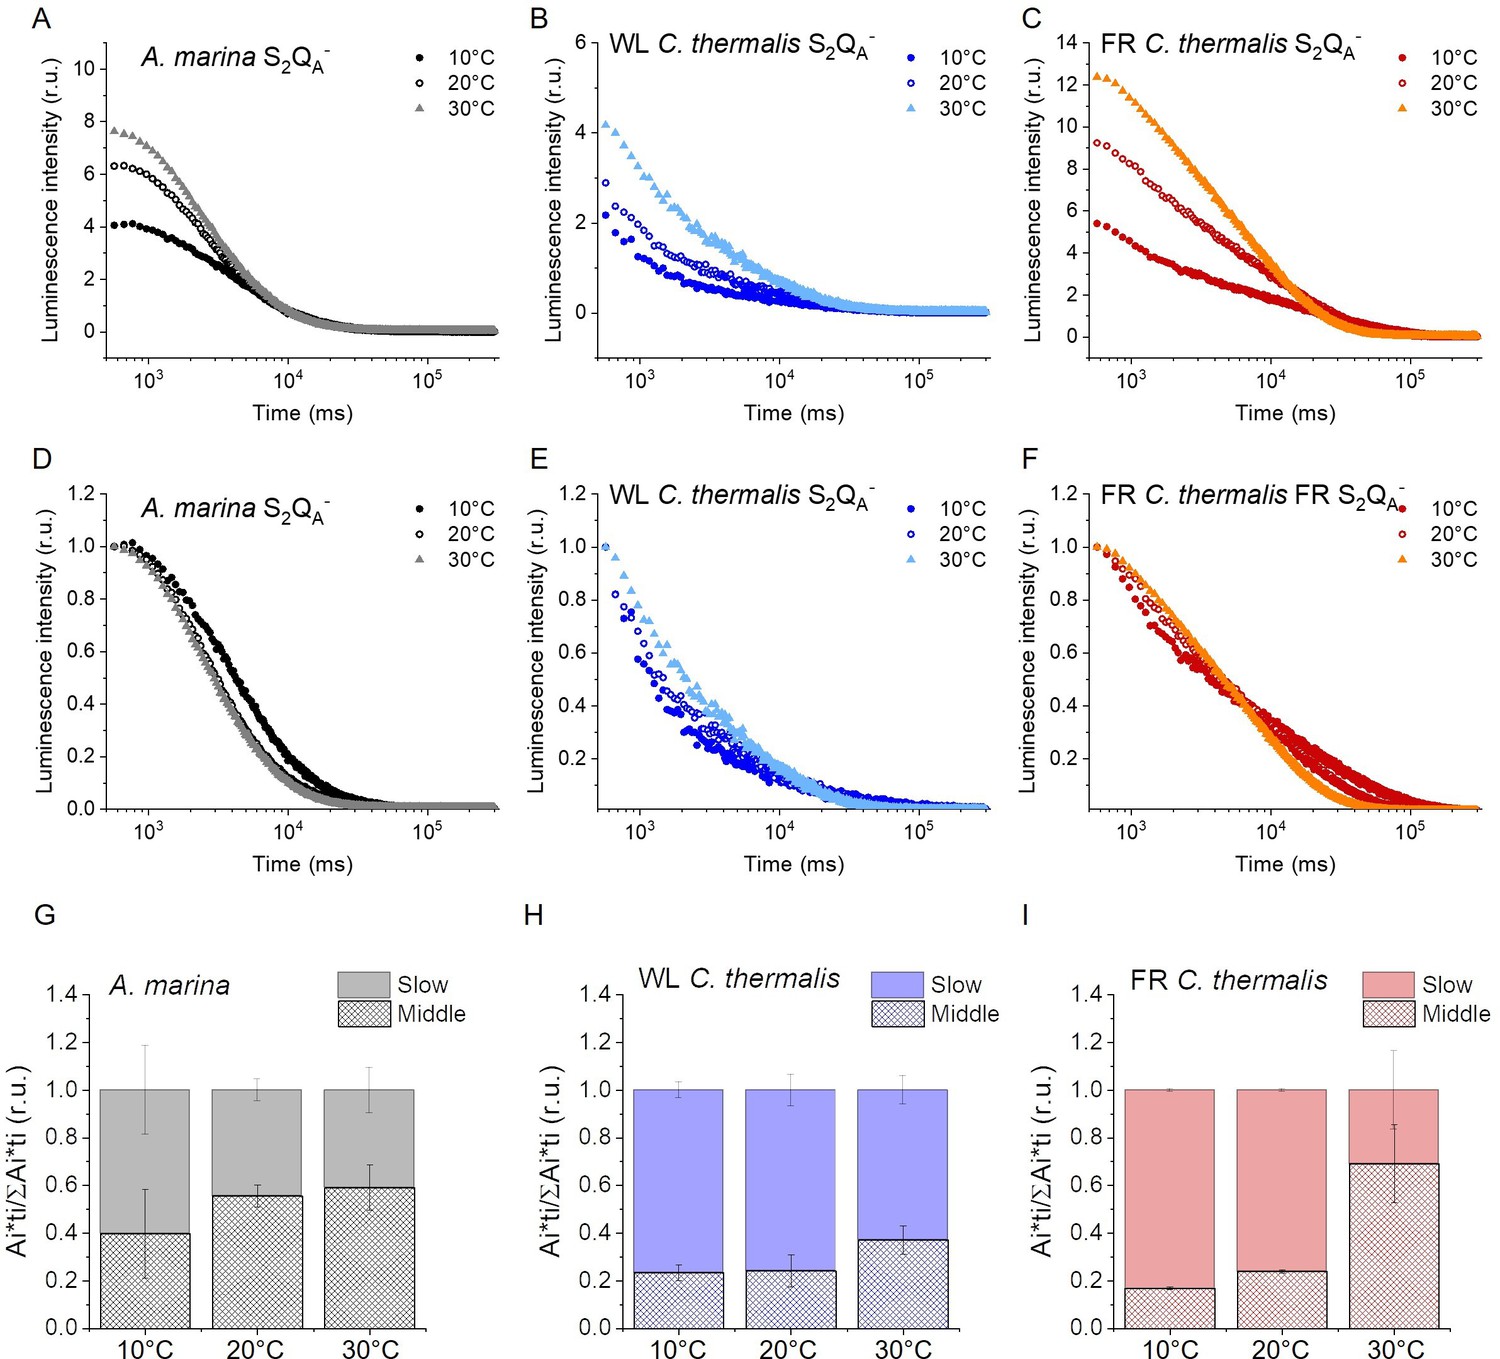
(A, B and C) Representative S2QA- luminescence decay curves measured in A. marina, WL C. thermalis and FR C. thermalis membranes in the presence of DCMU. The measurements were performed at 10, 20°C and 30°C. The luminescence decays were measured for 300 s after the flash, and the time is plotted on a logarithmic scale. The luminescence intensities are normalized on the content of O2-evolving PSII of each sample, measured as the maximal oxygen evolution rates under saturating illumination. (D, E and F) The same curves as in (A-C) after normalization on the initial intensities. (G, H and I) Relative contributions of the middle and slow decay components to the total luminescence emission arising from S2QA- recombination, calculated using the values in Appendix 5—table 1. All luminescence traces are provided in Appendix 5—figure 1—source data 1.
-
Appendix 5—figure 1—source data 1
Luminescence decay kinetics.
- https://cdn.elifesciences.org/articles/79890/elife-79890-app5-fig1-data1-v2.xlsx
Appendix 6—figure 1
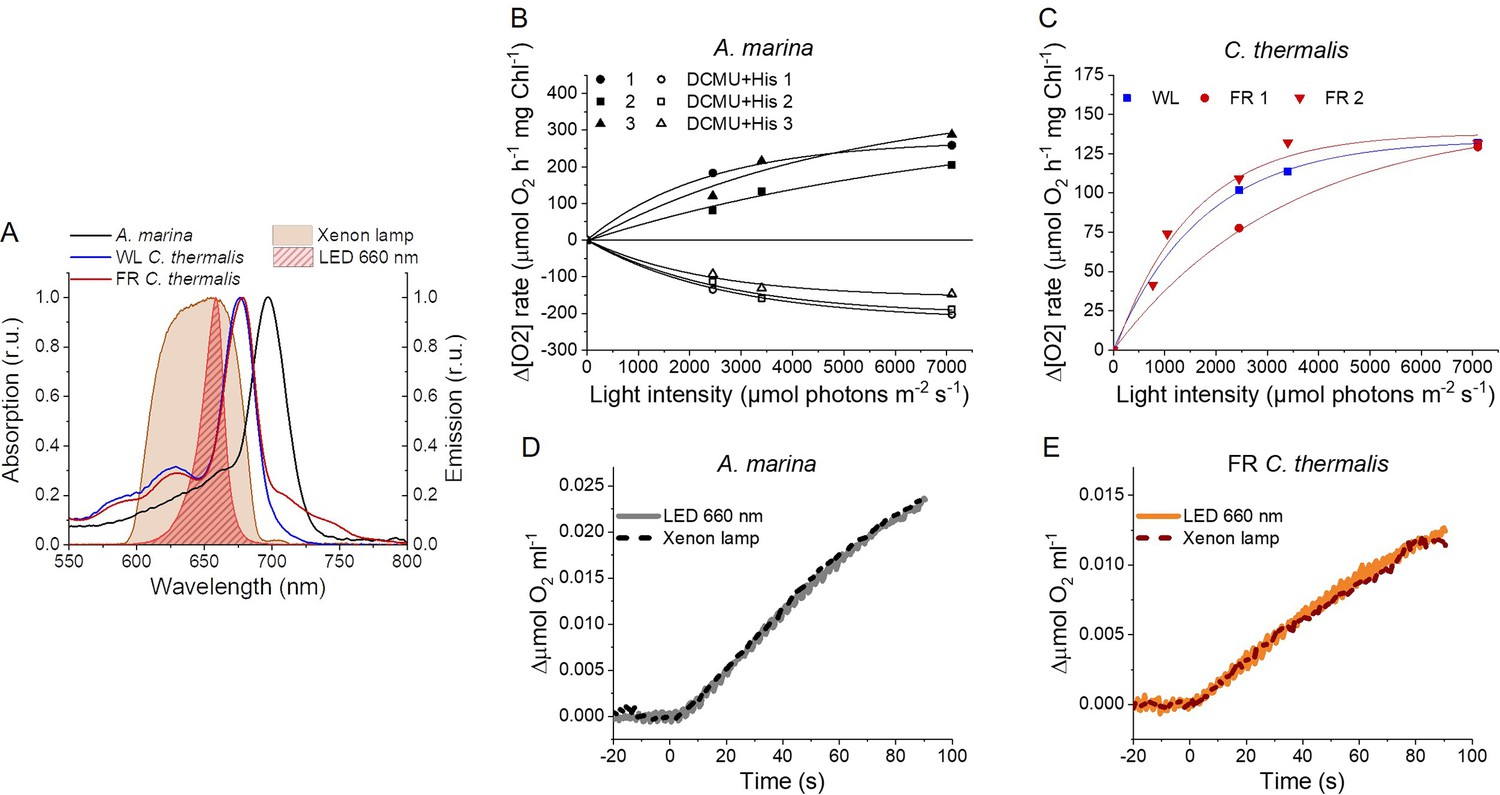
Light sources used for 1O2 production measurements and high light treatment.
(A) Absorption spectra (normalized on the maximal absorption in the Qy region) of A. marina, WL C. thermalis and FR C. thermalis membranes and spectral profiles (normalized on the maximal emission) of the 660 nm LED and xenon lamp used. (B) Light saturation curves of O2 evolution (in presence of DCBQ and ferricyanide, solid symbols) and 1O2 production (in the presence of DCMU and histidine, open symbols) in three biological replicates of A. marina membranes, using the xenon lamp. The intensity of the lamp was decreased by using neutral filters. (C) Light saturation curves of O2 evolution in WL C. thermalis (1 biological replicate) and FR C. thermalis (2 biological replicates) membranes, used at a final Chl concentration of 5 μg ml–1. (D and E) Representative O2 electrode traces (shown after subtraction of the dark baseline) monitoring maximal O2 evolution in A. marina and FR C. thermalis membranes, used at a final Chl concentration of 5 μg ml–1. Measurements were performed in presence of DCBQ and potassium ferricyanide using either the 660 nm LED (2600 µmol photons m-2 s–1) or the xenon lamp (7100 µmol photons m-2 s–1) for illumination. All data are provided in Appendix 6—figure 1—source data 1.
-
Appendix 6—figure 1—source data 1
Light sources and saturation curves.
- https://cdn.elifesciences.org/articles/79890/elife-79890-app6-fig1-data1-v2.xlsx
Appendix 6—figure 2
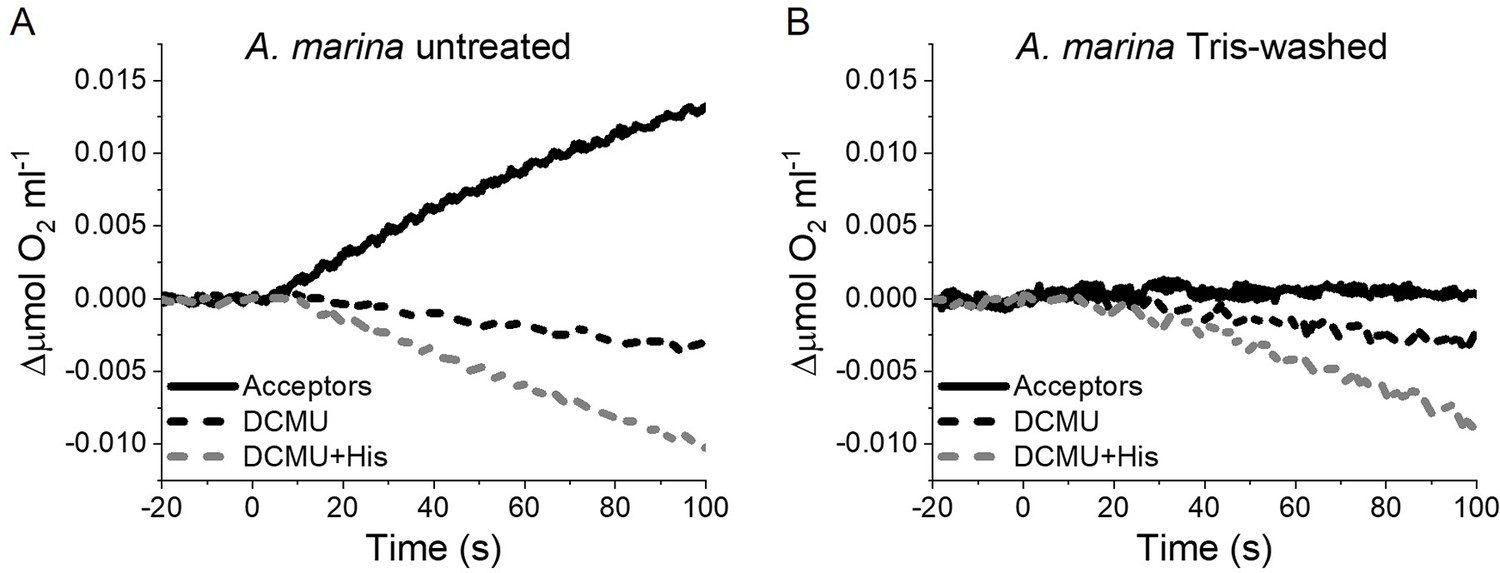
1O2 formation in presence of DCMU measured as the rate of histidine-dependent consumption of O2 induced by saturating illumination in untreated (A) and Tris-washed (B) A. marina membranes.
Measurements were performed in the presence of DCBQ and potassium ferricyanide (Acceptors) or in presence of DCMU, with or without the addition of L-Histidine (His). All traces are shown after subtraction of the dark baseline (traces in Appendix 6—figure 2—source data 1).
-
Appendix 6—figure 2—source data 1
Tris-washed A. marina singlet oxygen.
- https://cdn.elifesciences.org/articles/79890/elife-79890-app6-fig2-data1-v2.xlsx
Appendix 6—figure 3
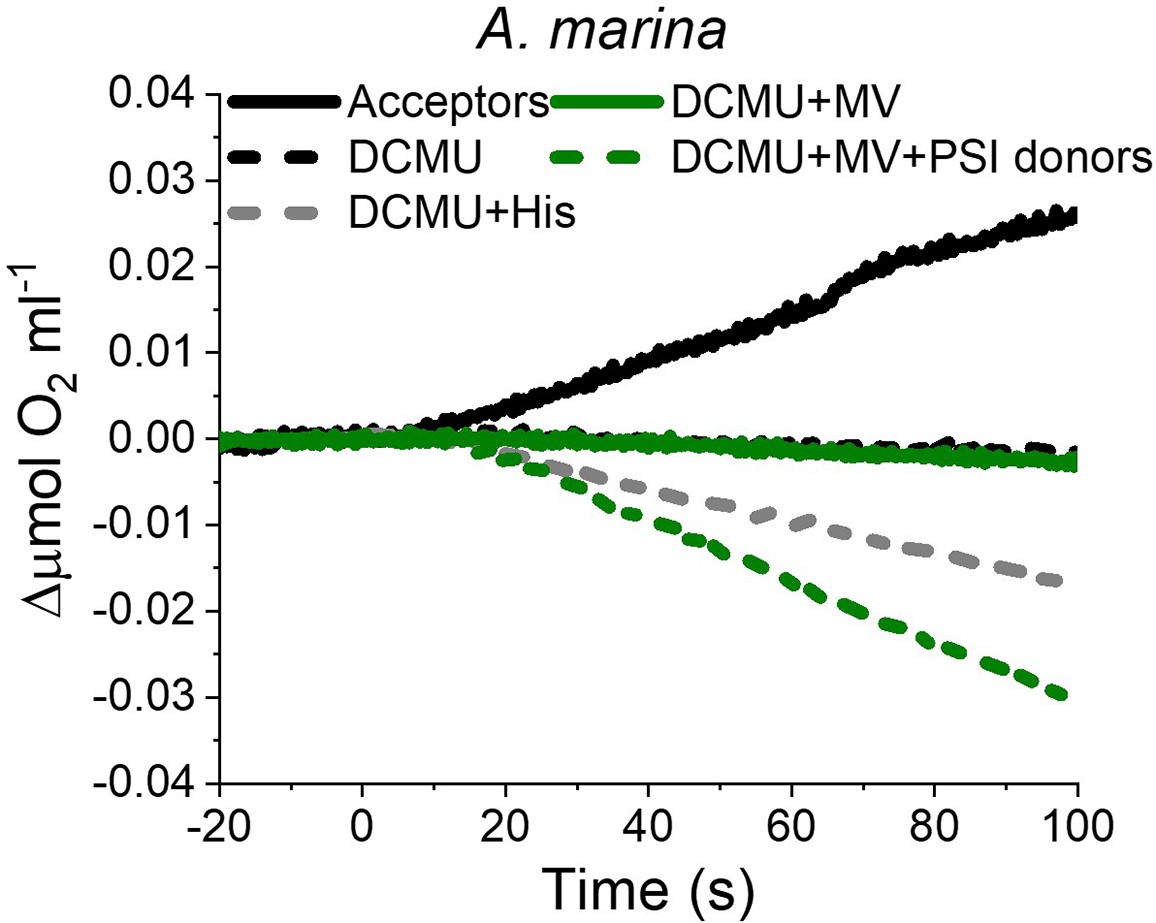
O2 electrode traces (shown after subtraction of the dark baseline) monitoring O2 evolution and uptake in A. marina membranes; 1O2 formation is monitored by O2-uptake due to 1O2 scavenging by histidine.
Measurements were performed in the presence of DCBQ and potassium ferricyanide (Acceptors) or in the presence of DCMU, with or without the addition of L-Histidine (His). PSI activity (green traces) was measured as the rate of methyl viologen (MV, 100 µM)-dependent oxygen consumption in the presence of DCMU, either with (dashed green line) or without (solid green line, ‘PSI donors’) the electron donors ascorbate (5 mM) and TMPD (50 µM). Traces are provided in Appendix 6—figure 3—source data 1.
-
Appendix 6—figure 3—source data 1
A. marina PSI activity.
- https://cdn.elifesciences.org/articles/79890/elife-79890-app6-fig3-data1-v2.xlsx
Appendix 6—figure 4
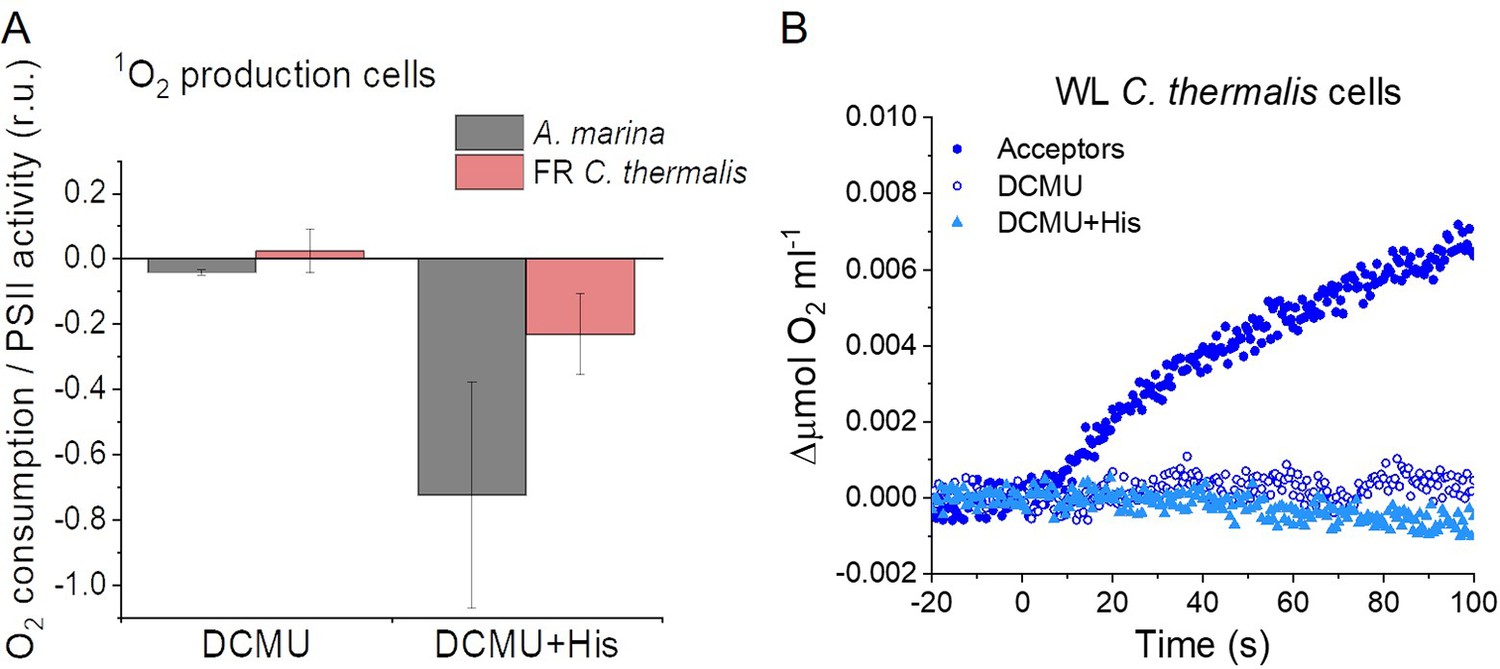
Singlet oxygen production in intact cells.
(A) 1O2formation in presence of DCMU measured as the rate of histidine-dependent consumption of O2 induced by saturating illumination in A. marina and FR C. thermalis cells. The data are averages (±s.d.) of 3 biological replicates for each strain. For each replicate, the rates of oxygen consumption were normalized to the maximal oxygen evolution rates obtained with the same illumination in the presence of the exogenous acceptors, DCBQ and ferricyanide. The non-normalized rates of each replicate are provided in Appendix 6—table 1. (B) O2 electrode traces (shown after subtraction of the dark baseline) monitoring O2 evolution and uptake in WL C. thermalis cells. 1O2 production in the presence of DCMU was measured as the rate of histidine-dependent consumption of O2 induced by saturating illumination (xenon lamp, 7100 µmol photons m–2 s–1). Measurements were performed in the presence of DCBQ and ferricyanide (Acceptors), or in the presence of DCMU, with or without the addition of histidine (His). All traces are provided in Appendix 6—figure 4—source data 1.
-
Appendix 6—figure 4—source data 1
Singlet oxygen production cells.
- https://cdn.elifesciences.org/articles/79890/elife-79890-app6-fig4-data1-v2.xlsx
Tables
Table 1
Time constants and relative amplitudes (%) of the different phases of fluorescence decay obtained by fitting the data in Figure 2 and Figure 2—figure supplement 1.
Statistically significant differences according to Student’s t-tests are indicated with asterisks (*p≤0.05, **p≤0.01, ***p≤0.001, ****p≤0.0001).
| No addition (1 s)* | |||
|---|---|---|---|
| Strain | Fast phase | Middle phase | Slow phase +y0 |
| T1/Amp (ms/%) | T2/Amp (ms/%) | Amp (%) | |
| A. marina | 0.58±0.21 / 26±5 | 4.9±1.3 / 32±5 | 42±3** |
| C. thermalis WL | 0.50±0.09 / 32±3 | 3.7±0.4 / 37±4 | 31±2 |
| C. thermalis FR | 0.53±0.16 / 26±4 | 4.7±0.7 / 45±4 | 30±3 |
| No addition 100 s† | |||
| Not bound | Middle phase | Slow phase | |
| Strain | T1/Amp (ms/%) | T2/Amp (s/%) | T3/Amp (s/%) |
| A. marina | -/- | 0.98±0.58 / 19±8 | 6.5±1.0 / 81±8 |
| C. thermalis WL | 2.0±0.9 / 5±1 | 0.25±0.04 / 17±1 | 6.9±0.3 / 78±1 |
| C. thermalis FR | 2.7±0.9 / 6±1 | 1.31±0.35** / 14±3 | 10.4±0.8** / 80±3 |
| DCMU (100 s)‡ | |||
| Strain | Fast phase | Middle phase | Slow phase |
| T1/Amp (ms/%) | T2/Amp (ms/%) | T3/Amp (s/%) | |
| A. marina | 1.8±0.3 / 47±3*** | 44.7±11.2 / 26±3 | 10.8±2.6* / 27±1**** |
| C. thermalis WL | 1.7±0.2 / 62±2 | 99.8±23.5*/ 24±2 | 5.6±2.4 / 14±2 |
| C. thermalis FR | 2.2±0.3 / 58±3 | 38.7±10.3 / 26±3 | 14.3±4.6* / 16±1 |
-
*
The decay kinetics measured over 100 s in samples with no additions were truncated at 1 s and fitted with a three exponential equation allowing y0 to account for the part decaying in >1 s. For this reason, the cumulative amplitude of the slowest exponential decay phase and of y0 is provided, but no T3.
-
†
The decay kinetics recorded over a period of 100 s were fitted with two exponentials and one hyperbole. In the case of A. marina, fitting of the fluorescence decay kinetics was done by excluding the datapoints between 30 and 100 s after flash, because of the presence of a non-decaying fluorescence that likely arises from a fraction of centres devoid of an intact Mn-cluster in which QA- is stabilised.
-
‡
The data recorded in the presence of DCMU over a period of 100 s were fitted with two exponentials (only one in the case of A. marina) and one hyperbole.
Table 2
Initial distribution of S-states obtained by fitting the flash-dependent oxygen evolution data in Figure 3.
| FR C. thermalis | A. marina | Synechocystis | |||||||
|---|---|---|---|---|---|---|---|---|---|
| 613 nm LED | 730 nm LED | Flashlamp | 613 nm LED | 730 nm LED | Flashlamp | 613 nm LED | 730 nm LED | Flashlamp | |
| S0 (%) | 15.7 | 15.3 | 14.9 | 15.6 | 15.9 | 15.2 | 22.3 | 18.7 | 19.7 |
| S1 (%) | 84.3 | 84.7 | 85.1 | 75.4 | 76.1 | 75.8 | 66.7 | 73.3 | 71.3 |
| S2 (%) | 0 | 0 | 0 | 9 | 8 | 9 | 11 | 8 | 9 |
Table 3
Average values (± s.d.) of the temperatures (T) and of the normalized amplitudes (Amp, in relative units) of the thermoluminescence peaks from S2QB- and from S2QA- back-reactions, plotted in Figure 5—figure supplement 1.
The difference in temperature between the S2QB- and the S2QA- (ΔT) is also reported. The ΔT in A. marina is significantly bigger than the one in WL and FR C. thermalis according to Student’s t-test, as indicated with an asterisk (*p≤0.05).
| S2QB- | S2QA- | ΔT (°C) | |||
|---|---|---|---|---|---|
| Strain | T (°C) | Amp (r.u.) | T (°C) | Amp (r.u.) | |
| A. marina | 46.5±1.8 | 2.77±1.15 | 14.9±3.7 | 1.15±0.55 | 31.5±2.8* |
| WL C. thermalis | 52.9±3 | 0.65±0.31 | 28.1±1.7 | 0.54±0.21 | 24.9±3.2 |
| FR C. thermalis | 50.3±4.7 | 4.61±1.29 | 26±3.3 | 3.27±0.88 | 24.3±5.1 |
Table 4
Excitation energy partitions calculated for the three types of PSII assuming excitation equilibration between the pigments.
E* denotes the energy of the excited state, obtained by applying a+5 nm Stoke’s shift to the absorption of the pigments, n is the number of pigments belonging to each state and Pi is the normalized partition of the excited states, calculated following Boltzmann distribution (Laible et al., 1994).
| Chl-a-PSII | |||
|---|---|---|---|
| State | E* | n | Pi |
| Bulk Chl-a/Phe-a | 685 | 34 | 0.878 |
| ChlD1680 | 685 | 1 | 0.026 |
| F685 | 685 | 1 | 0.026 |
| F695 | 695 | 1 | 0.071 |
| Chl-d-PSII | |||
| State | E* | n | Pi |
| Chl-a/Phe-a | 685 | 3 | 0.002 |
| ChlD1720 | 725 | 1 | 0.029 |
| Bulk Chl-d | 725 | 33 | 0.969 |
| Chl-f-PSII | |||
| State | E* | n | Pi |
| Bulk Chl-a/Phe-a | 685 | 32 | 0.046 |
| ChlD1721 | 726 | 1 | 0.075 |
| F720/A715 | 720 | 1 | 0.043 |
| F731/A726 | 731 | 1 | 0.117 |
| F737/A732 | 737 | 1 | 0.2 |
| F748/A743 | 748 | 1 | 0.52 |
-
The states are denoted as follows: ChlD1 is the primary donor (Pi highlighted in bold), Bulk indicates the antenna pigments considered as isoenergetic, and F indicates the antenna pigments considered separately from the bulk, with the fluorescence emission wavelength indicated. In the case of the far-red pigments in Chl-f-PSII the peak absorptions (A) are also indicated, as taken from Judd et al., 2020.
Key resources table
| Reagent type (species) or resource | Designation | Source or reference | Identifiers | Additional information |
|---|---|---|---|---|
| Strain, strain background (Chroococcidiopsis) | Chroococcidiopsis thermalis sp. PCC7203 | Pasteur Culture Collection of Cyanobacteria | NCBI:txid251229 | |
| Strain, strain background (Acaryochloris) | Acaryochloris marina MBIC 11017 | Marine Biotechnology Institute Culture Collection | NCBI:txid155978 | |
| Strain, strain background (Synechocystis) | Synechocystis sp. PCC6803 | Pasteur Culture Collection of Cyanobacteria | NCBI:txid1148 | Glucose tolerant |
| Genetic reagent (Thermosynechococcus elongatus BP-1) | ΔpsbA1, ΔpsbA2 | DOI:10.1016 /j.bbabio.2008.01.007 | WT*3 | |
| Chemical compound, drug | MES (2-(N-morpholino)ethanesulfonic acid) | Thermo Scientific | J18886.A1 | |
| Chemical compound, drug | β-DM (n-Dodecyl-β-D-maltoside) | Thermo Scientific | 89,903 | |
| Chemical compound, drug | DCMU (3-(3,4-dichlorophenyl)–1,1-dimethylurea) | Sigma-Aldrich | D2425 | |
| Chemical compound, drug | DCBQ (2,5-Dichloro-1,4-benzoquinone) | Sigma-Aldrich | 431,982 | |
| Chemical compound, drug | potassium ferricyanide | Sigma-Aldrich | 244,023 | |
| Chemical compound, drug | L-Histidine | BioChemica | A3738 | |
| Chemical compound, drug | sodium azide (NaN3) | Sigma-Aldrich | S2002 | |
| Chemical compound, drug | Methyl viologen dichloride hydrate | Sigma-Aldrich | 856,177 | |
| Chemical compound, drug | TMPD (N,N,N′,N′-tetramethyl-p-phenylenediamine) | Sigma-Aldrich | T3134 | |
| Chemical compound, drug | Rose Bengal | Sigma-Aldrich | 330,000 | |
| Chemical compound, drug | PPBQ (Phenyl-p-benzoquinone) | Sigma-Aldrich | PH005156 | |
| Chemical compound, drug | 6-Aminocaproic acid | Sigma-Aldrich | A7824 | |
| Chemical compound, drug | Benzamidine hydrochloride hydrate | Alfa Aesar | J62823 |
Appendix 5—table 1
Time constants and relative amplitudes of the different phases of luminescence decay obtained by fitting the data recorded at 10, 20, and 30°C with a three-exponential equation.
The values represent the averages of 3 biological replicates,± s.d. The fast decay phase is assigned to TyrZ•(H+)QA- recombination, while the middle and slow phases are assigned to S2QA- recombination. The additional phase identified in A. marina membranes at 10 °C is unassigned.
| Strain and temperature | Fast phase | Middle phase | Slow phase | Additional phase |
|---|---|---|---|---|
| T1/Amp (s/%) | T2/Amp (s/%) | T3/Amp (s/%) | T4/Amp (s/%) | |
| A. marina | ||||
| 10 °C | -/- | 3.5±1.0 / 64±22 | 10.6±2.9 / 35±18 | 36.5±7.3 / 5±3 |
| 20 °C | -/- | 3.2±0.6 / 88±5 | 12.7±2.9 / 18±3 | -/- |
| 30 °C | -/- | 3.0±0.4 / 87±9 | 10.2±2.4 / 19±7 | -/- |
| WL C. thermalis | ||||
| 10 °C | 0.5±0.2 / 72±8 | 4.0±2.4 / 18±4 | 32.0±6.8 / 7±2 | -/- |
| 20 °C | 0.4±0.1 / 62±13 | 3.2±1.2 / 23±7 | 19.1±2.8 / 12±5 | -/- |
| 30 °C | 0.6±0.1 / 55±7 | 6.0±0.8 / 32±4 | 16.9# / 9# | -/- |
| FR C. thermalis | ||||
| 10 °C | 1.0±0.2 / 43±2 | 10.4±1.0 / 26±2 | 43.7±1.8 / 31±2 | -/- |
| 20 °C | 1.0±0.1 / 28±4 | 7.9±0.7 / 35±3 | 23.5±1.8 / 38±4 | -/- |
| 30 °C | 1.4±0.4 / 14±10 | 8.6±1.1 / 72±18 | 18.6±3.7 / 15±8 | -/- |
-
#The slow phase in WL C. thermalis membranes at 30 °C could be reliably fitted only in one replicate out of three.
Appendix 6—table 1
Rates of oxygen evolution (in presence of the electron acceptors DCBQ and ferricyanide) and consumption (in presence of DCMU and DCMU +histidine) measured in A. marina, WL C. thermalis and FR C. thermalis membranes and intact cells under saturating illumination (xenon lamp, 7100 µmol photons m–2 s–1).
The reported rates are those used to make Figure 6 and Appendix 6—figure 4.
| µmol O2 h–1 mg Chl–1 | ||||||
|---|---|---|---|---|---|---|
| Membranes | Cells | |||||
| A. marina | Acceptors | DCMU | DCMU +His | Acceptors | DCMU | DCMU +His |
| Replicate 1 | 114 | 2 | –118 | 214 | –11 | –102 |
| Replicate 2 | 99 | –40 | –93 | 207 | -9 | –232 |
| Replicate 3 | 259 | –203 | 255 | –10 | –148 | |
| Replicate 4 | 205 | –188 | ||||
| Replicate 5 | 288 | –147 | ||||
| Replicate 6 | 163 | 0 | –124 | |||
| WL C. thermalis | Acceptors | DCMU | DCMU +His | Acceptors | DCMU | DCMU +His |
| Replicate 1 | 183 | –15 | –20 | 177 | 24 | –15 |
| Replicate 2 | 52 | –22 | –16 | |||
| Replicate 3 | 69 | -3 | –32 | |||
| FR C. thermalis | Acceptors | DCMU | DCMU +His | Acceptors | DCMU | DCMU +His |
| Replicate 1 | 199 | 10 | –20 | 80 | 4 | –10 |
| Replicate 2 | 221 | –26 | –18 | 193 | 14 | –40 |
| Replicate 3 | 65 | -6 | 225 | –12 | –83 | |
| Replicate 4 | 140 | –63 | ||||
| Replicate 5 | 57 | 7 | –28 | |||
| Replicate 6 | 140 | -2 | –17 | |||
Additional files
-
MDAR checklist
- https://cdn.elifesciences.org/articles/79890/elife-79890-mdarchecklist1-v2.docx
-
Appendix 1—figure 1—source data 1
Fluorescence decay kinetics Synechocystis.
- https://cdn.elifesciences.org/articles/79890/elife-79890-app1-fig1-data1-v2.xlsx
-
Appendix 2—figure 1—source data 1
Flash dependent thermoluminescence.
- https://cdn.elifesciences.org/articles/79890/elife-79890-app2-fig1-data1-v2.xlsx
-
Appendix 5—figure 1—source data 1
Luminescence decay kinetics.
- https://cdn.elifesciences.org/articles/79890/elife-79890-app5-fig1-data1-v2.xlsx
-
Appendix 6—figure 1—source data 1
Light sources and saturation curves.
- https://cdn.elifesciences.org/articles/79890/elife-79890-app6-fig1-data1-v2.xlsx
-
Appendix 6—figure 2—source data 1
Tris-washed A. marina singlet oxygen.
- https://cdn.elifesciences.org/articles/79890/elife-79890-app6-fig2-data1-v2.xlsx
-
Appendix 6—figure 3—source data 1
A. marina PSI activity.
- https://cdn.elifesciences.org/articles/79890/elife-79890-app6-fig3-data1-v2.xlsx
-
Appendix 6—figure 4—source data 1
Singlet oxygen production cells.
- https://cdn.elifesciences.org/articles/79890/elife-79890-app6-fig4-data1-v2.xlsx
Download links
A two-part list of links to download the article, or parts of the article, in various formats.
Downloads (link to download the article as PDF)
Open citations (links to open the citations from this article in various online reference manager services)
Cite this article (links to download the citations from this article in formats compatible with various reference manager tools)
Impact of energy limitations on function and resilience in long-wavelength Photosystem II
eLife 11:e79890.
https://doi.org/10.7554/eLife.79890


