Cancer genome and tumor microenvironment: Reciprocal crosstalk shapes lung cancer plasticity
- Max Planck Institute for Heart and Lung Research, Germany
- Institute for Lung Health (ILH), Justus Liebig University, Germany
- Rudolf Buchheim Institute of Pharmacology, Justus Liebig University, Germany
- Institute of Molecular Oncology, Germany
- Member of the German Center for Lung Research (DZL), Germany
- Universities of Giessen and Marburg Lung Center (UGMLC), Germany
- Member of the Cardio-Pulmonary Institute (CPI), Germany
- Frankfurt Cancer Institute (FCI), Goethe University Frankfurt, Germany
Figures
Figure 1
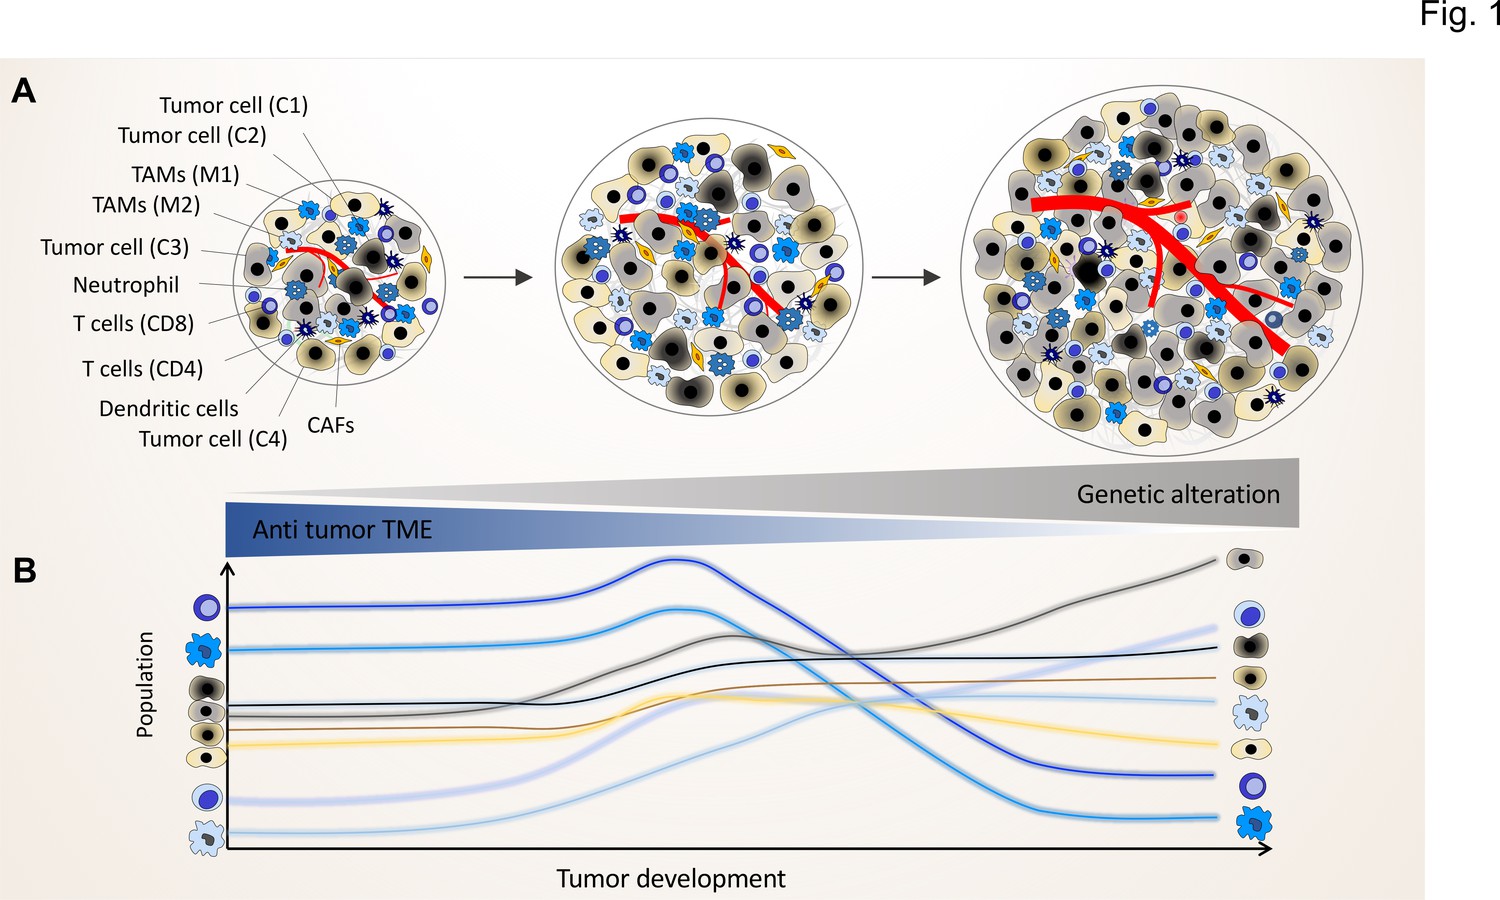
The genomic landscape of cancer cell defines the tumor microenvironment phenotype.
Tumors contain various types of cancer cell clones during their development, which is depicted by different colored tumor cells (C1, C2, C3, and C4) to show the genetically distinct landscape. In the initial phase of tumor growth, the tumor microenvironment (TME) has a tumor-suppressive phenotype including mainly anti-tumor immune cells including M1-like TAMs and CD8+ T cells. During tumor progression, the TME phenotype reaches a steady state in which the population of anti-tumor and pro-tumor components (e.g. M2-like TAMs and CD4+ T cells) is in equilibrium. Based on evolutionary selection, the cancer cell clone with a unique genomic landscape and higher fitness (light gray clone) starts to re-shape the TME to enhance pro-tumor TME components that in turn support its growth and proliferation. In this process, the other less fitted clones are targeted by the anti-tumor TME elements and consequently depleted during tumor progression.
Figure 2
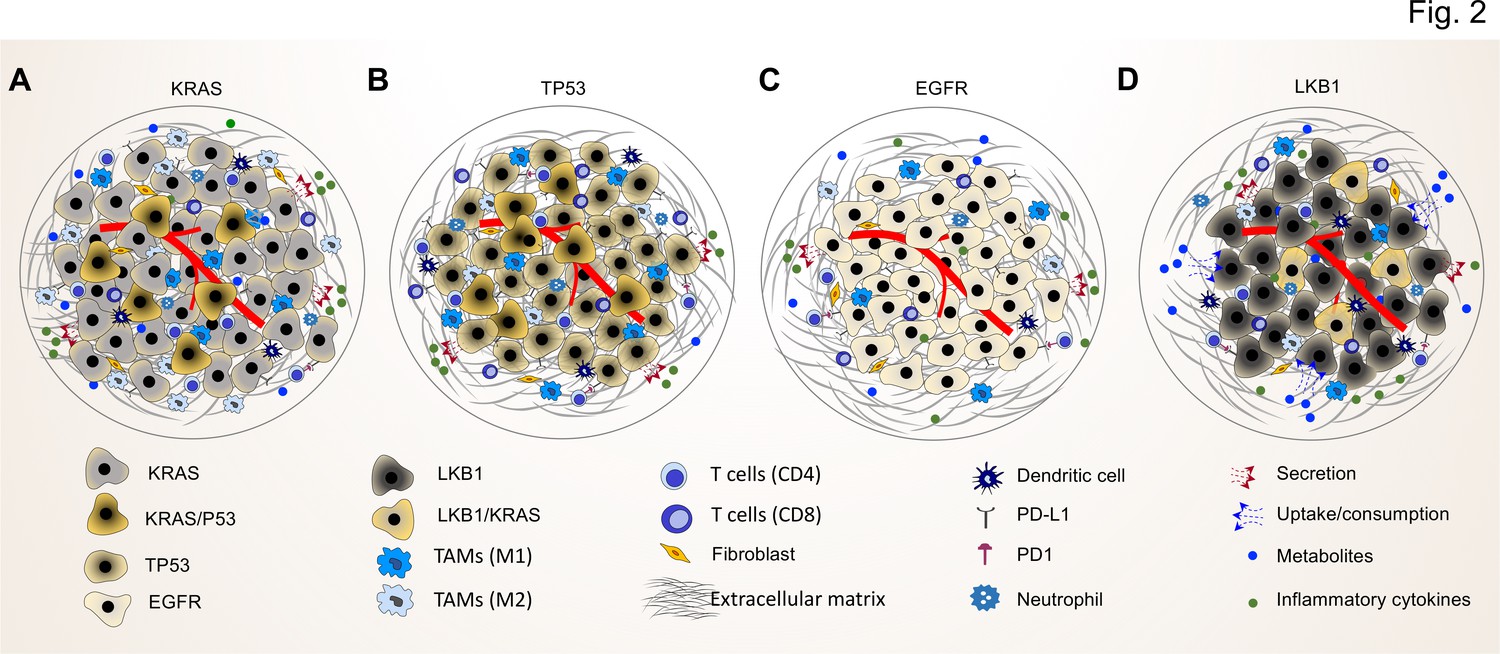
Common driver mutations impact on the TME in lung tumor.
(A) KRAS mutations induce a pro-tumorigenic, immunosuppressed TME enriched in pro-tumor M2 macrophages and pro-tumor CD4+ T cells. KRAS activated intrinsic inflammatory signaling via the NF-κB pathway leads to increased secretion of inflammatory cytokines, including TNFα, IL-1α/β, and CXCL8, which in turn enforce the induction of a pro-inflammatory TME by polarization, and recruitment of immunosuppressive immune cells. (B) TP53 mutations shape an inflamed and immunosuppressive TME via cell-autonomous activation of the NF-κB pathway in cancer cells and enhance the secretion of inflammatory cytokines such as interferon γ (IFNγ). Moreover, TP53/KRAS co mutated tumors express higher levels of PD-L1 and show higher CD8+ T cell infiltration. (C) EGFR mutated cancer cells have a lower mutational load. This unique genetic feature together with low level of PD-L1 expression and CD8+ tumor infiltrating T cells mark a unique immunosuppressive and cold TME phenotype, which can explain the resistance to immune-checkpoint therapies of lung cancer patients with EGFR mutation. (D) LKB1 inactivation can lead to increased uptake of specific metabolites such as serine, which support immune cell activation and polarization. This can result in the extracellular depletion of immune regulatory metabolites and favor an immunosuppressive TME phenotype. LKB1/KRAS co-mutated tumors are further characterized by a pro-inflammatory cytokine milieu.
Figure 3
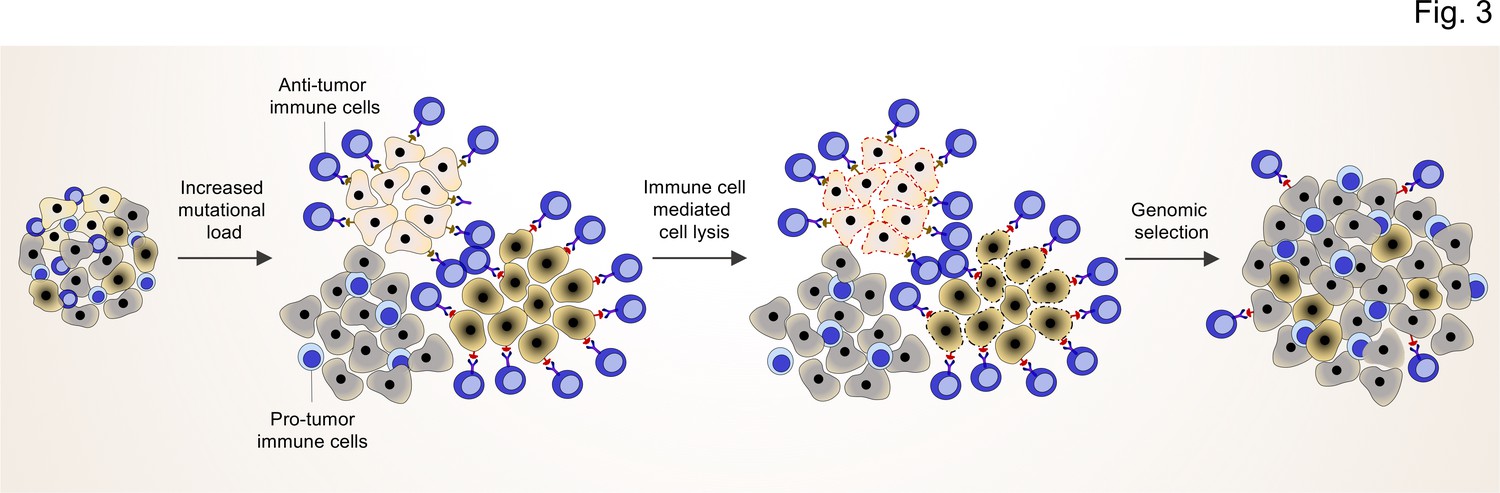
TME shapes the genomic landscape of lung cancer cells.
Accumulation of specific cancer clones (light and dark cream) with (neo)antigen presentation can induce the infiltration of anti-tumor immune cells (blue cells with light nuclei).
The anti-tumor immune cells will recognize and induce the cell death pathway in the targeted clones. By this mechanism, anti-tumor immune cells can act as a genetic selection barrier not only by killing less fit clones but also through the preparation of an environment that promotes growth and proliferation of other clones (dark gray) with specific genetic profiles that subsequently prevent antigen production. However, some cancer cells with antigen presentation can also evade the killing by anti-tumor immune cells through other mechanisms (dark cream clones after genomic selection).
Figure 4
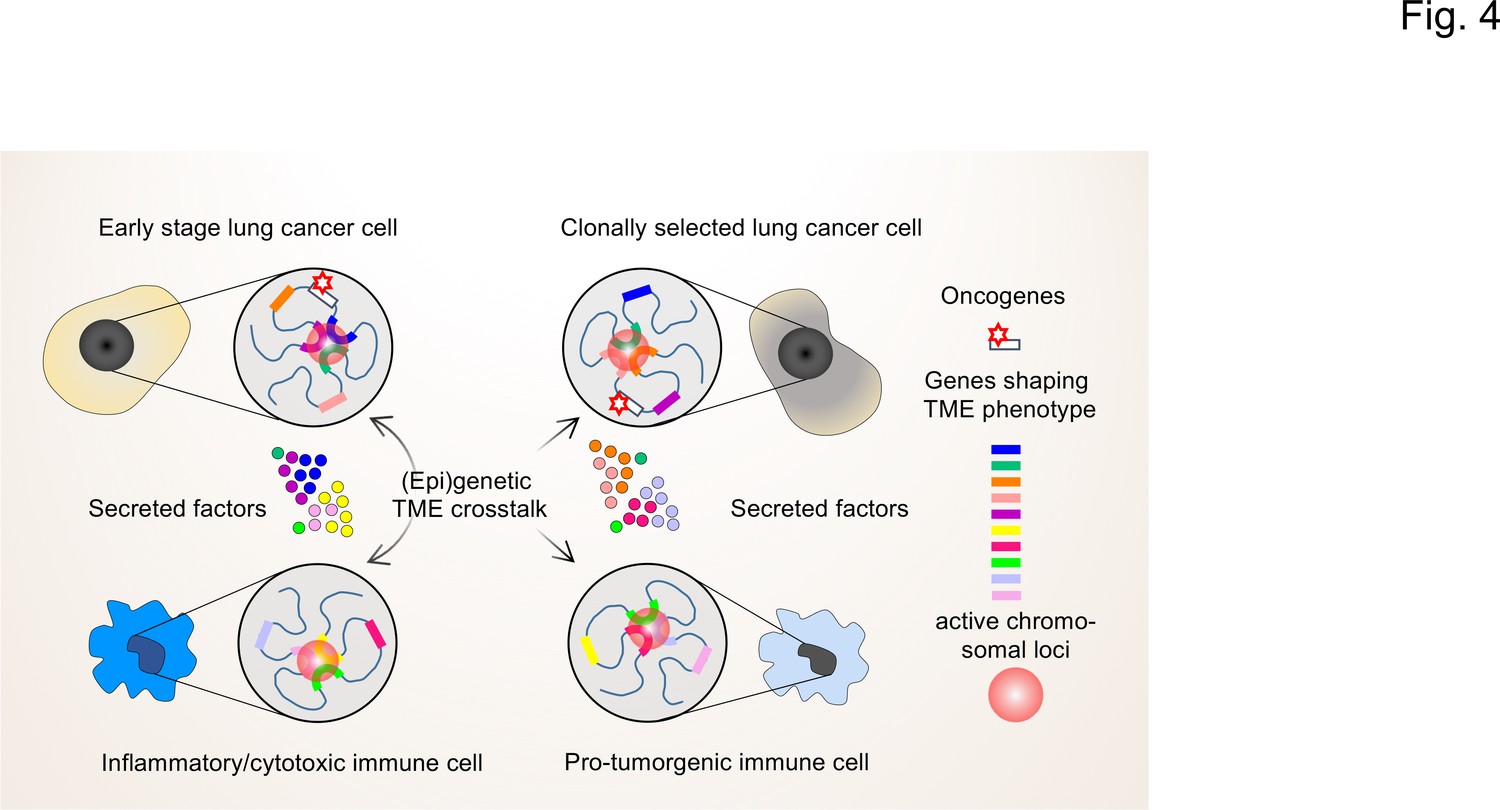
The interplay of single-cell chromatin states determine changes in gene expression in the TME of lung cancer cells.
At the single cell level, gene expression occurs in a stochastic fashion and stable phenotypes in populations of tumor cells or immune cells result from variable single-cell gene expression patterns. Depicted are changing patterns of active chromatin loci formed by transient interactions of enhancers and promoters of multiple genes, some of which may encode secreted factors secreted by the TME. These nuclear foci operate as transcriptional hubs that are characterized by high concentrations of transcription factors, transcriptional cofactors and RNA polymerases. Similarly, the 3D spatial conformations of chromatin (including the loops that engage in enhancer promoter interactions) vary from cell to cell. This high degree in (epi)genetic diversity very likely contributes significantly to the clonal selection of cells that shape the TME in a pro-tumorigenic manner.
Figure 5
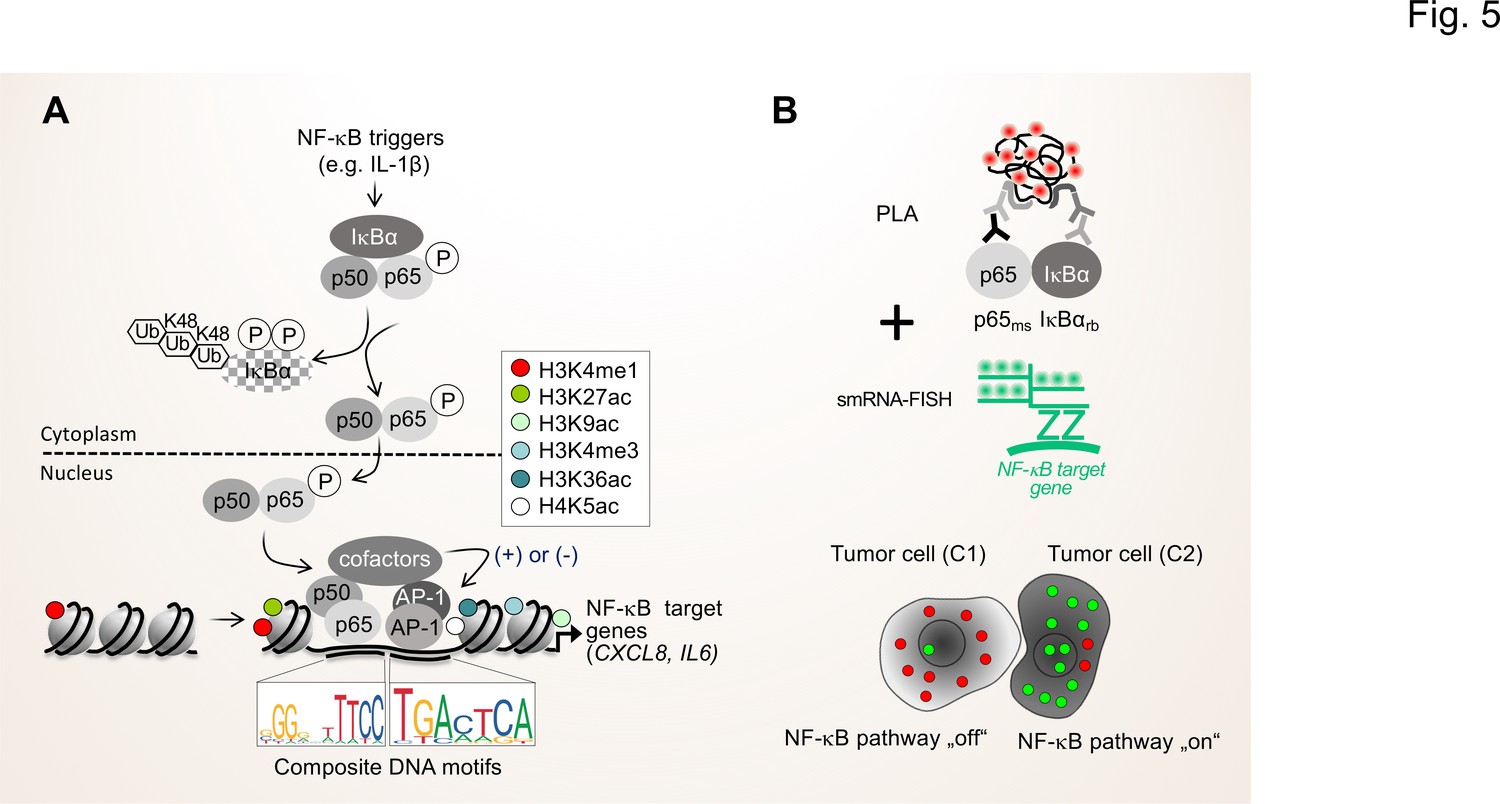
Single cell states of the NF-κB signaling pathway.
(A) The scheme shows the key steps of the NF-κB signaling system. Activation of the canonical NF-κB pathway by triggers such as IL-1β will lead to the rapid phosphorylation and ubiquitination-mediated destruction of the cytosolic inhibitor IκBα. This in turns liberates the active NF-κB transcription factor subunits p50 (encoded by the NFKB1 gene) and p65 (encoded by the RELA gene), which translocate to the nucleus. The p50 and p65 dimers bind to specific DNA motifs within accessible, open chromatin regions, often in conjunction with other transcription factors such as JUN or FOS proteins which form activating protein (AP)–1 (hetero)dimers. Many NF-κB target genes encode secreted factors such as IL-6 or CXCL8, which are crucial regulators of the TME. High activity of NF-κB target genes is usually associated with characteristic epigenetic signatures at histone tails prevailing as enhancers (e.g. H3K27ac), promoters and gene bodies as indicated. (B) Schematic representation of proximity ligation assays (PLA) combined with single molecule (sm)RNA-FISH to monitor the NF-κB status at the single cell resolution. High numbers of NF-κB:IκBα dimers (red dots) and low numbers of smRNA-FISH signals (green dots) characterize cells with a silenced NF-κB pathway, while low numbers of NF-κB:IκBα dimers and high numbers of smRNA-FISH signals characterize cells with high NF-κB activity. For details see text. NF-κB (left sequence logos) and AP-1 (right sequence logos) motifs were obtained from the JASPAR data base (https://jaspar.genereg.net).
Download links
A two-part list of links to download the article, or parts of the article, in various formats.
Downloads (link to download the article as PDF)
Open citations (links to open the citations from this article in various online reference manager services)
Cite this article (links to download the citations from this article in formats compatible with various reference manager tools)
Cancer genome and tumor microenvironment: Reciprocal crosstalk shapes lung cancer plasticity
eLife 11:e79895.
https://doi.org/10.7554/eLife.79895


