Opposite polarity programs regulate asymmetric subsidiary cell divisions in grasses
- Centre for Organismal Studies Heidelberg, Heidelberg University, Germany
- Institute of Plant Sciences, University of Bern, Switzerland
- Department of Biology, Stanford University, United States
- Howard Hughes Medical Institute, Stanford University, United States
Figures
Figure 1 with 2 supplements
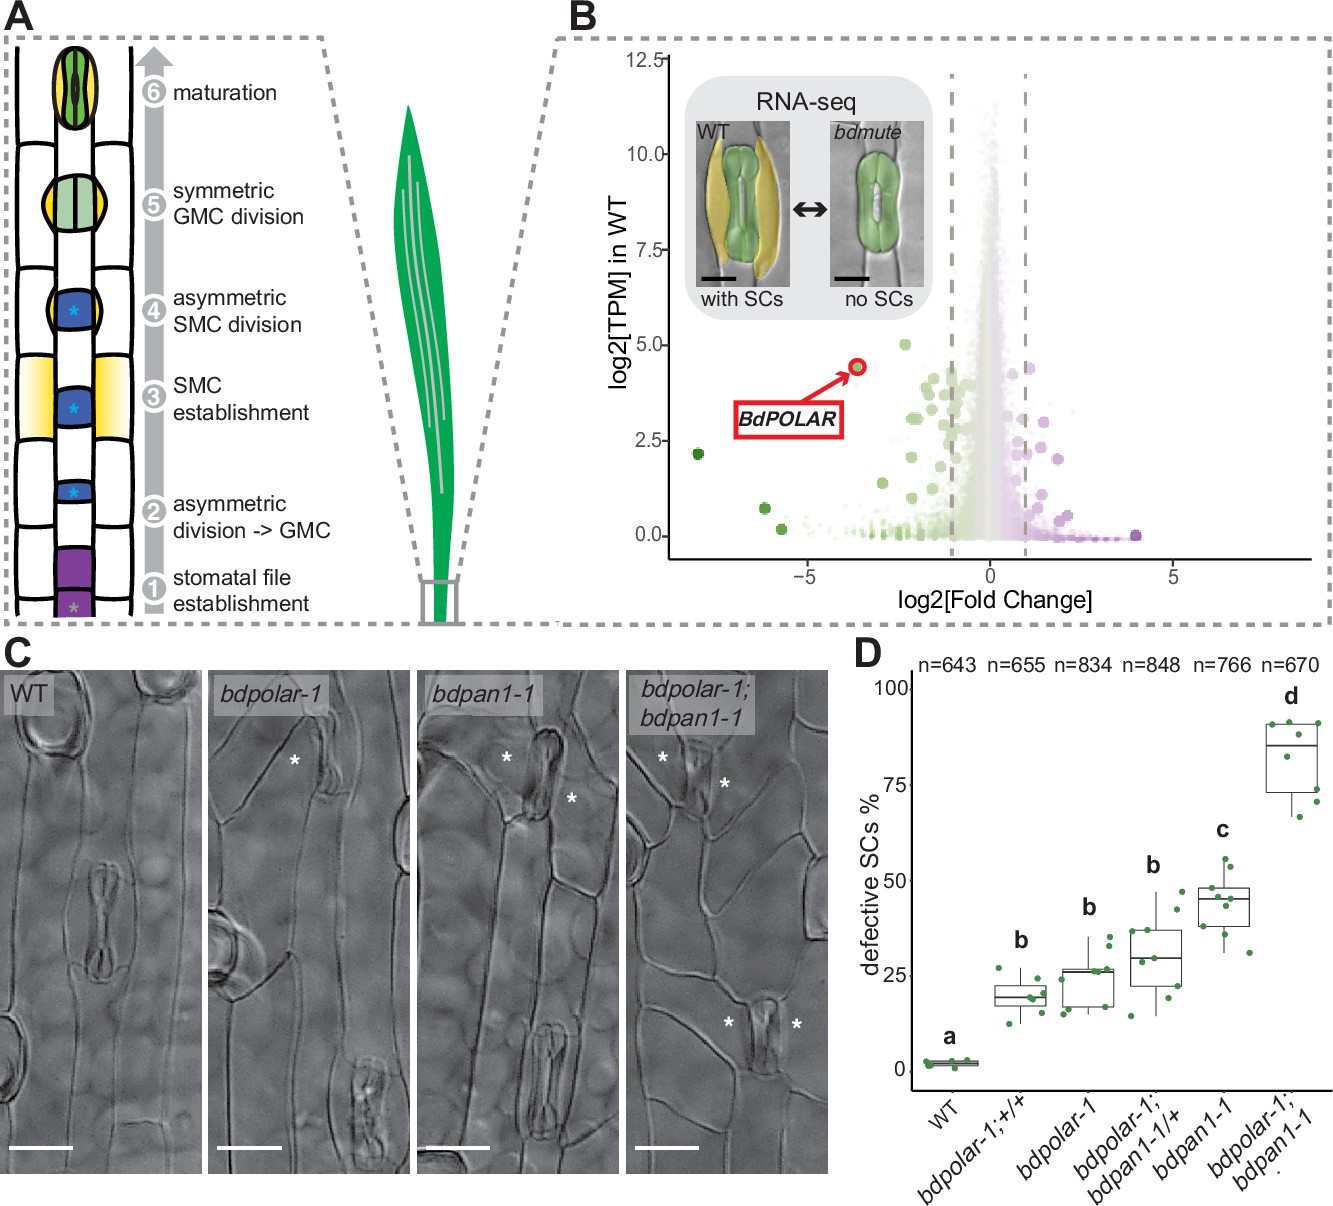
BdPOLAR is a novel regulator of subsidiary cell (SC) division in the Brachypodium distachyon stomatal lineage.
(A) Stomatal development in B. distachyon; in a stomatal file (1) (grey asterisk) a transverse asymmetric division (2) generates a guard mother cell (GMC; blue, with blue asterisk), which laterally induces subsidiary mother cells (SMCs; yellow) (3). SMCs divide asymmetrically (4) before GMCs divide symmetrically (5), and the complex matures (6). (B) Volcano plot displaying wild-type (WT) expression level (y-axis) and fold change in bdmute compared to WT (x-axis) of all expressed genes in the developmental zone (dots = genes). Green, large dots indicate genes significantly downregulated in bdmute and purple, large dots indicate genes significantly upregulated in bdmute. The red circle indicates BdPOLAR. (C) Differential interference contrast images of the epidermis in WT (Bd21-3), bdpolar-1, bdpan1-1, and bdpolar-1; bdpan1-1 (third leaf, 19 days after germination [dag]). Aberrant SCs are indicated with white asterisks. Scale bar, 15 µm. (D) Quantifications of defective SCs of segregating lines after crossing (bdpolar-1;+/+, bdpolar-1;bdpan1-1/+, and bdpolar-1;bdpan1-1), the parental lines bdpolar-1 and bdpan1-1, and a WT control. Samples were compared using a one-way ANOVA and post hoc Tukey test for multiple comparisons; different letters indicate significant differences (p<0.05). n=6–9 individuals and 643–848 SCs per genotype.
-
Figure 1—source data 1
Quantifications of defective SCs in bdpolar-1, bdpan1-1, and bdpolar-1;bdpan1-1.
- https://cdn.elifesciences.org/articles/79913/elife-79913-fig1-data1-v1.xlsx
Figure 1—figure supplement 1
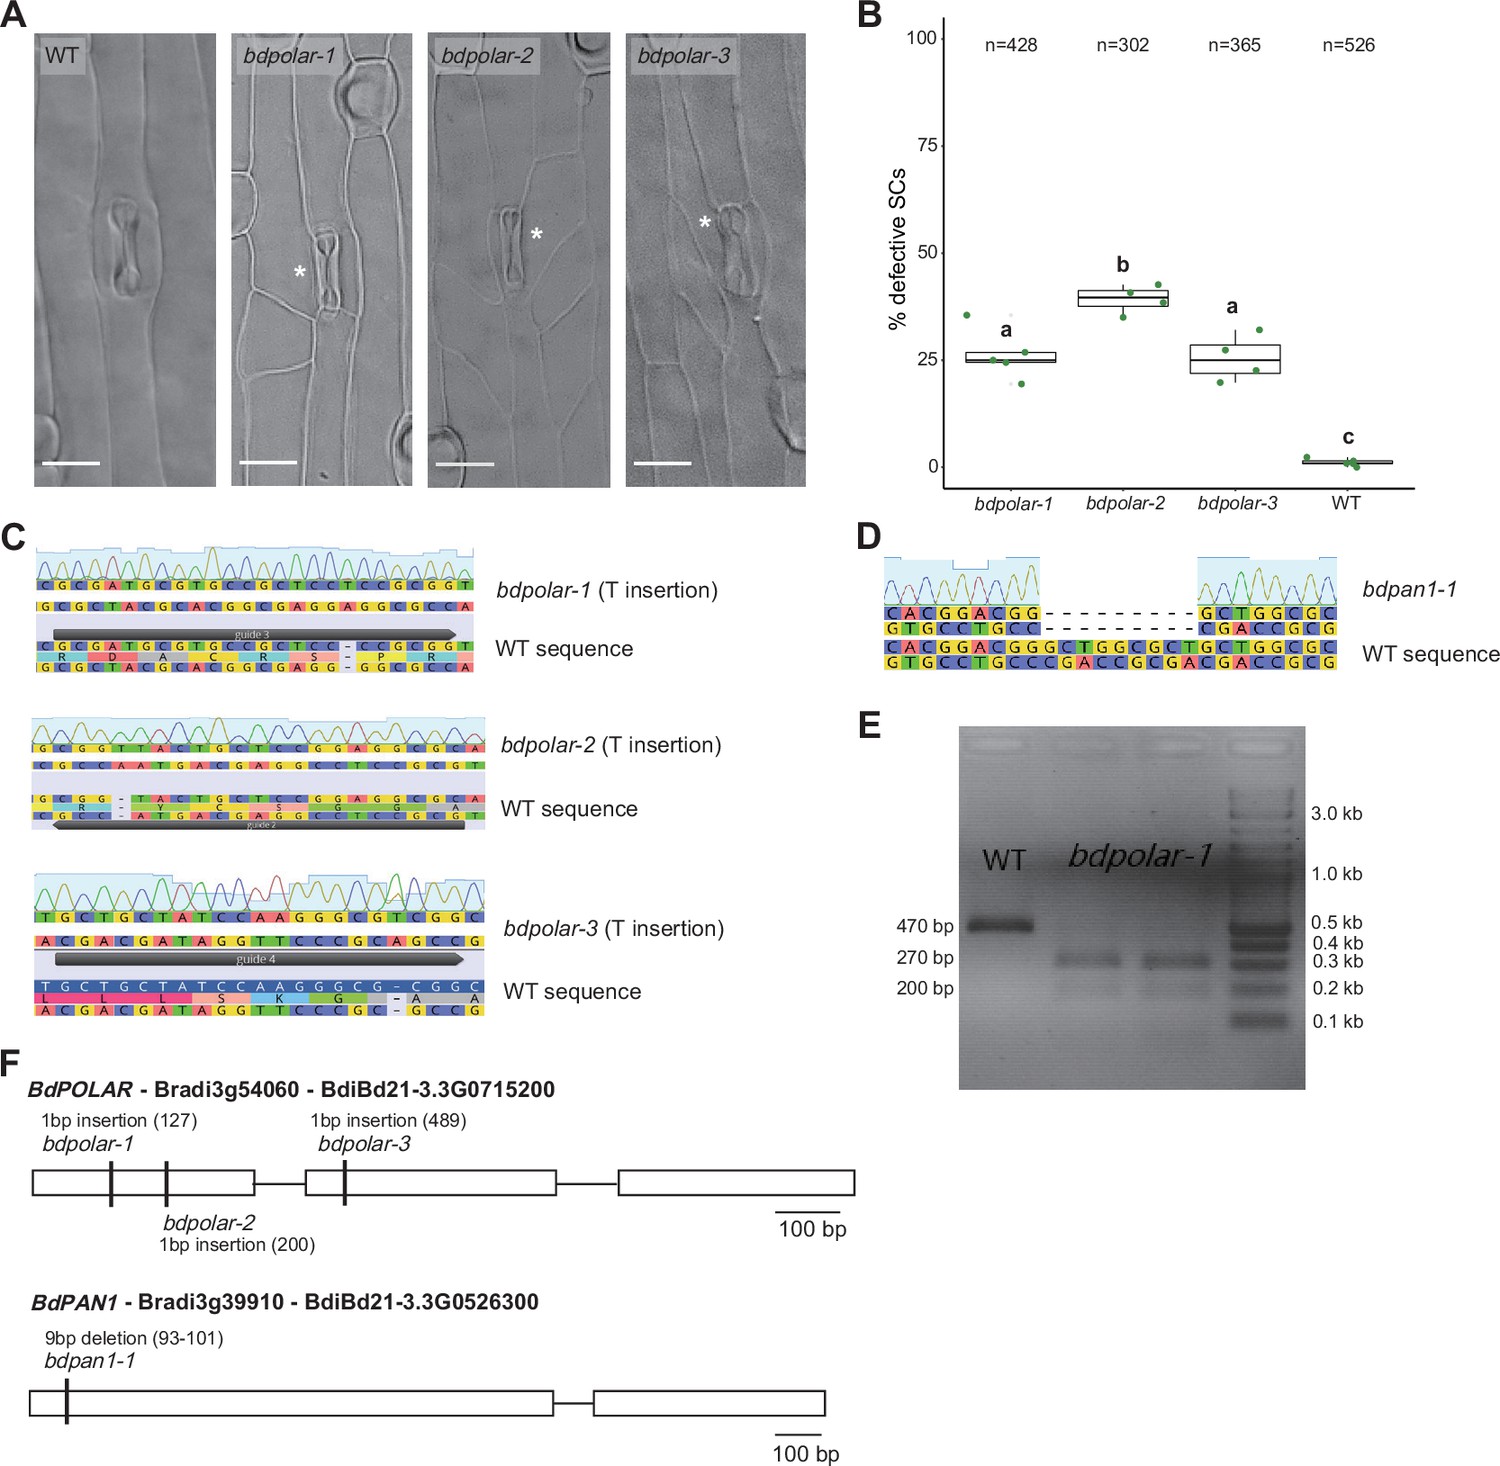
CRISPR/Cas9 and EMS (ethyl methanesulfonate)-mutagenised mutants in BdPOLAR and BdPAN1.
(A) Differential interference contrast images of the epidermis in wild type (WT), bdpolar-1, bdpolar-2, and bdpolar-3 (third leaf, 19 dag). Aberrant subsidiary cells (SCs) are indicated with white asterisks. Scale bar, 15 µm. (B) Quantifications of defective SCs in bdpolar-1, bdpolar-2, bdpolar-3, and WT control. Samples were compared using a one-way ANOVA and post hoc Tukey test for multiple comparisons; different letters indicate significant differences (p<0.05); n=4–5 individuals and 302–526 SCs. (C) Genotyping chromatogram of CRISPR/Cas9-induced mutations in bdpolar-1, bdpolar-2, and bdpolar-3. WT sequence at the bottom and mutant sequence chromatogram above are displayed; CRISPR/Cas9 guides are indicated. (D) Genotyping chromatogram of EMS-induced mutation in bdpan1-1. WT sequence at the bottom and mutant sequence chromatogram above are displayed. (E) Agarose gel electrophoresis of the BseRI-digested cleaved amplified polymorphic sequence (CAPS) marker to genotype bdpolar-1. BseRI can digest PCR products from bdpolar-1 (200 bp and 270 bp) but not from WT (470 bp). DNA kilobases standard control is NEB 1 kb Plus DNA Ladder. (F) Gene model of BdPOLAR (Bradi3g54060, BdiBd21-3.3G0715200) with available CRISPR/Cas9-induced (bdpolar-1, bdpolar-2, bdpolar-3) mutations and BdPAN1 (Bradi3g39910, BdiBd21-3.3G0526300) with EMS-induced mutation bdpan1-1.
-
Figure 1—figure supplement 1—source data 1
Quantifications of defective subsidiary cells in bdpolar-1, bdpolar-2, and bdpolar-3.
- https://cdn.elifesciences.org/articles/79913/elife-79913-fig1-figsupp1-data1-v1.xlsx
Figure 1—figure supplement 2
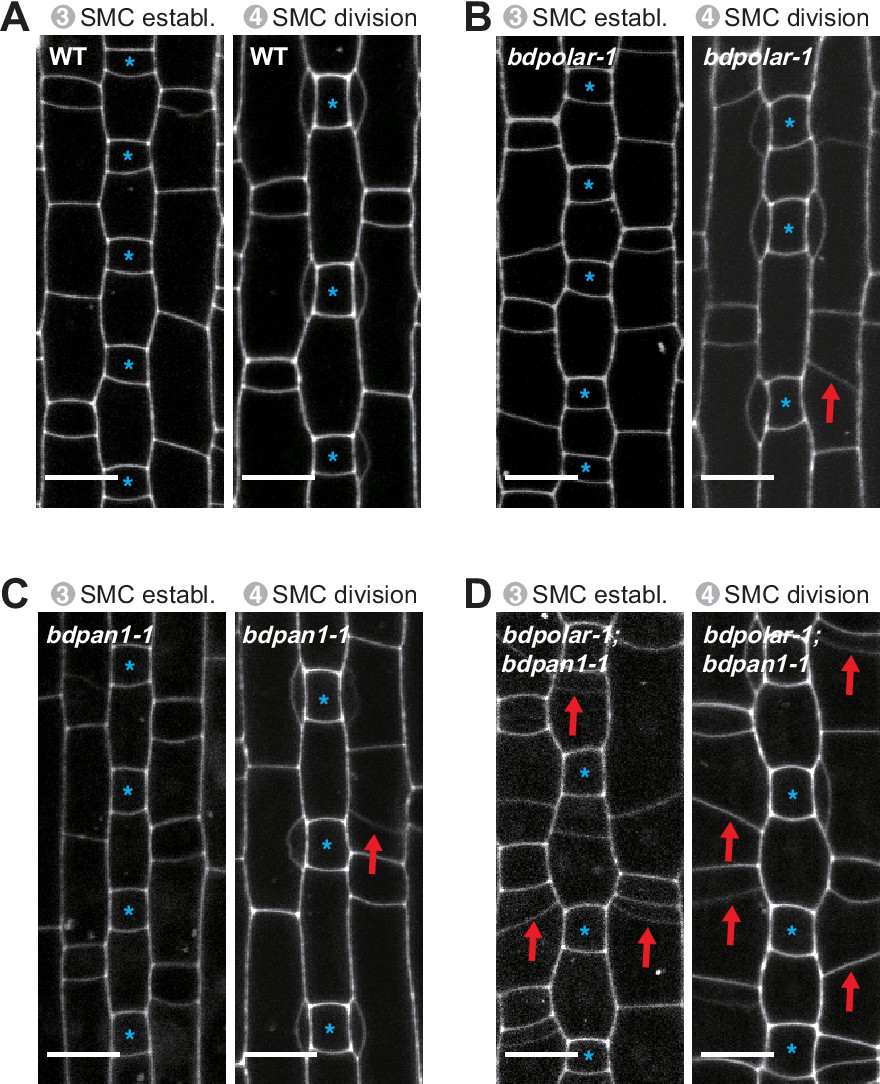
Misoriented subsidiary mother cell (SMC) division planes likely cause aberrant subsidiary cells in mature leaf zones.
Single confocal plane images of the propidium iodide-stained developing epidermis showing stage 3 to stage 4 SMCs in wild type (WT; [A]), bdpolar-1 (B), bdpan1-1 (C), and bdpolar-1;bdpan1-1 (D). Guard mother cells (GMCs) are indicated with blue asterisks. Red arrows indicate misoriented division planes in SMCs. Confocal images shown are single focal planes midway from top to bottom. Scale bar, 10 µm.
-
Figure 1—figure supplement 2—source data 1
Original, unmodified and uncropped gel image.
- https://cdn.elifesciences.org/articles/79913/elife-79913-fig1-figsupp2-data1-v1.zip
Figure 2 with 2 supplements

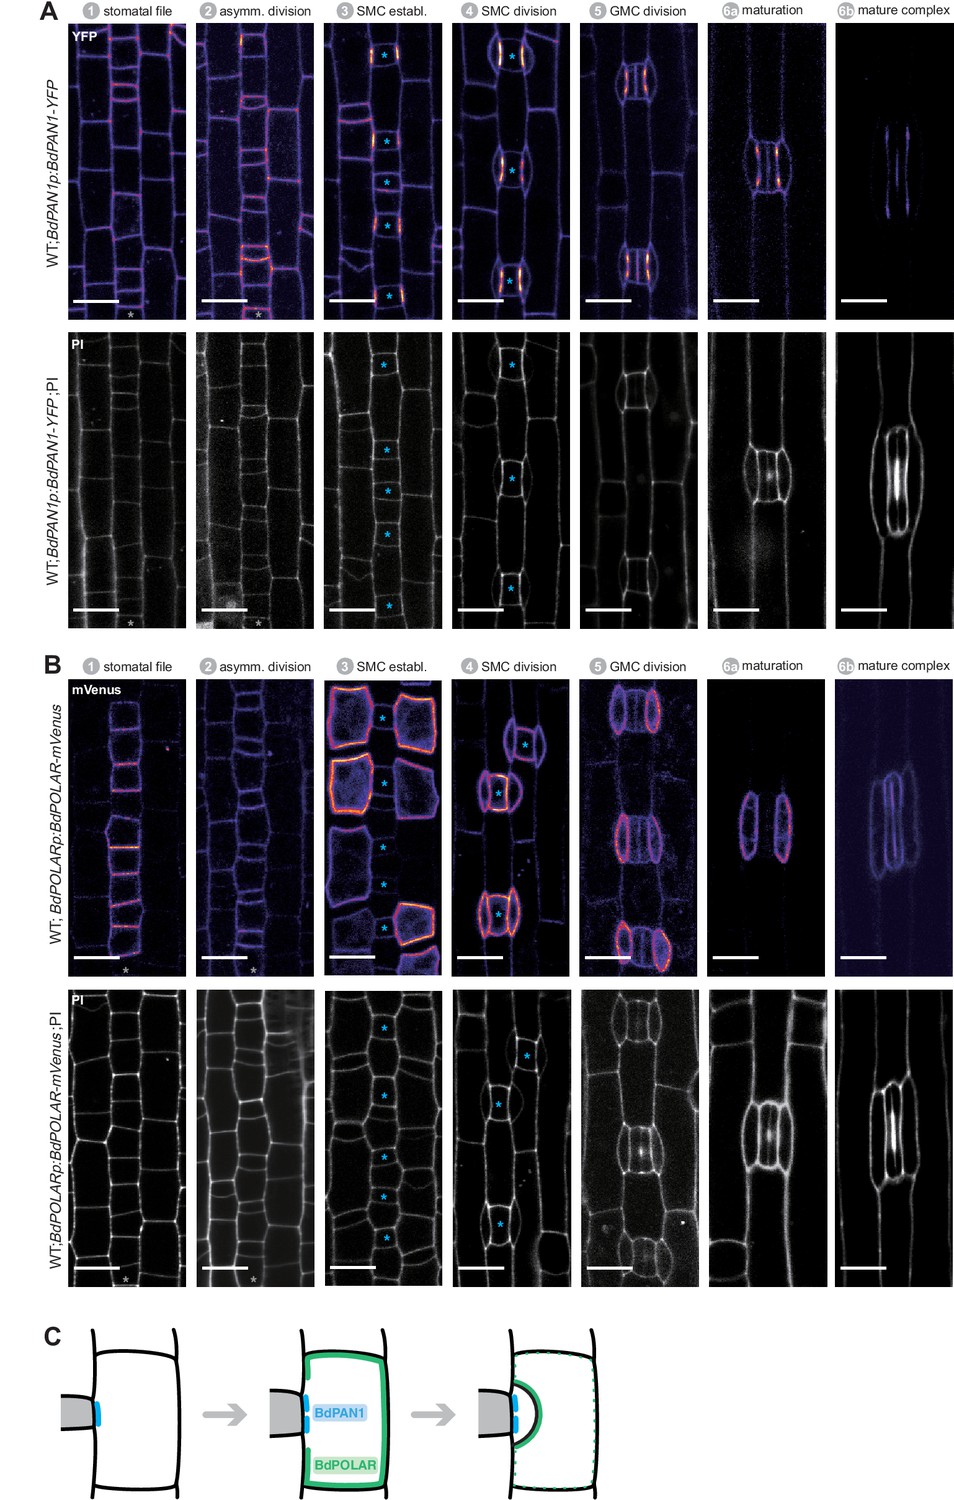
BdPAN1 and BdPOLAR display opposite, reciprocal polarisation in subsidiary mother cells (SMCs).
(A, B) BdPAN1p:BdPAN1-YFP reporter expression in stage 1 stomatal files (A) and during SMC stage 3 (B). Images of propidium iodide (PI)-stained cell outlines (left), and fluorescence intensity of YFP channel (right) (C, D). BdPOLARp:BdPOLAR-mVenus reporter expression in stage 1 stomatal files (C) and during SMC stage 3 (D). Images of PI-stained cell outlines (left), and fluorescence intensity of mVenus channel (right). The absence of BdPOLAR at the guard mother cell (GMC)/SMC interface is indicated with white arrowheads. The single white arrow indicates a newly formed subsidiary cell; note that BdPOLAR-mVenus dissociated from the SMC distal polarity domain. (E) Manually traced, normalised fluorescence intensity at the SMC plasma membrane of BdPAN1-YFP lines (n=13) and BdPOLAR-mVenus lines (n=8). Average fluorescence intensity with standard error is plotted as a function of the ‘unfolded’ SMC starting with the GMC/SMC interface as indicated by the model. Note that the signal gets noisy towards the end as SMCs are differently sized. Only SMCs with a length/width ratio (LWR) >0.8 for BdPAN1-YFP and LWR >0.9 for BdPOLAR-mVenus were included. (F) BdPOLARp:3xNLS-eGFP reporter expression during stomatal development. Overlay images show BdPOLAR transcriptional signals (in yellow) and PI-stained cell outlines in magenta. The stomatal files are indicated with a grey asterisk. GMCs are indicated with blue asterisks. Developmental stages are indicated. Confocal images shown are single focal planes midway from top to bottom. Scale bar, 10 µm.
-
Figure 2—source data 1
Quantification of fluorescence intensity of cell outlines of SMCs expressing BdPOLAR-mVenus or BdPAN1-YFP.
- https://cdn.elifesciences.org/articles/79913/elife-79913-fig2-data1-v1.xlsx
Figure 2—figure supplement 1
BdPAN1 and BdPOLAR expression throughout stomatal development in Brachypodium distachyon.
(A)BdPAN1p:BdPAN1-YFP reporter expression during stomatal development. Fluorescence intensity images of YFP channel only (upper) and images of PI-stained cell outlines only (bottom). (B) BdPOLARp:BdPOLAR-mVenus reporter expression during stomatal development. Fluorescence intensity images of mVenus channel only (upper) and images of propidium iodide (PI)-stained cell outlines only (bottom). Note that the laser was adjusted for different stages to visualise the signal and expression level between stages cannot be quantitatively compared. The stomatal files are indicated with grey asterisks. Guard mother cells (GMCs) are indicated with blue asterisks. Stomatal stages are indicated. (C) Simplified model of the spatiotemporal dynamics of the two polarity domains. Note that the proximal BdPAN1 domain forms earlier and is stable post-mitotically, whereas BdPOLAR quickly dissociates from the distal domain after subsidiary cell division. Confocal images shown are single focal planes midway from top to bottom. Scale bar, 10 µm.
Figure 2—figure supplement 2
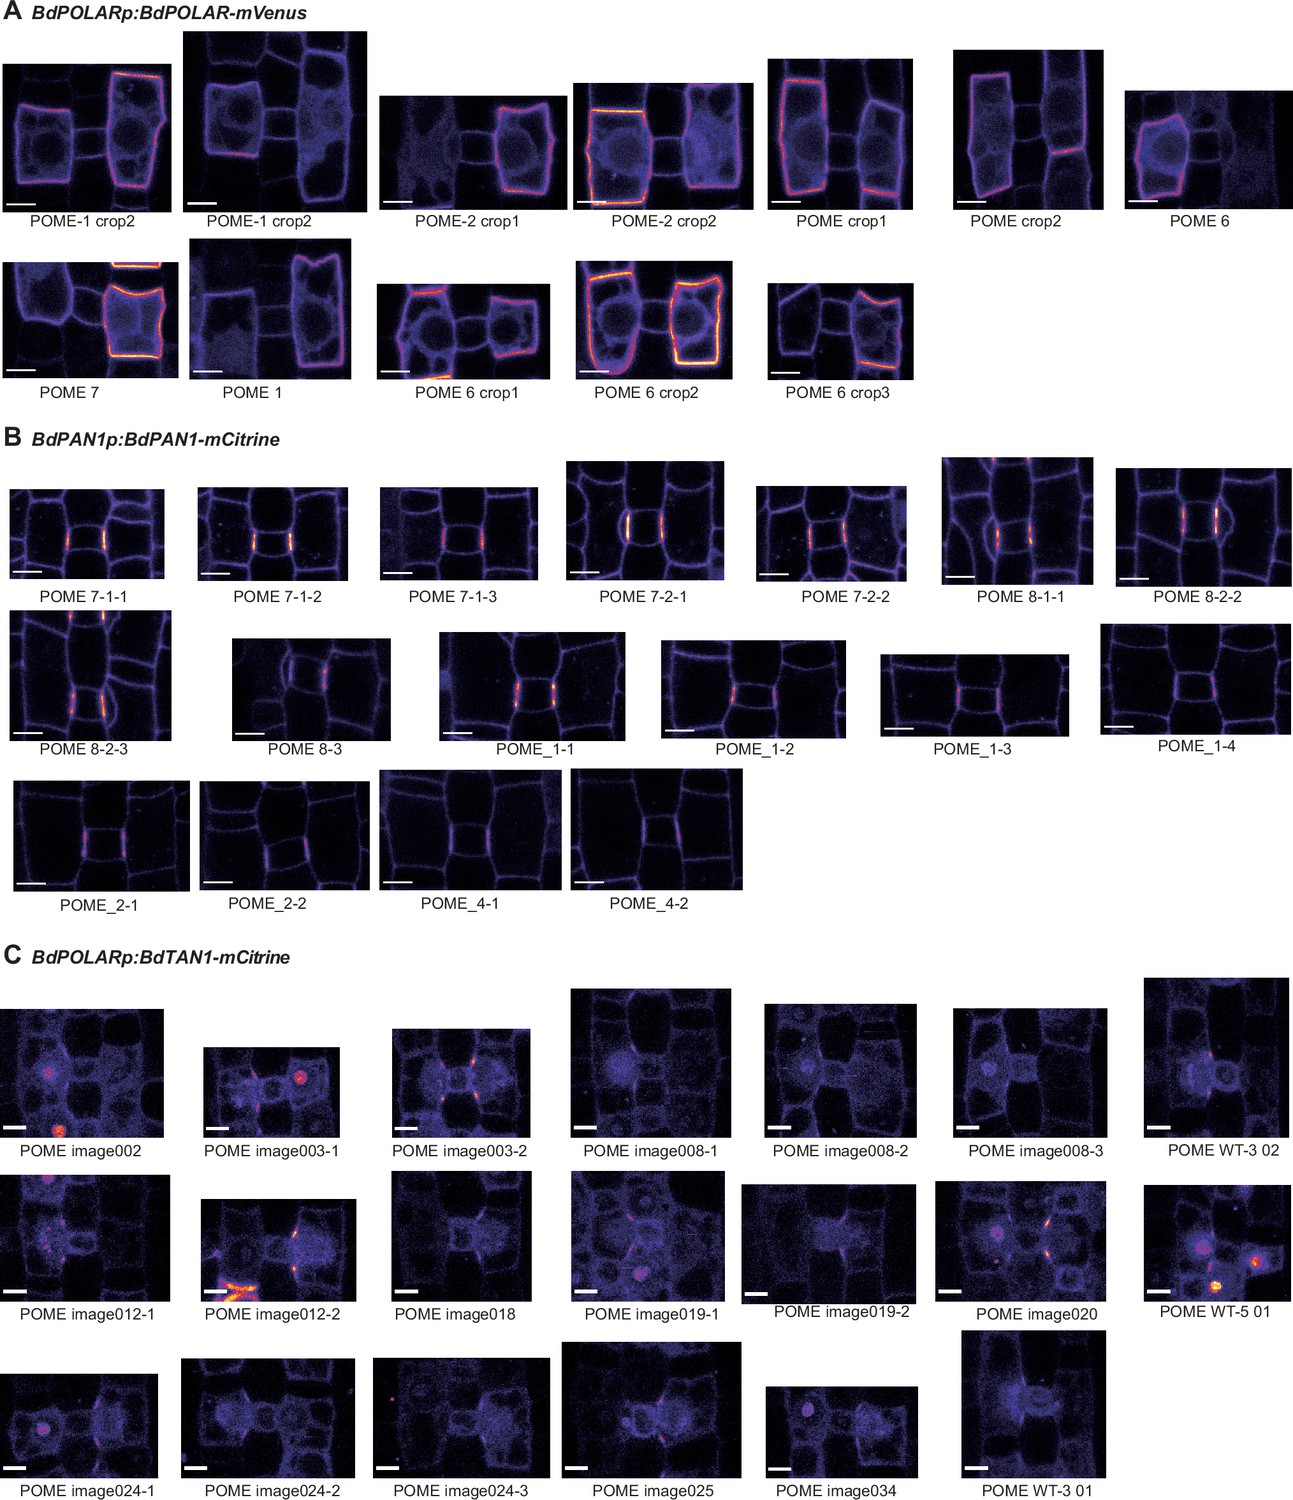
BdPAN1, BdPOLAR, and BdTAN1 reporter expression in representative subsidiary mother cells (SMCs).
(A–C) Different SMCs expressing either BdPAN1-YFP (A), BdPOLAR-mVenus (B), or BdTAN1-mCitrine (C). Depicted are SMCs of which circumference was manually traced to measure fluorescence intensity for Figure 2E and/or Figure 4I. Note that only SMCs that did not divide yet were measured. For Figure 2E, only SMCs with a length/width ratio (LWR) >0.8 for BdPAN1-YFP and LWR >0.9 for BdPOLAR-mVenus were included. Names of images correspond to names in the supplementary dataset 1. Confocal images shown are single focal planes midway from top to bottom. Scale bar, 5 µm.
Figure 3 with 1 supplement
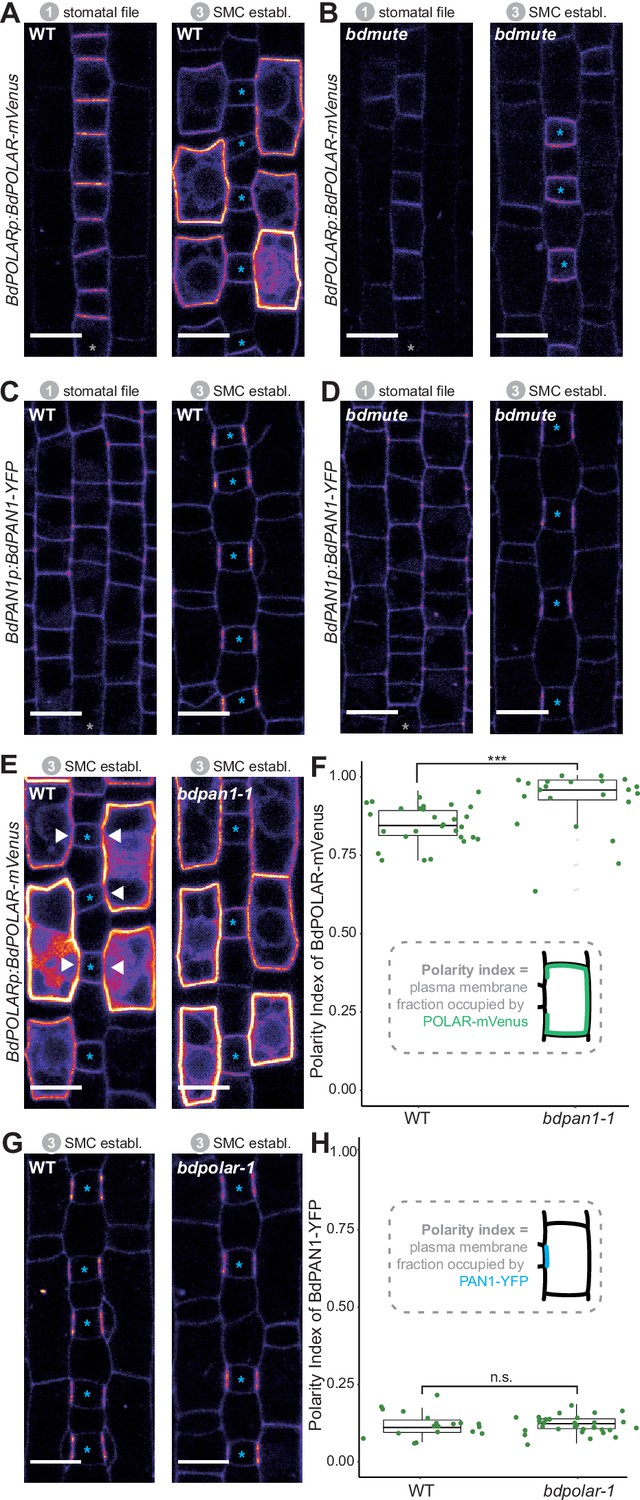
BdPOLAR expression requires BdMUTE, and BdPOLAR polarisation is controlled by BdPAN1.
(A, B) Fluorescence intensity of BdPOLARp:BdPOLAR-mVenus in wild type (WT) (A) and in bdmute (B) at stage 1 and stage 3. (C, D) Fluorescence intensity of BdPAN1p:BdPAN1-YFP in WT (C) and in bdmute (D) at stage 1 and stage 3. (E) Fluorescence intensity of BdPOLARp:BdPOLAR-mVenus in WT (left) and bdpan1-1 (right) at stage 3. The absence of BdPOLAR-mVenus at guard mother cell (GMC)/subsidiary mother cell (SMC) interfaces in WT is indicated with white arrowheads. (F) Quantification of the polarity index of BdPOLAR-mVenus in WT (n=29 SMCs) and bdpan1-1 (n=22 SMCs). Insets represent that polarity index is the fraction of the plasma membrane (PM) occupied by the polarity protein. (G) Fluorescence intensity of BdPAN1p:BdPAN1-YFP in WT (left) and bdpolar-1 (right) at stage 3. (H) Quantification of the polarity index of BdPAN1-YFP in WT (n=19 SMCs) and bdpolar-1 (n=33 SMCs). Insets represent that polarity index is the fraction of the PM occupied by the polarity protein. Statistical difference was tested with an unpaired Mann-Whitney U-test; ***=p-value <0.001; n.s.=non-significant. The stomatal files are indicated with grey asterisks. GMCs are indicated with blue asterisks. Confocal images shown are single focal planes midway from top to bottom. Scale bar, 10 µm.
-
Figure 3—source data 1
Polarity measurement data.
- https://cdn.elifesciences.org/articles/79913/elife-79913-fig3-data1-v1.xlsx
Figure 3—figure supplement 1
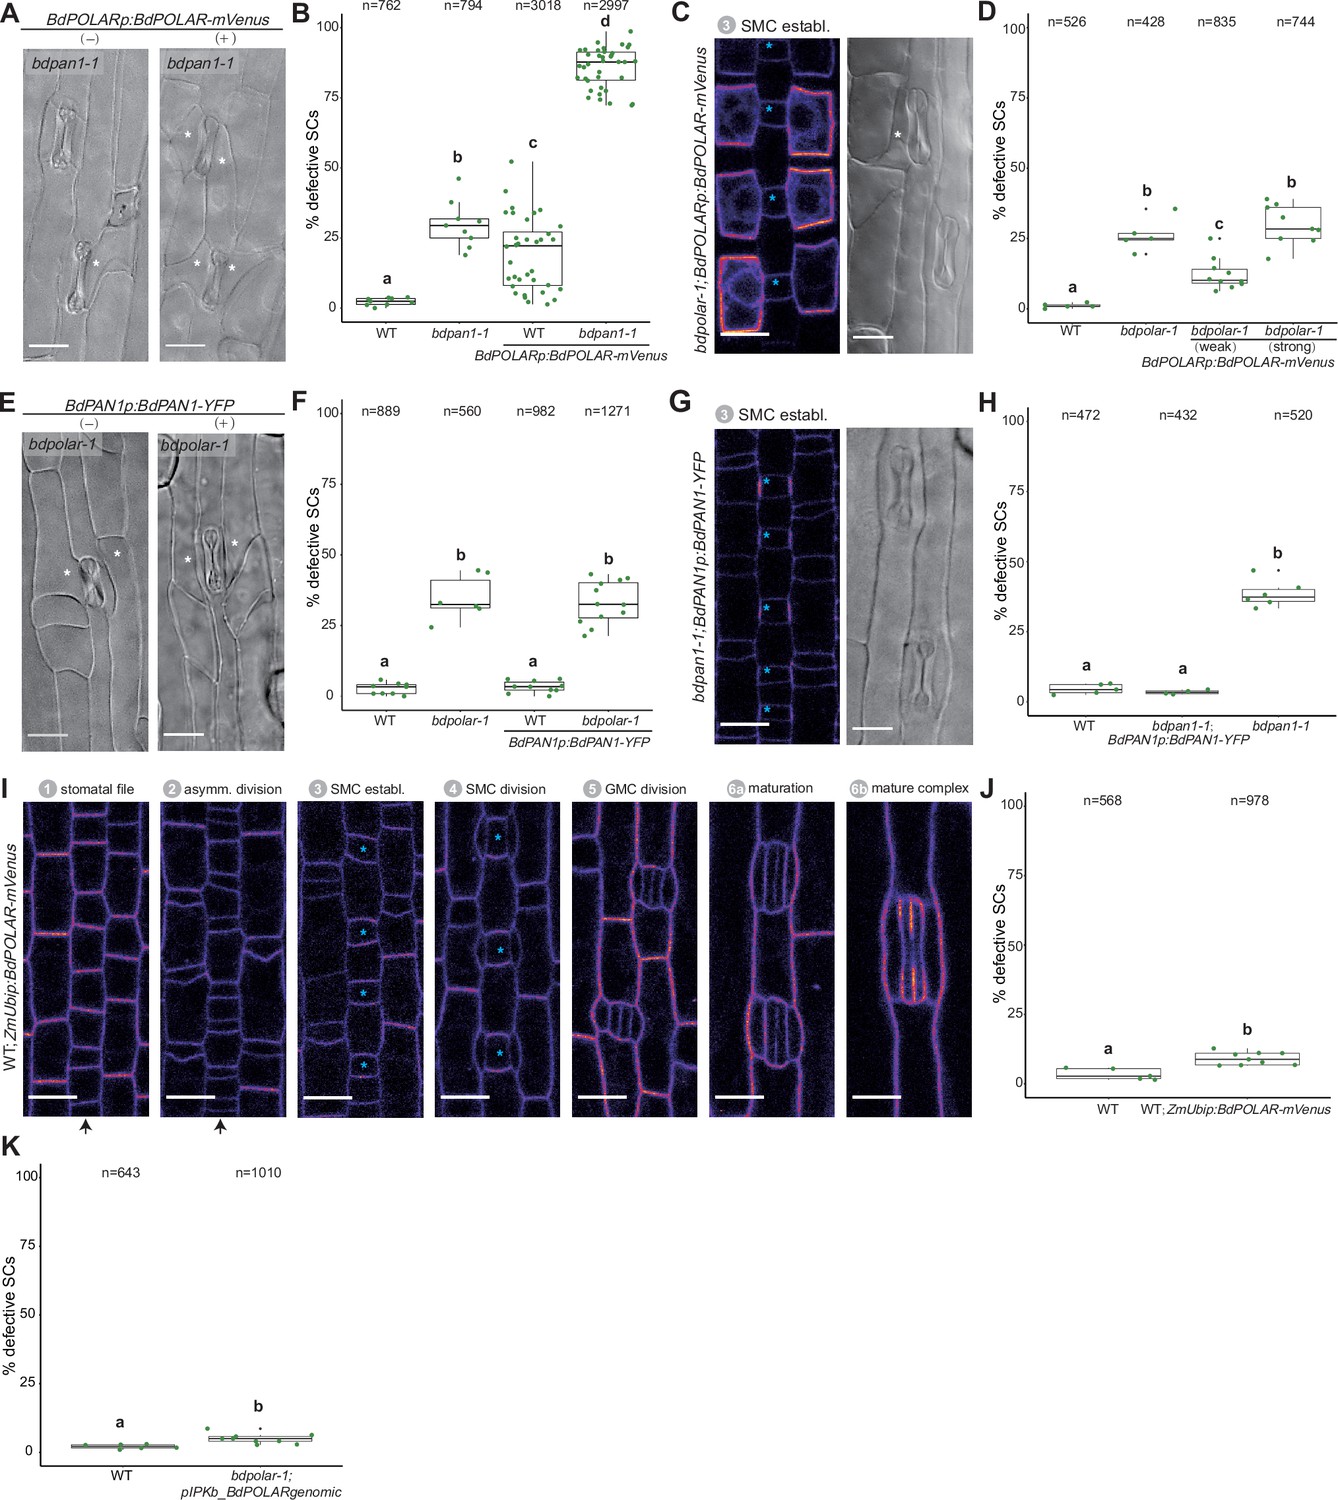
Dosage of BdPOLAR is crucial for its function.
(A) Differential interference contrast (DIC) images of the epidermis in bdpan1-1 with (+) or without (−) BdPOLARp:BdPOLAR-mVenus expression. (B) Quantifications of defective subsidiary cells (SCs) in wild type (WT) and bdpan1-1 with or without BdPOLARp:BdPOLAR-mVenus expression; n=9–38 individuals and 762–3018 SCs. (C) Fluorescence intensity image of BdPOLARp:BdPOLAR-mVenus in bdpolar-1, and DIC images (right) of the mature epidermis of bdpolar-1 complemented with BdPOLARp:BdPOLAR-mVenus. (D) Quantifications of defective SCs in WT, bdpolar-1 complemented with weakly and strongly expressed BdPOLARp:BdPOLAR-mVenus, and bdpolar-1 control. n=5–10 individuals and 428–835 SCs. (E) DIC images of the epidermis in bdpolar-1 with (+) or without (−) BdPAN1p:BdPAN1-YFP expression. (F) Quantifications of defective SCs in WT and bdpolar-1 with or without BdPAN1p:BdPAN1-YFP expression; n=6–12 individuals and 560–1271 SCs. (G) Fluorescence intensity image of BdPAN1p:BdPAN1-YFP in bdpan1-1 (left), and DIC images of the epidermis in bdpan1-1 complemented with BdPAN1p:BdPAN1-YFP (right). (H) Quantifications of defective SCs of WT, bdpan1-1 complemented with BdPAN1p:BdPAN1-YFP, and bdpan1-1 control. Data for WT is the same as in Figure 3—figure supplement 1D, and data for bdpan1-1 control is the same as in Figure 1D. n=4–6 individuals and 432–520 SCs. (I) Fluorescence intensity image for ZmUbip:BdPOLAR-mVenus reporter expression during stomatal development. Stages are indicated. (J) Quantifications of defective SCs of WT and WT with ZmUbip:BdPOLAR-mVenus expression; n=5–9 individuals and 568–978 SCs. (K) Quantification of aberrant SCs in bdpolar-1 complemented with untagged BdPOLAR (pIPK_BdPOLARgenomic) in T0 plants. Note that the WT data is from Figure 1D. Samples were compared using a one-way ANOVA and post hoc Tukey test for multiple comparisons; different letters indicate significant differences (p<0.05). For comparisons between two groups, a Welch t-test was used; ***=p-value<0.001. Aberrant SCs are indicated with white asterisks. The stomatal files are indicated with black arrows. Guard mother cells (GMCs) are indicated with blue asterisks. Confocal images shown are single focal planes midway from top to bottom. Scale bar in DIC images, 15 µm; Scale bar in confocal images, 10 µm.
-
Figure 3—figure supplement 1—source data 1
Quantification of dosage effects of BdPOLAR-mVenus in different genetic backgrounds.
- https://cdn.elifesciences.org/articles/79913/elife-79913-fig3-figsupp1-data1-v1.xlsx
Figure 4 with 2 supplements
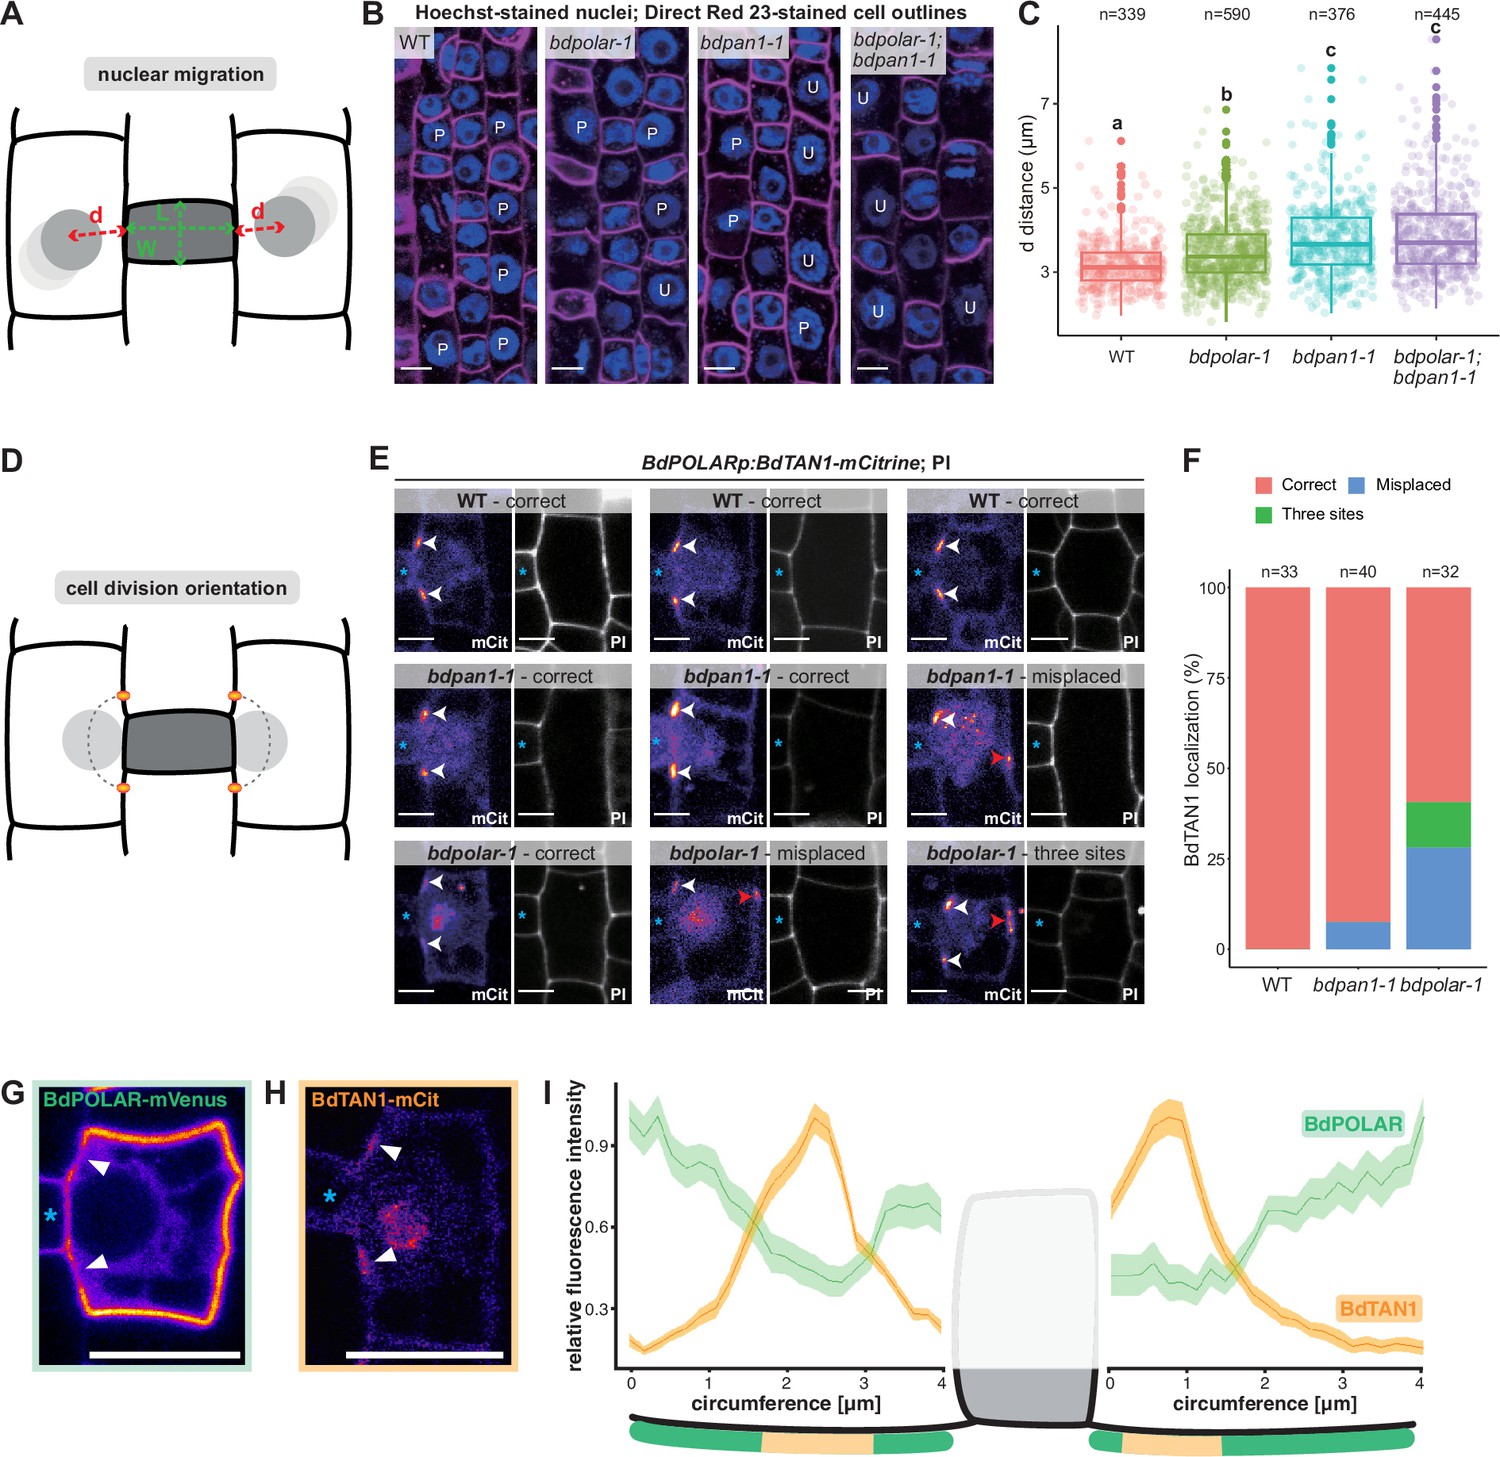
BdPAN1 promotes nuclear migration, and BdPOLAR guides cortical cell division orientation in subsidiary mother cells (SMCs).
(A) Schematic of the quantification of nuclear migration. L: guard mother cell (GMC) length; W: GMC width; d: the distance between the nuclear centre and the middle of the GMC/SMC interface. (B) Single confocal plane images of Hoechst-stained nuclei and Direct Red 23-stained cell outlines of stage 3 to stage 4 SMCs in wild type (WT), bdpolar-1, bdpan1-1, and bdpolar-1;bdpan1-1; P, polarised nucleus; U, unpolarised nucleus. Scale bar, 10 µm. (C) Quantification of d in SMCs of WT, bdpolar-1, bdpan1-1, and bdpolar-1;bdpan1-1; only SMCs flanking GMCs with a length/width ratio >0.9 are shown. Numbers of SMCs measured are indicated; n=20–28 individuals per genotype. Samples were compared using a one-way ANOVA and post hoc Tukey test for multiple comparisons; different letters indicate significant differences (p<0.05). (D) Schematic showing future division plane and expected BdTAN1 localisation (orange) at the cortical division site. (E) BdPOLARp:BdTAN1-mCitrine expressed in WT, bdpan1-1, and bdpolar-1; three different SMCs are shown per genotype. Correct BdTAN1-mCitrine localisation is indicated with white arrowheads; misplaced cortical division sites are indicated with red arrowheads. Note that BdTAN1-mCitrine signal is also present in SMC nuclei and nucleoli. GMCs are indicated with blue asterisks. Scale bar, 5 µm. (F) Percentages of correct, misplaced, and three cortical division sites in WT, bdpolar-1, and bdpan1-1; the numbers of SMCs analysed are indicated; n=8–10 individuals for WT and bdpan1-1 and 5 individuals for bdpolar-1. (G, H) Representative image of an SMC expressing BdPOLAR-mVenus (G) or BdTAN1-mCitrine (H). Arrowheads point to the regions where BdPOLAR-mVenus signal is absent (H), and BdTAN1-mCitrine signal is present (G). Scale bar, 10 µm. (I) Manually traced, normalised fluorescence intensity at the SMC plasma membrane of BdPOLAR-mVenus lines (n=8, same data as in Figure 2E) and BdTAN1-mCitrine lines (n=13). Average fluorescence intensity normalised to the average max grey intensity, 4 µm before and after the GMC were plotted; fluorescence intensity values along the GMC/SMC interface were removed as GMC length differs for each measurement. The schematic model below the plot indicates what is shown. Confocal images shown are single focal planes midway from top to bottom.
-
Figure 4—source data 1
Quantification of cellular defects in bdpolar-1, bdpan1-1, and bdpolar-1;bdpan1-1.
- https://cdn.elifesciences.org/articles/79913/elife-79913-fig4-data1-v1.xlsx
Figure 4—figure supplement 1
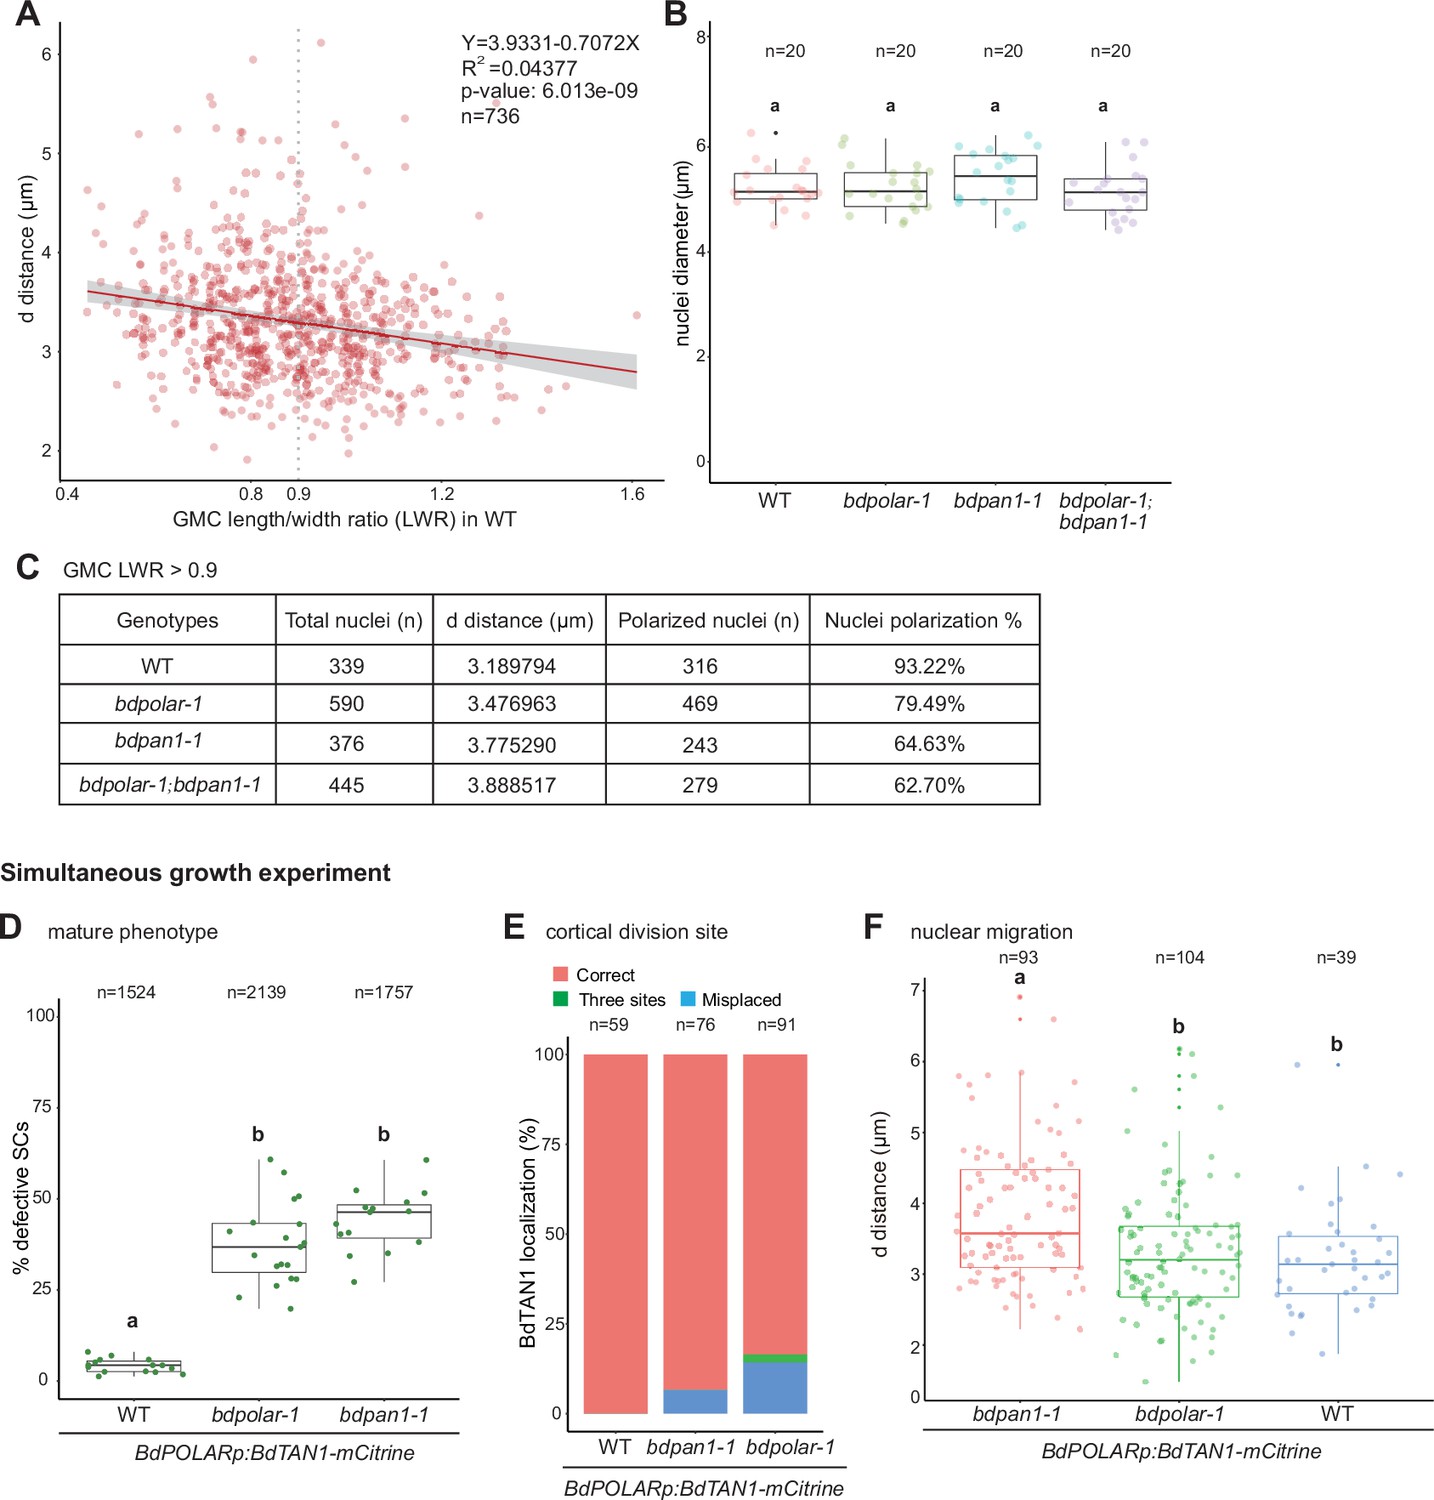
BdPAN1 controls nuclear polarisation.
(A) Scatter plot displaying d distance (µm; y-axis) as a function of guard mother cell (GMC) length/width ratio (LWR; x-axis) in subsidiary mother cells (SMCs) of wild type (WT; n=736 SMCs). Grey dashed line indicates GMC LWR = 0.9. The linear regression is indicated and the regression equation, R2 value, and p-value are indicated at the top right. (B) Quantification of the SMC nuclei diameter in WT, bdpolar-1, bdpan1-1, and bdpolar-1;bdpan1-1 (n=20 SMCs). Samples were compared using a one-way ANOVA and post hoc Tukey test for multiple comparisons; different letters indicate significant differences (p<0.05). (C) Summary table of total number of quantified nuclei, average distance (d [µm]) when GMC LWR >0.9, and number and percentage of nuclei within 4 µm range when GMC LWR >0.9 (=polarised nuclei) in WT, bdpolar-1, bdpan1-1, and bdpolar-1;bdpan1-1. (D–F) Reanalysis of cellular and mature phenotypes in simultaneously grown BdPOLARp:BdTAN1-mCitrine lines in WT, bdpolar-1, and bdpan1-1. Panels show mature aberrant subsidiary cell phenotype of the third leaf at 19 dag (D), TAN1 localisation as a proxy for cortical division site formation in the developing zone of the second leaf 5–6 dag (E), and nuclear migration phenotype of the very same second leaves at 5–6 dag (F); n=19 WT, 23 bdpolar-1, and 20 bdpan1-1 individuals. Samples were compared using a one-way ANOVA and post hoc Tukey test for multiple comparisons; different letters indicate significant differences (p<0.05).
-
Figure 4—figure supplement 1—source data 1
Quantification of cellular parameters and cellular defects in bdpolar-1, bdpan1-1, and bdpolar-1;bdpan1-1.
- https://cdn.elifesciences.org/articles/79913/elife-79913-fig4-figsupp1-data1-v1.xlsx
Figure 4—figure supplement 2
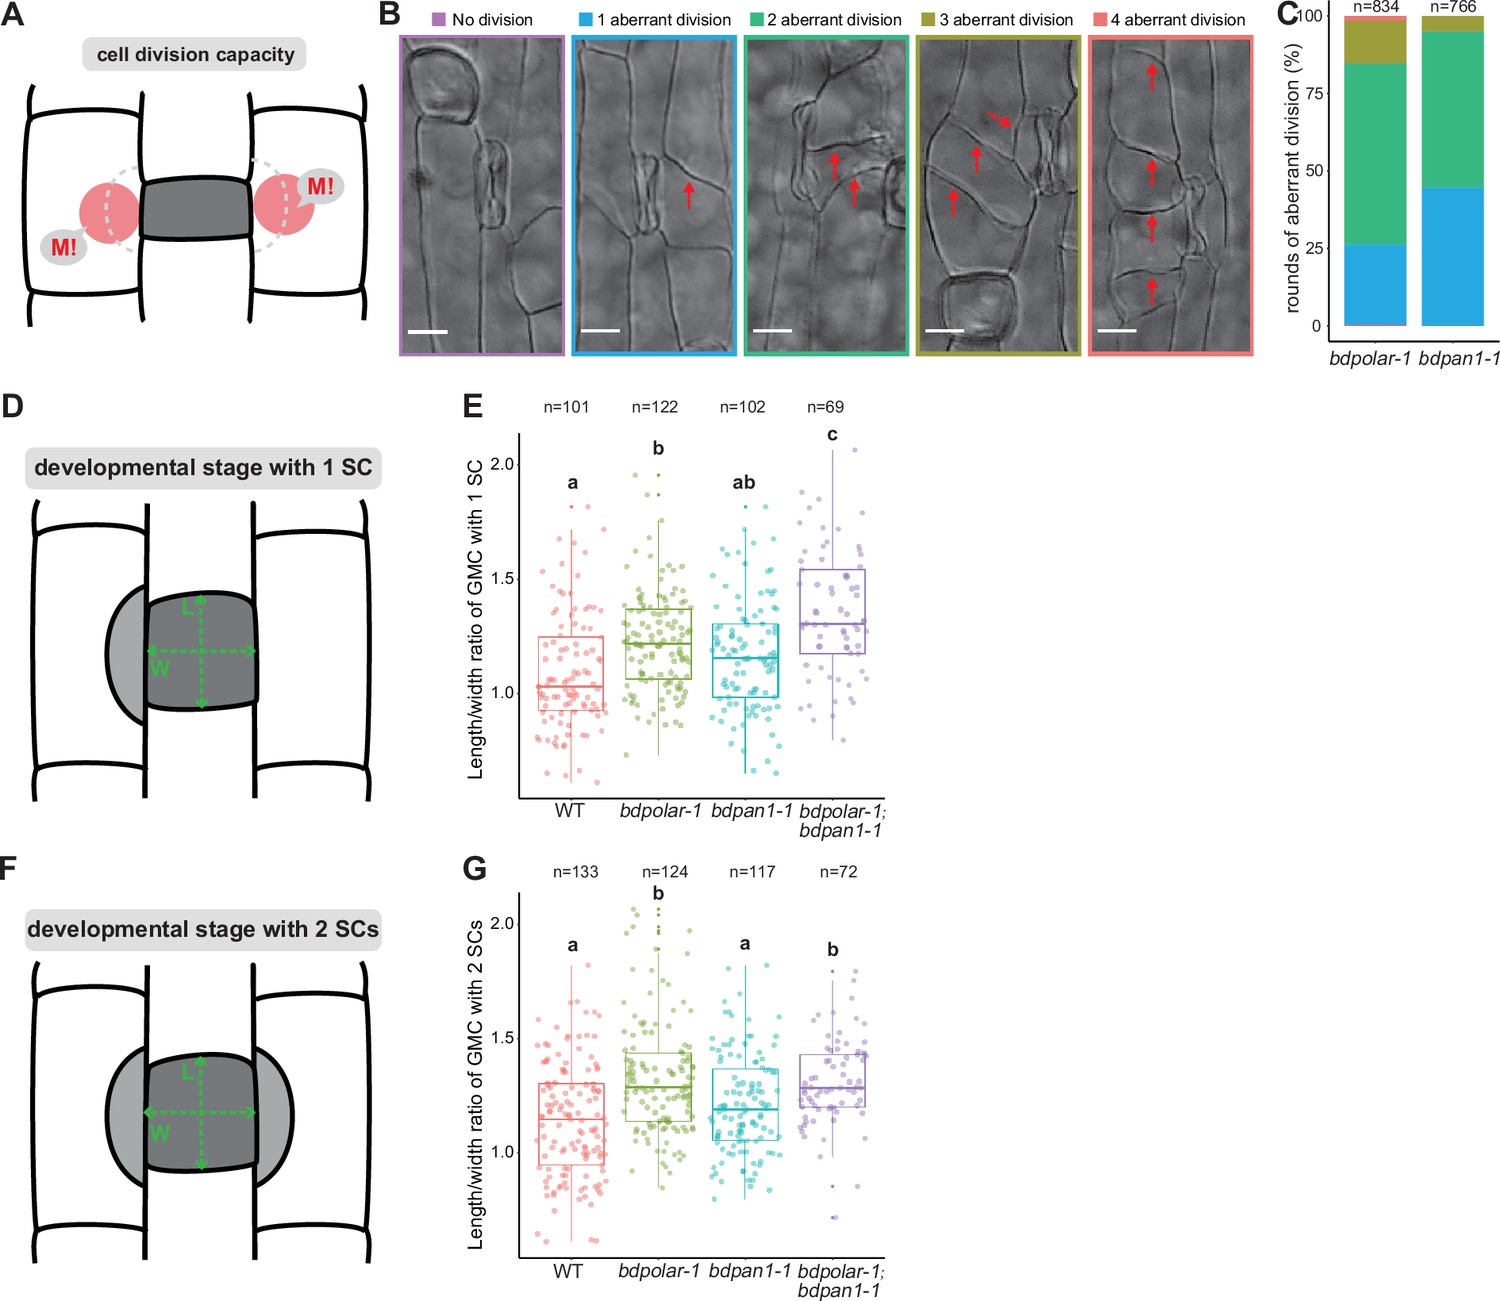
Cell division capacity is increased in subsidiary mother cell (SMC) polarity mutants.
(A) Diagram indicating SMC division potential (M!). (B) Differential interference contrast images of different SMC division frequencies observed in the mature leaf epidermis of bdpolar-1;bdpan1-1; no division (purple), one aberrant division (blue), two aberrant divisions (green), three aberrant divisions (olive); four aberrant divisions (red). The division planes are indicated with red arrows. Scale bar, 10 µm. (C) Percentages of different SMC division categories in bdpolar-1 and bdpan1-1; numbers of SMCs analysed are indicated. (D, F) Schematic showing guard mother cells (GMCs) that recruited one (A) or two subsidiary cells (SCs) (C). L: GMC length; W: GMC width. (E, G) Quantifications of GMC length/width ratio in wild type (WT), bdpolar-1, bdpan1-1, and bdpolar-1;bdpan1-1 when GMCs recruited one (E) and two SCs (G); samples were compared using a one-way ANOVA and post hoc Tukey test for multiple comparisons; different letters indicate significant differences (p<0.05). Numbers of GMCs analysed are indicated.
-
Figure 4—figure supplement 2—source data 1
Quantification of division capacity in bdpolar-1 and bdpan1-1.
- https://cdn.elifesciences.org/articles/79913/elife-79913-fig4-figsupp2-data1-v1.xlsx
Figure 5 with 1 supplement
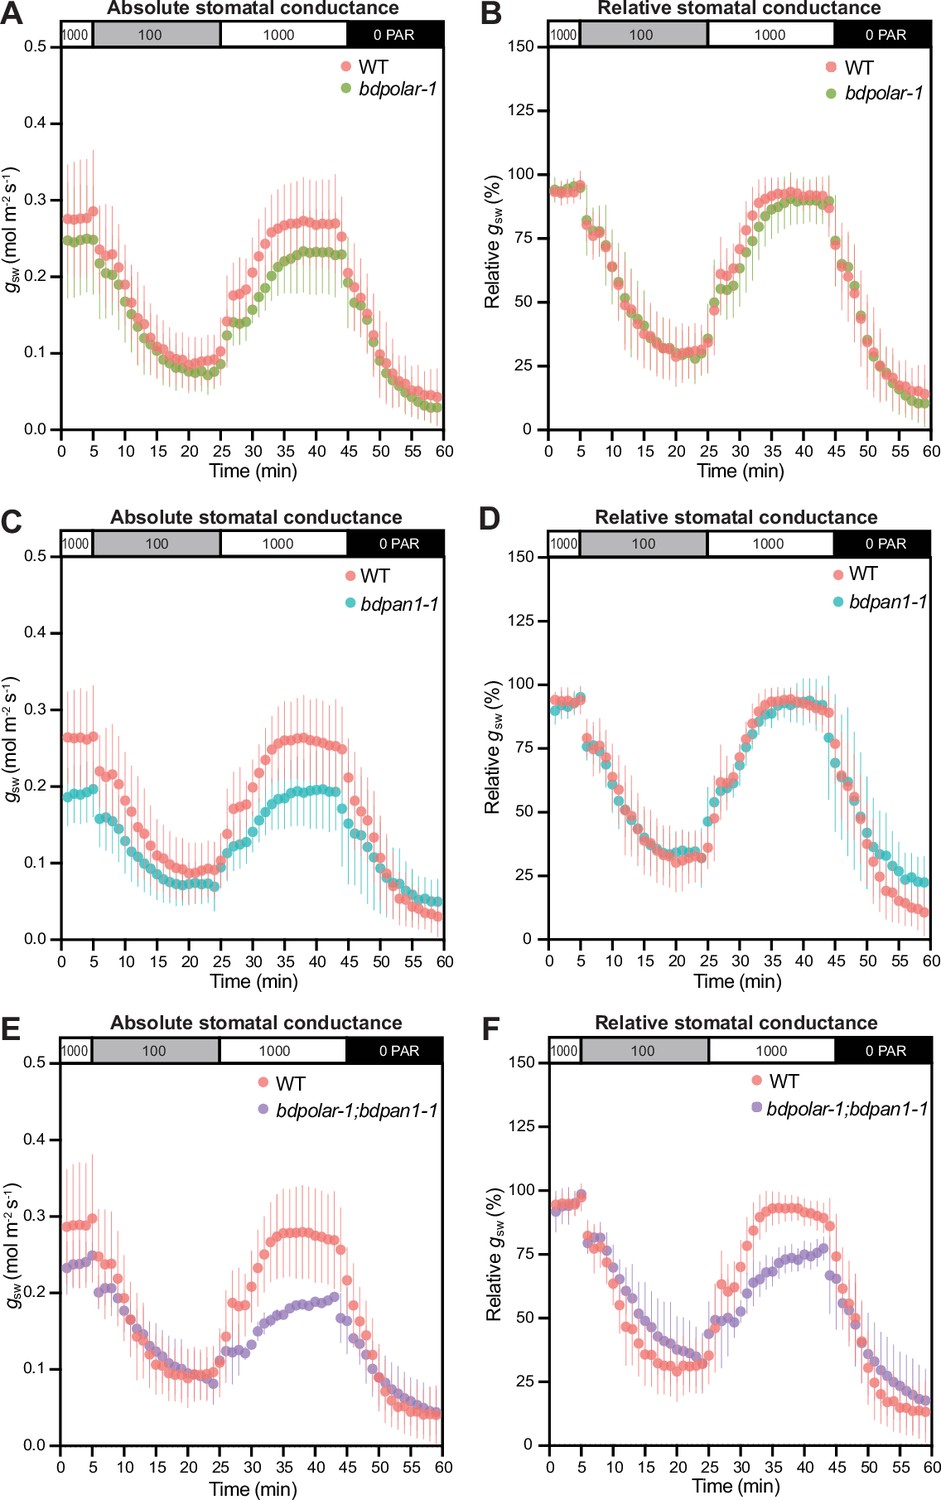
Wrongly divided subsidiary cells affect stomatal gas exchange levels and kinetics.
(A, C, and E) Absolute stomatal conductance (gsw) in response to light transitions (1000 photosynthetic active radiation [PAR] - 100 PAR - 1000 PAR - 0 PAR) in bdpolar-1 (A), bdpan1-1 (C), and bdpolar-1; bdpan1-1 (E) compared to paired wild-type (WT) measurements. (B, D, and F) Relative stomatal conductance (gsw normalised to highest gsw observed) in response to light transitions (1000 PAR - 100 PAR - 1000 PAR - 0 PAR) in bdpolar-1 (B), bdpan1-1 (D), and bdpolar-1; bdpan1-1 (F) compared to paired WT measurements. n=5 individuals per mutant genotype and 7 WT individuals. Error bars represent standard deviation.
-
Figure 5—source data 1
Stomatal conductance data in wild type, bdpolar-1, bdpan1-1, and bdpolar-1;bdpan1-1.
- https://cdn.elifesciences.org/articles/79913/elife-79913-fig5-data1-v1.xlsx
Figure 5—figure supplement 1
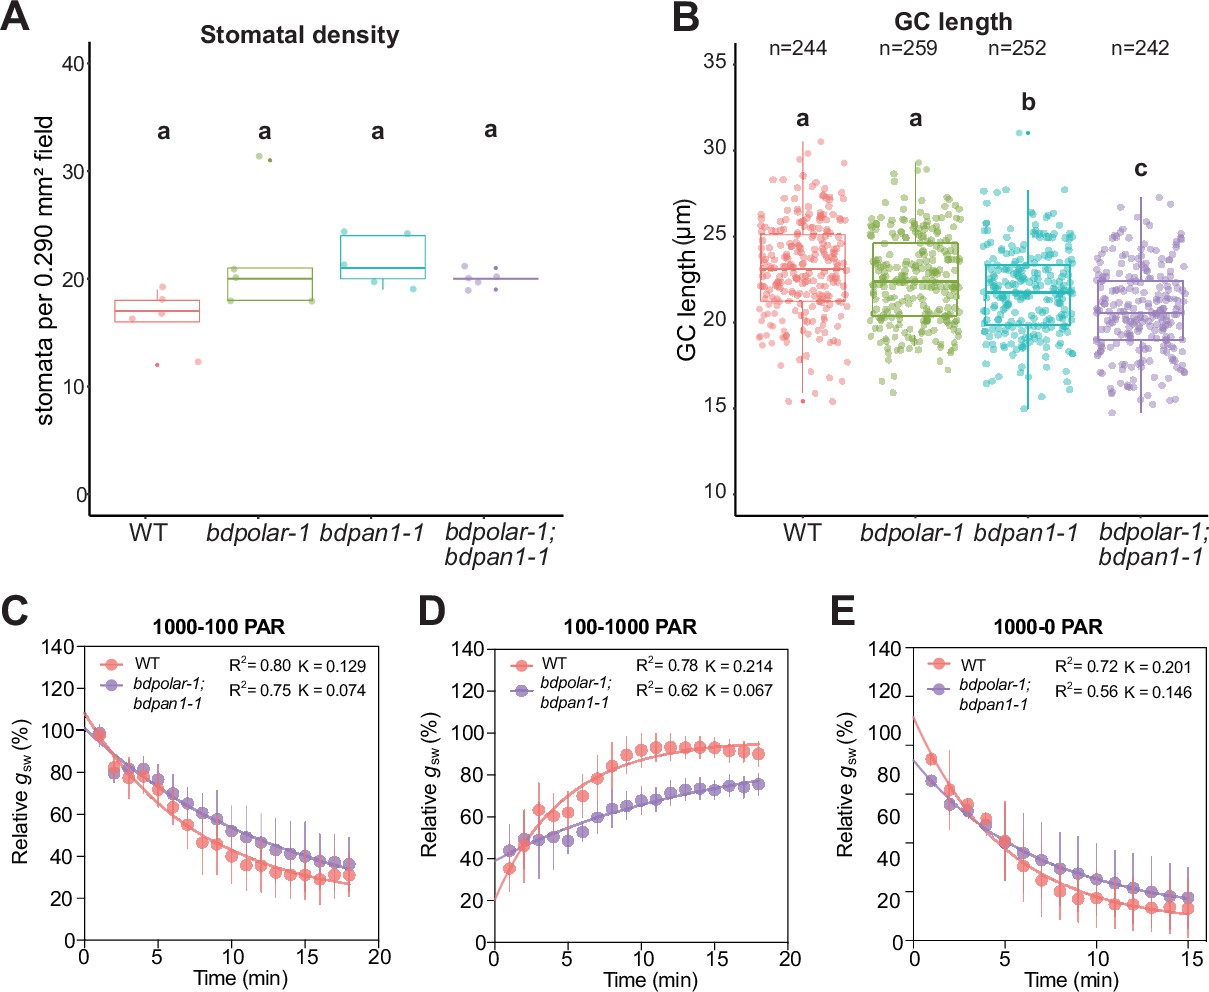
The stomatal density and guard cell (GC) length in wild type (WT), bdpolar-1, bdpan1-1, and bdpolar-1;bdpan1-1.
(A) Stomatal density was quantified using the leaf areas that were used for stomatal conductance measurements in Figure 5. n=5 individuals and 364–418 stomatal complexes. (B) GC length was quantified using the leaf areas that were used for stomatal conductance measurements in Figure 5. n=5 individuals and 242–259 GCs. (C) One-phase decay exponential regression for the transition 1000–100 photosynthetic active radiation (PAR; n=5 individuals). (D) One-phase association exponential regression for the transition 100–1000 PAR (n=5 individuals). (E) One-phase decay exponential regression for the transition 1000–0 PAR (n=5 individuals). R2 value and constant rate (K) are indicated. Samples were compared using a one-way ANOVA and post hoc Tukey test for multiple comparisons; different letters indicate significant differences (p<0.05).
-
Figure 5—figure supplement 1—source data 1
Stomatal anatomical parameters in wild type, bdpolar-1, bdpan1-1, and bdpolar-1;bdpan1-1.
- https://cdn.elifesciences.org/articles/79913/elife-79913-fig5-figsupp1-data1-v1.xlsx
Figure 6

A mechanistic model of subsidiary mother cell (SMC) polarisation by the two oppositely polarised BdPOLAR and BdPAN1 domains.
(A) Stages of subsidiary cell (SC) development. (1) SMC identity is established by BdMUTE and BdPAN1 polarises at the guard mother cell (GMC)/SMC interface independent of SMC establishment. (2) BdPOLAR is strongly expressed in SMCs and localises at the apical, basal, and distal plasma membrane (PM) of SMCs and is excluded from the BdPAN1 domain. The SMC nucleus migrates towards the GMC/SMC interface, and the cortical division sites are established above and below the GMC/SMC interface. (3) An asymmetric cell division generates a smaller SC and a larger pavement cell. BdPOLAR quickly dissociates from the PM and reorients towards the newly formed PM. (B) Cellular mechanisms of BdPAN1 and BdPOLAR in pre-mitotic SMCs. BdPAN1 guides the migration of the SMC nucleus towards its own domain. BdPAN1 actively inhibits BdPOLAR from entering its domain, either biochemically or by steric hindrance. Distal BdPOLAR prevents cortical division site factors from ectopically binding and forces it to form specifically where BdPOLAR protein level is low.
Tables
Key resources table
| Reagent type (species) or resource | Designation | Source or reference | Identifiers | Additional information |
|---|---|---|---|---|
| Strain, strain background (Brachypodium distachyon) | B. distachyon Bd21-3 v1 | Phytozome | Phytozome genome ID: 378 | Genetic background for all transgenic and mutant lines |
| Strain, strain background (Agrobacterium tumefaciens) | AGL1 | Provided by John Vogel, JGI-DOE; Bragg et al., 2015 | AGL1 | Chemically competent cells |
| Gene (B. distachyon) | BdPOLAR | Phytozome | BdiBd21-3.3G0715200 | |
| Gene (B. distachyon) | BdPAN1 | Phytozome | BdiBd21-3.3G0526300 | |
| Genetic reagent (B. distachyon) | bdmute-1 | Raissig et al. 2007 | EMS-mutagenised | |
| Genetic reagent (B. distachyon) | bdpan1-1 | This paper | EMS-mutagenised, details see Methods below, available upon request from our lab | |
| Genetic reagent (B. distachyon) | bdpolar-1; bdpolar-2; bdpolar-3 | This paper | CRISPR/Cas9, details see Methods below, available upon request from our lab | |
| Genetic reagent (B. distachyon) | BdPOLARp:BdPOLAR-mVenus in wild type/bdmute | This paper | Tissue culture, details see Methods below, available upon request from our lab | |
| Genetic reagent (B. distachyon) | BdPOLARp:BdPOLAR-mVenus in bdpolar-1/bdpan1-1 | This paper | Crossing, details see Methods below, available upon request from our lab | |
| Genetic reagent (B. distachyon) | BdPOLARp:3XNLS-eGFP/ ZmUbiIp:BdPOLAR-mVenus/ BdPAN1p:BdPAN1-YFP in wild type | This paper | Tissue culture, details see Methods below, available upon request from our lab | |
| Genetic reagent (B. distachyon) | BdPAN1p:BdPAN1-YFP in bdmute | This paper | Tissue culture, details see Methods below, available upon request from our lab | |
| Genetic reagent (B. distachyon) | BdPAN1p:BdPAN1-YFP in bdpan1-1/bdpolar-1 | This paper | Crossing, details see Methods below, available upon request from our lab | |
| Genetic reagent (B. distachyon) | BdPOLARp:BdTAN1-mCitrine in wild type/ bdpan1-1/bdpolar-1 | This paper | Tissue culture, details see Methods below, available upon request from our lab | |
| Recombinant DNA reagent | BdPOLARp:BdPOLAR-mVenus (plasmid) | This paper | Greengate construct in pGGZ004, details see Methods below, available upon request from our lab | |
| Recombinant DNA reagent | BdPAN1p:BdPAN1-YFP (plasmid) | This paper | Greengate construct in pGGZ004, details see Methods below, available upon request from our lab | |
| Recombinant DNA reagent | BdPOLARp:3XNLS-eGFP (plasmid) | This paper | Greengate construct in pGGZ004, details see Methods below, available upon request from our lab | |
| Recombinant DNA reagent | ZmUbiIp:BdPOLAR-mVenus (plasmid) | This paper | Greengate construct in pGGZ004, details see Methods below, available upon request from our lab | |
| Recombinant DNA reagent | BdPOLARp:BdTAN1-mCitrine (plasmid) | This paper | Gibson construct in pIPKb001t Greengate construct in pGGZ004, details see Methods below, available upon request from our lab | |
| Commercial assay, kit | RNeasy Plant Mini kit | Qiagen | ||
| Commercial assay, kit | LR recombination | Invitrogen | ||
| Commercial assay, kit | DNeasy Plant Mini Kit | Qiagen | Cat# 69104 | |
| Commercial assay, kit | Mini-prep Kit NucleoSpin Plasmid Kit | Macherey-Nagel | Cat# 740588.250 | |
| Commercial assay, kit | NucleoSpin Gel and PCR Clean-up Kit | Macherey-Nagel | Cat#740609.250 | |
| Commercial assay, kit | Gibson Assembly Master Mix Kit | NEB | Cat# M5510A | |
| Chemical compound, drug | Q5 High-Fidelity DNA Polymerase | NEB | Cat# M0491L | |
| Chemical compound, drug | Taq DNA Polymerase | NEB | Cat# M0273X | |
| Chemical compound, drug | T4 DNA ligase | Thermo Fisher Scientific | Cat# EL0014 | |
| Chemical compound, drug | FastDigest Eco31I | Thermo Fisher Scientific | Cat# FD0294 | |
| Chemical compound, drug | HindIII | Thermo Fisher Scientific | Cat# ER0501 | |
| Chemical compound, drug | OIiI | Thermo Fisher Scientific | Cat# ER1631 | |
| Chemical compound, drug | Hoechst 33342 | Thermo Fisher Scientific | Cat# 62249 | |
| Chemical compound, drug | Direct red 23 | Sigma-Aldrich | Cat# 3441-14-3 | |
| Chemical compound, drug | Propidium iodide (PI) | Thermo Fisher Scientific | 10 μg/ml | |
| Software, algorithm | R v.3.6.0 | R Development Core Team, 2022 | https://cran.r-project.org/bin/ windows/base/old/3.6.0/ | |
| Software, algorithm | CRISPR-P 2.0 | National Key Laboratory of Crop Genetic Improvement and Center for Bioinformatics, Huazhong Agricultural University | http://crispr.hzau.edu.cn/cgi-bin/CRISPR2/CRISPR | |
| Software, algorithm | Fiji | Schindelin, J et al., 2012 | https://imagej.net/software/fiji/ | |
| Software, algorithm | Prism | GraphPad | https://www.graphpad.com |
Additional files
-
Supplementary file 1
Differentially expressed genes in bdmute developing leaf zones.
- https://cdn.elifesciences.org/articles/79913/elife-79913-supp1-v1.xlsx
-
Supplementary file 2
Primers used in this study.
- https://cdn.elifesciences.org/articles/79913/elife-79913-supp2-v1.xlsx
-
MDAR checklist
- https://cdn.elifesciences.org/articles/79913/elife-79913-mdarchecklist1-v1.docx
Download links
A two-part list of links to download the article, or parts of the article, in various formats.
Downloads (link to download the article as PDF)
Open citations (links to open the citations from this article in various online reference manager services)
Cite this article (links to download the citations from this article in formats compatible with various reference manager tools)
Opposite polarity programs regulate asymmetric subsidiary cell divisions in grasses
eLife 11:e79913.
https://doi.org/10.7554/eLife.79913


