NaV1.1 is essential for proprioceptive signaling and motor behaviors
- Department of Physiology and Membrane Biology, University of California, Davis, United States
- Department of Biological Science, San Jose State University, United States
- Department of Pharmacology, Physiology, and Neuroscience, New Jersey Medical School, Rutgers University, United States
- Undergraduate Program in Psychology, University of California, Davis, United States
- Neurobiology Course, Marine Biological Laboratory, United States
Figures
Figure 1
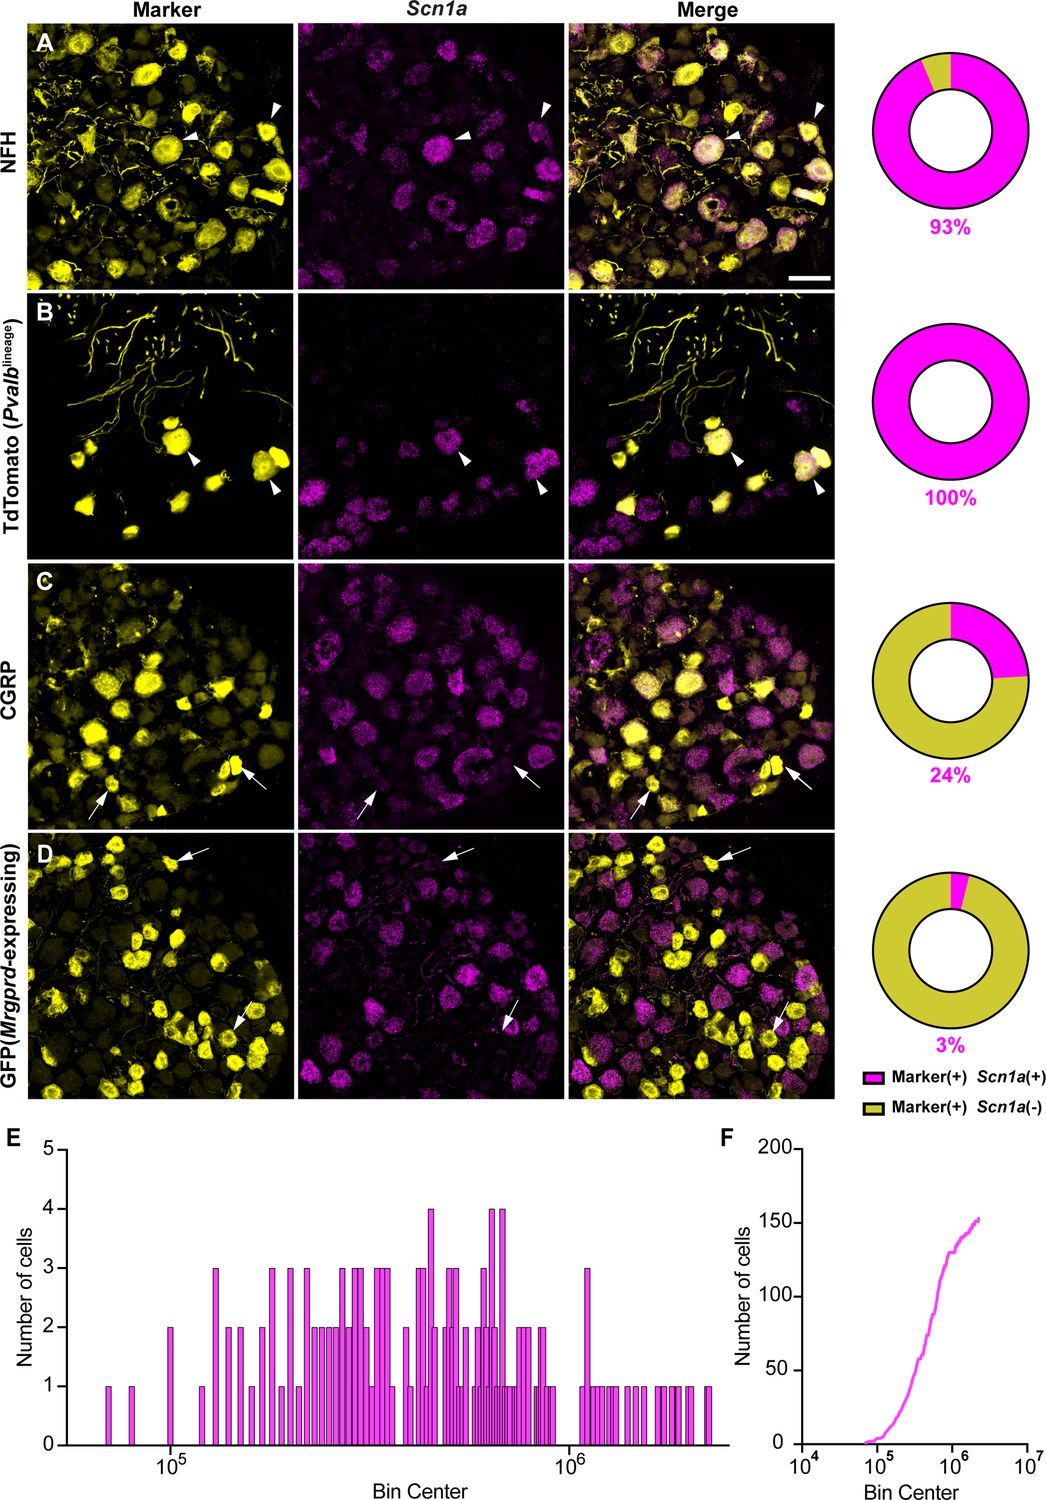
NaV1.1 is ubiquitously expressed in genetically identified proprioceptors.
(A–D) Representative confocal images of cryoprotected adult dorsal root ganglia (DRG) sections (25 μm) with pie chart quantifications indicating the percentage of Scn1a+ and Scn1a- neurons in each subpopulation (magenta and yellow, respectively). Images were acquired with a ×40, 0.9 NA water-immersion objective. Sections were hybridized using RNAscope with probes targeting Scn1a (Scn1a, magenta) and stained with the following antibodies (yellow): (A) anti-neurofilament heavy (NFH, n = 787), (B) anti-DsRed to label TdTomato+ proprioceptors (n = 153), (C) anti-calcitonin gene-related peptide (CGRP, n = 877), and (D) anti-GFP to label Mrgprd+ neurons (n = 744). DRG from C57BL/6, PvalbCre;Rosa26Ai14, and MrgprdGFP mice of both sexes were used. Scale bar 50 μm. White arrowheads indicate Scn1a+ neurons while white arrows indicate Scn1a- neurons. Frequency (E) and cumulative (F) distribution plots of integrated fluorescence density of the Scn1a signal in TdTomato+ proprioceptors (n = 153). n = cells.
Figure 2 with 1 supplement
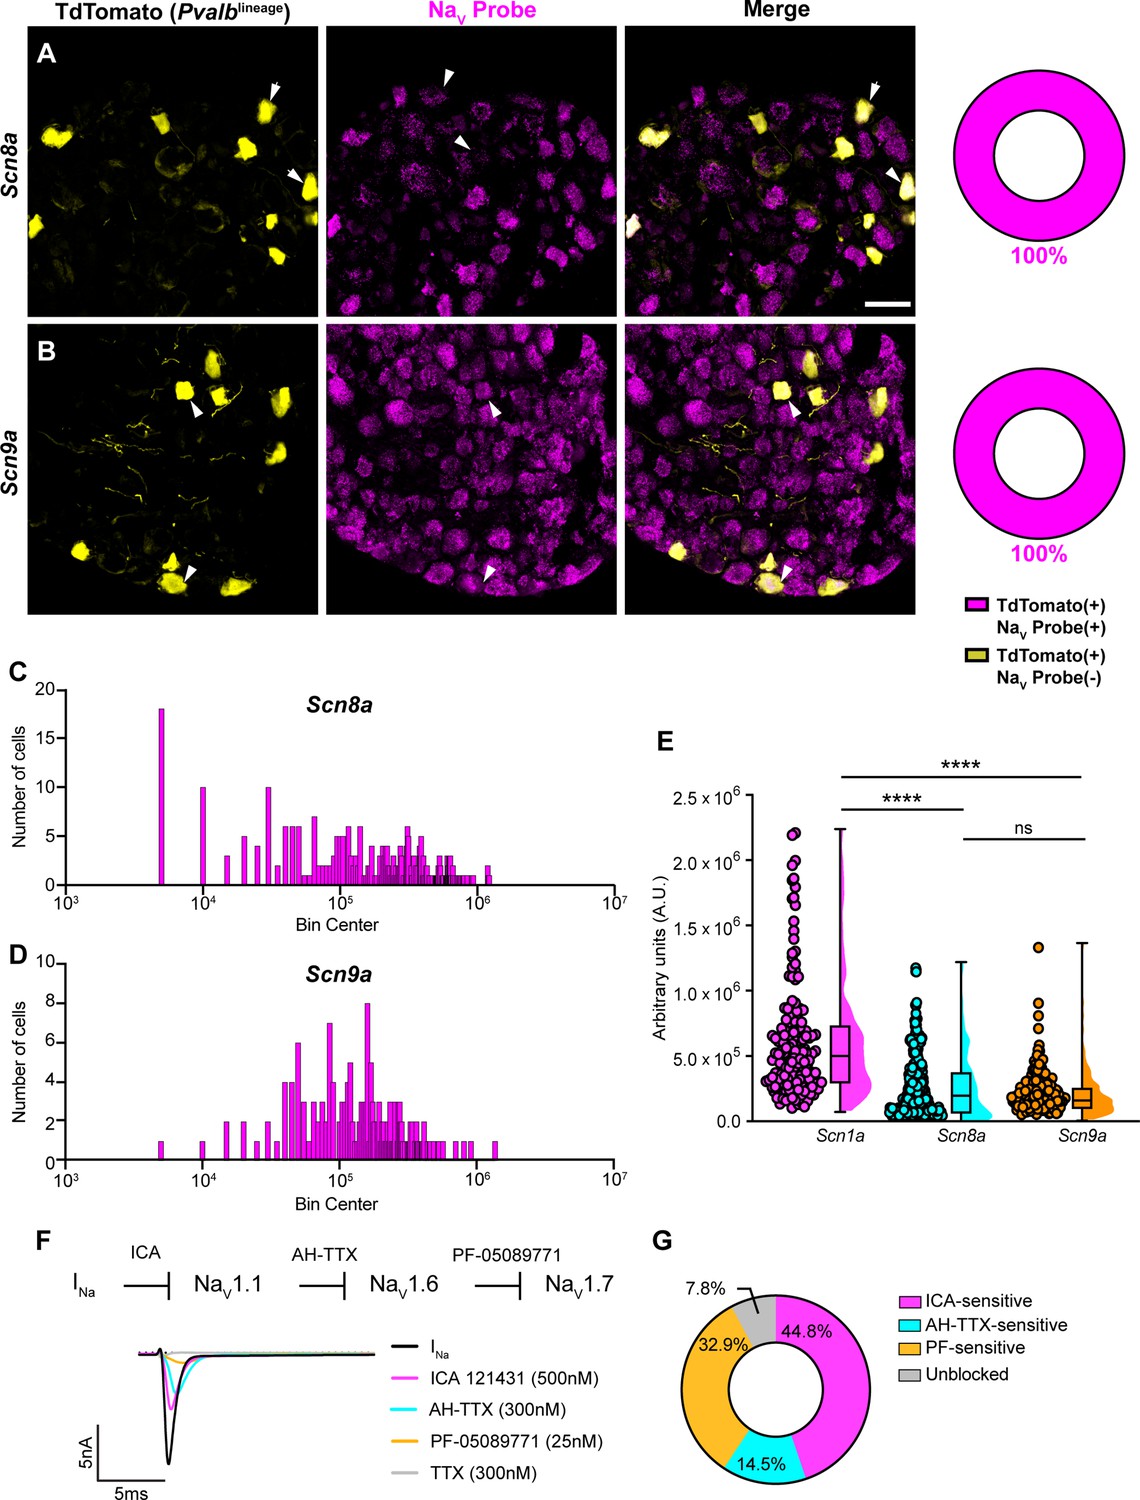
Transcriptomic and functional expression of sodium channels in proprioceptors.
(A, B) Representative confocal images of cryoprotected adult dorsal root ganglia (DRG) sections (25 μm) with quantifications indicating the percentage of NaV+ and NaV- neurons in TdTomato+ proprioceptors. Sections were hybridized using RNAscope with probes targeting NaV1.6 or NaV1.7 (Scn8a and Scn9a, respectively, magenta) and stained with anti-DsRed (yellow). (A) Snc8a, n = 298, (B) Scn9a, n = 166. Scale bar set to 50 μm. White arrowheads indicate NaV+ neurons. (C–, D) Frequency distribution plots of integrated fluorescence density of NaV1.6 and NaV1.7 mRNA in TdTomato+ proprioceptors, respectively. (E) The average integrated density of Scn1a, Scn8a, and Scn9a RNAscope probe signal. Dots represent individual cells. Statistical significance was determined using a Kruskal–Wallis test with Dunn’s post-hoc comparisons. (F) Top: experimental workflow of serial pharmacological blockade of NaV channels expressed in proprioceptors. We first elicited a whole-cell sodium current in the absence of drug. We next bath applied 500 nM of ICA 121431 to block current carried by NaV1.1. Subsequently, we bath applied 9-anhydroustetrodoxin (AH-TTX) (300 nM) to block NaV1.6-mediated current, and PF-05089771 (25 nM) to block the NaV1.7-mediated current. Finally, tetrodotoxin (TTX) (300 nM) was used to block residual current and to confirm there was no contribution of TTX-resistant NaVs in proprioceptors. Bottom: representative current traces following application of NaV-selective inhibitors. All drugs were applied for 1 min. (G) Quantification of the average percentage of the whole-cell sodium current that was sensitive to the individual drugs used (n = 8). n = cells. ****p<0.0001.
Figure 2—figure supplement 1
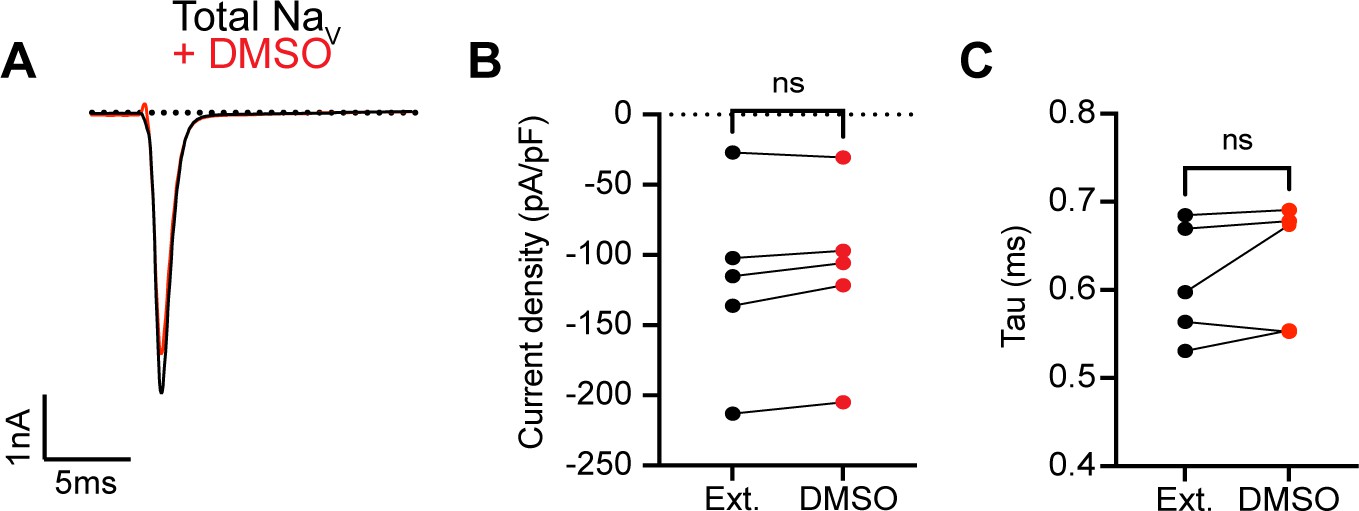
0.1% DMSO vehicle does not change INa in proprioceptors.
(A) Representative current trace before (black trace) and after (red trace) application of 0.1% DMSO to TdTomato+ proprioceptors during in vitro electrophysiological experiments. Quantification of current density (B) and current decay kinetics (C) before (normal external solution, black circles) and after DMSO application (red circles). A paired t-test was used to determine statistical significance (B), p=0.0855 and (C), p=0.3125, n = 5 cells.
Figure 3
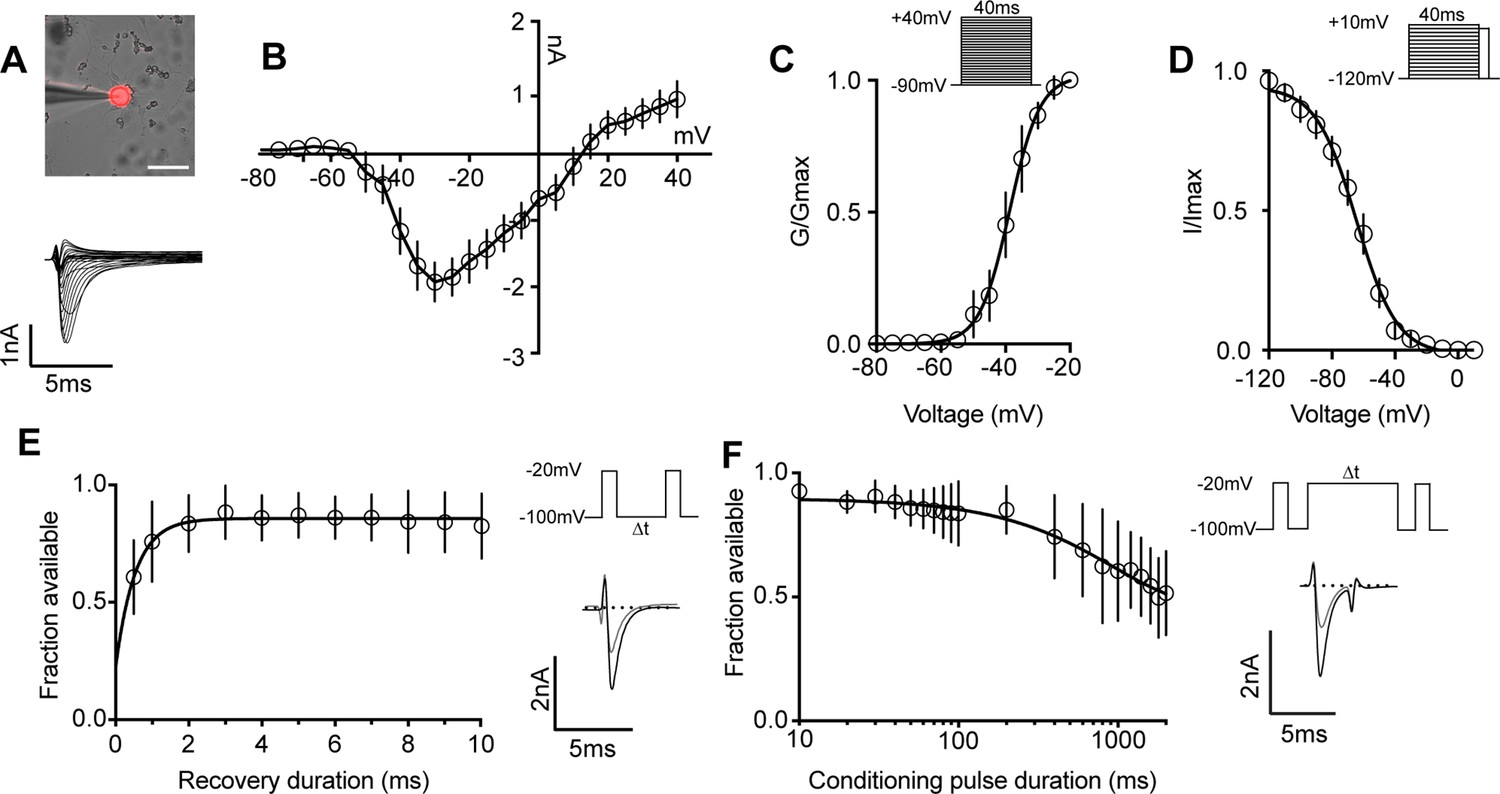
Biophysical analysis of the whole-cell sodium current (INa) in genetically identified proprioceptors.
(A) Top: representative image of a TdTomato+ proprioceptor in culture during electrophysiological recordings (scale bar set to 50 μm). Bottom: representative current traces from current–voltage relationship of INa from TdTomato+ proprioceptors shown in (B). Currents were elicited by 40 ms voltage steps from –90 mV to +40 mV in 5 mV increments (n = 7–9). (C) Top: the voltage protocol used to measure the voltage dependence of whole-cell sodium current activation in proprioceptors. Currents were elicited using a series of 40 ms voltage steps from –90 mV to 40 mV at 5 mV increments from a holding potential of –90 mV. Bottom: data are expressed as conductance over maximum conductance (n = 6–9). (D) Top: the voltage protocol used to measure the voltage dependence of inactivation. A 40 ms prepulse ranging from –120 mV to +10 mV was given followed by a test pulse to 0 mV. Bottom: data are expressed as current over maximum current (n = 8–12). (E) Left: quantification of recovery from fast inactivation (n = 8). Line shows a monoexponential fit of the data (τ = 0.54 ms). Top right: voltage protocol to measure recovery from fast inactivation. A 20 ms step to –20 mV from –100 mV is followed by varying durations of recovery at –100 mV before a second test step to –20 mV. Bottom right: representative traces of currents elicited before (black trace) and after (gray trace) a 0.5 ms recovery period. (F) Left: quantification of entry into slow inactivation (n = 6). Line shows a monoexponential fit of the data (τ = 928.6 ms). Top right: voltage protocol to measure entry into slow inactivation. A 3 ms test pulse to –20 mV from –100 mV was followed by conditioning pulses at 0 mV for varying durations before a third test step to –20 mV. 12 ms recovery periods after the first test pulse and before the second were included to remove fast inactivation. Bottom right: representative current trace elicited before and after a 2000 ms conditioning pulse. All error bars represent standarad error of the mean (SEM) n = cells.
Figure 4 with 1 supplement
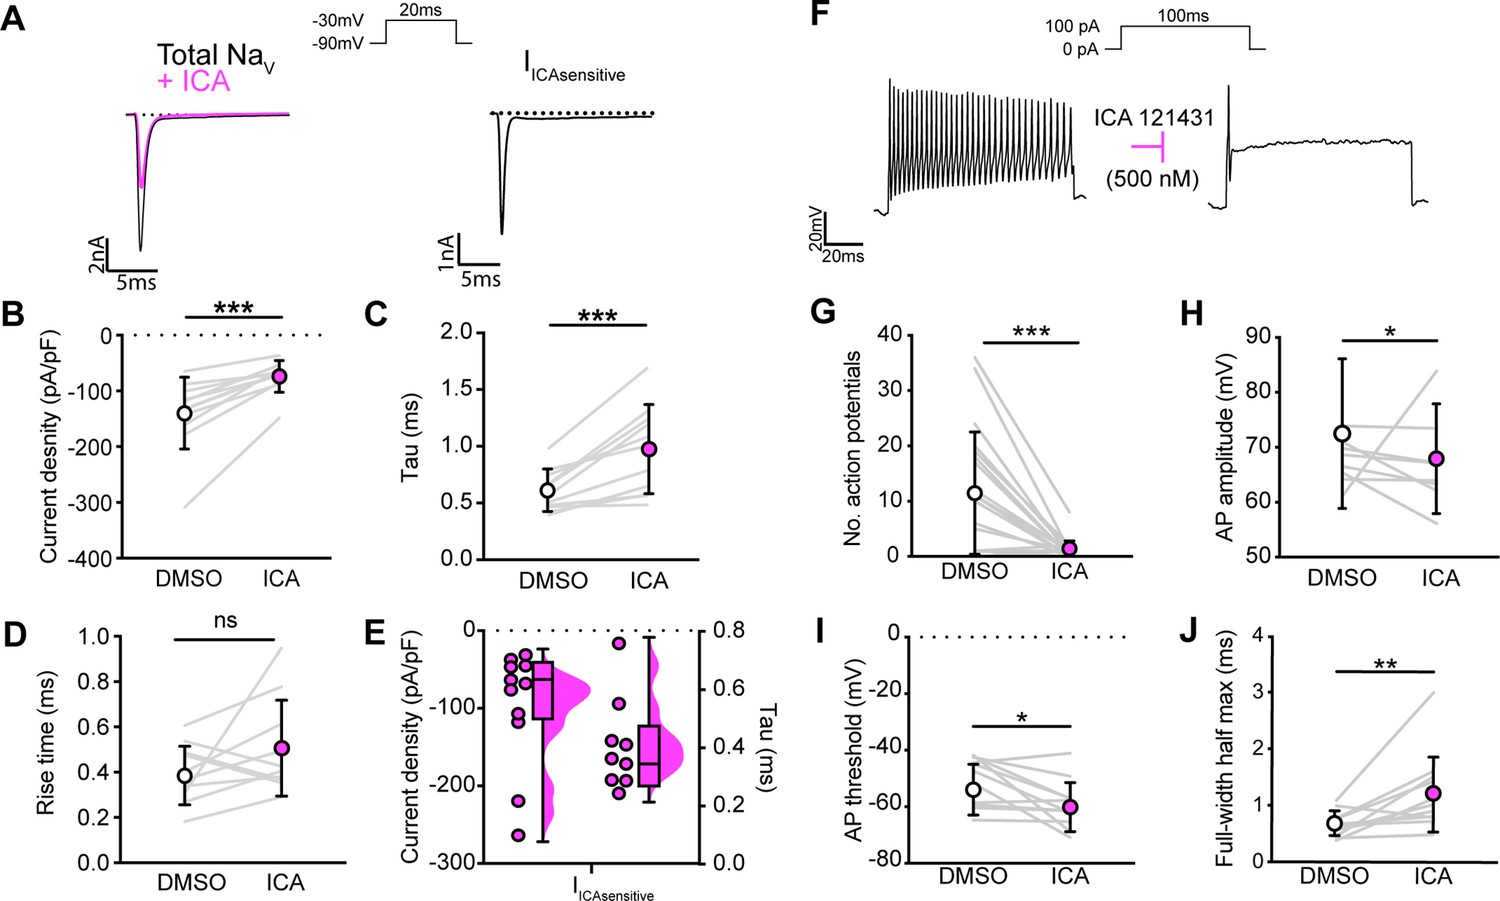
NaV1.1 significantly contributes to the whole-cell sodium current and intrinsic excitability in genetically identified proprioceptors.
(A) Left: representative whole-cell voltage-clamp traces elicited before (black) and after (magenta) application of ICA 121431 (500 nM). Right: the subtracted ICA-sensitive current shown in black. (B) Quantification of the reduction in whole-cell current density before (white) and after (magenta) ICA, p=0.0003, n = 11 cells. (C) Quantification of rate of current decay before and after ICA, p=0.0007, n = 11 cells. (D) Quantification of whole-cell current rise time before and after ICA, p=0.1611, n = 10 cells. (E) Left: current densities of ICA-sensitive sodium currents (n = 11); right: current decay taus of ICA-sensitive sodium currents (n = 9 cells). (F) Representative whole-cell current-clamp traces before (left) and after (right) application of ICA. (G–J) Quantification of number of action potentials in response to current injection (G; p=0.0002, n = 20 cells), action potential amplitude (H; p=0.0420, n = 20 cells), action potential threshold (I; p=0.0186, n = 20 cells), and full-width half max (J; p=0.0068, n = 20 cells). Gray lines represent paired observations, circles and lines represent means and standard deviations. White circles, before ICA application. Magenta circles, after ICA application. The Wilcoxon matched-pairs signed-rank test was used to determine statistical significance.
Figure 4—figure supplement 1
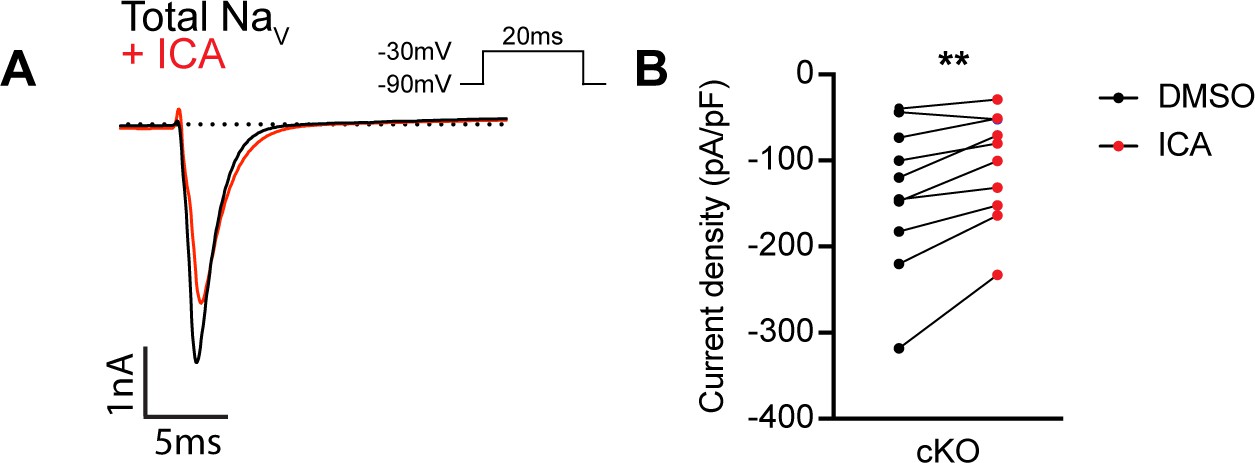
ICA 121431 may inhibit upregulated NaV1.3 channels in cultured dorsal root ganglia (DRG) neurons.
(A) Representative whole-cell current trace from a large-diameter DRG neurons (>60 pF) from a Scn1a-cKO mouse. The black trace represents the INa recorded in external solution, and the red trace represents the current following application of 500 nM of ICA 121431 for 1 min. (B) Quantification of the current density before (black circles) and after ICA (red circles, n = 9). A significant effect of ICA was found (paired Student’s t-test, p=0.0041). n = cells.
Figure 5 with 2 supplements

Loss of NaV1.1 in peripheral sensory causes deficits in motor behaviors.
(A) Representative images showing limb positions of adult Scn1a-floxed (left), Scn1a-Het (middle), and Scn1a-cKO (right) mice. White arrows represent the direction of limbs. (B) Representative heat maps from open-field experiments between Scn1a-floxed (left), Scn1a-Het (middle), and Scn1a-cKO (right). Open field (C–F). Quantification of total distance traveled during a 10-min open-field test between Scn1a-floxed (cyan), Scn1a-Het (gray), and Scn1a-cKO (magenta) mice. (C) Scn1a-Het p=0.0255, Scn1a-cKO, p=0.0077, compared to Scn1a-floxed, average animal velocity. (D) Scn1a-Het p=0.00311, Scn1a cKO, p=0.0057, compared to Scn1a-floxed, percent time moving. (E) Scn1a-Het p=0.1362, p=0.0730, compared to Scn1a-floxed, and percent time spent in center. (F) Scn1a-Het p=0.2297, Scn1a-cKO, p=0.2494, compared to Scn1a-floxed, during the test. Rotarod (G–I). Quantification of the latency to fall across three consecutive training days (G) and day 3 (H). Quantification of revolutions per minute (RPM) at the moment of animal fall (I) and the day 3 average (J). Each dot represents one animal. Box and whisker plots represent maximum, minimum, median, upper and lower quartiles of data sets.****p<0.0001. A one-way ANOVA (Dunnett’s post-hoc comparison) was used to determine statistical significance in (C–F) and (I) and (J). A two-way mixed-design ANOVA (Dunnett’s post-hoc comparison) was used to determine statistical significance in (G) and (H) Open field: Scn1a-floxed N = 15, Scn1a-Het N = 6, Scn1a-cKO N = 12. Rotarod: Scn1a-floxed N = 11, Scn1a-Het N = 11, Scn1a-cKO N = 20.
Figure 5—figure supplement 1
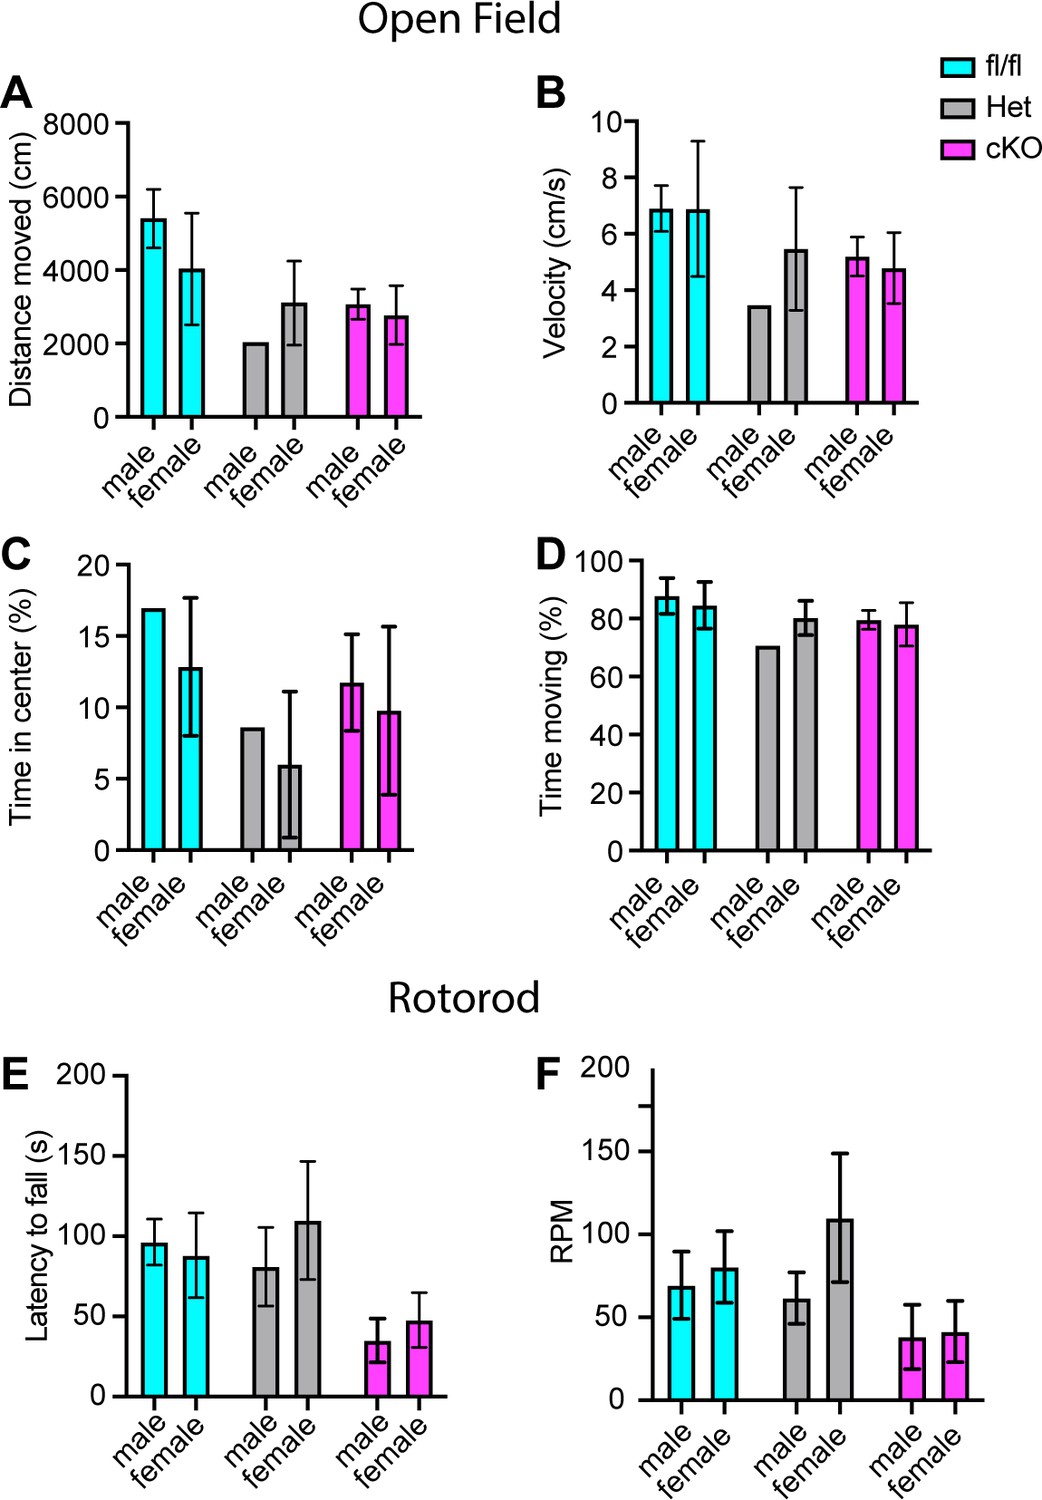
Motor deficits in Scn1a-Het and Scn1a-cKO animals are not sex dependent.
(A–D) Quantification of sex-dependent parameters during a 10-min open-field trial. Total distance moved (A). Velocity (B). Percent time spent in center of box (C). Total percent time moving (D) Males n = 10, females n = 17. Quantification of the sex-dependent differences in rotarod day 3 trial latency to fall (E) and revolutions per minute (RPM) (F). Males n = 18, females n = 24.
Figure 5—figure supplement 2
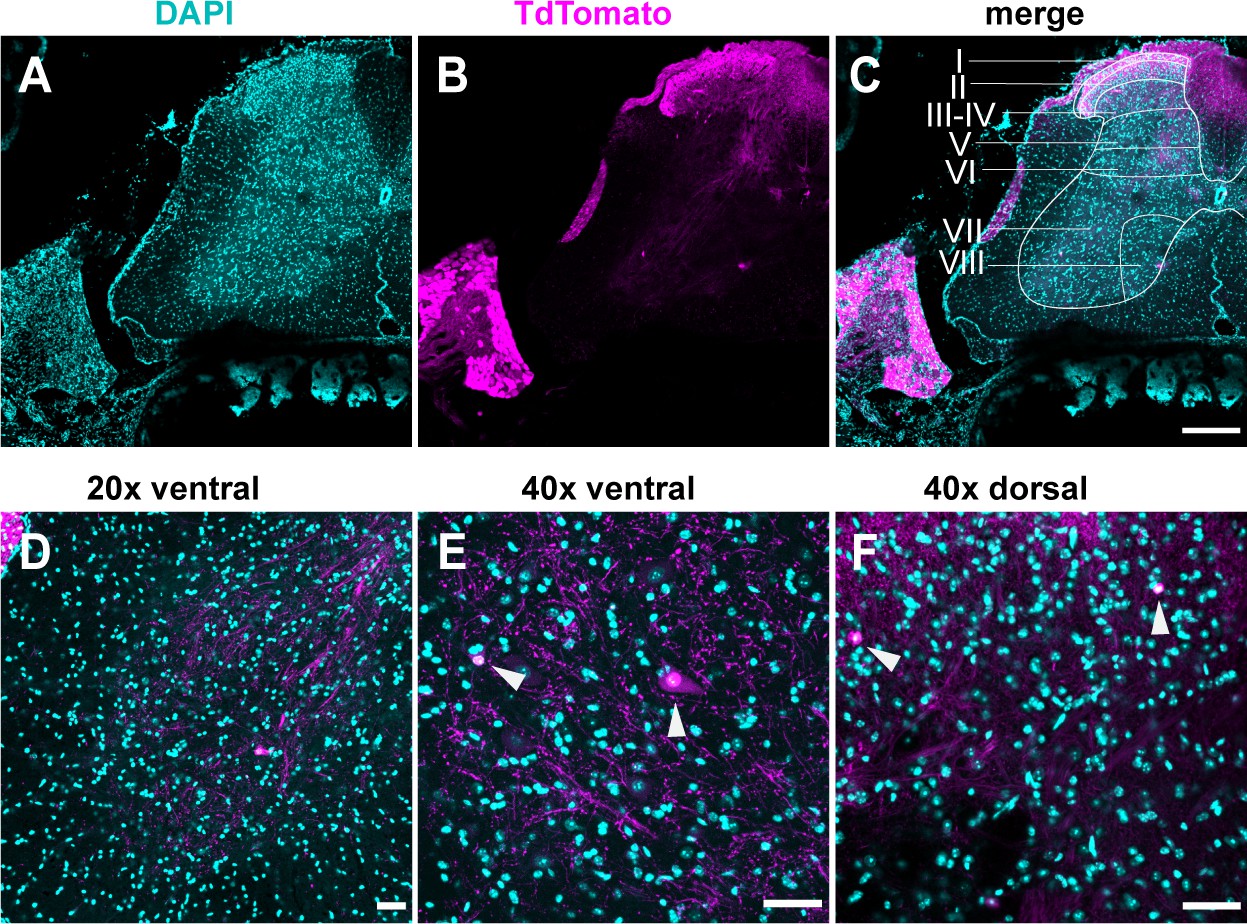
TdTomato expression is limited to sensory neurons.
(A–D) Images stained using immunohistochemistry with anti-DsRed (TdTomato). (A–C) Representative confocal images of spinal cord sections at ×10, 0.45 NA dry objective. Scale bar 200 μm. (D) Image was taken at ×20, 0.8 NA air objective of the ventral horn. (E) Image was taken at ×40, 1.3 NA oil-immersion objective of the ventral horn. (F) Image was taken at ×40, 1.3 NA oil-immersion objective of the ventral horn. Arrowheads indicate TdTomato+ puncta. (D–F) Scale bar 50 μm (N = 3 mice, n = 30 sections).
Figure 6 with 1 supplement
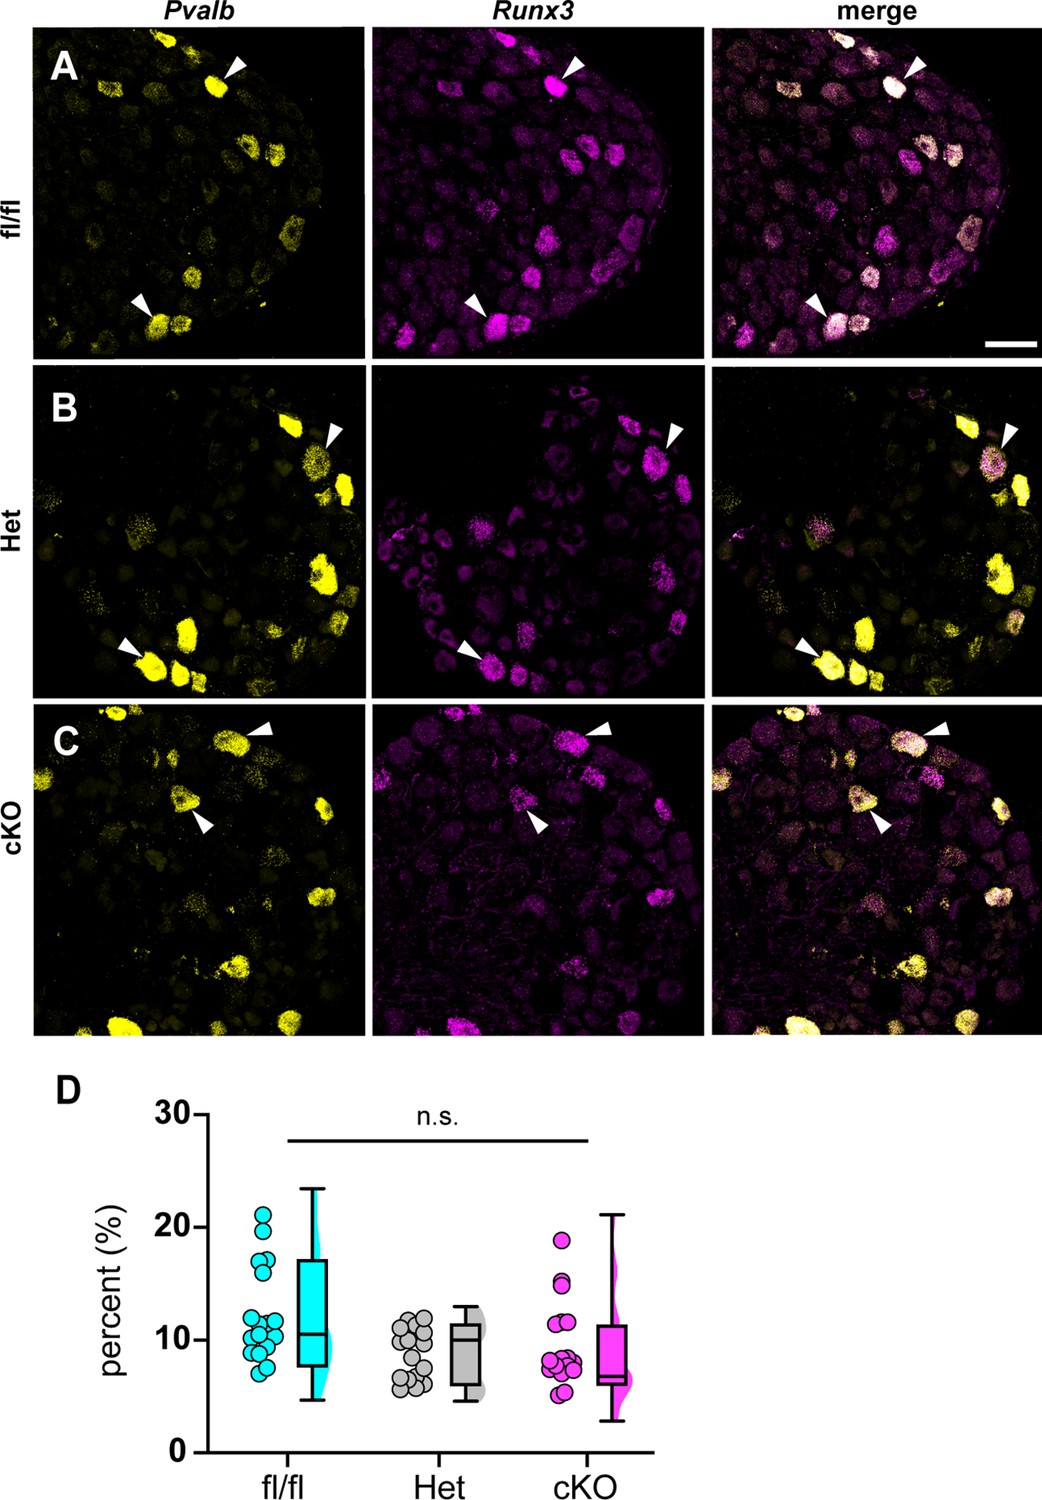
Loss of NaV1.1 in sensory neurons does not affect proprioceptor development.
Representative images of Scn1a-floxed (A), Scn1a-Het (B), and Scn1a-cKO (C) adult dorsal root ganglia (DRG) neuron sections (25 μm). Images were acquired with a ×40, 0.9 NA water-immersion objective. Sections were hybridized with probes targeting parvalbumin (Pvalb, yellow) and Runx3 (magenta). (D) Quantification of the percentage of Pvalb+/Runx3+ neurons in each genotype. Each dot represents one DRG section. Box and whisker plots represent maximum, minimum, median, upper and lower quartiles of data sets. A Kruskal–Wallis test with Dunn’s post-hoc comparison was used to determine statistical significance (p=0.1971, Scn1a-floxed n = 17, Scn1a-Het n = 17, Scn1a-cKO n = 18). n = sections. Scale bar 50 μm.
Figure 6—figure supplement 1
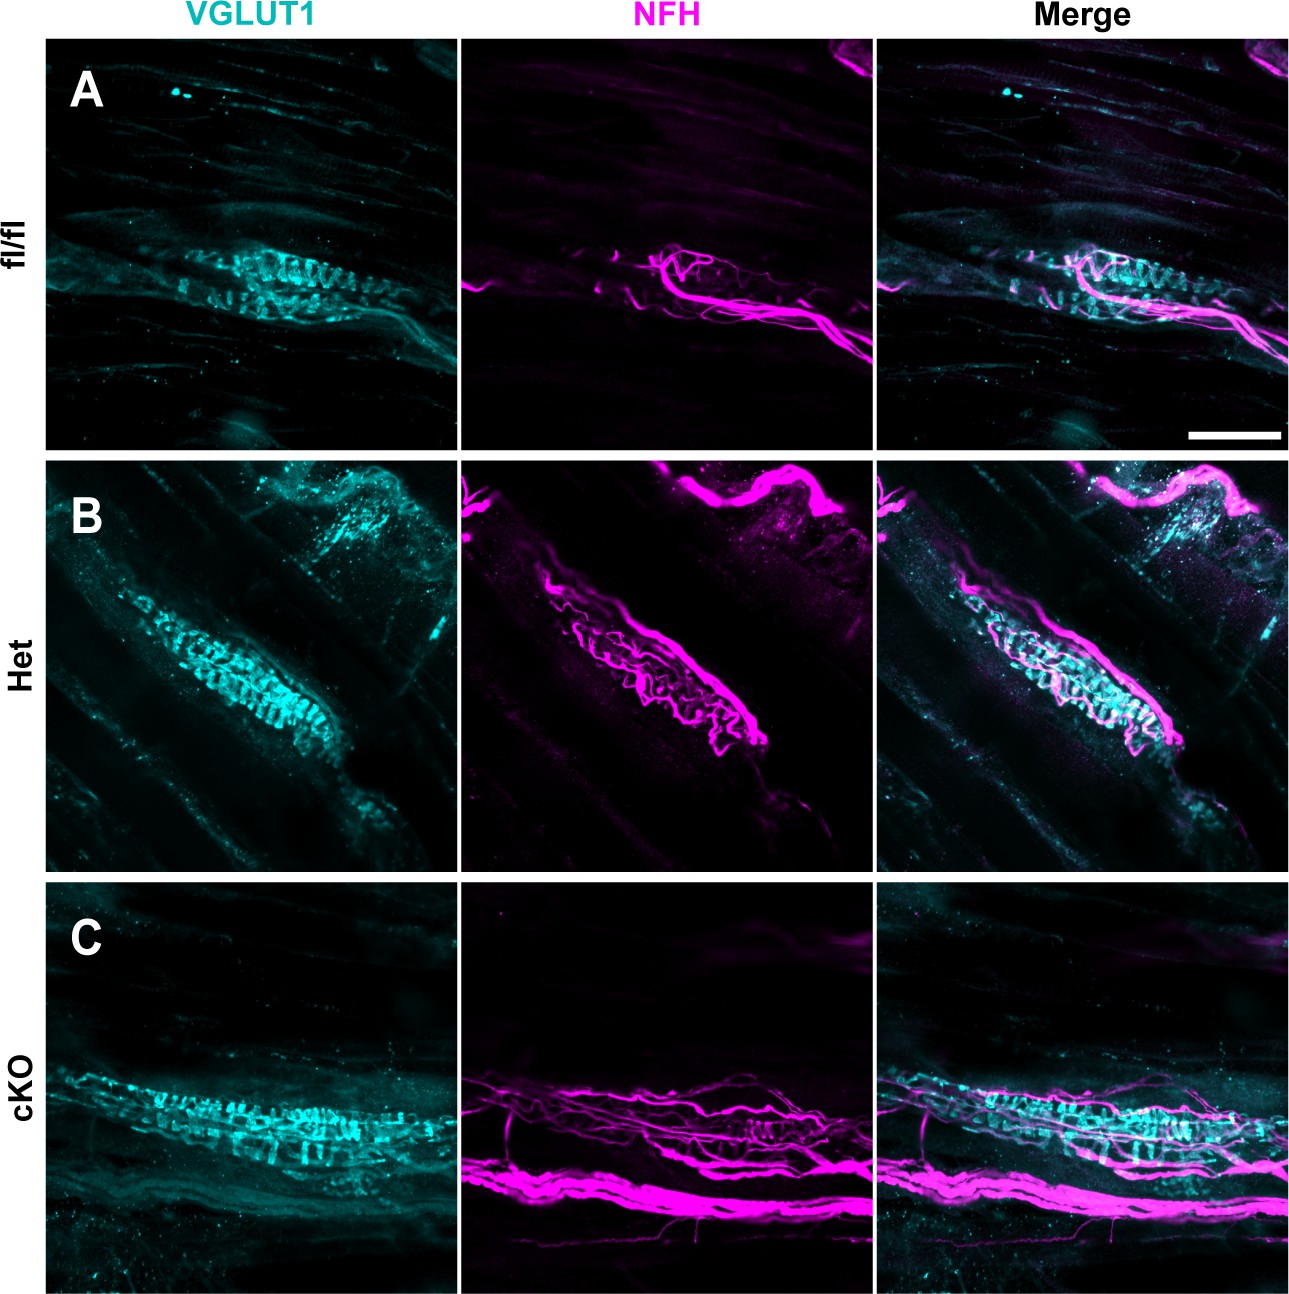
Muscle spindle development is normal in Scn1a-Het and Scn1a-cKO animals.
(A–C) Representative confocal images of muscle spindle whole mounts. Images were acquired with a ×40, 1.3 NA oil-immersion objective. Sections were stained using immunohistochemistry with VGLUT1 (cyan) and neurofilament heavy (NFH, magenta). (A) Representative images from Scn1a-floxed (B), Scn1a-Het, and (C) Scn1a-cKO mice. Scn1a-floxed, n = 7; Scn1a-Het, n = 8; Scn1a-cKO, n = 9. Scale bar 50 μm. n = muscle spindles.
Figure 7
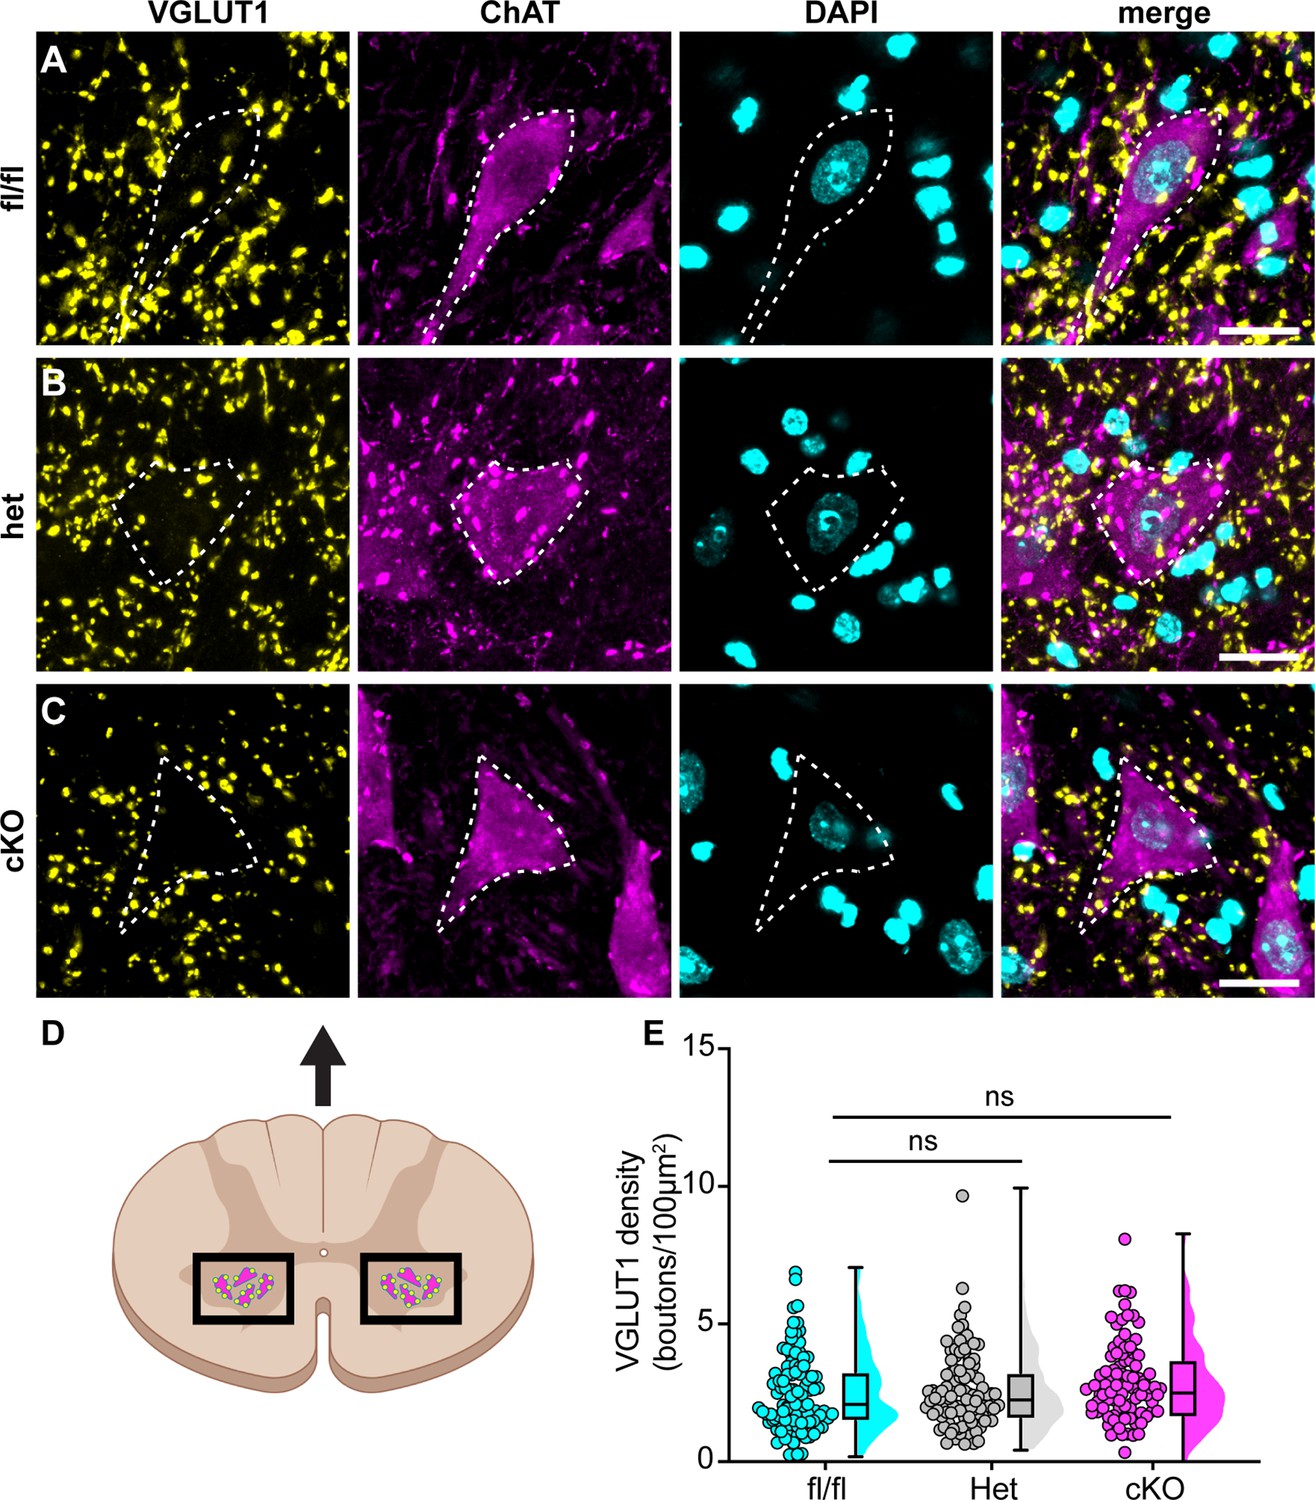
Loss of NaV1.1 in sensory neurons does not change proprioceptor innervation of α-motor neurons.
(A–C) Representative images of Scn1a-floxed (A), Scn1a-Het (B), and Scn1a-cKO (C) adult spinal cord sections (30 μm). Images were acquired with a ×63, 1.4 NA oil-immersion objective. Sections were stained using immunochemistry with VGLUT1 (yellow) and ChAT (magenta). Nuclei (cyan) were labeled with DAPI. (D) Schematic of spinal cord regions of interest. (E) Quantification of the average density of VGLUT1+ puncta per 100 μm2 onto ChAT+ neurons that were larger than 400 μm2. A Kruskal–Wallis test with Dunn’s post-hoc comparison was used to determine statistical significance. Each dot represents a motor neuron. Box and whisker plots represent maximum, minimum, median, upper and lower quartiles of data sets. Scn1a-floxed, n = 101; Scn1a-Het, n = 102; Scn1a-cKO, n = 92. Scale bar 20 μm. n = cells.
Figure 8
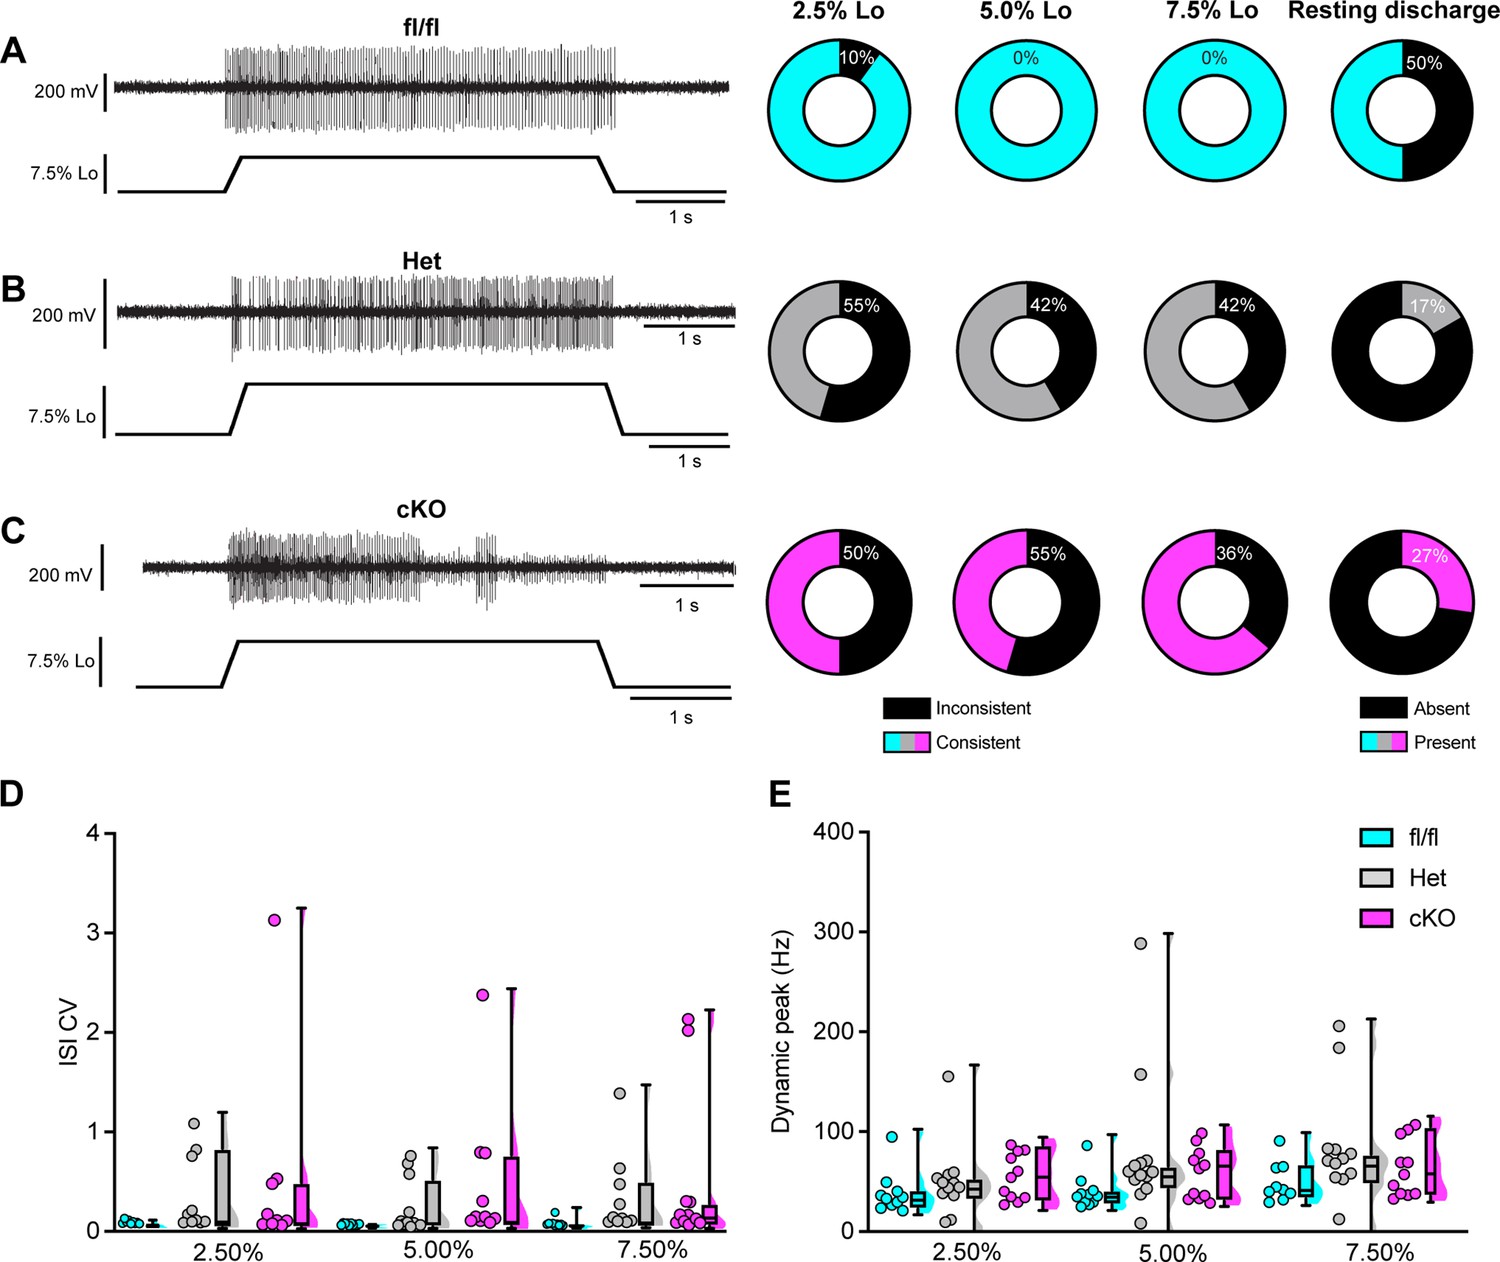
Loss of NaV1.1 reduces static muscle stretch sensitivity and reliability.
(A–C) Representative responses to ramp-and-hold muscle stretch at 7.5% of optimal length (Lo) from Scn1a-floxed (A), Scn1a-Het (B), and Scn1a-cKO (C) afferents. Afferents from Scn1a-Het and Scn1a-cKO mice were more likely to show inconsistent firing during the hold phase of stretch. The percentage of afferents from each genotype that were able to fire consistently for the entire duration of stretch at 2.5, 5.0, and 7.5% of Lo is shown in the pie charts next to the representative trace from their genotype (black indicates percentage with inconsistent firing). The final pie charts represent the proportion of afferents that exhibited resting discharge at Lo for every stretch for each genotype (black indicates absence of resting discharge). (D) Inconsistency in firing was quantified as the interspike interval coefficient of variation (ISI CV) during the plateau stage of the hold phase of stretch (1.5–3.5 s into stretch) for the three different genotypes. A significant effect of genotype was observed (two-way mixed-design ANOVA, p=0.015). (E) The highest firing rate during the rampup phase of stretch (dynamic peak) is a measure of dynamic sensitivity. No significant effect of genotype on dynamic peak was observed (two-way mixed-design ANOVA, p=0.0633). Box and whisker plots represent maximum, minimum, median, upper and lower quartiles of data sets Each dot represents one afferent in (D) and (E) (Scn1a-floxed, n = 10; Scn1a-Het, n = 12; Scn1a-cKO, n = 11).
Figure 9
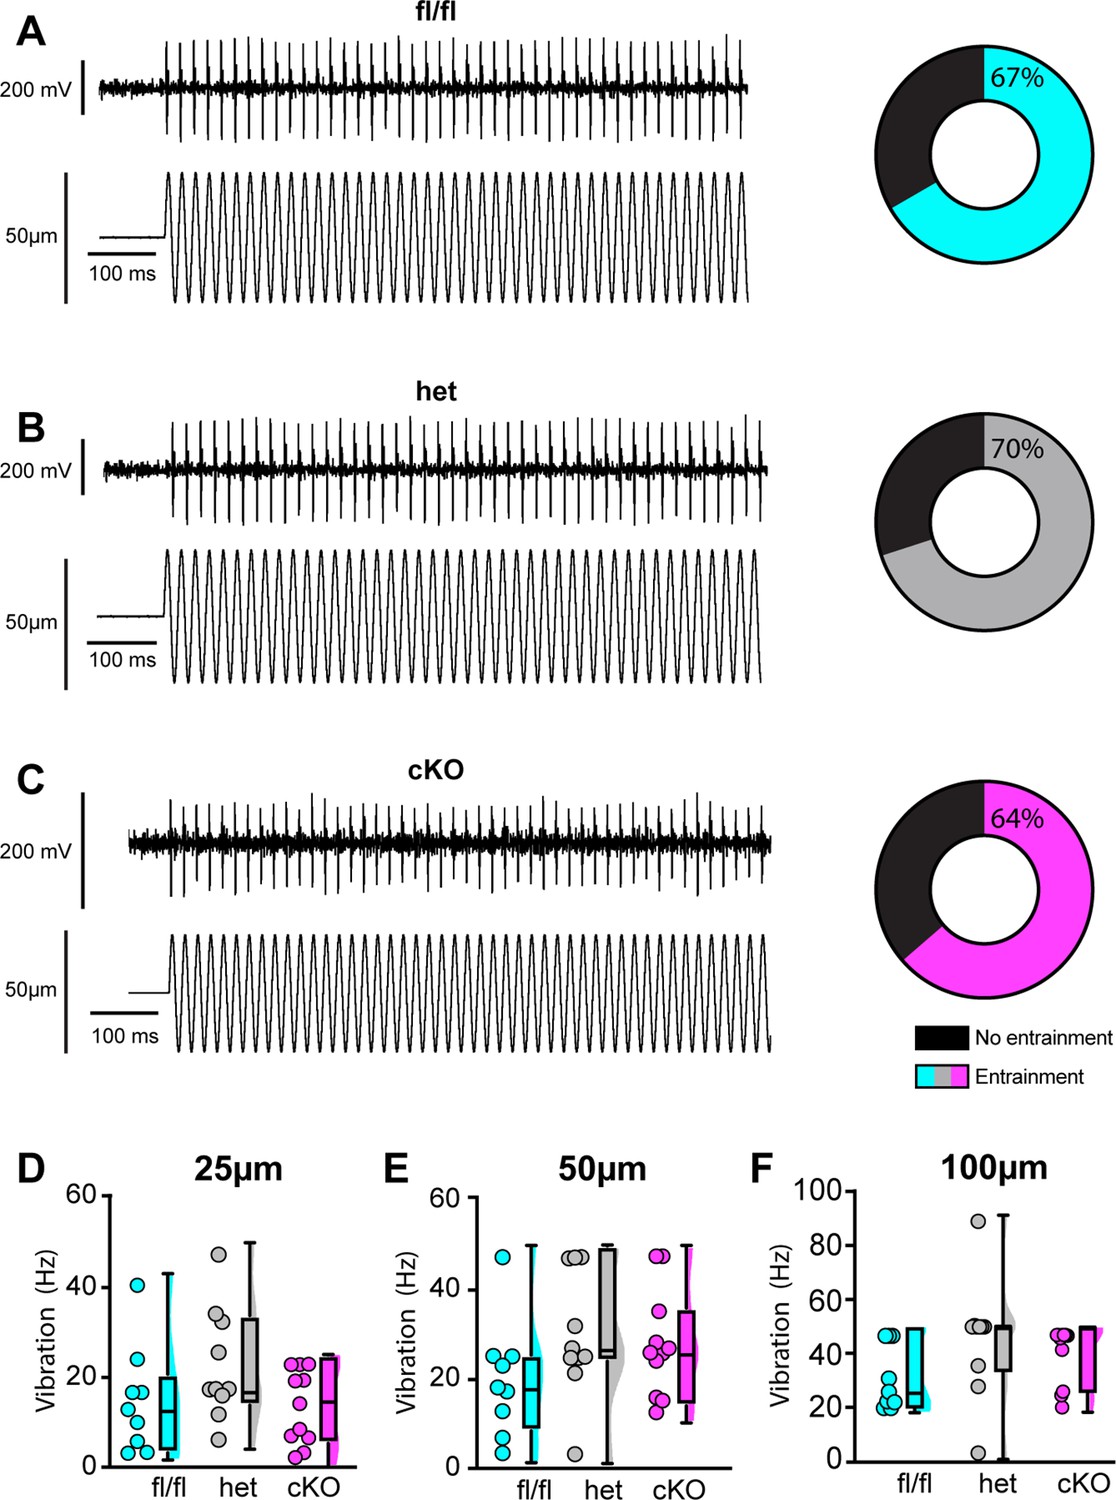
Loss of NaV1.1 does not alter muscle spindle afferent response to vibratory muscle stretch.
(A–F) Representative traces from afferents that were able to entrain to a 50 Hz, 100 µm vibration as well as graphs with the percentage of all Scn1a-floxed (cyan; A), Scn1a-Het (gray; B), and Scn1a-cKO (magenta; C) afferents that could entrain to the vibration shown in (A–C). Average firing frequency during a 9 s 50 Hz vibration shown for a 25 µm (D), 50 µm (E), and 100 µm (F) amplitude vibration. There was no significant effect of genotype on the firing frequency during vibration (25 µm, p=0.2398, 50 µm, p=0.2413, 100 μm, p=0.1276). A one-way ANOVA was used to determine statistical significance in (D) and (E). A Kruskal–Wallis test was used to determine statistical significance in (F). Box and whisker plots represent maximum, minimum, median, upper and lower quartiles of data sets. Each dot represents one afferent (Scn1a-floxed, n = 9; Scn1a-Het, n = 10; Scn1a-cKO, n = 11).
Figure 10
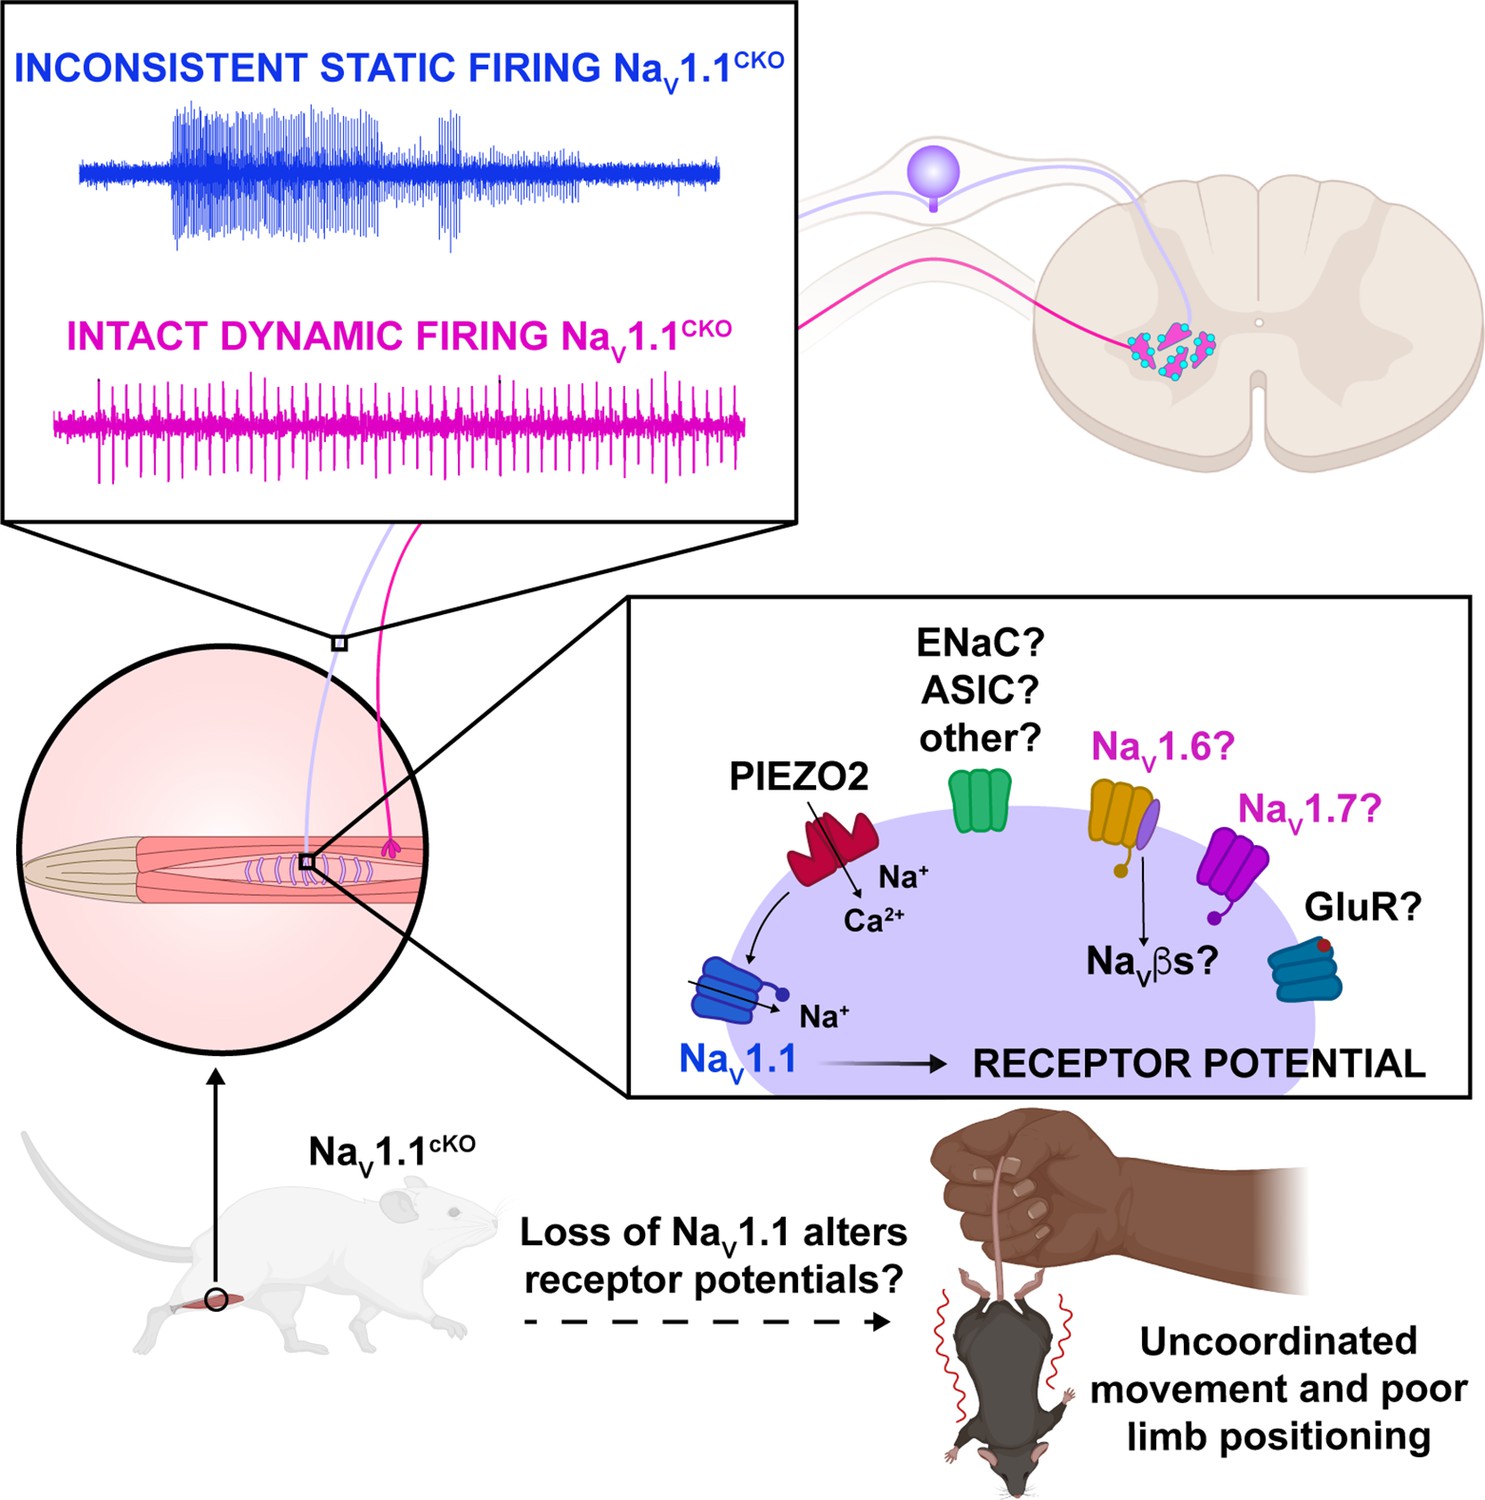
Proposed model of the role of NaV1.1 in proprioception.
Upon muscle static stretch, various channels activate, including Piezo2 (red), which results in an influx of calcium and sodium ions, causing a depolarization that activates NaV1.1 (dark blue). NaV1.1 activation drives reliable repetitive firing of proprioceptors during static stretch for normal motor behavior. Loss of NaV1.1 in sensory neurons results in inconsistent static firing at the afferent level while maintaining dynamic firing, resulting in uncoordinated movements and abnormal limb positioning. It is possible that a combination of Piezo2, NaV1.6 (yellow), NaV1.7 (pink), and/or other channels, such as glutamate receptors (dark blue), ASIC, and ENaC channels (green), mediates dynamic firing.
Author response image 1
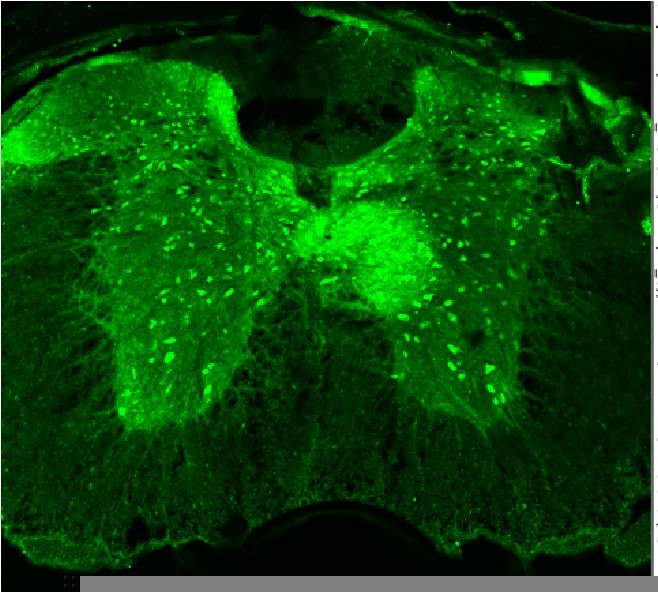
Spinal cord of a NaV1.
1fl/fl mouse stained with an anti-parvalbumin antibody (Thomas Jessell Laboratory, Columbia University). Strong labeling is seen in PV+ interneurons, but not in Proprioceptive afferent terminals.
Videos
Video 1
Uncoordinated movements in Scn1a-cKO animals.
A Scn1a-cKO mouse (left) shows abnormal and spastic movements when suspended in the air. These movements are absent in Scn1a-floxed mice (right).
Video 2
Abnormal limb position in Scn1a-cKO animals.
A Scn1a-cKO mouse has uncoordinated leg movements and makes an abnormal rotation of its hind paw to grasp its tail while suspended in the air.
Video 3
Abnormal paw position in Scn1a-cKO animals.
A Scn1a-cKO mouse is scruffed and places hind paws with foot pads facing down. This contrasts with the normal paw positioning seen in the forepaws, in which foot pads are in the outward-facing position.
Tables
Table 1
Afferent entrainment to 25 μm amplitude vibration.
The percentage of muscle spindle afferents that entrained to a 25 μm amplitude sinusoidal vibration.
| Genotype | 10 Hz (%) | 25 Hz (%) | 50 Hz (%) | 100 Hz (%) |
|---|---|---|---|---|
| Scn1a-floxed | 33.33 | 11.11 | 0.00 | 0.00 |
| Scn1a-Het | 50.00 | 40.00 | 10.00 | 10.00 |
| Scn1a-cKO | 27.27 | 9.09 | 0.00 | 0.00 |
Table 2
Afferent entrainment to 50 μm amplitude vibration.
The percentage of muscle spindle afferents that entrained to a 50 μm amplitude sinusoidal vibration.
| Genotype | 10 Hz (%) | 25 Hz (%) | 50 Hz (%) | 100 Hz (%) |
|---|---|---|---|---|
| Scn1a-floxed | 88.89 | 22.22 | 11.11 | 11.11 |
| Scn1a-Het | 80.00 | 70.00 | 30.00 | 10.00 |
| Scn1a-cKO | 45.45 | 54.55 | 18.18 | 0.00 |
Table 3
Afferent entrainment to 100 μm amplitude vibration.
The percentage of muscle spindle afferents that entrained to a 100 μm amplitude sinusoidal vibration.
| Genotype | 10 Hz (%) | 25 Hz (%) | 50 Hz (%) | 100 Hz (%) |
|---|---|---|---|---|
| Scn1a-floxed | 100.00 | 44.44 | 33.33 | 22.22 |
| Scn1a-Het | 90.00 | 90.00 | 70.00 | 40.00 |
| Scn1a-cKO | 63.64 | 72.73 | 63.64 | 18.18 |
Key resources table
| Reagent type (species) or resource | Designation | Source or reference | Identifiers | Additional information |
|---|---|---|---|---|
| Antibody | Anti-DsRed (rabbit polyclonal) | Takara Bio | Cat #632496 | 1:3000 |
| Antibody | GFP (chicken polyclonal) | Abcam | Cat #ab13970 | 1:3000 |
| Antibody | NFH (chicken polyclonal) | Abcam | Cat #ab4680 | In muscle spindles: (1:300) In DRG: (1:3000) |
| Antibody | CGRP (rabbit polyclonal) | ImmunoStar | Cat #24112 | 1:1000 |
| Antibody | VGLUT1 (guinea pig polyclonal) | Zuckerman institute (Columbia University) | Cat #CU1706; RRID:AB_2665455 | In spinal cord: (1:8000) In muscle spindles: (1:800) |
| Antibody | β3-tubulin (chicken polyclonal) | Abcam | Cat #ab41489 | 1:500 |
| Antibody | β3-tubulin (rabbit polyclonal) | Abcam | Cat #ab18207 | 1:3000 |
| Antibody | ChAT (rabbit polyclonal) | Zuckerman Institute (Columbia University) | Cat #CU1574 | 1:10,000 |
| Chemical compound, drug | VECTASHIELD Antifade Mounting Media with DAPI | Vector Laboratories | Cat #H-2000 | |
| Chemical compound, drug | Tissue-Tek OCT compound | Sakura | Cat #4583 | |
| Chemical compound, drug | Laminin | Sigma-Aldrich | Cat #L2020-1MG | |
| Chemical compound, drug | Collagenase type P | Sigma-Aldrich | Cat #11213865001 | |
| Chemical compound, drug | TrypLE Express | Thermo Fisher | Cat #12605-010 | |
| Chemical compound, drug | MEM | Thermo Fisher | Cat #11095-080 | |
| Chemical compound, drug | Penicillin-streptomycin | Thermo Fisher | Cat #15140-122 | |
| Chemical compound, drug | MEM vitamin solution | Thermo Fisher | Cat #11120-052 | |
| Chemical compound, drug | B-27 supplement | Thermo Fisher | Cat #17504-044 | |
| Chemical compound, drug | Horse serum, heat inactivated | Thermo Fisher | Cat #26050-070 | |
| Chemical compound, drug | ICA 121431 | Tocris Bioscience | Cat #5066/10 | |
| Chemical compound, drug | 4,9-anhydrous tetrodotoxin | Tocris Bioscience | Cat #6159 | |
| Chemical compound, drug | PF-05089771 | Tocris Bioscience | Cat #5931 | |
| Chemical compound, drug | Tetrodotoxin | Abcam | Cat ab120054 | |
| Commercial assay or kit | RNAscope Fluorescence Multiplex Kit | Advanced Cell Diagnostics | Cat #320851 | |
| Sequence-based reagent | Pvalb probe channel 1 | Advanced Cell Diagnostics | Cat #421931 | |
| Sequence-based reagent | Scn1a probe channel 2 | Advanced Cell Diagnostics | Cat #556181-C2 | |
| Sequence-based reagent | Scn8a probe channel 2 | Advanced Cell Diagnostics | Cat #313341-C2 | |
| Sequence-based reagent | Scn9a probe channel 2 | Advanced Cell Diagnostics | Cat #434191-C2 | |
| Sequence-based reagent | Runx3 probe channel 3 | Advanced Cell Diagnostics | Cat #451271-C3 | |
| Strain, strain background (Mus musculus) | Pirtcre | Dr. Xinzhong Dong | ||
| Strain, strain background (M. musculus) | Rosa26Ai14 | Jackson Laboratories | Stock #007914 | |
| Strain, strain background (M. musculus) | Pvalbcre | Jackson Laboratories | Stock #008069 | |
| Strain, strain background (M. musculus) | Scn1a-floxed | UC Davis MMRRC | Stock # 041829-UCD | |
| Strain, strain background (M. musculus) | MrgprdGFP | Zheng et al., 2019 | ||
| Software, algorithm | pClamp 11.2 Software Suite | Molecular Devices | https://www.moleculardevices.com | |
| Software, algorithm | ImageJ | Schneider et al., 2012 | https://imagej.nih.gov | |
| Software, algorithm | Prism 9 | GraphPad | https://www.graphpad.com | |
| Software, algorithm | LabChart | ADInstruments | https://www.adinstruments.com/products/labchart | |
| Software, algorithm | MATLAB | MathWorks | https://www.mathworks.com | |
| Software, algorithm | MATLAB | This study | https://github.com/doctheagrif/Current-Clamp-Matlab-Code_O-Neil-DA; O’Neil, 2022b | Current-clamp experiments were analyzed with a custom-written MATLAB Script that is available on GitHub |
Additional files
Download links
A two-part list of links to download the article, or parts of the article, in various formats.
Downloads (link to download the article as PDF)
Open citations (links to open the citations from this article in various online reference manager services)
Cite this article (links to download the citations from this article in formats compatible with various reference manager tools)
NaV1.1 is essential for proprioceptive signaling and motor behaviors
eLife 11:e79917.
https://doi.org/10.7554/eLife.79917


