p75NTR prevents the onset of cerebellar granule cell migration via RhoA activation
- Department of Biological Sciences, Rutgers University, United States
Figures
Figure 1 with 1 supplement
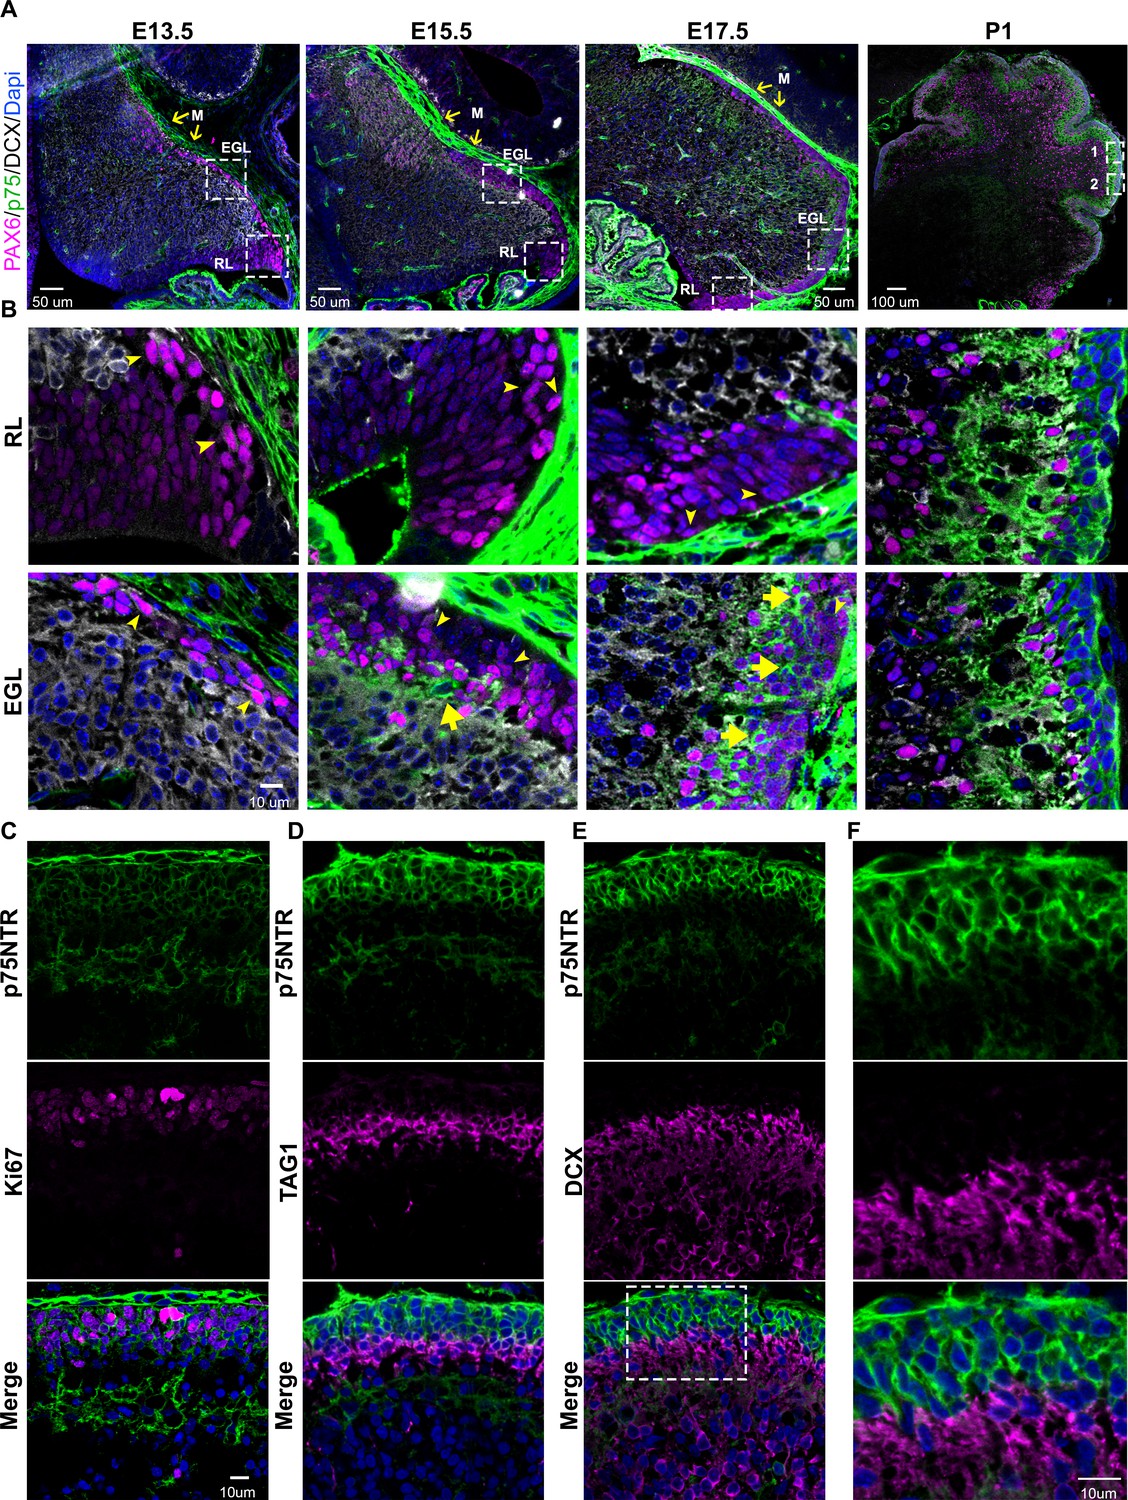
Developmental expression of p75 neurotrophin receptor (p75NTR) in mouse cerebellum.
(A) Mouse developmental expression of p75NTR (green), Pax6 (magenta), DCX (white), and Dapi (blue) at the indicated ages. Note the high level of p75NTR in the meninges as well as the developing granule cell progenitors. Yellow arrows indicate the M – meninges, RL – rhombic lip, EGL – external granule layer. (B) High magnification of the insets showed in A. Cells expressing p75NTR (arrows), migrating cells negative for p75NTR (arrowheads). (C) Expression of p75NTR (green), Ki67 (magenta), and Dapi (blue) in the cerebellum of P7 mouse pups. (D) Immunohistochemistry of the expression of p75NTR (green), TAG1 (magenta), and Dapi (blue) in the cerebellum of P7 mouse pups. (E) Immunohistochemistry of the expression of p75NTR (green), DCX (magenta), and Dapi (blue) in the cerebellum of P7 mouse pups. (F) High magnification of the inset showed in E. The tissue shown in all the figures were obtained from mice.
Figure 1—figure supplement 1
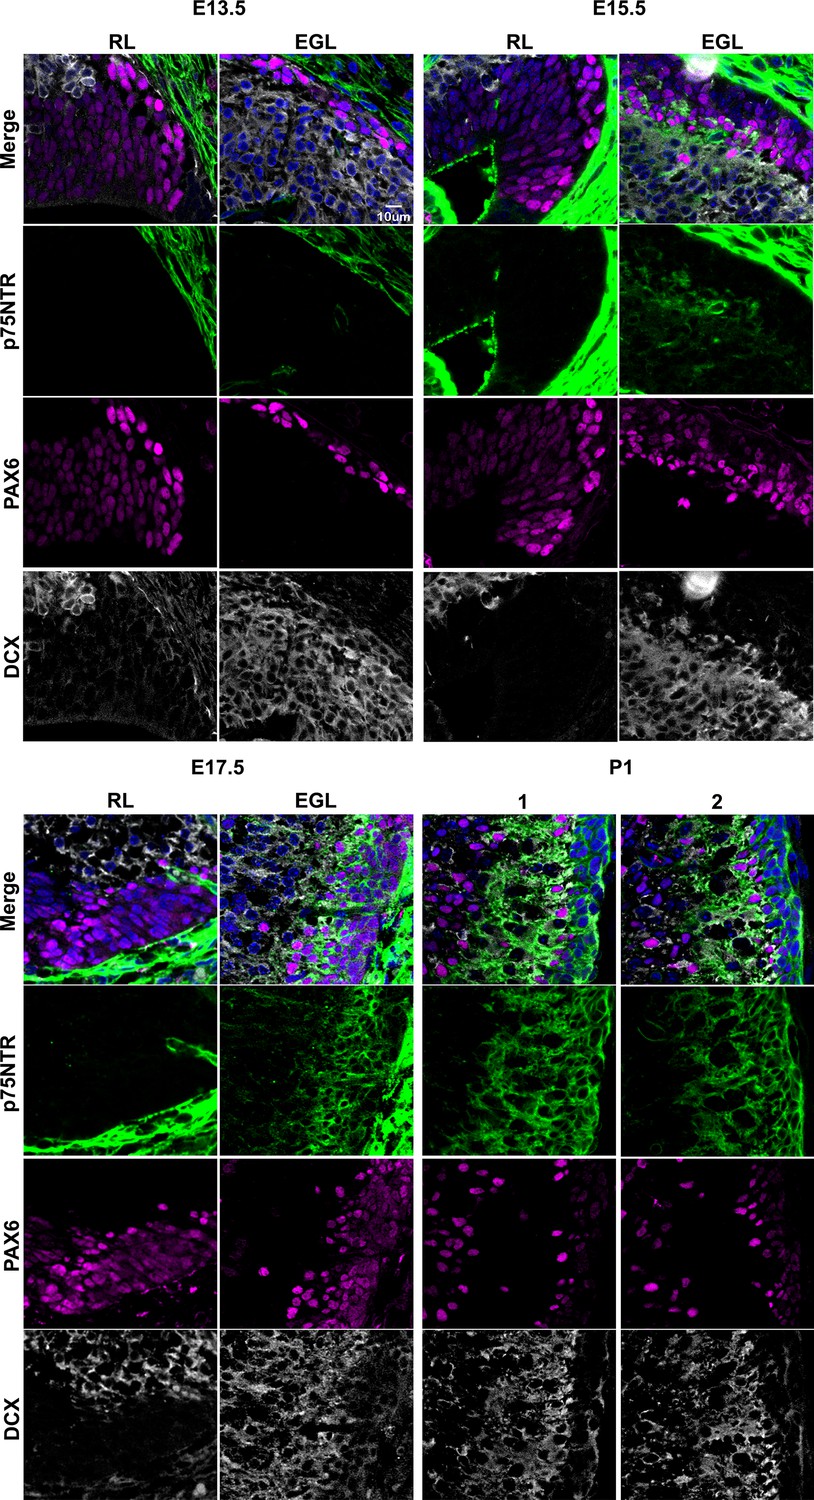
Developmental expression of p75 neurotrophin receptor (p75NTR) in mouse cerebellum.
Mouse developmental expression of p75NTR (green), Pax6 (magenta), DCX (white), and Dapi (blue) at the indicated ages. Note the high level of p75NTR in the meninges as well as the developing granule cell progenitors. Individual channels for Figure 1B.
Figure 2
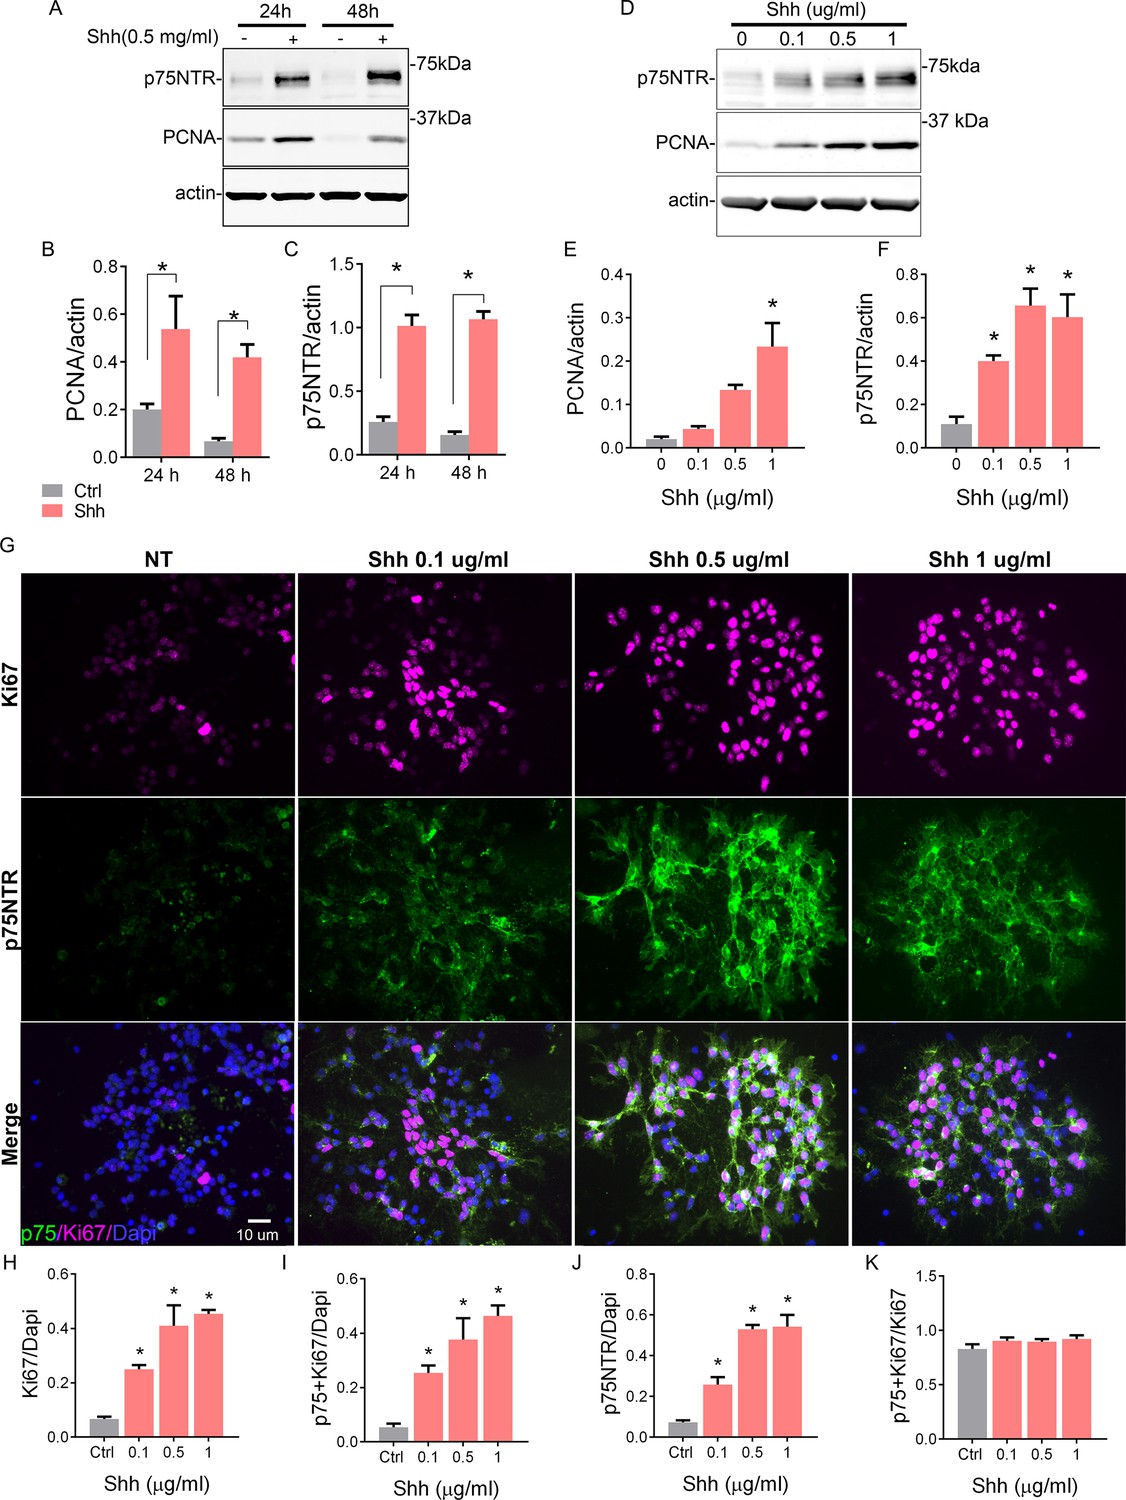
Shh regulates cerebellar granule neuron (CGN) proliferation and the expression of p75 neurotrophin receptor (p75NTR).
(A) Western blot analysis of the temporal and dose-dependent expression of p75NTR and PCNA (proliferation marker) in granule cell cultures exposed to Shh. (B and C) Quantification of PCNA and p75NTR expression relative to actin. Two-way ANOVA, N=4, PCNA *p=0.0006, p75NTR *p=0.0001, error bars indicate SEM. (D) Western blot analysis of the expression of p75NTR and PCNA in granule cell cultures in response to increasing concentrations of Shh for 48 hr. (E and F) Quantification of PCNA and p75NTR expression relative to actin. One-way ANOVA, N=3, PCNA *p=0.0026, p75NTR *p=0.0019, error bars indicate SEM. (G) Immunocytochemistry analysis of the expression of p75NTR (green), Ki67 (magenta), and Dapi (blue) in granule cell cultures in response to increasing concentrations of Shh for 48 hr. (H) Quantification of the total number of proliferating cells expressed as the percentage of cells expressing Ki67 over the total number of cells ANOVA, *p=0.0005, N=3, error bars indicate SEM. (I) Quantification of the number of Ki67+ p75 NTR double-labeled cells express as the number of cells expressing Ki67 and p75NTR over the total number of cells (Dapi). One-way ANOVA, N=3, *p=0.0013, error bars indicate SEM. (J) Quantification of the number of p75NTR positive cells, expressed as the number of p75NTR positive cells over the total number of cells (Dapi). One-way ANOVA, N=3, *p=0.0001, error bars indicate SEM. (K) Quantification of the number of proliferating cells that also express p75NTR, expressed as the number of double-labeled Ki67+ p75 NTR cells over the total Ki67 expressing cells. One-way ANOVA, N=3, *p=0.3346, error bars indicate SEM. All the experiments were done using cells obtained from P7 rat pups.
-
Figure 2—source data 1
RAW Western blot for p75 and PCNA.
- https://cdn.elifesciences.org/articles/79934/elife-79934-fig2-data1-v1.zip
-
Figure 2—source data 2
Quantification of p75 and PCNA for blot in Figure 2A.
- https://cdn.elifesciences.org/articles/79934/elife-79934-fig2-data2-v1.xlsx
-
Figure 2—source data 3
RAW Western blot for p75 and PCNA.
- https://cdn.elifesciences.org/articles/79934/elife-79934-fig2-data3-v1.zip
-
Figure 2—source data 4
Quantification of p75 and PCNA for blot in Figure 2D.
- https://cdn.elifesciences.org/articles/79934/elife-79934-fig2-data4-v1.xlsx
-
Figure 2—source data 5
Quantification of Ki67/Dapi, p75+ Ki67/Dapi, p75/Dapi, and p75+ Ki67/Ki67+ cells.
- https://cdn.elifesciences.org/articles/79934/elife-79934-fig2-data5-v1.xlsx
Figure 3 with 1 supplement
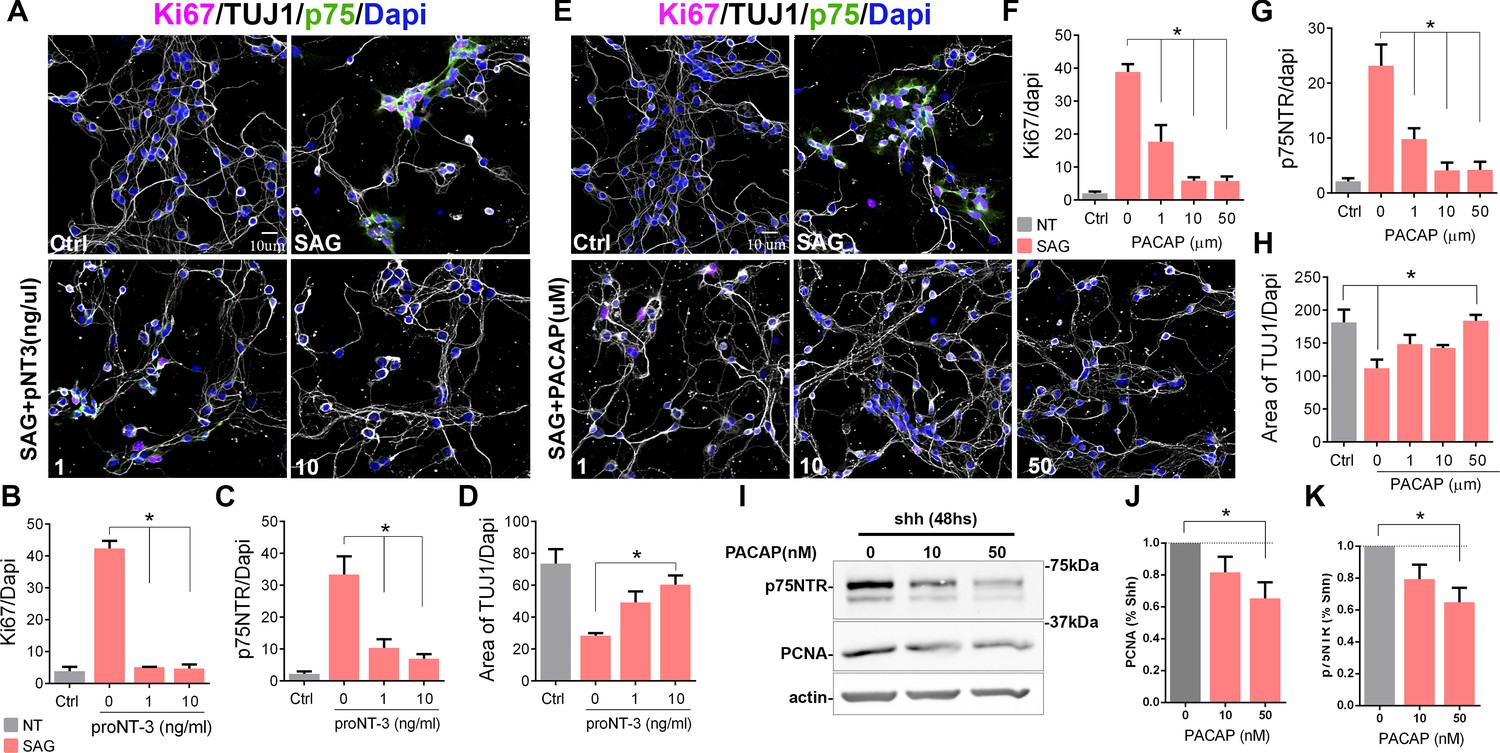
Cell cycle exit induced p75 neurotrophin receptor (p75NTR) downregulation.
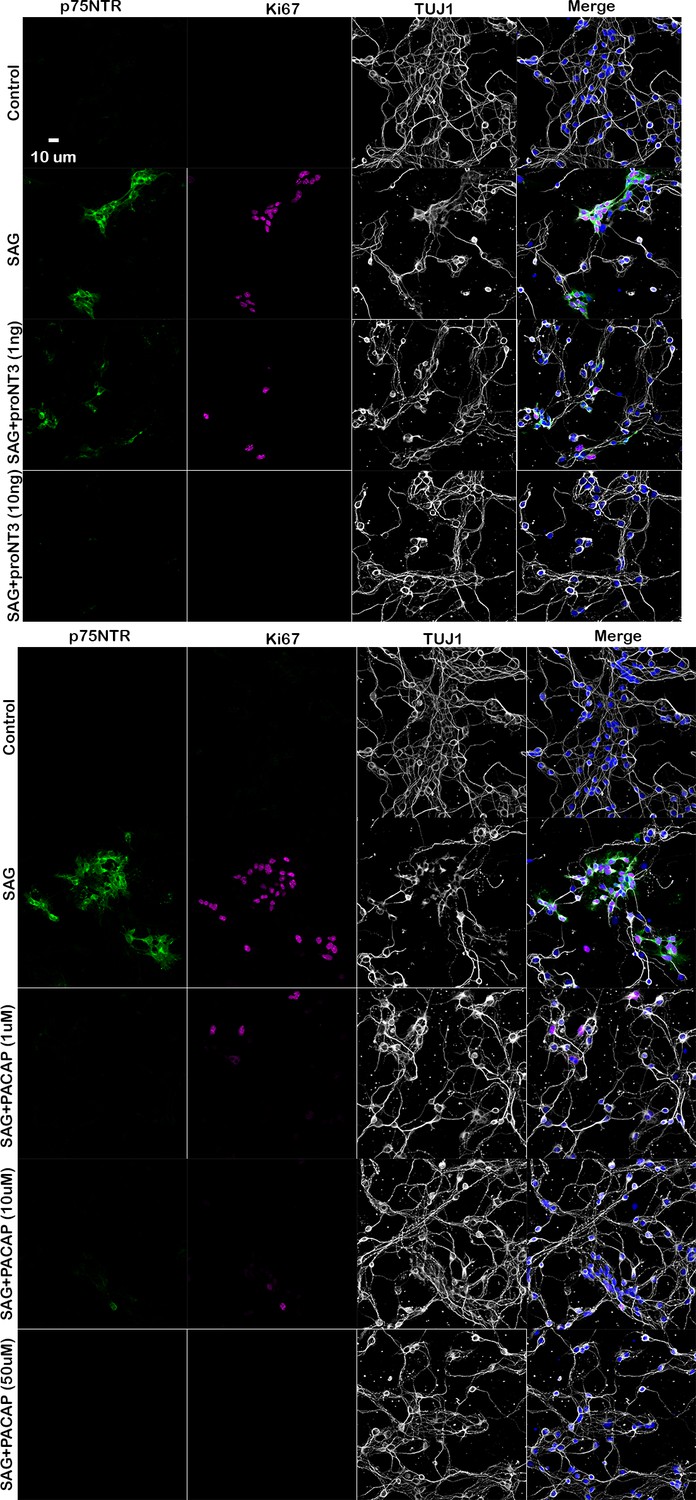
(A) Immunocytochemistry analysis of the expression of p75NTR (green), Ki67 (magenta), βIII-tubulin (white), and Dapi (blue) in granule cell cultures obtained from P7 rat pups, in response to increasing concentrations of proNT-3 after 48 hr in culture. (B) Quantification of the number of cells expressing Ki67 over the total number of cells (Dapi). One-way ANOVA, N=4, *p=0.0001, error bars indicate SEM. (C) Quantification of the number of cells expressing p75NTR over the total number of cells (Dapi). One-way ANOVA, N=4, *p=0.0001, error bars indicate SEM. (D) Quantification of cerebellar granule cell differentiation expressed as the total area of processes positive for TUJ1 over the total number of cells (Dapi). One-way ANOVA, N=4, *p=0.0023, error bars indicate SEM. (E) Immunocytochemistry analysis of the expression of p75NTR (green), Ki67 (magenta), DCX (white), and Dapi (blue) in granule cell cultures obtained from P7 rat pups in response to increasing concentrations of PACAP after 48 hr in culture. (F) Percentage of cells expressing Ki67 over the total number of cells (Dapi). One-way ANOVA, N=4, *p=0.0001, error bars indicate SEM. (G) Percentage of cells expressing p75NTR over the total number of cells (Dapi). One-way ANOVA, N=4, *p=0.0001, error bars indicate SEM. (H) Quantification of cerebellar granule cell differentiation expressed as the total area of processes positive for DCX over the total number of cells (Dapi). One-way ANOVA, N=4, *p=0.0114, error bars indicate SEM. (I) Western blot analysis of the expression of p75NTR and PCNA in granule cell cultures obtained from P7 rat pups in response to increasing concentrations of PACAP after 48 hr in culture. (J) Quantification of PCNA expression in cerebellar granule neuron (CGN) cultures expose to PACAP and normalize to Shh alone. One-way ANOVA, N=4, *p=0.0423, error bars indicate SEM. (K) Quantification of p75NTR expression in CGN cultures expose to PACAP and normalize to Shh alone. One-way ANOVA, N=4, *p=0.0251, error bars indicate SEM. Quantification of the area of TUJ1 processes was done using a custom-built ImageJ macro. All the experiments were done using cells obtained from P7 rat pups.
-
Figure 3—source code 1
ImageJ macro to count TUJ1 in the processes.
- https://cdn.elifesciences.org/articles/79934/elife-79934-fig3-code1-v1.zip
-
Figure 3—source data 1
Quantification of p75, TUJ1, and Ki67 after proNT-3 incorporation.
- https://cdn.elifesciences.org/articles/79934/elife-79934-fig3-data1-v1.xlsx
-
Figure 3—source data 2
Quantification of p75, TUJ1, and Ki67 after PACAP incorporation.
- https://cdn.elifesciences.org/articles/79934/elife-79934-fig3-data2-v1.xlsx
-
Figure 3—source data 3
Raw Western blot for p75 and PCNA after PACAP incorporation.
- https://cdn.elifesciences.org/articles/79934/elife-79934-fig3-data3-v1.zip
-
Figure 3—source data 4
WB (Western blot) quantification of p75 and PCNA after PACAP incorporation.
- https://cdn.elifesciences.org/articles/79934/elife-79934-fig3-data4-v1.xlsx
Figure 3—figure supplement 1
Cell cycle exit induced p75 neurotrophin receptor (p75NTR) downregulation.
Immunocytochemistry analysis of the expression of p75NTR (green), Ki67 (magenta), βIII-tubulin (white), and Dapi (blue) in granule cell cultures obtained from P7 rat pups, in response to increasing concentrations of proNT-3 or PACAP after 48 hr in culture. Individual channels for Figure 3A and E.
Figure 4 with 1 supplement
Overexpression of p75 neurotrophin receptor (p75NTR) is not sufficient to maintain granule cells in a proliferative state.
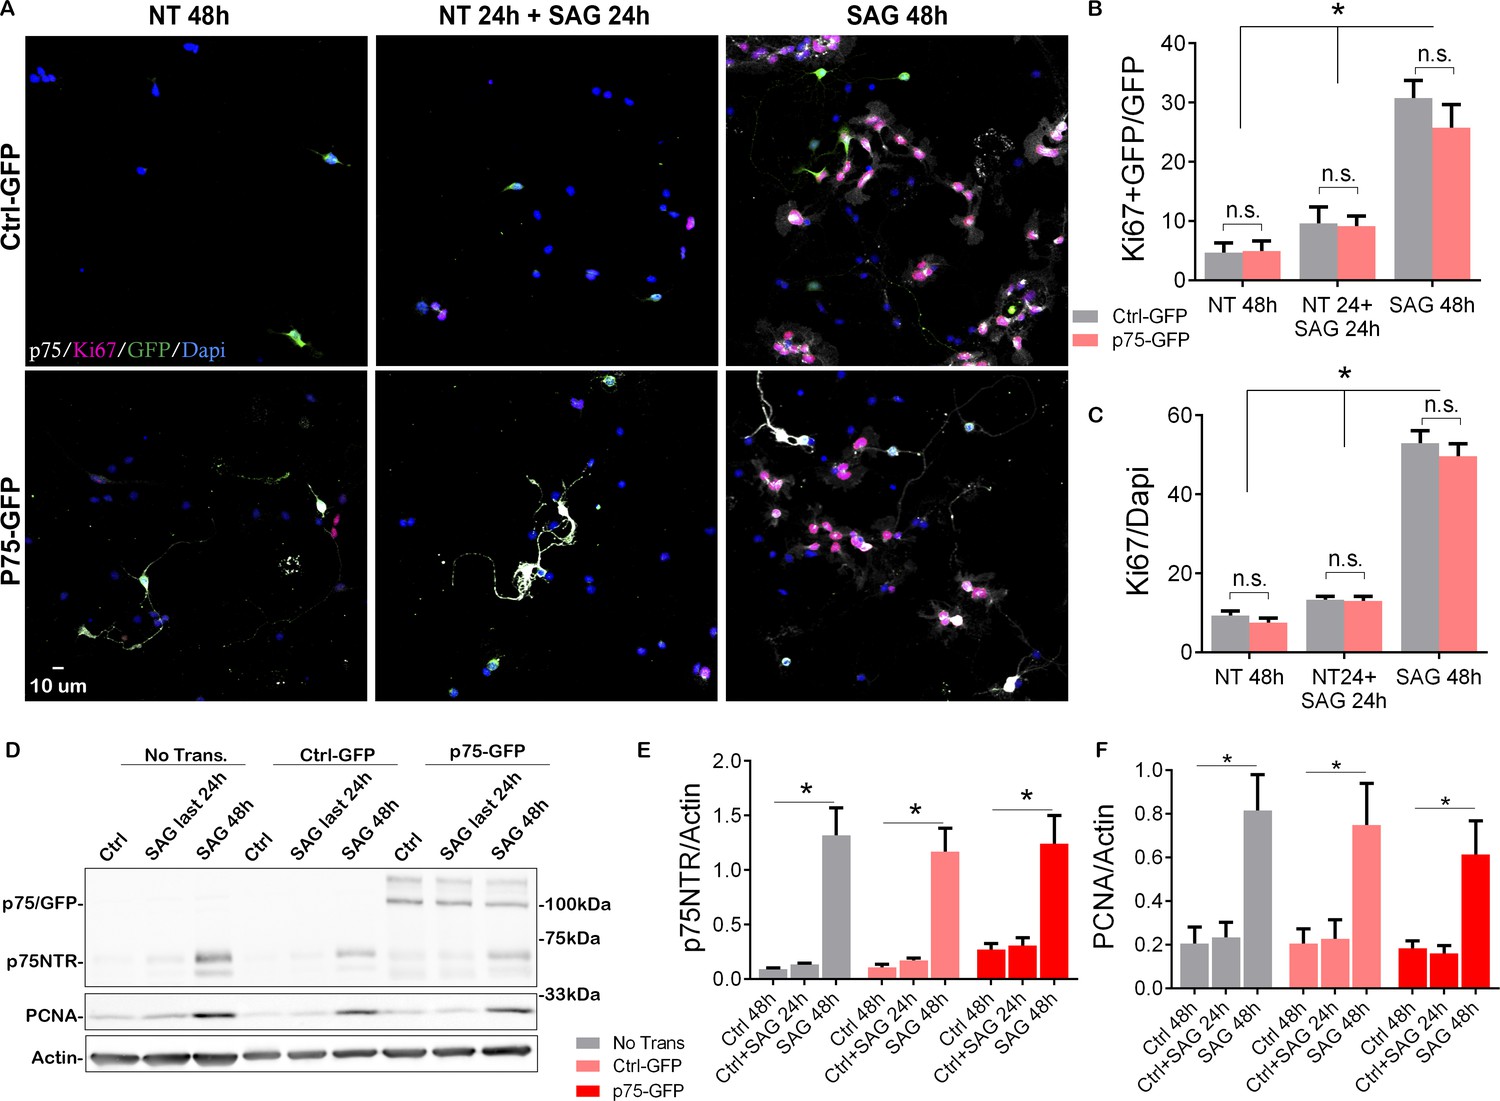
(A) Immunostaining analysis of the expression of p75NTR (white), GFP (green), Ki67 (magenta), and Dapi (blue) in granule cell cultures obtained from P7 rat pups transfected with Ctrl-GFP (top row) or p75-GFP (bottom row) construct. Left panels, cells were maintained in the absence of mitogen for 48 hr. Right panels, transfected cells were maintained in SAG for 48 hr. Middle panel cells were maintained without SAG for the first 24 hr in culture, and in the presence of the mitogen only in the last 24 hr in culture. (B) Quantification of the transfected cells that are proliferating, expressed as the double-labeled Ki67/GFP over the total number of transfected cells (GFP+ cells). Two-way ANOVA, *p=0.0001, N=4, error bars indicate SEM. (C) Quantification of the total number of proliferating cells expressed as the percentage of Ki67+ cells over the total number of cells (Dapi). Two-way ANOVA, N=4, *p=0.0001, error bars indicate SEM. (D) Western blot analysis of the expression levels of p75NTR and PCNA in granule cell cultures obtained from P7 rat pups, first three lanes no transfected cells, last six lanes’ cells transfected with Ctrl-GFP or p75-GFP. (E) Quantification of the expression levels of endogenous p75NTR, Two-way ANOVA, N=4, *p=0.0001, error bars indicate SEM. (F) Quantification of the expression levels of PCNA, Two-way ANOVA, N=4, *p=0.0001, error bars indicate SEM. All the experiments were done using cells obtained from P7 rat pups.
-
Figure 4—source data 1
Quantification of Ki67+ GFP/GFP and Ki67/Dapi cells.
- https://cdn.elifesciences.org/articles/79934/elife-79934-fig4-data1-v1.xlsx
-
Figure 4—source data 2
Raw Western blot for p75 and PCNA after p75-GFP transfection.
- https://cdn.elifesciences.org/articles/79934/elife-79934-fig4-data2-v1.zip
-
Figure 4—source data 3
Western Blot quantification of p75 and PCNA after p75-GFP transfection.
- https://cdn.elifesciences.org/articles/79934/elife-79934-fig4-data3-v1.xlsx
Figure 4—figure supplement 1
Overexpression of p75 neurotrophin receptor (p75NTR) in granule cell precursors (GCPs).
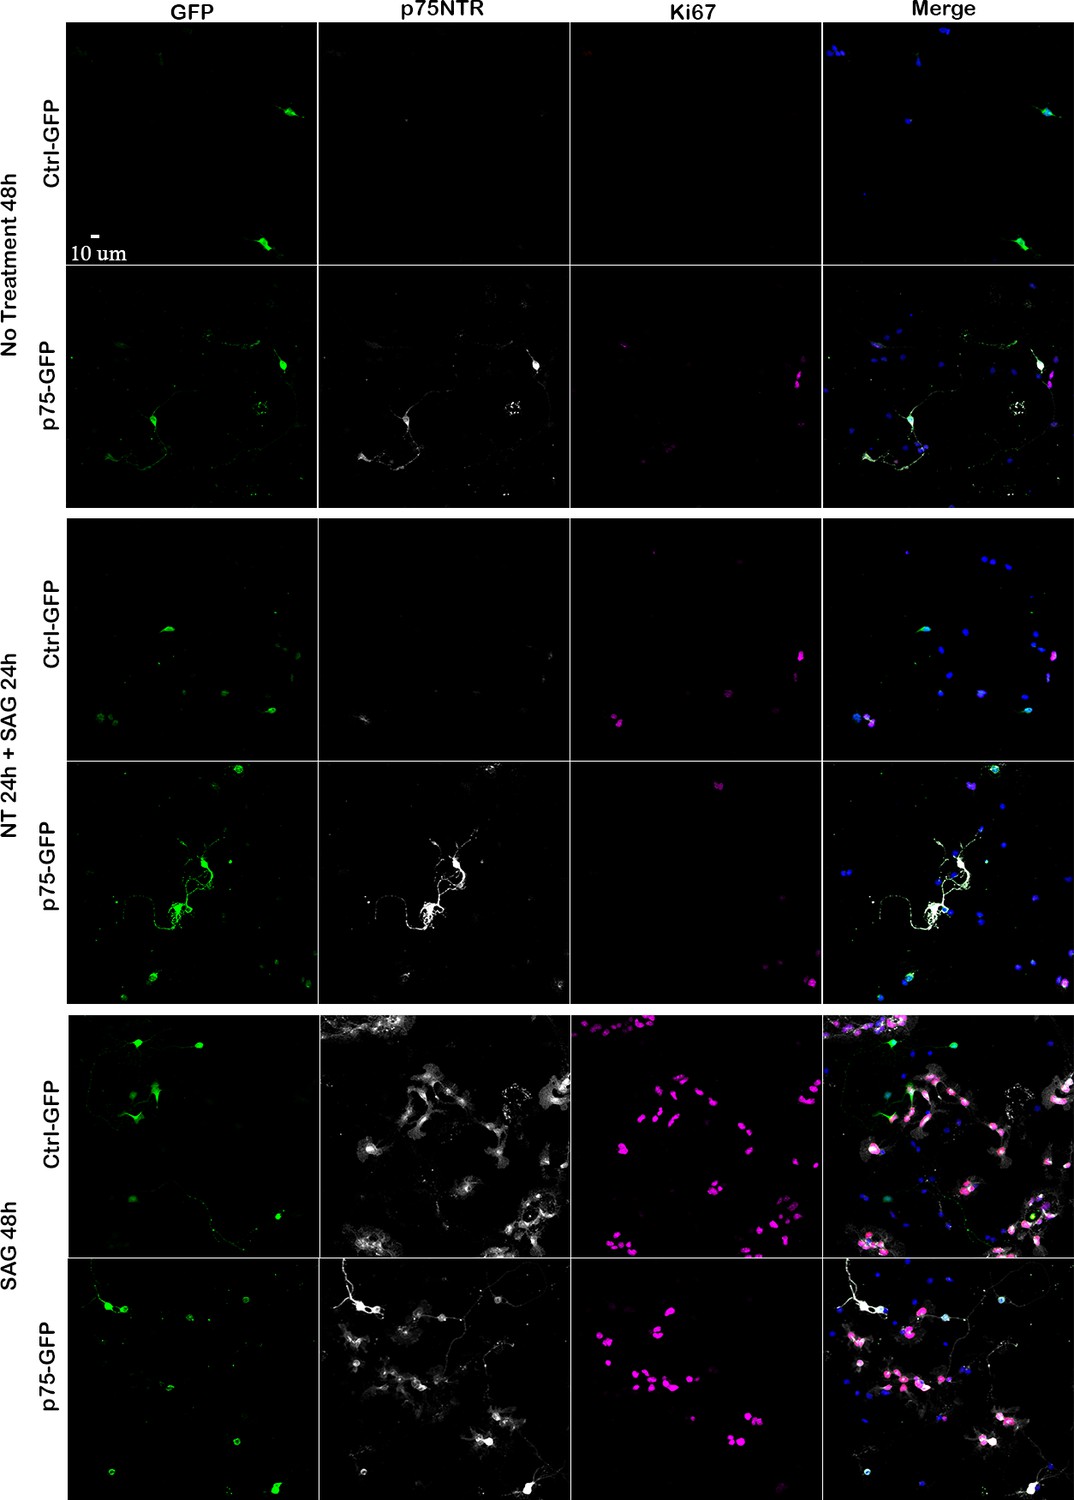
Immunostaining analysis of the expression of p75NTR (white), GFP (green), Ki67 (magenta), and Dapi (blue) in granule cell cultures obtained from P7 rat pups transfected with Ctrl-GFP or p75-GFP construct. GCPs were maintained in the absence of mitogen for 48 hr (top panels), in SAG for 48 hr (bottom panels) or without SAG for the first 24 hr in culture, and in the presence of the mitogen only in the last 24 hr in culture (middle panels). Individual channels for Figure 4A.
Figure 5 with 2 supplements
p75 neurotrophin receptor (p75NTR) prevents cerebellar granule neuron (CGN) migration in vitro.
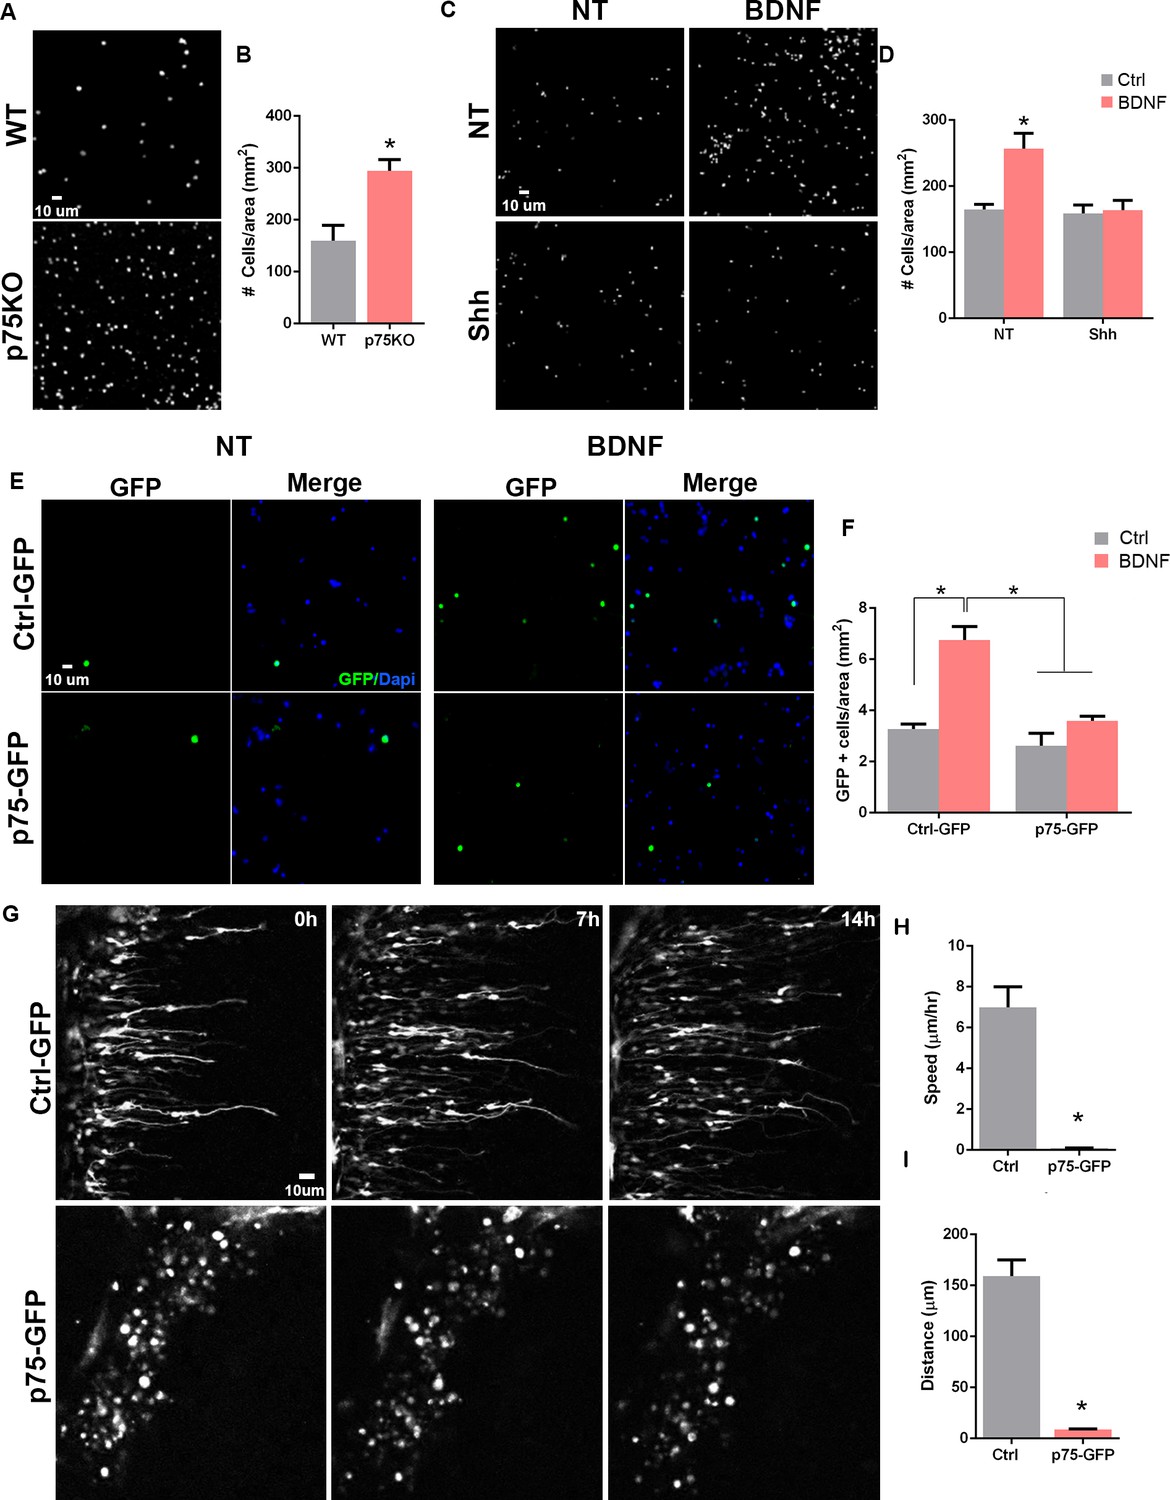
(A) Migration analysis using transwell assay. Dapi staining of cells obtained from WT or p75NTR-/- P7 rat pups. (B) Quantification of CGN migration expressed as the density of Dapi+ cells at the bottom of the filter after 24 hr. At the beginning of the experiment the same number of cells were plated on top of the filter. No ligand was added to stimulate the migration. Unpaired t-test, N=4, *p=0.01, error bars indicate SEM. (C) Migration analysis using transwell assay in granule cells obtained from P7 rat pups exposed to Shh in the top and bottom compartment and brain-derived neurotrophic factor (BDNF) in the bottom compartment. (D) Quantification of CGN migration expressed as the density of Dapi+ cells at the bottom of the filter after 24 h of BDNF exposure. Two-way ANOVA, N = 4, p = 0.0186, error bars indicate SEM. (E) Migration analysis using transwell assay in granule cells obtained from P7 rat pups transfected with Ctrl-GFP or p75-GFP construct and expose to BDNF in the bottom compartment. GFP immunostaining of the transfected cells. (F) Quantification of CGN migration expressed as the density of transfected GFP+ cells at the bottom of the filter after 24 hr of BDNF exposure. Two-way ANOVA, N=4, *p=0.0065, error bars indicate SEM. (G) Time-lapse pictures from cerebellar organotypic slices were obtained from P7 rat pups and transfected with Ctrl-GFP (top panels) or p75NTR-GFP (bottom panels). (H) Mean migration speed is expressed as the total distance migrated over the total time of the experiment. Unpaired t-test, N=3, p = 0.0001, error bars indicate SEM. (I) Total distance migrated is expressed as the mean distance migrated per cell. Unpaired t-test, N=3, p = 0.0003, error bars indicate SEM. The experiments were done using cells from P7 rat pups.
-
Figure 5—source data 1
Quantification of Dapi cells/area of filter WT vs. p75KO.
- https://cdn.elifesciences.org/articles/79934/elife-79934-fig5-data1-v1.xlsx
-
Figure 5—source data 2
Quantification of Dapi cells/area of filter expose to brain-derived neurotrophic factor (BDNF) and/or Shh.
- https://cdn.elifesciences.org/articles/79934/elife-79934-fig5-data2-v1.xlsx
-
Figure 5—source data 3
Quantification of GFP+ cells/ area of filter after p75-GFP transfection.
- https://cdn.elifesciences.org/articles/79934/elife-79934-fig5-data3-v1.xlsx
Figure 5—video 1
Timelapse image of P7 rat pup cerebellum transfected with Ctrl-GFP.
Figure 5—video 2
Timelapse image of P7 rat pup cerebellum transfected with p75-GFP.
Figure 6
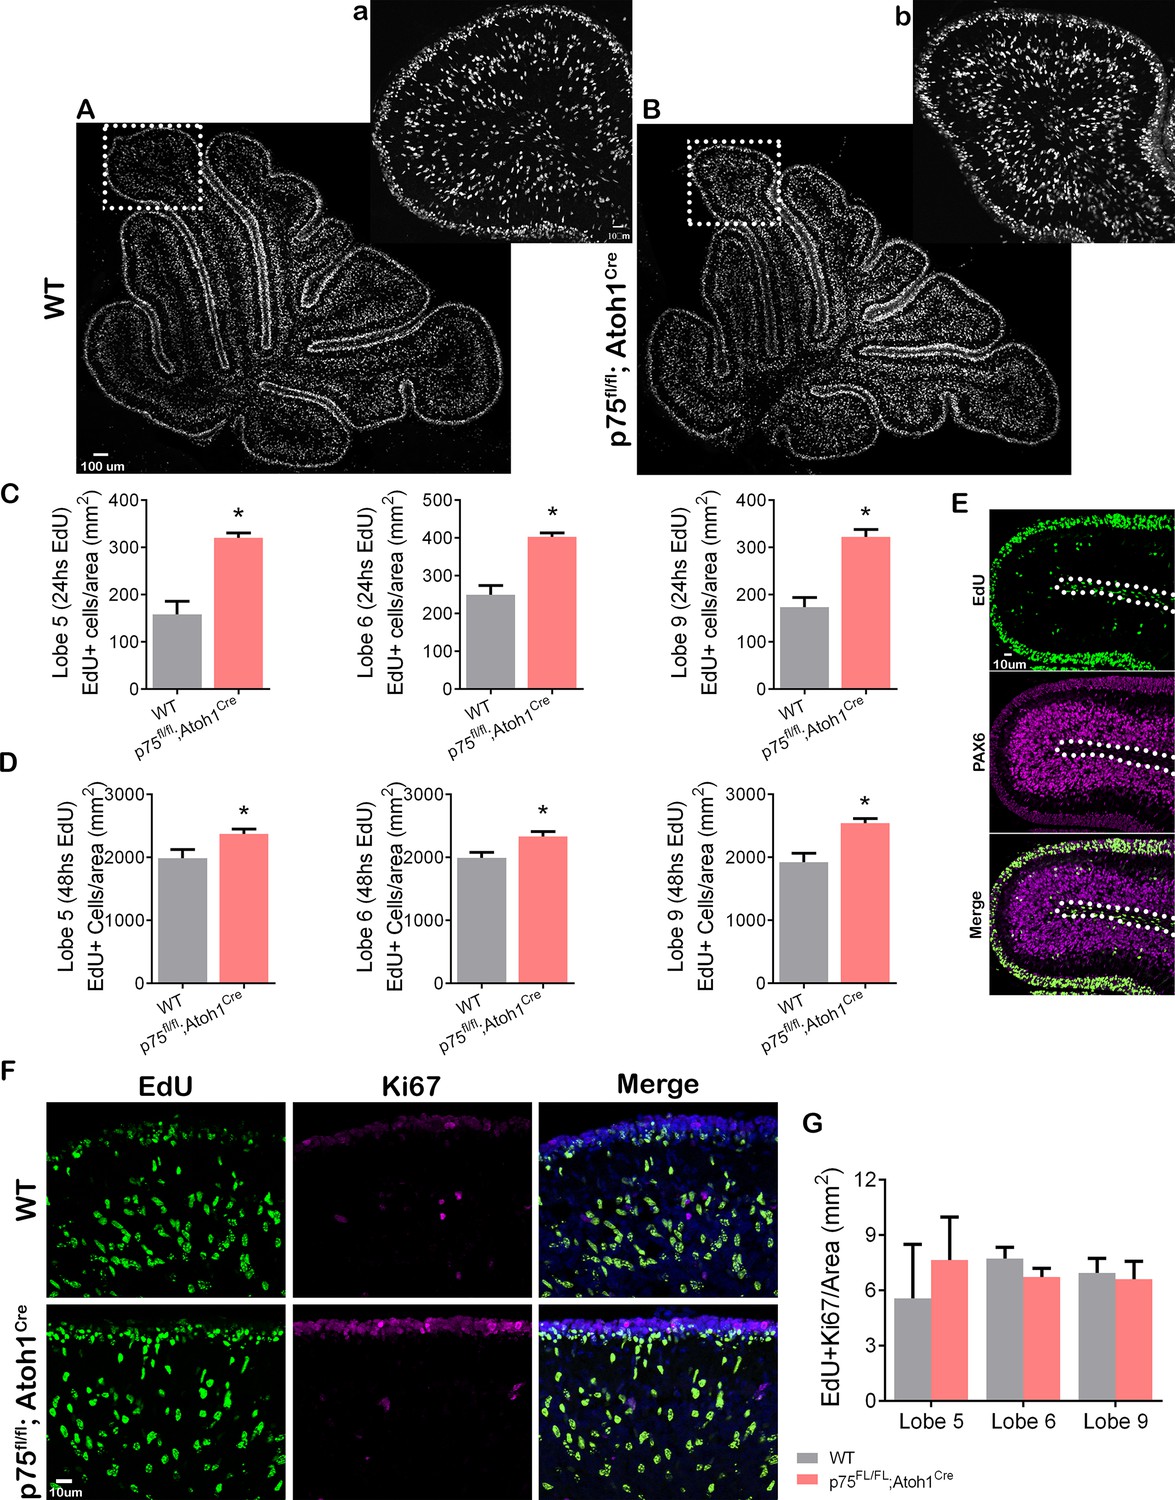
p75 neurotrophin receptor (p75NTR) prevents cerebellar granule neuron (CGN) migration in vivo.
(A–B) Immunohistochemistry for EdU of cerebellar sections from P9 mouse. (a–b) High magnification of the inset shown in panels (A–B). (C–D) Quantification of the density of migrating cells in the cerebellum of mouse pups. Migrating cells are expressed as the total number of EdU positive cells in the internal granule layer (IGL) per mm2. (C) P8 mouse pups injected with EdU 24 hr before euthanizing the animal. Unpaired t-test, WT N=6, p75fl/fl; Atoh1Cre N=4, Lobe 5 *p=0.0001, Lobe 6 *p=0.0001, Lobe 9 *p=0.0001, error bars indicate SEM. (D) P9 mouse pups were injected with EdU 48 hr before euthanizing the animal. Unpaired t-test, WT N=9, p75fl/fl; Atoh1Cre N=9, Lobe 5 *p=0.0302, Lobe 6 *p=0.0117, Lobe 9 *p=0.0012, error bars indicate SEM. (E) Cerebellar section from a WT P8 mouse injected with EdU 24 hr before euthanizing the animal. EdU (green) and Pax6 (granule cell marker, magenta). (F) Immunohistochemistry of cerebellar sections from P9 mouse pups injected with EdU 48 hr before euthanizing the animal. EdU (green), Ki67 (proliferation marker, magenta), and Dapi (blue). (G) Quantification of the migrating cells that continued to express Ki67, expressed as the density of EdU/Ki67 double-labeled cells in the IGL. One-way ANOVA, N=3, p=0.2516, error bars indicate SEM. The experiments presented here were done using P7 to P9 mouse pups.
-
Figure 6—source data 1
Quantification of EdU+ cells/area after 24 hr of EdU injection.
- https://cdn.elifesciences.org/articles/79934/elife-79934-fig6-data1-v1.xlsx
-
Figure 6—source data 2
Quantification of EdU+ cells/area after 48 hr of EdU injection.
- https://cdn.elifesciences.org/articles/79934/elife-79934-fig6-data2-v1.xlsx
-
Figure 6—source data 3
Quantification of EdU+ and Ki67+ cells/area in the internal granule layer (IGL).
- https://cdn.elifesciences.org/articles/79934/elife-79934-fig6-data3-v1.xlsx
Figure 7 with 3 supplements

RhoA activation prevents cerebellar granule neuron (CGN) migration.
(A) Quantification of the levels of active RhoA in granule cell cultures from WT or p75KO P7 rat pups after 48 hr in culture. Unpaired t-test, N=4, *p=0.0052, error bars indicate SEM. (B) Migration analysis using transwell assay in cells exposed the Rock inhibitor, Y27632 (top and bottom compartment), and brain-derived neurotrophic factor (BDNF) (bottom compartment). Two-way ANOVA, N=5, *p=0.0005 error bars indicate SEM. (C) Time-lapse pictures from cerebellar organotypic slices from P7 rat pups, transfected with Ctrl-GFP in the presence of the Rock inhibitor, Y27632. (D) Time-lapse pictures from cerebellar organotypic slices from P7 rat pups, transfected with a constitutively active RhoA construct. (E) Immunostaining of the organotypic slice shown in D after clearing the section using the iDisco method, RhoA-GFP (green), and DCX (magenta). (F) Time-lapse pictures from cerebellar organotypic slices from P7 rat pups, transfected with a p75NTR-GFP construct and exposed to Rock inhibitor (Y27632). Arrowheads indicate the migrating neurons where a leading process is observed. The experiments presented here were done using slices obtained from P7 rat pups.
-
Figure 7—source data 1
Quantification of active RhoA (G-Lisa) WT vs p75KO.
- https://cdn.elifesciences.org/articles/79934/elife-79934-fig7-data1-v1.xlsx
-
Figure 7—source data 2
Quantification of Dapi+ cells/area of filter expose to Rock Inhibitor.
- https://cdn.elifesciences.org/articles/79934/elife-79934-fig7-data2-v1.xlsx
Figure 7—video 1
Time-lapse image of P7 rat pup cerebellum transfected with Ctrl-GFP, in the presence of Rock inhibitor (Y27632 10 μm).
Figure 7—video 2
Time-lapse image of P7 rat pup cerebellum transfected with a constitutive active from of RhoA-GFP.
Figure 7—video 3
Time-lapse image of P7 rat pup cerebellum transfected with p75-GFP in the presence of the Rock inhibitor (Y27632 10 μm).
Additional files
Download links
A two-part list of links to download the article, or parts of the article, in various formats.
Downloads (link to download the article as PDF)
Open citations (links to open the citations from this article in various online reference manager services)
Cite this article (links to download the citations from this article in formats compatible with various reference manager tools)
p75NTR prevents the onset of cerebellar granule cell migration via RhoA activation
eLife 11:e79934.
https://doi.org/10.7554/eLife.79934


