Efficacy and safety of metabolic interventions for the treatment of severe COVID-19: in vitro, observational, and non-randomized open-label interventional study
- Grass Center for Bioengineering, Benin School of Computer Science and Engineering, Israel
- Department of Cell and Developmental Biology, Silberman Institute of Life Sciences, Israel
- Division of Infectious Diseases, Barzilai Medical Center, Israel
- Central Virology Laboratory, Public Health Services, Ministry of Health and Sheba Medical Center, Israel
- Laboratory Division, Shamir (Assaf Harofeh) Medical Center, Italy
- Klarman Cell Observatory, The Broad Institute of Harvard and MIT, United States
- Hadassah Research and Innovation Center, Israel
- Department of Nursing, Faculty of School of Life and Health Sciences, The Jerusalem College of Technology Lev Academic Center, Israel
- Department of Gastroenterology, Sourasky Medical Center, Israel
- IRCSS S.Orsola-Malpighi University Hospital, Italy
- Centro Grossi Paoletti, Dipartimento di Scienze Farmacologiche e Biomolecolari, Università degli Studi di Milano, Italy
- Centro Dislipidemie, Niguarda Hospital, Italy
- Perelman School of Medicine, University of Pennsylvania, United States
- BioStats Statistical Consulting Ltd, Israel
- Sackler Faculty of Medicine, Tel Aviv University, Israel
Figures
Figure 1 with 1 supplement
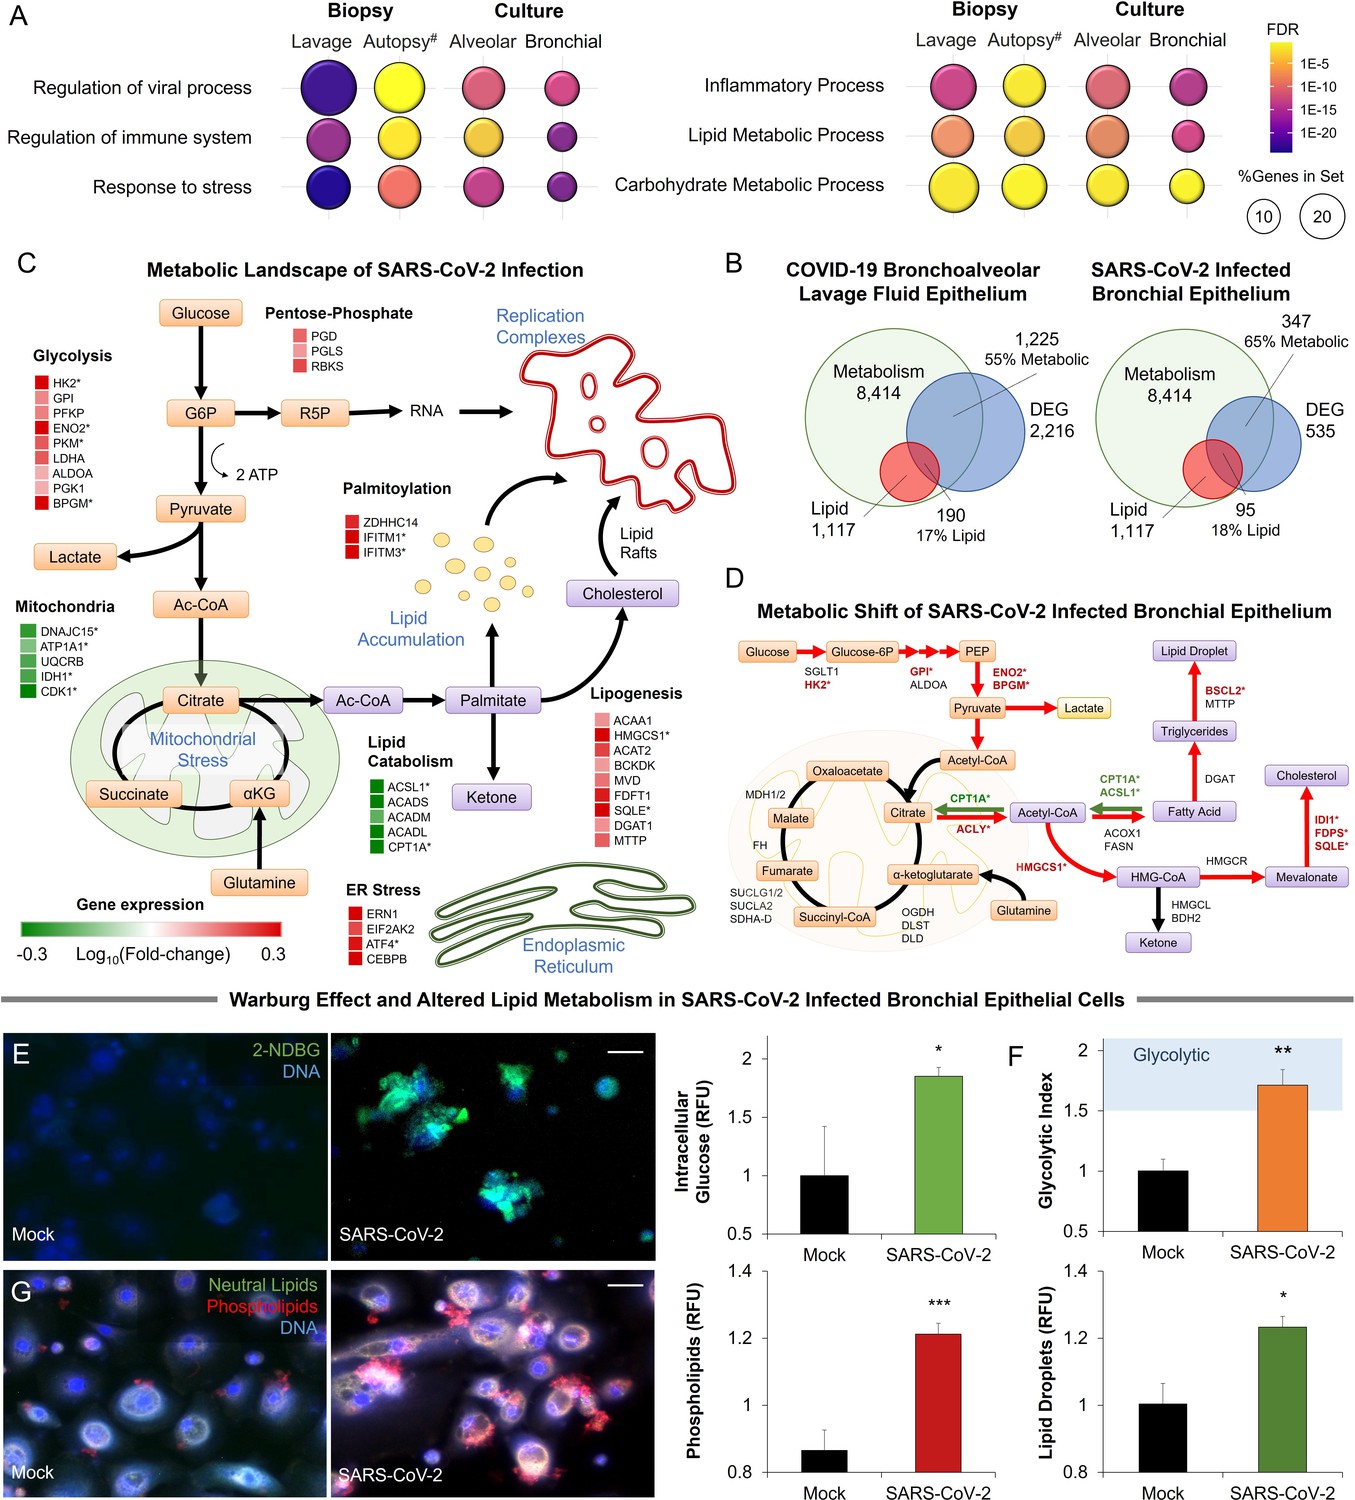
Metabolic fingerprint of SARS-CoV-2 infection.
(A) Bubble plot visualization of GO terms enriched by SARS-CoV-2 infection. Epithelial cells were isolated by bronchoalveolar lavage from 6 severe COVID-19 patients compared to 4 healthy patients (lavage). Post-mortem lung biopsies from 2 severe COVID-19 patients compared to surgical biopsies from 2 non-COVID patients (autopsy). Culture sample groups include primary small airway epithelial cells (n=3; alveoli) and primary bronchial epithelial cells (n=3; bronchial) infected with SARS-CoV-2. Enrichment analysis shows immunoinflammatory response, cellular stress (FDR <10–22), and lipid metabolism (FDR <10–5). (B) Venn diagram describing the relationship between differentially expressed genes (DEG), metabolic genes (GO:0008152), and lipid metabolism genes (GO:0006629) in SARS-CoV-2 infection of primary bronchial epithelial cells and COVID-19 patient samples. Across all four sample groups 58 ± 3% of the differentially expressed genes were metabolism-related, with 15 ± 2% of the genes associated with lipid metabolism. (C) Schematic depicting the metabolic landscape of SARS-CoV-2 infection superimposed with a heat map of pathway-associated genes. Red and green boxes indicate gene expression changes following infection in primary bronchial epithelial cells. * marks differentially regulated genes (n=3, FDR <0.05). (D) Schematic of central carbon metabolism and lipid metabolism fluxes superimposed with flux-associated genes. Differentially expressed genes (n=3, FDR <0.01) are marked with *. Genes and associated fluxes are highlighted in red or green for up- or down-regulation, respectively. (E) Microscopic evaluation of primary bronchial epithelial cells infected with SARS-CoV-2 virus or mock control shows an 85% increase in the intracellular accumulation of fluorescent glucose analog (n=3). (F) The ratio of lactate production to glucose uptake (glycolytic index) in SARS-CoV-2 and mock-infected primary cells. Index increases from 1.0 to 1.7 out of 2.0 indicating a transition to glycolysis (i.e. Warburg effect). (G) Microscopic evaluation of primary bronchial epithelial cells infected with SARS-CoV-2 virus or mock control. Neutral lipids (triglycerides) are dyed green while phospholipids are dyed red. Image analysis shows a 23% increase in triglycerides (n=3, p<0.05) and a 41% increase in phospholipids (n=3, p<0.001) following SARS-CoV-2 infection indicating abnormal lipid accumulation in lung epithelium. * p<0.05, ** p<0.01, *** p<0.001.# indicates a small sample size. Bar = 20 µm. Error bars indicate S.E.M.
-
Figure 1—source data 1
Raw measurements, mean, standard error, and student t-test values were used to create the display items in Figure 1.
- https://cdn.elifesciences.org/articles/79946/elife-79946-fig1-data1-v2.xlsx
Figure 1—figure supplement 1
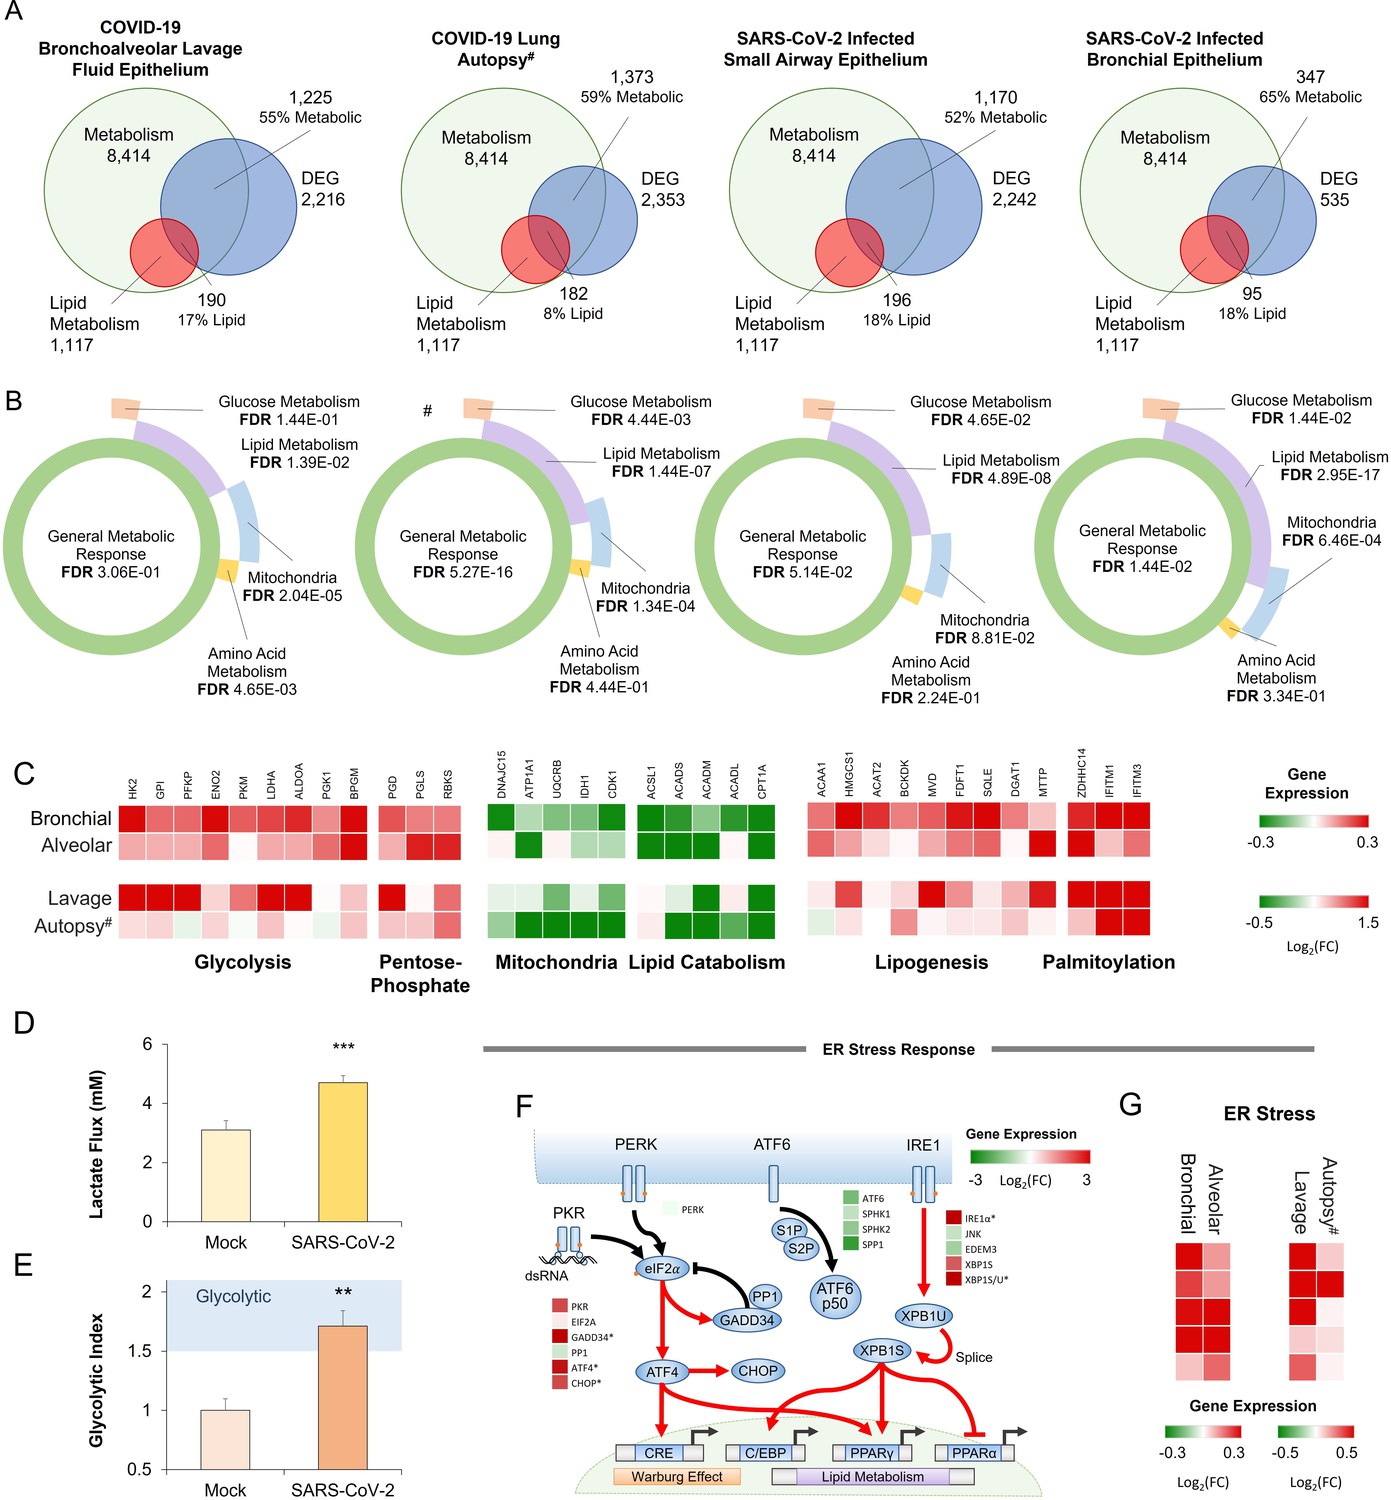
Metabolic signature of infection in COVID-19 patients’ samples and SARS-CoV-2 infected primary cells.
(A) Venn diagrams describing the relationship between differentially expressed genes (DEG), metabolic genes (GO:0008152), and lipid metabolism genes (GO:0006629) in COVID-19 patient sample groups including epithelial cells isolated by bronchoalveolar lavage (lavage) and post-mortem lung biopsies (autopsy), as well as primary small airway epithelial cells (alveoli) and primary bronchial epithelial cells (bronchial) infected with SARS-CoV-2. (B) Sunburst graphs showing the coverage of composite metabolic terms (Levy et al., 2016) on general metabolic response induced by SARS-CoV-2 infection. Lipid and mitochondrial metabolism dominate the transcriptional metabolic signature of infection across all four sample groups. (C) Heat map of metabolic genes (Figure 1D) across four sample groups. Red and green boxes are up and downregulated by infection, respectively. # Indicates small sample size. (D) Metabolic analysis of SARS-CoV-2 and mock-infected primary bronchial epithelial cells confirms a 50% increase (n=6, p<0.001) in lactate production 48 hr post-infection. (E) The ratio of lactate production to glucose uptake (glycolytic index) in SARS-CoV-2 and mock-infected primary cells. Index increases from 1.0 to 1.7 out of 2.0 indicating a transition to glycolysis (i.e. Warburg effect: n=6, p<0.01). (F) Schematic depicting ER stress pathways superimposed with pathway-associated genes. Red and green boxes are up and downregulated by infection, respectively. * marks differentially regulated genes (n=3, FDR <0.05). Red and green arrows schematically note interactions based on the transcriptional response. XBP1S is the IRE1 spliced form of XBP1. (G) Heat map of ER stress pathway-associated genes (Figure 1G) across four sample groups. Red and green boxes are up and downregulated by infection, respectively. * p<0.05, ** p<0.01, *** p<0.001 in a two-sided heteroscedastic student’s t-test against control.# indicates a small sample size. Bar = 20 µm. Error bars indicate S.E.M.
Figure 2 with 1 supplement
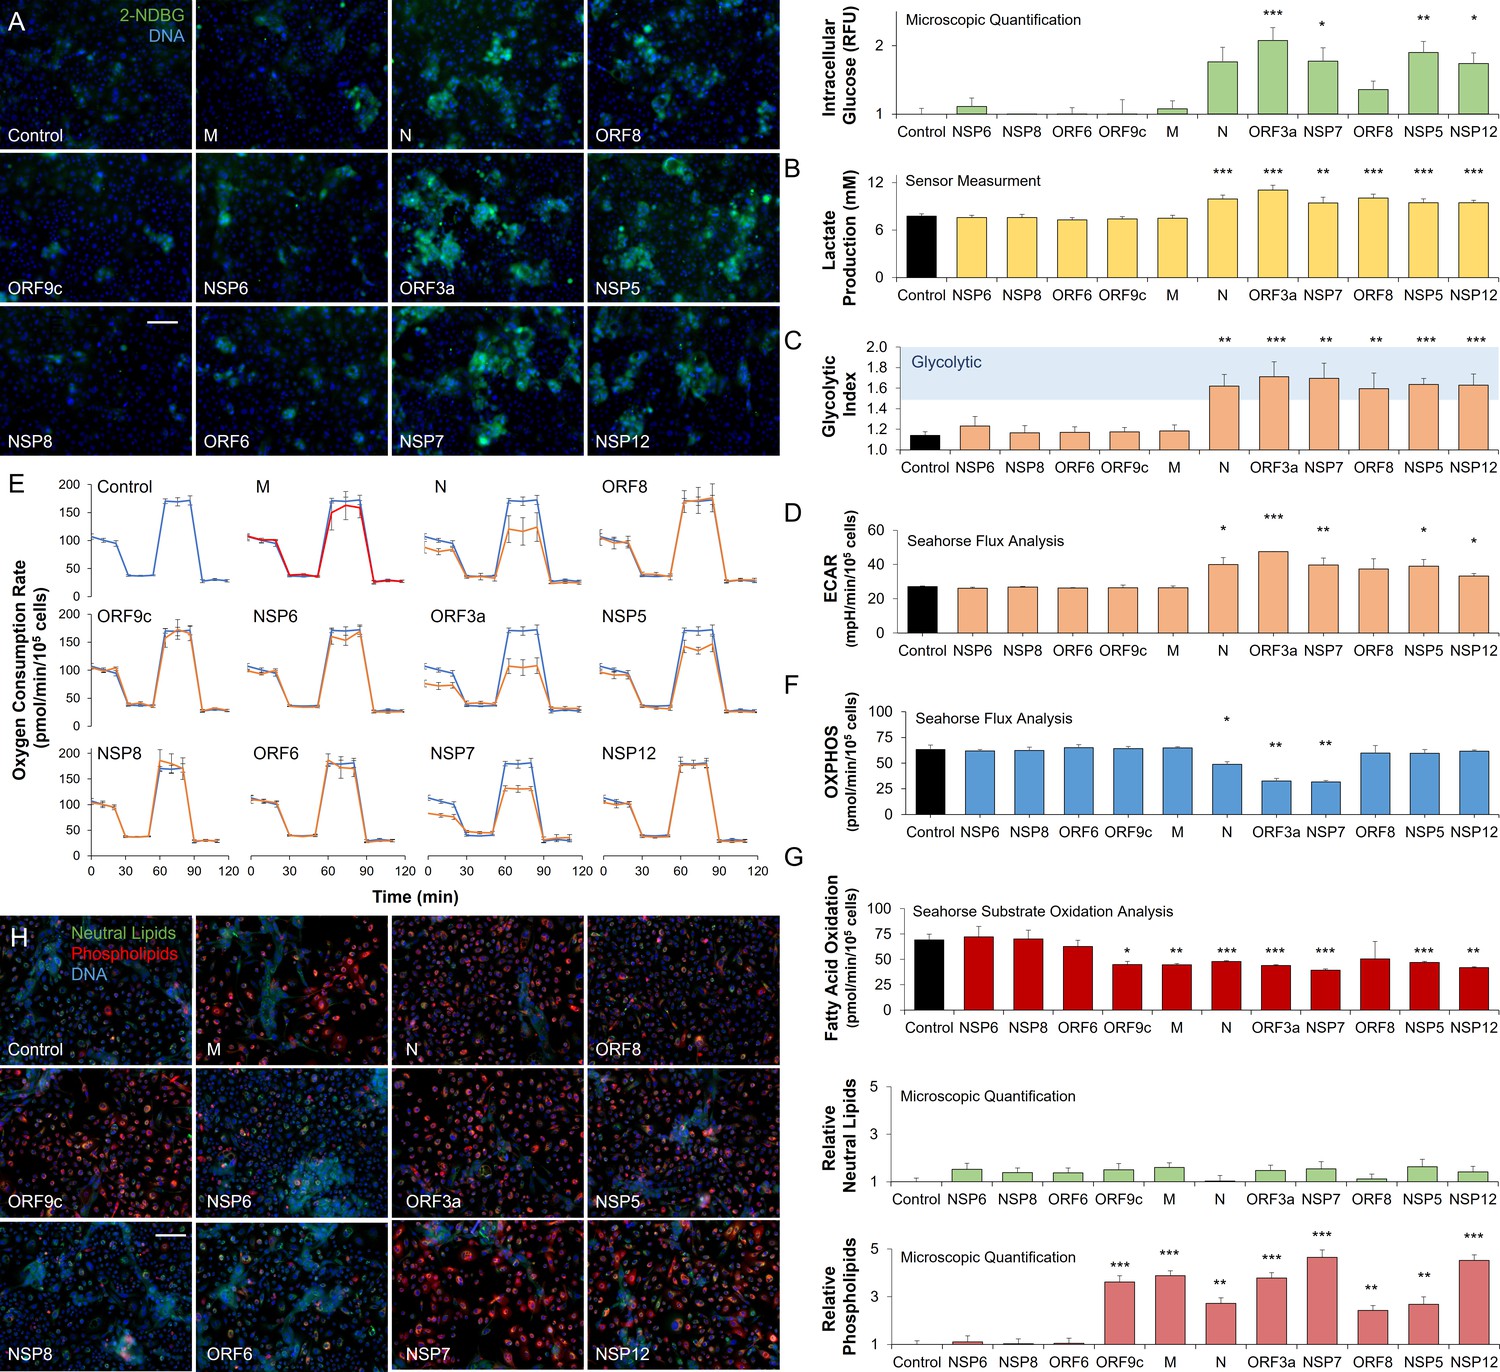
SARS-CoV-2 proteins modulate host metabolic pathways.
Analysis of primary bronchial epithelial cells expressing different SARS-CoV-2 proteins for 72 hr using multiple independent assays. (A) Microscopic analysis shows an increased abundance of fluorescent glucose analog (2-NDBG) by a small set of viral proteins. Quantification shows a significant increase in intracellular glucose in bronchial cells expressing N, ORF3a, NSP7, ORF8, NSP5, and NSP12 (n=6, p<0.05). (B) Direct sensor measurement of lactate production of bronchial epithelial cells shows significantly higher lactate production (n=6, p<0.01) in cells expressing the abovementioned protein subset. (C) The ratio of lactate production to glucose uptake (glycolytic index) in bronchial cells expressing viral proteins. Index significantly increases from 1.1 to 1.7 marking a shift to glycolysis (n=6, p<0.01) induced by the viral proteins. (D) Seahorse analysis of extracellular acidification rate (ECAR) surrogate measurement for lactate production, shows independent confirmation of increased glycolysis (n=6). (E) Seahorse mitochondrial stress analysis of bronchial cells expressing the viral proteins. Oxygen consumption rate (OCR) is shown as a function of time. Oligomycin, FCCP, and antimycin/rotenone were injected at 25, 55, and 85 min, respectively. Orange lines indicate viral protein-expressing cells (n=6). (F) Quantification of oxidative phosphorylation (OXPHOS) shows a decrease of mitochondrial function following expression of N, ORF3a, and NSP7 (n=6, p<0.05). (G) Seahorse XF long-chain fatty acid oxidation stress analysis, a surrogate measurement for lipid catabolism, shows virus protein-induced significant decrease in lipid catabolism by ORF9c, M, N, ORF3a, NSP7, ORF8, NSP5, and NSP12 (n=4, p<0.05). (H) Microscopic analysis of triglycerides (neutral lipids) and phospholipids shows a virus protein-induced perinuclear lipid accumulation. Quantification shows a significant accumulation of phospholipids in cells expressing the same panel of viral proteins that induced lipid catabolism inhibition (n=6, p<0.01). * p<0.05, ** p<0.01, *** p<0.001 in a two-sided heteroscedastic student’s t-test against control. Bar = 50 µm. Error bars indicate S.E.M.
-
Figure 2—source data 1
Raw measurements, mean, standard error, and student t-test values were used to create the display items in Figure 2.
- https://cdn.elifesciences.org/articles/79946/elife-79946-fig2-data1-v2.xlsx
Figure 2—figure supplement 1
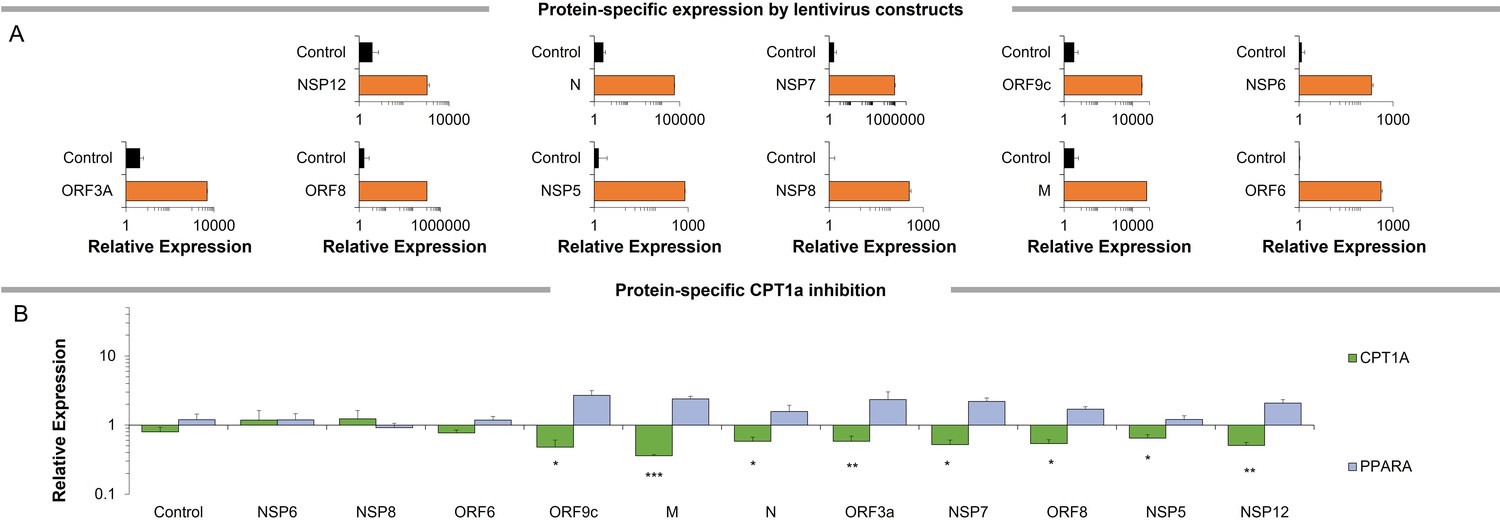
Gene expression patterns of SARS-CoV-2 proteins.
(A) Gene expression analysis of SARS-CoV-2 genes in primary bronchial epithelial cells expressing different SARS-CoV-2 proteins for 72 hr (n=6). (B) Gene expression analysis of PPARα and CPT1α genes in primary bronchial epithelial cells expressing different SARS-CoV-2 proteins for 72 hr (n=6). * p<0.05, ** p<0.01, *** p<0.001 in a two-sided heteroscedastic student’s t-test against control. Error bars indicate S.E.M.
Figure 3 with 3 supplements
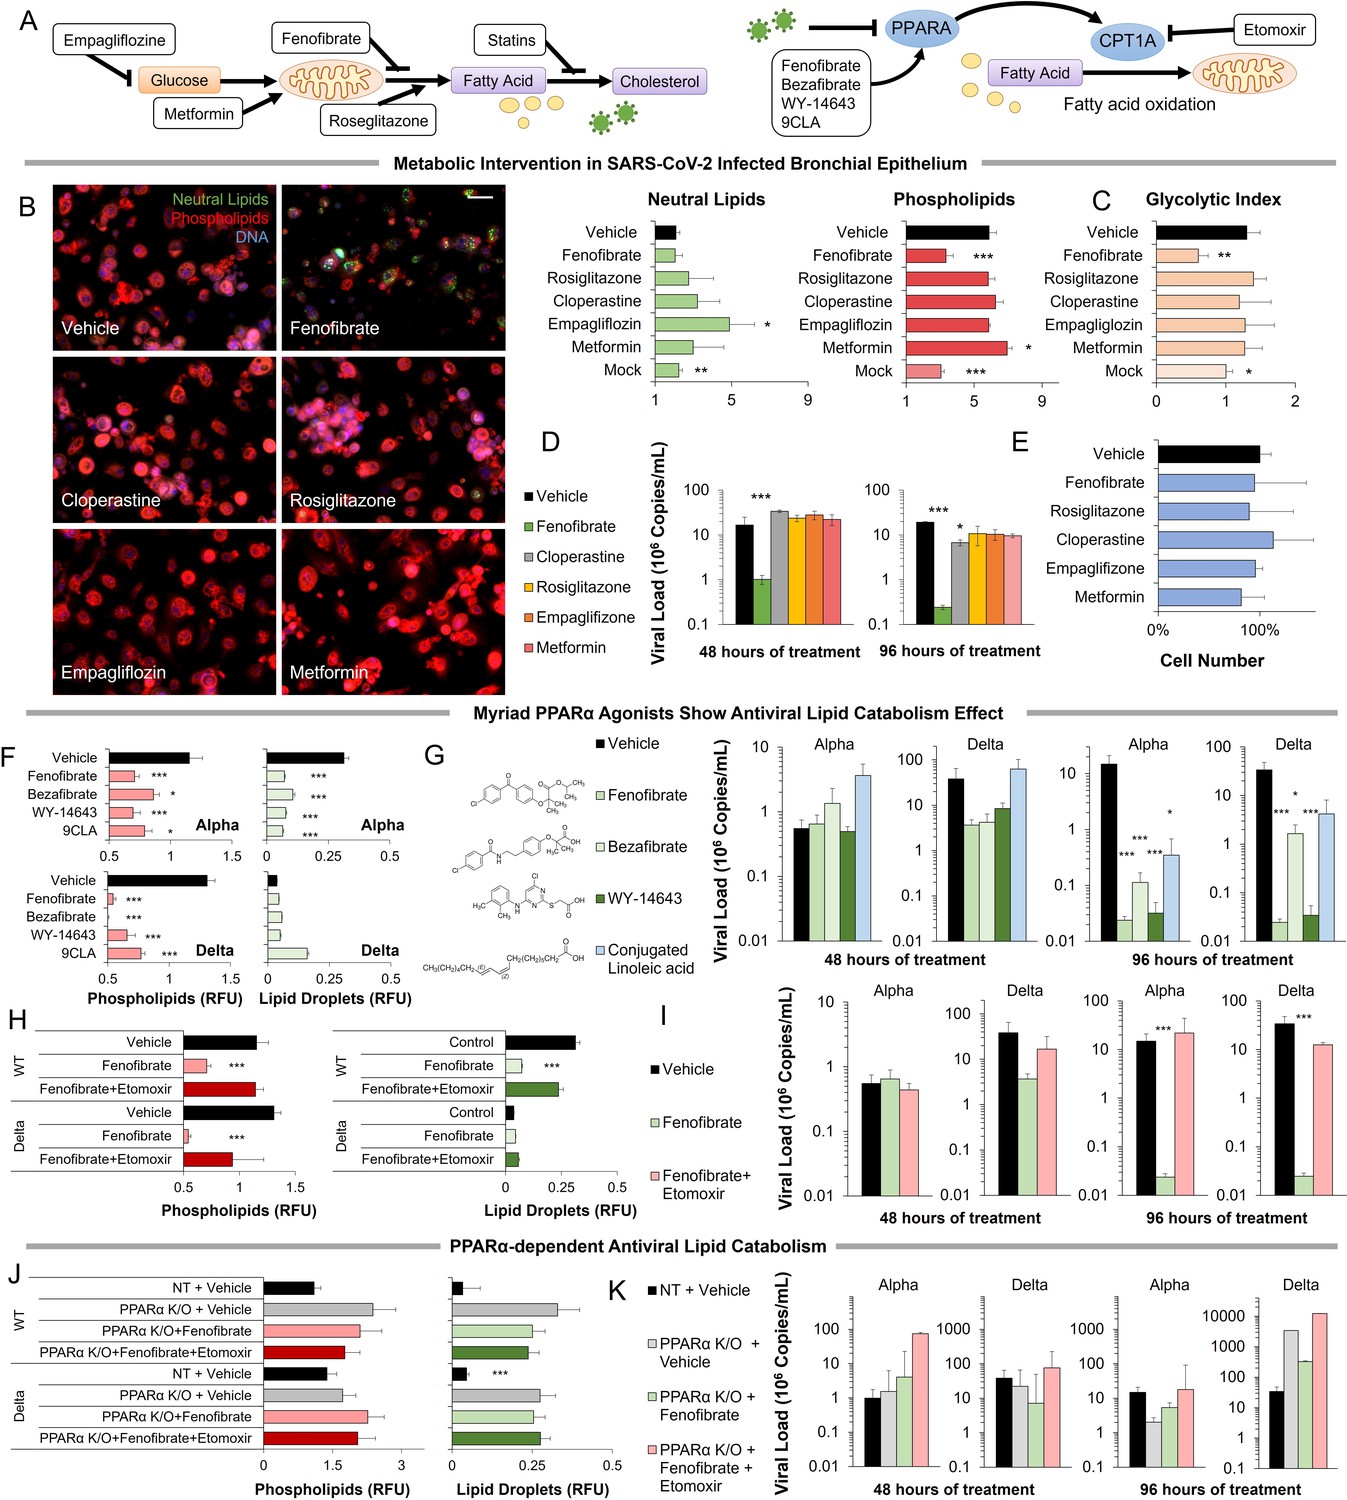
Metabolic intervention of SARS-CoV-2 shows the antiviral effect of PPARα activation.
(A) Left: Schematic depicting potential drug interactions with the metabolic landscape of SARS-CoV-2 infection. Right: Schematic of the relationship between PPARα and fatty acid oxidation in our model. (B) Microscopic analysis of lipid accumulation in lung cells infected by SARS-CoV-2 (USA-WA1/2020) at MOI 2 exposed to different drugs for 96 hr compared to DMSO-treated (vehicle) and mock-infected controls. Cells treated with PPARα agonist fenofibrate showed a significant decrease in phospholipid content (n=3, p<0.001). (C) Lactate over glucose ratio of SARS-CoV-2 infected primary lung cells treated with various drugs. Fenofibrate significantly reduced the lactate-to-glucose ratio by 60% (n=3; p<0.01) normalizing the metabolic shift induced by infection. (D) Quantification of SARS-CoV-2 viral RNA over treatment with a physiological concentration of various drugs or DMSO (vehicle). Treatment with 20 µM fenofibrate (Cmax) reduced SARS-CoV-2 viral load by 2-logs (n=3; p<0.001). Treatment with 10 µM cloperastine reduced viral load by 2.5–3-fold (n=3; p<0.05). (E) Cell number post-treatment was unaffected by all drugs tested. (n=3). (F) Microscopic analysis of lipid accumulation in lung cells infected by SARS-CoV-2 (hCoV-19/Israel/CVL-45526-NGS/2020) and B.1.617.2 variant of concern (hCoV-19/Israel/CVL-12806/2021) exposed to structurally different PPARα agonists for 5 days compared to DMSO-treated cells (vehicle). Cells treated with any PPARα agonists showed a significant decrease in phospholipid content in both viruses (n=6, p<0.001). (G) Quantification of SARS-CoV-2 viral RNA over treatment with a physiological concentration of various PPARα agonists or DMSO (vehicle). Treatment with 20 µM fenofibrate, 50 µM bezafibrate, or 1 µM WY-14643 reduced SARS-CoV-2 viral load by 3–5-logs (n=6; p<0.001). Treatment with 50 µM conjugated (9Z,11E)-linoleic acid and 50 µM oleic acid reduced viral load by 2.5-logs (n=6; p<0.01 in alpha variant). (H) Microscopic analysis of lipid accumulation in lung cells infected by SARS-CoV-2 and B.1.617.2 variant of concern (delta) exposed to PPARα agonist fenofibrate with 4 µM of lipid catabolism inhibitor, etomoxir (ETO) for 5 days compared to DMSO-treated (vehicle). Cells treated with fenofibrate showed a significant decrease in phospholipid content in both viruses (n=6, p<0.001). Phospholipid decrease was reversed by the addition of etomoxir. (I) Quantification of SARS-CoV-2 viral RNA exposed to the PPARα agonist fenofibrate with or without 4 µM of lipid catabolism inhibitor, etomoxir, or DMSO (vehicle). Treatment with 20 µM fenofibrate reduced SARS-CoV-2 viral load by 4–5-logs (n=6; p<0.001). Fenofibrate antiviral effect was reversed by the addition of etomoxir. (J) Microscopic analysis of lipid accumulation in PPARα or NT CRISPR-knockout lung cells (methods) infected by SARS-CoV-2 and B.1.617.2 variant of concern (delta) exposed to PPARα agonist fenofibrate with 4 µM of lipid catabolism inhibitor, etomoxir compared to DMSO-treated (vehicle). PPARα or NT CRISPR-knockout cells treated with fenofibrate did not show a decrease in phospholipid content in either virus and was unaffected by etomoxir (n=6). (K) Quantification of SARS-CoV-2 viral RNA after treatment with the PPARα agonist fenofibrate with or without 4 µM of lipid catabolism inhibitor, etomoxir, or DMSO (vehicle). Genetic inhibition of PPARα causes cells to be refractory to fenofibrate treatment and the addition of etomoxir (n=6). * p<0.05, ** p<0.01, *** p<0.001 in a two-sided heteroscedastic student’s t-test against control. Bar = 30 µm. Error bars indicate S.E.M.
-
Figure 3—source data 1
Raw measurements, mean, standard error, and student t-test values were used to create the display items in Figure 3.
- https://cdn.elifesciences.org/articles/79946/elife-79946-fig3-data1-v2.xlsx
Figure 3—figure supplement 1
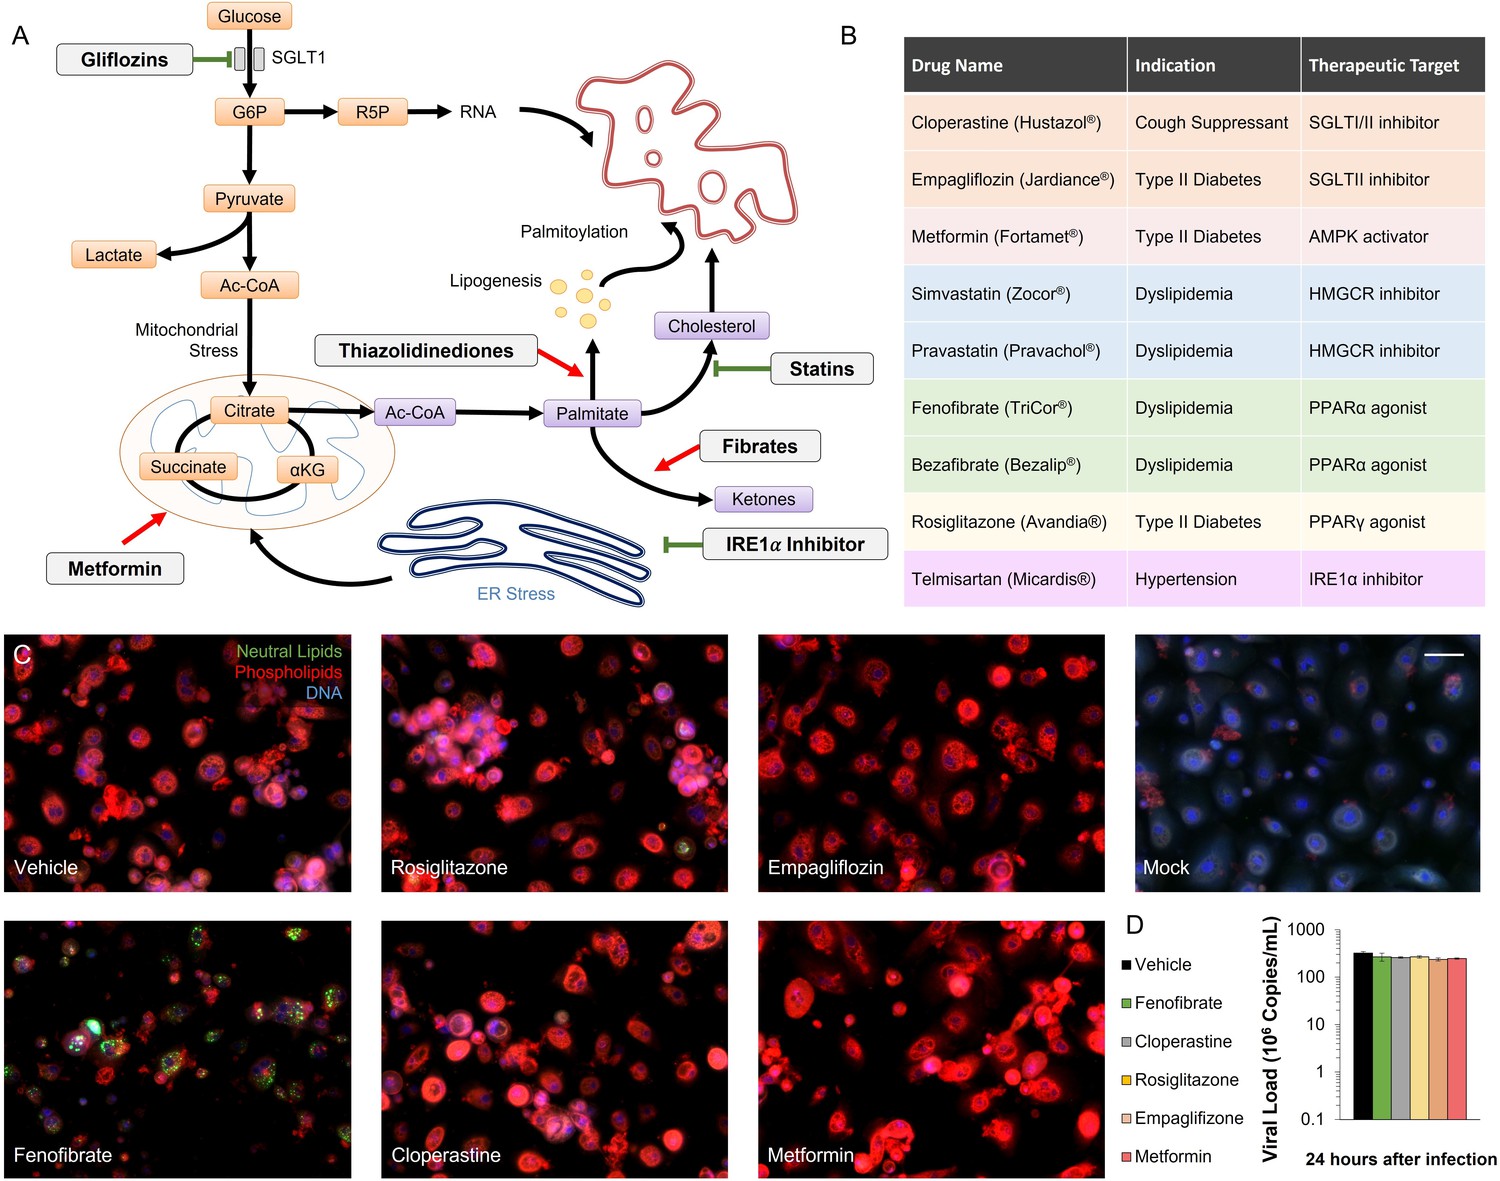
Metabolic regulators in SARS-CoV-2 infection in vitro.
(A) Schematic depicting the metabolic landscape of SARS-CoV-2 infection. Potential drugs (white boxes) and their therapeutic targets are marked on the chart. (B) Table summarizing FDA-approved drugs that interfere with SARS-CoV-2-induced metabolic alterations. (C) Microscopic analysis of lipid accumulation and cell number in alpha variant (USA-WA1/2020) infected bronchial epithelial cells at MOI 2 after treatment with different metabolic regulators, compared to mock-infected bronchial epithelial cells. Bar = 30 µm. (D) Quantification of SARS-CoV-2 viral RNA 24 hours post-infection, prior to treatment. Analysis shows no difference in viral quantities (n = 3).
Figure 3—figure supplement 2
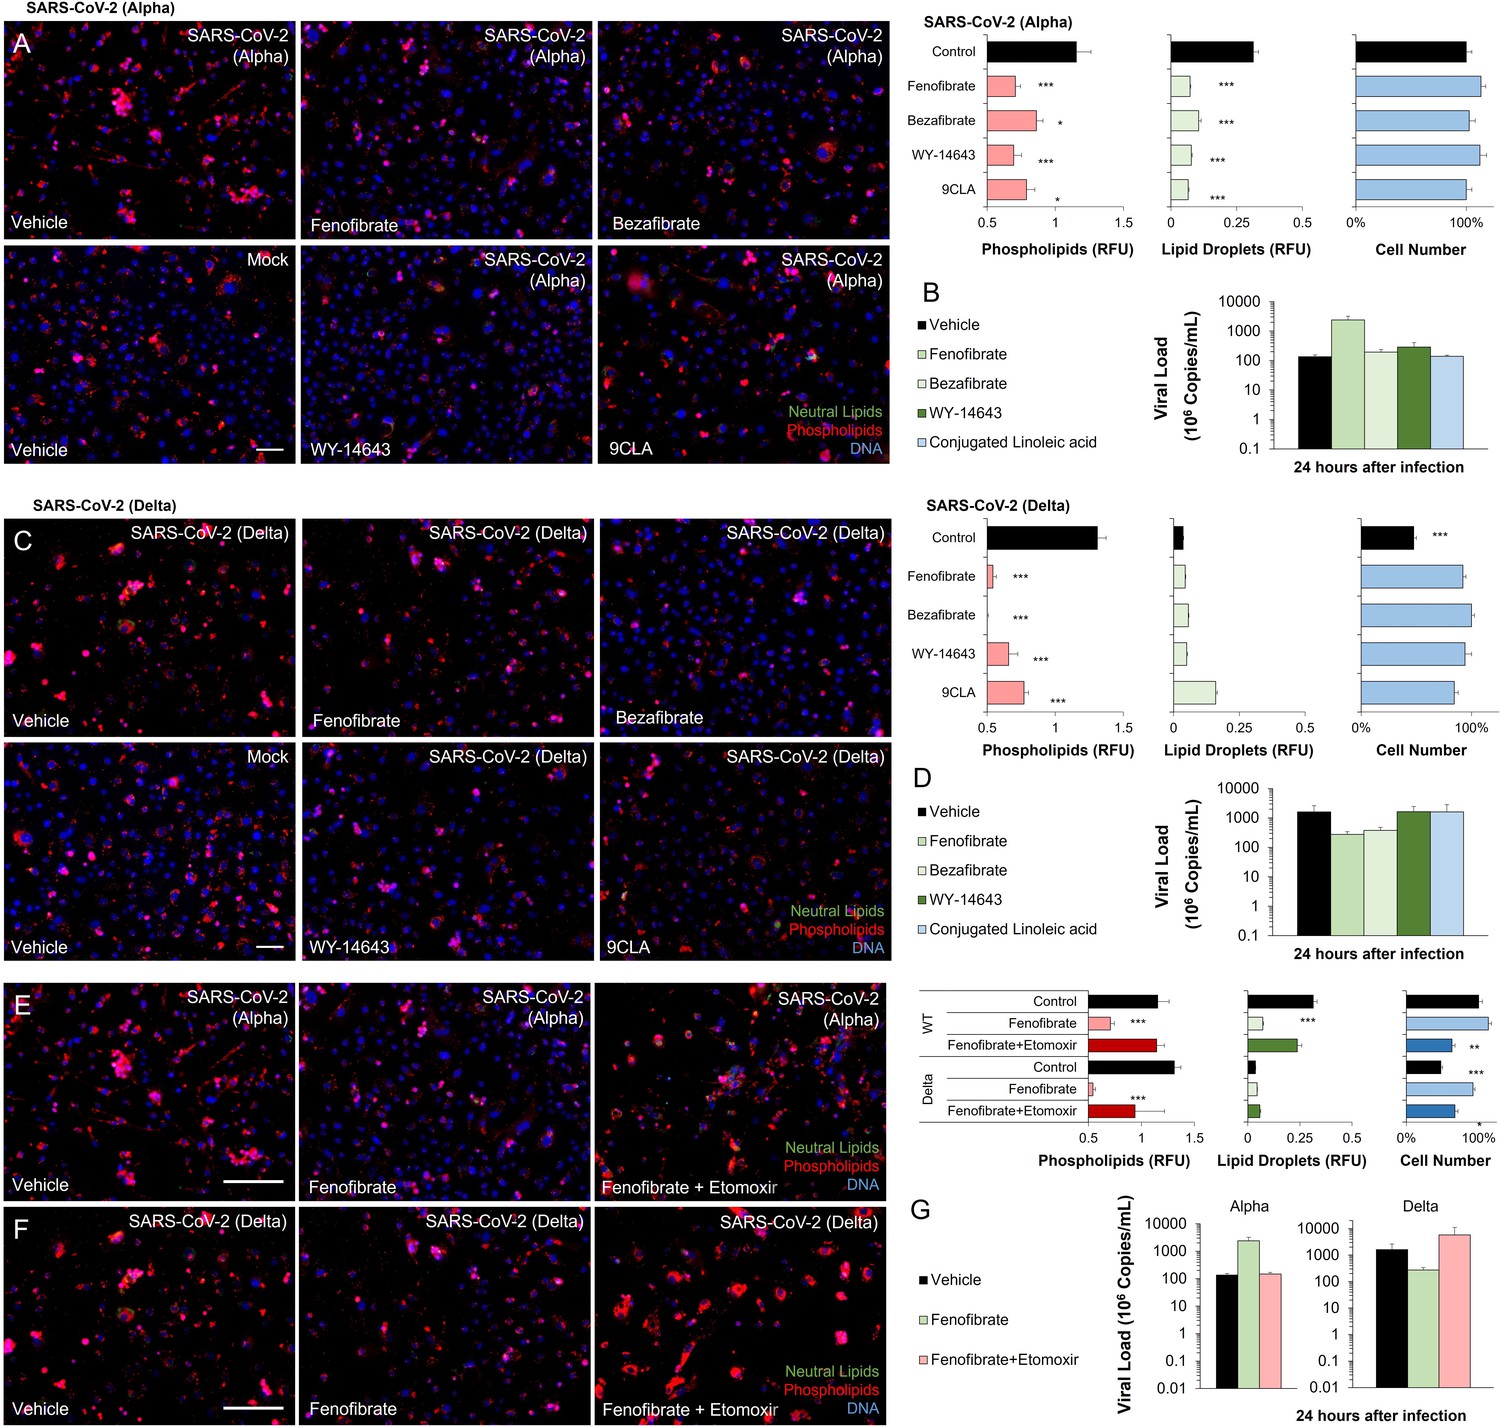
PPARα agonism anti-viral mechanism is ligand-wide and fatty oxidation dependent in SARS-CoV-2 infection in vitro.
(A) Microscopic analysis of lipid accumulation and cell number in alpha variant (hCoV-19/Israel/CVL-45526-NGS/2020) infected bronchial epithelial cells at TCID100 after treatment with different PPARα agonists (n=6, p<0.05). (B) Quantification of alpha variant SARS-CoV-2 viral RNA before treatment with a physiological concentration of various PPARα agonists or DMSO (vehicle; n=6). (C) Microscopic analysis of lipid accumulation and cell number in delta variant (hCoV-19/Israel/CVL-12806/2021) infected bronchial epithelial cells at TCID50 after treatment with different PPARα agonists (n=6, p<0.001). (D) Quantification of delta variant SARS-CoV-2 viral RNA before treatment with a physiological concentration of various PPARα agonists or DMSO (vehicle; n=6). (E–F) Microscopic analysis of lipid accumulation and cell number in (E) alpha variant (hCoV-19/Israel/CVL-45526-NGS/2020) infected bronchial epithelial cells at TCID50 after 5 days of treatment with 20 µM fenofibrate or 20 µM fenofibrate and 4 µM CPT1α inhibitor etomoxir (n=6, p<0.01). (F) delta variant (hCoV-19/Israel/CVL-12806/2021) infected bronchial epithelial cells at TCID50 after treatment with 20 µM fenofibrate or 20 µM fenofibrate and 4 µM CPT1α inhibitor etomoxir. (G) Quantification of alpha and delta variant SARS-CoV-2 viral RNA before treatment with 20 µM fenofibrate or 20 µM fenofibrate and 4 µM CPT1α inhibitor etomoxir (n=6). * p<0.05, ** p<0.01, *** p<0.001. Bar = 50 µm. Error bars indicate S.E.M.
Figure 3—figure supplement 3
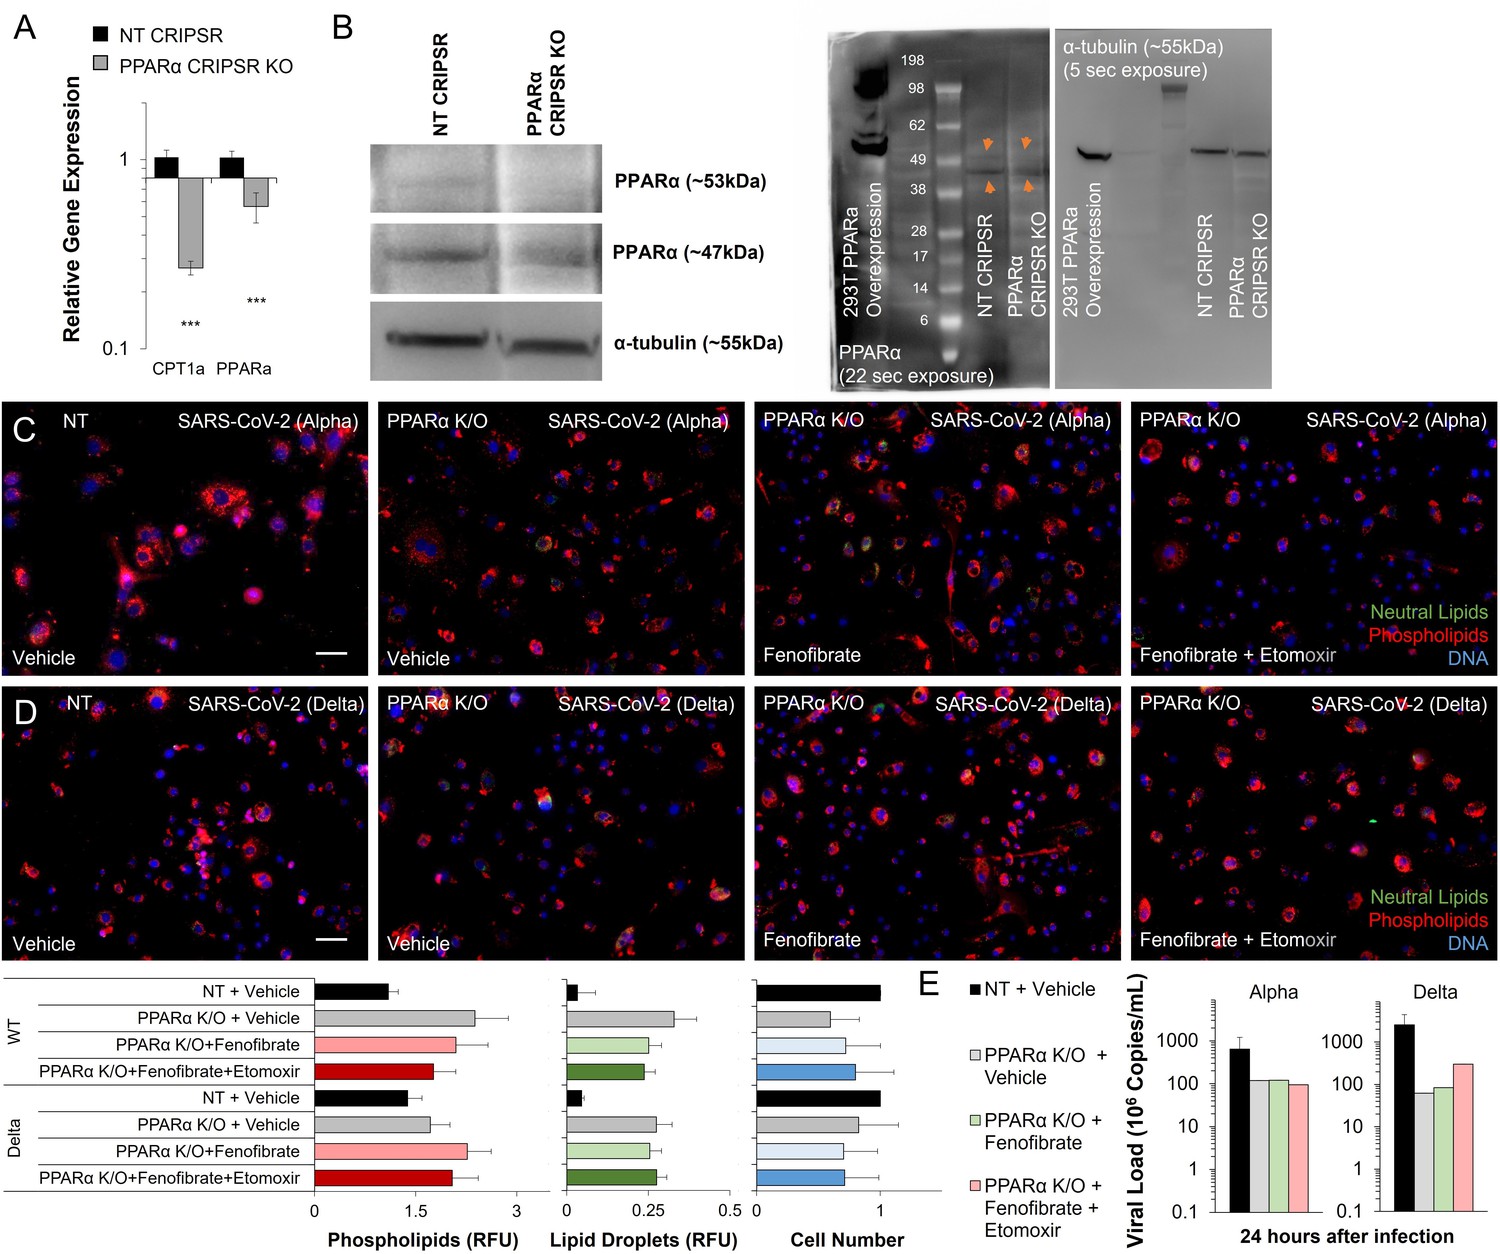
PPARα is required for fenofibrate rescue and etomoxir reversal in SARS-CoV-2 infection in vitro.
(A) Gene expression of PPARα and CPT1α by qRT-PCR in bronchial epithelial cells or PPARα CRISPR-KO bronchial epithelial cells. Analysis shows a significant decrease in PPARα expression and its target gene CPT1α (n=6, p<0.001). (B) Western blot analysis of PPARα protein in bronchial epithelial cells or PPARα CRISPR-KO bronchial epithelial cells. Microscopic analysis of lipid accumulation and viability in (C) alpha variant (hCoV-19/Israel/CVL-45526-NGS/2020) infected PPARα K/O bronchial epithelial cells at TCID50 after 5 days of treatment with 20 µM fenofibrate or 20 µM fenofibrate and 4 µM CPT1α inhibitor etomoxir. (D) Delta (hCoV-19/Israel/CVL-12806/2021) infected PPARα K/O bronchial epithelial cells at TCID50 after 5 days of treatment with 20 µM fenofibrate or 20 µM fenofibrate and 4 µM CPT1α inhibitor etomoxir (n=6). (E) Quantification of alpha and delta variant SARS-CoV-2 viral RNA in infected PPARα K/O bronchial before treatment with 20 µM fenofibrate or 20 µM fenofibrate and 4 µM CPT1α inhibitor etomoxir (n=6). * p<0.05, ** p<0.01, *** p<0.001. Bar = 50 µm. Error bars indicate S.E.M.
-
Figure 3—figure supplement 3—source data 1
Complete raw and unedited blots assembly used to determine PPARα expression.
(1) original and (2) inverted files of the full raw unedited alpha tubulin blot. (3) original and (4) inverted files of the full raw unedited PPAR alpha blot. (5) The uncropped blots with the relevant bands are clearly labeled.
- https://cdn.elifesciences.org/articles/79946/elife-79946-fig3-figsupp3-data1-v2.zip
Figure 4 with 2 supplements

Observational study shows differential immunoinflammatory response to metabolic intervention.
(A) Comparative representation of Israeli patients above the age of 30 taking different metabolic regulators. 532,493 unique general hospital medical records were compared with 2806 confirmed COVID-19 patients. COVID-19 patients treated with metabolic regulators were older and had a higher prevalence of chronic medical conditions and risk factors than other COVID-19 patients (Supplementary file 2). Patients taking thiazolidinediones (n=37; p<0.001), metformin (n=321; p<0.01), SGLT2 inhibitors (n=54; p<0.001), statins (n=924; p<0.001), or telmisartan (IRE1α inhibitor; n=278; p<0.001) were over-represented across all severity indicators (Supplementary file 2). Patients taking fibrates (n=21) were significantly underrepresented in hospital admissions (p=0.02) and were not over-represented in other severity indicators. * p<0.05, ** p<0.01, *** p<0.001 in a Wald test compared to the proportion of these drug users in medical records. Error bars indicate S.E.M. (B) Box and whisker plot of length of hospitalization in treatment and non-treatment groups (Control). Israeli patients taking bezafibrate or ciprofibrate (fibrates) were associated with significantly lower hospitalization duration (p=0.03). The numbers in parentheses indicate the number of patients. (C–D) Dynamic changes in the inflammation marker CRP and neutrophil-to-lymphocyte ratio (NLR) marking immunoinflammatory stress in treatment and non-treatment groups (Control) during 21-day hospitalization. The centerline shows the mean value while the 95% confidence interval is represented by the shaded region. (C) CRP levels gradually declined in the control group reaching a plateau by day 14 post-hospitalization. The fibrates group showed a significantly faster decline in inflammation, while the thiazolidinedione group showed marked elevation in CRP level above control. (D) NLR rose in the control group above normal values (dotted red line) stabilizing after 7–14 days and then declining as recovery begins. The fibrates group showed only mild stress, and maintain normal levels of NLR throughout hospitalization. Patients taking statins or IRE inhibitors showed elevated NLR post-day 10 of hospitalization. (E) Kaplan–Meier survival curves of 28 day in-hospital mortality for treatment and non-treatment groups (Control). The small group of patients taking fibrates did not report any deaths, while thiazolidinedione and SGLT2 inhibitor users had a significantly higher risk of mortality (HR: 3.6, 2.5; p=0.04, 0.03 respectively, Supplementary file 2). * p<0.05, ** p<0.01, *** p<0.001. In boxplots, x is the mean; center line is the median; box limits are 25th and 75th percentiles; whiskers extend to 1.5×the interquartile range (IQR) from the 25th and 75th percentiles; dots are outliers. # indicates that the hazard ratios were calculated using Firth’s correction for monotone likelihood with profile likelihood confidence limits.
Figure 4—figure supplement 1
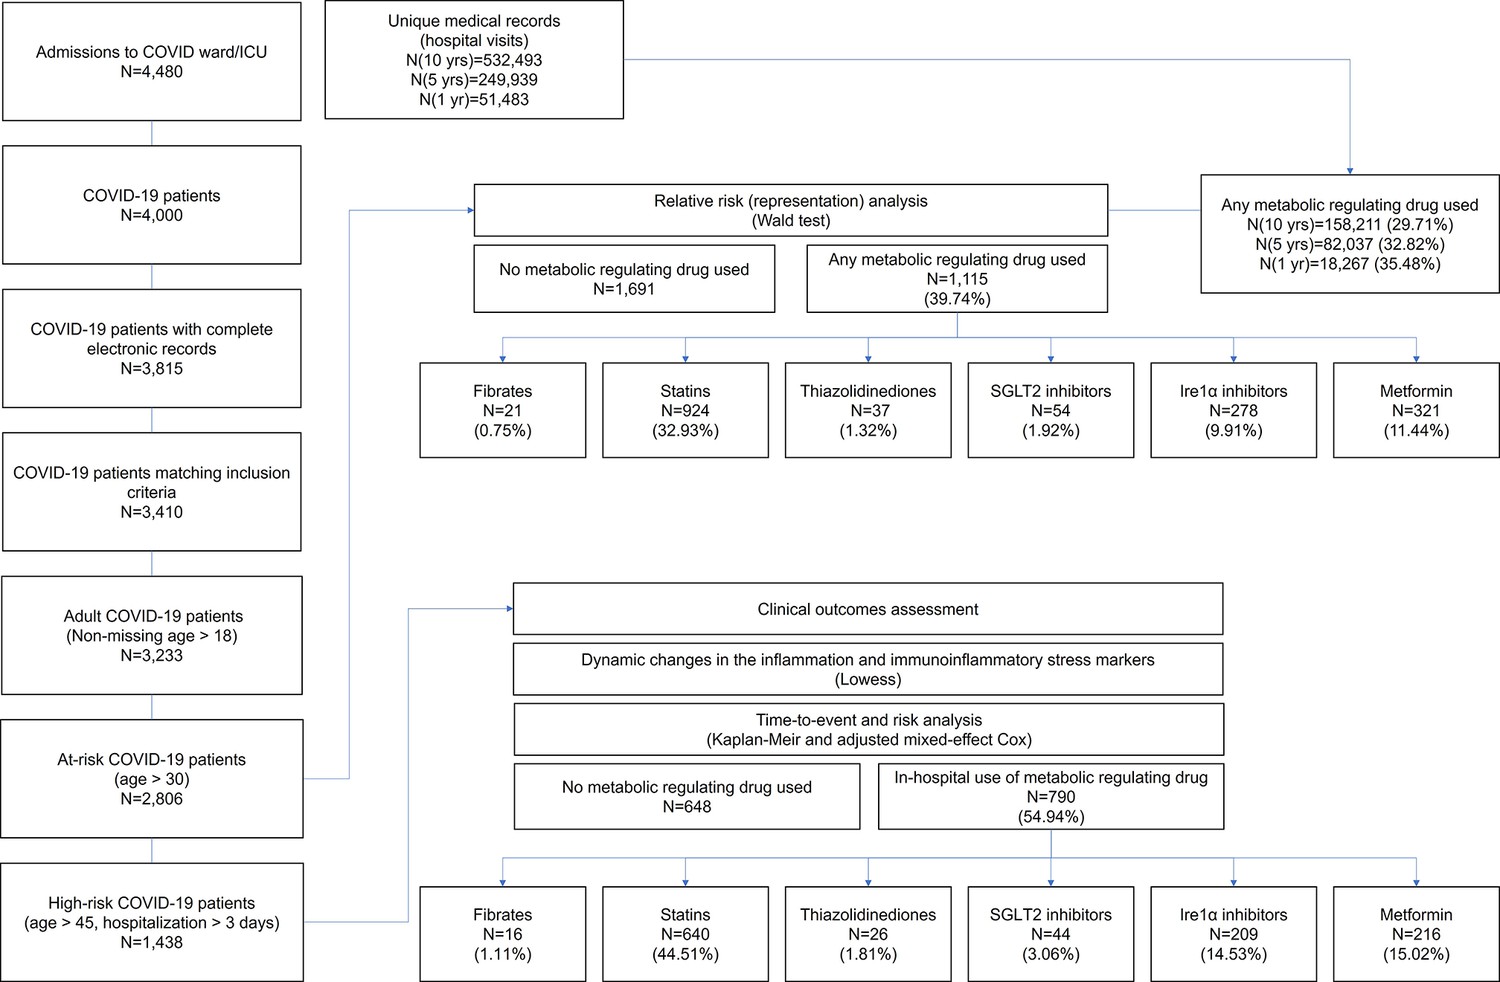
Observational study flow diagram.
Figure 4—figure supplement 2
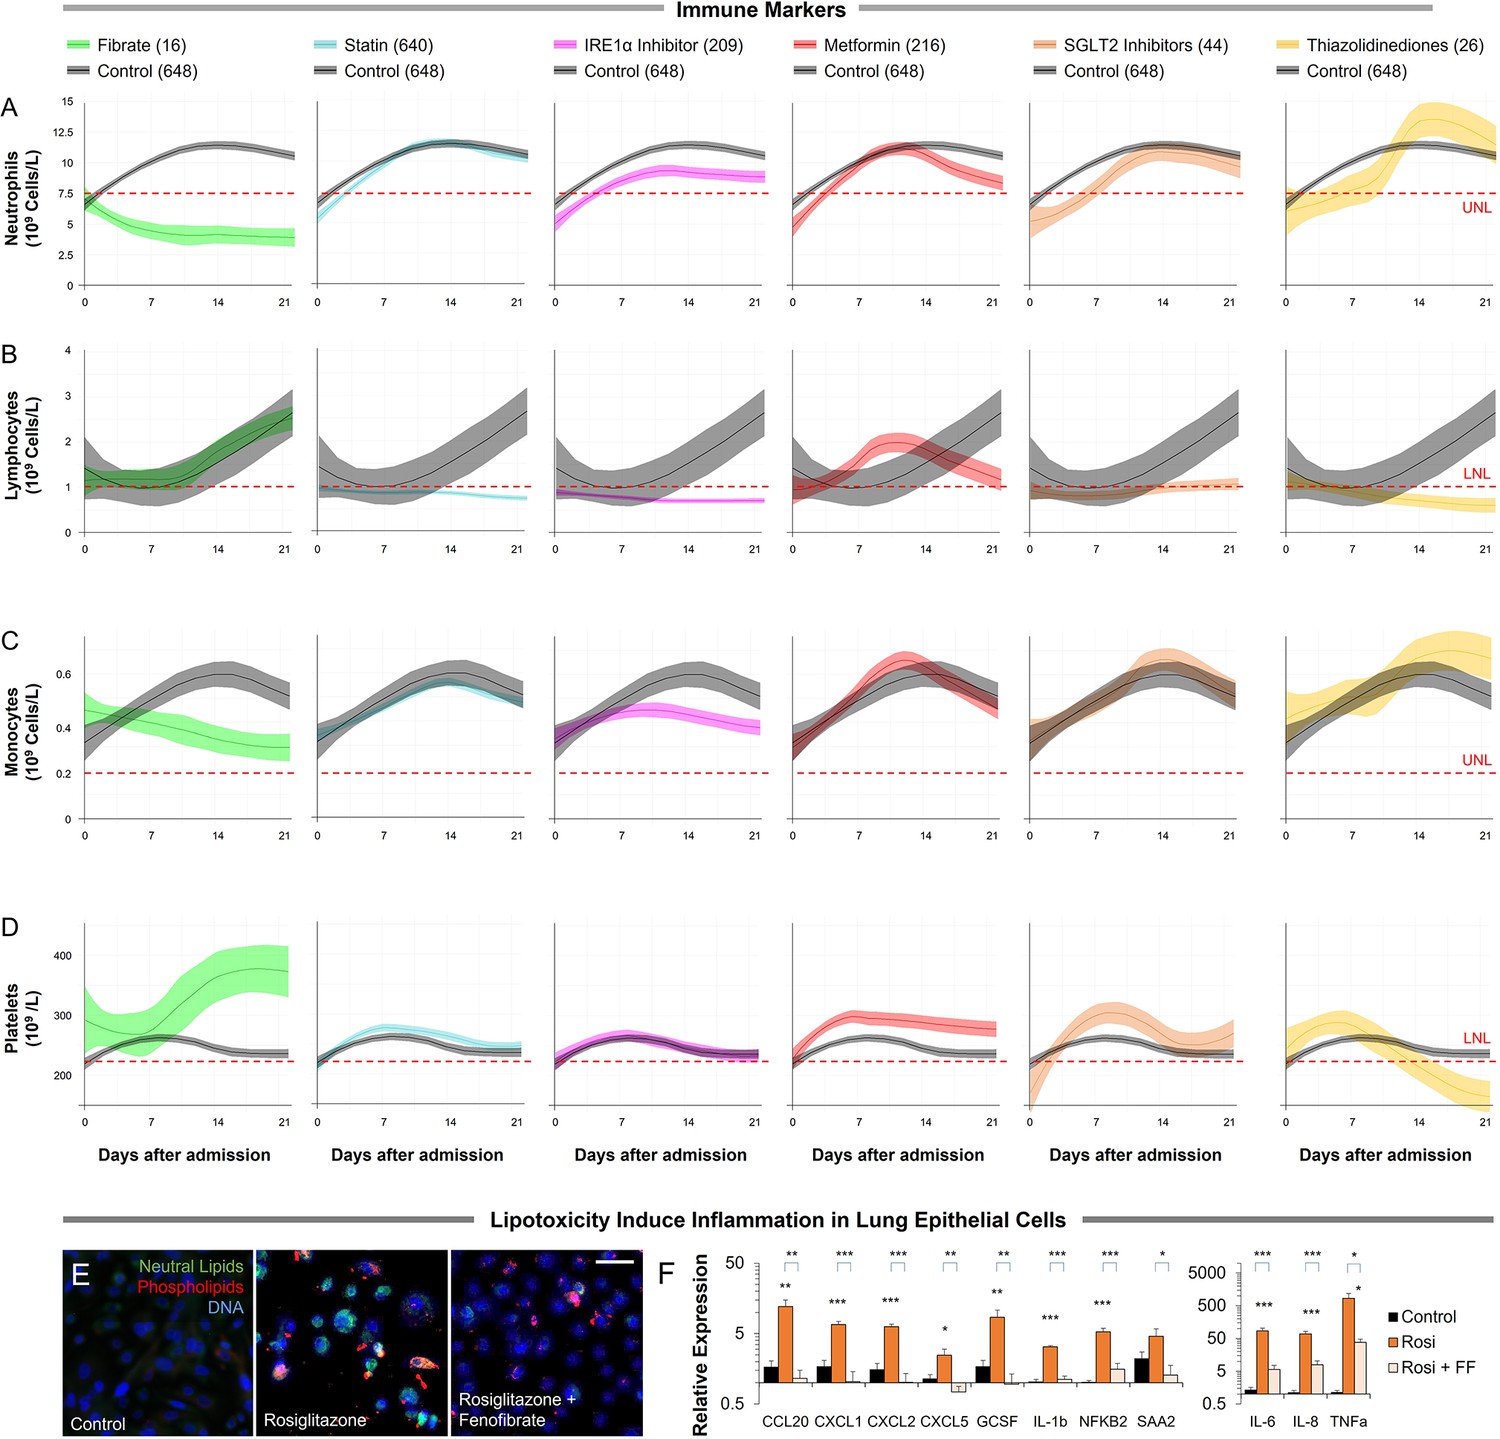
The host-immune response in hospitalized COVID-19 patients in different metabolic interventions.
(A–D) Dynamic changes in (A) neutrophils, (B) lymphocytes, (C) monocytes, and (D) platelet levels during 21 day hospitalization in treatment and non-treatment groups (Control). The centerline shows the mean value while the 95% confidence interval is represented by the shaded region. (E) Microscopic analysis of lipid accumulation in lung cells induced by 10 µM of PPARγ agonist rosiglitazone and 100 µM oleic acid with or without 20 µM fenofibrate for 5 days. Lipogenic induction resulted in a 65% increase in triglycerides (n=6, p<0.05) and a 75% increase in phospholipids (n=6, p<0.001). Lipid increase in lung cells is reversed upon treatment with fenofibrate. (F) Analysis of CCL20, CXCL1, CXCL2, CXCL5, GCSF, IL-1b, IL-6, IL-8, NFKB, SAA2, and TNFα by qRT-PCR as markers of immunoinflammatory stress. Lipogenic induction results in significant upregulation of chemokines, cytokines, and inflammation markers, which is reversed by fenofibrate (n=6, p<0.05). * p<0.05, ** p<0.01, *** p<0.001 in a two-sided heteroscedastic student’s t-test against control. Bar = 30 µm. Error bars indicate S.E.M.
Figure 5 with 2 supplements
Inflammation and speed recovery in severe COVID-19 patients treated with standard-of-care plus nanocrystallized fenofibrate.
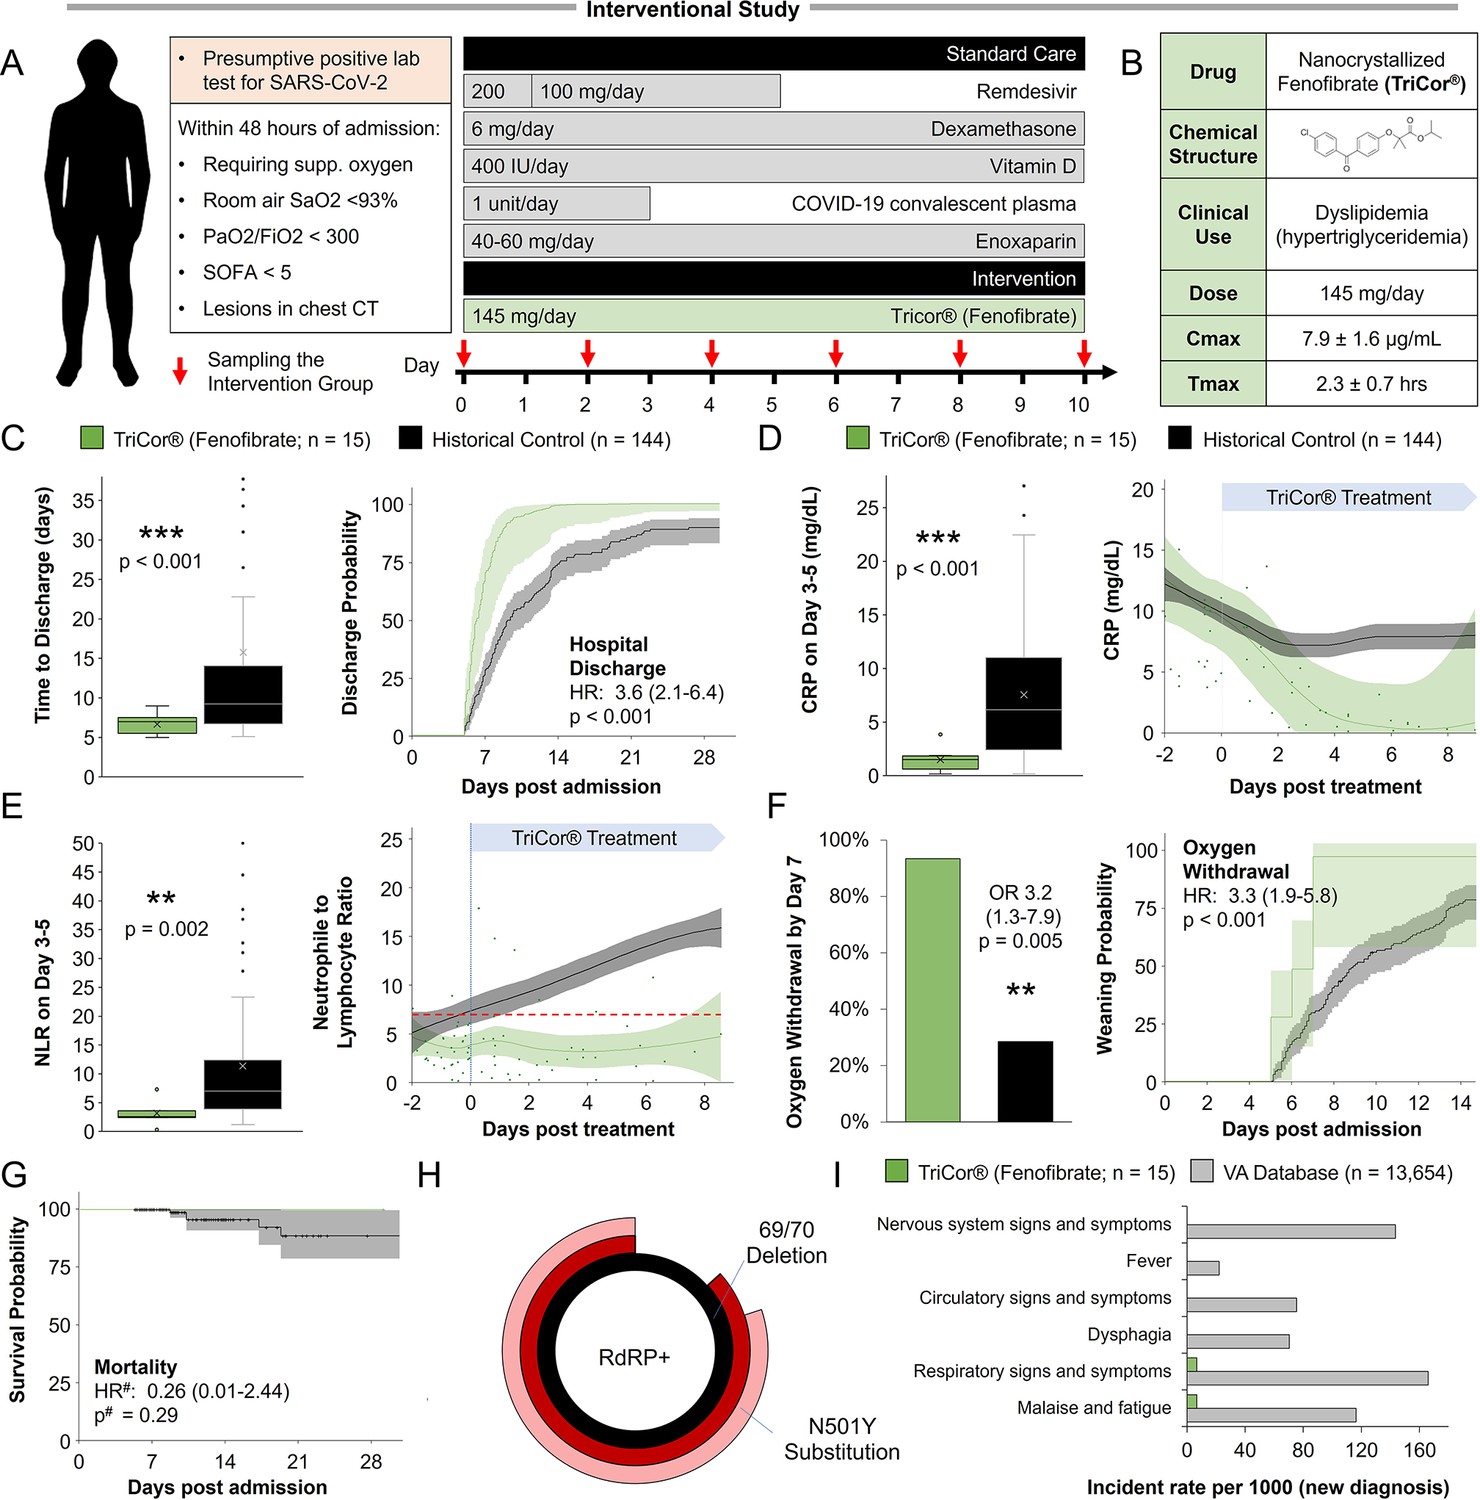
(A) Schematic depicting interventional study design in 15 severe hospitalized COVID-19 patients receiving remdesivir, dexamethasone, and enoxaparin. Patients received 145 mg/day of nanocrystallized fenofibrate for 10 days with blood samples taken every 48–72 hr until discharge (methods). (B) Chemical, clinical, and pharmacokinetic characteristics of nanocrystallized fenofibrate. Lower Tmax compared to other fibrates enables rapid intervention in deteriorating COVID-19 patients. (C) Box and whisker plot of hospitalization duration (left) and Cox accumulative estimated hospital time to discharge by day 28 analysis, plotted as 1 minus the Cox estimator (right). Patients treated with nanocrystallized fenofibrate had a significantly lower hospitalization duration (n=15, p<0.001), and a higher likelihood of discharge (HR: 3.6, 95% CI 2.1–6.4, n=15, p<0.001). (D–E) Dynamic changes (right) and box and whisker plots (left) of immunoinflammatory indicators C-reactive protein (CRP) and neutrophil-to-lymphocyte ratio (NLR) in treatment and non-treatment groups (Control) over hospitalization duration (methods). The centerline shows the mean value while the 95% confidence interval is shaded. (D) High CRP levels gradually declined in the control group reaching a plateau by day 7. Nanocrystallized fenofibrate-treated patients showed a faster decline in inflammation, resulting in significantly lower CRP levels 3–5 days post-treatment (n=15, p<0.001). (E) NLR in the control group increased during hospitalization indicating severe immunoinflammatory stress. Patients treated with nanocrystallized fenofibrate showed no increase in NLR, suggesting minimal immune response, resulting in a significantly lower NLR 3–5 days post-treatment (n=15; p=0.002). (F) Withdrawal from oxygen support plotted as cumulative incidence at day 7 (left; OR: 3.2, 95% CI 1.3–7.9, n=15, p=0.005) Kaplan-Meier estimated time to discharge by day 28, plotted as 1 minus the survival estimator (right; HR: 2.9, 95% CI 1.7–5.0, n=15, p<0.001). (G) Kaplan–Meier survival curves of 28 days mortality in treatment and non-treatment groups (Control) and Cox regression modeling presenting hazard ratio estimate, 95% CI, and p-value. (H) Novaplex SARS-CoV-2 qPCR variant analysis (methods), showing a dominant presence of 69/70 deletion and N501Y substitution mutation correlating to the B.1.1.7 (UK) variant of the virus in the patient population. (I) Assessment of significant post-acute incident diagnoses in people who had been hospitalized with COVID-19 (long COVID) in patients taken from Al-Aly and colleagues (Al-Aly et al., 2021) compared to those treated with 145 mg fenofibrate in this study at 6 months after hospital discharge. Incident rate (IR) per 1000 at 6 months in hospitalized COVID-19 was ascertained from day 30 after hospital admission until 6 months or end of follow-up. For each outcome, cohort participants without a history of the outcome in the past year were included in the analysis. Hazard ratios (HR) and the related p-values were calculated by a Cox regression model. Odds ratios (ORs) and the related p-values were calculated using Fisher’s exact test (methods). * p<0.05, ** p<.0.01, *** p<0.001. In boxplots, x is the mean; center line is the median; box limits are the 25th and 75th percentiles; whiskers extend to 1.5×the interquartile range (IQR) from the 25th and 75th percentiles; dots are outliers. # indicates that the hazard ratios were calculated using Firth’s correction for monotone likelihood with profile likelihood confidence limits.
Figure 5—figure supplement 1
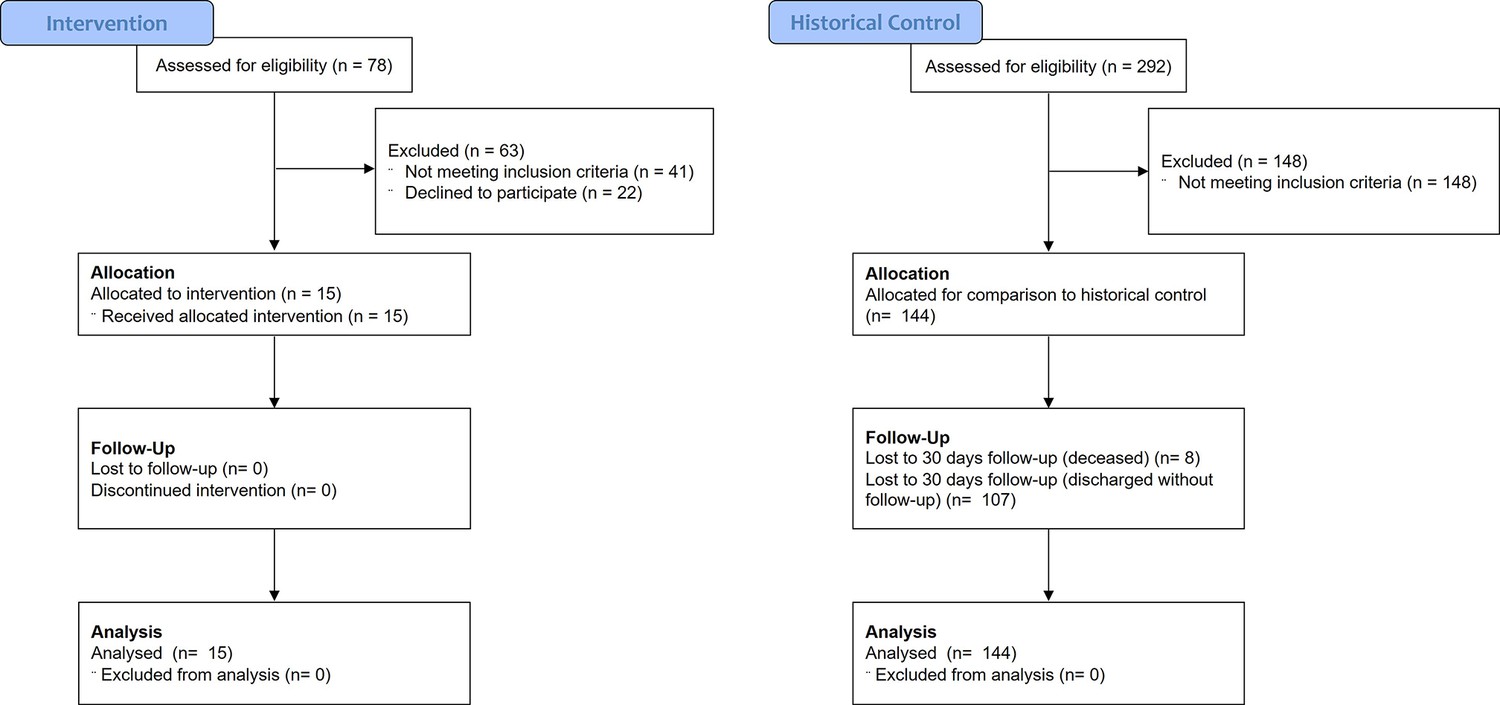
Interventional study CONSORT flow diagram.
Figure 5—figure supplement 2
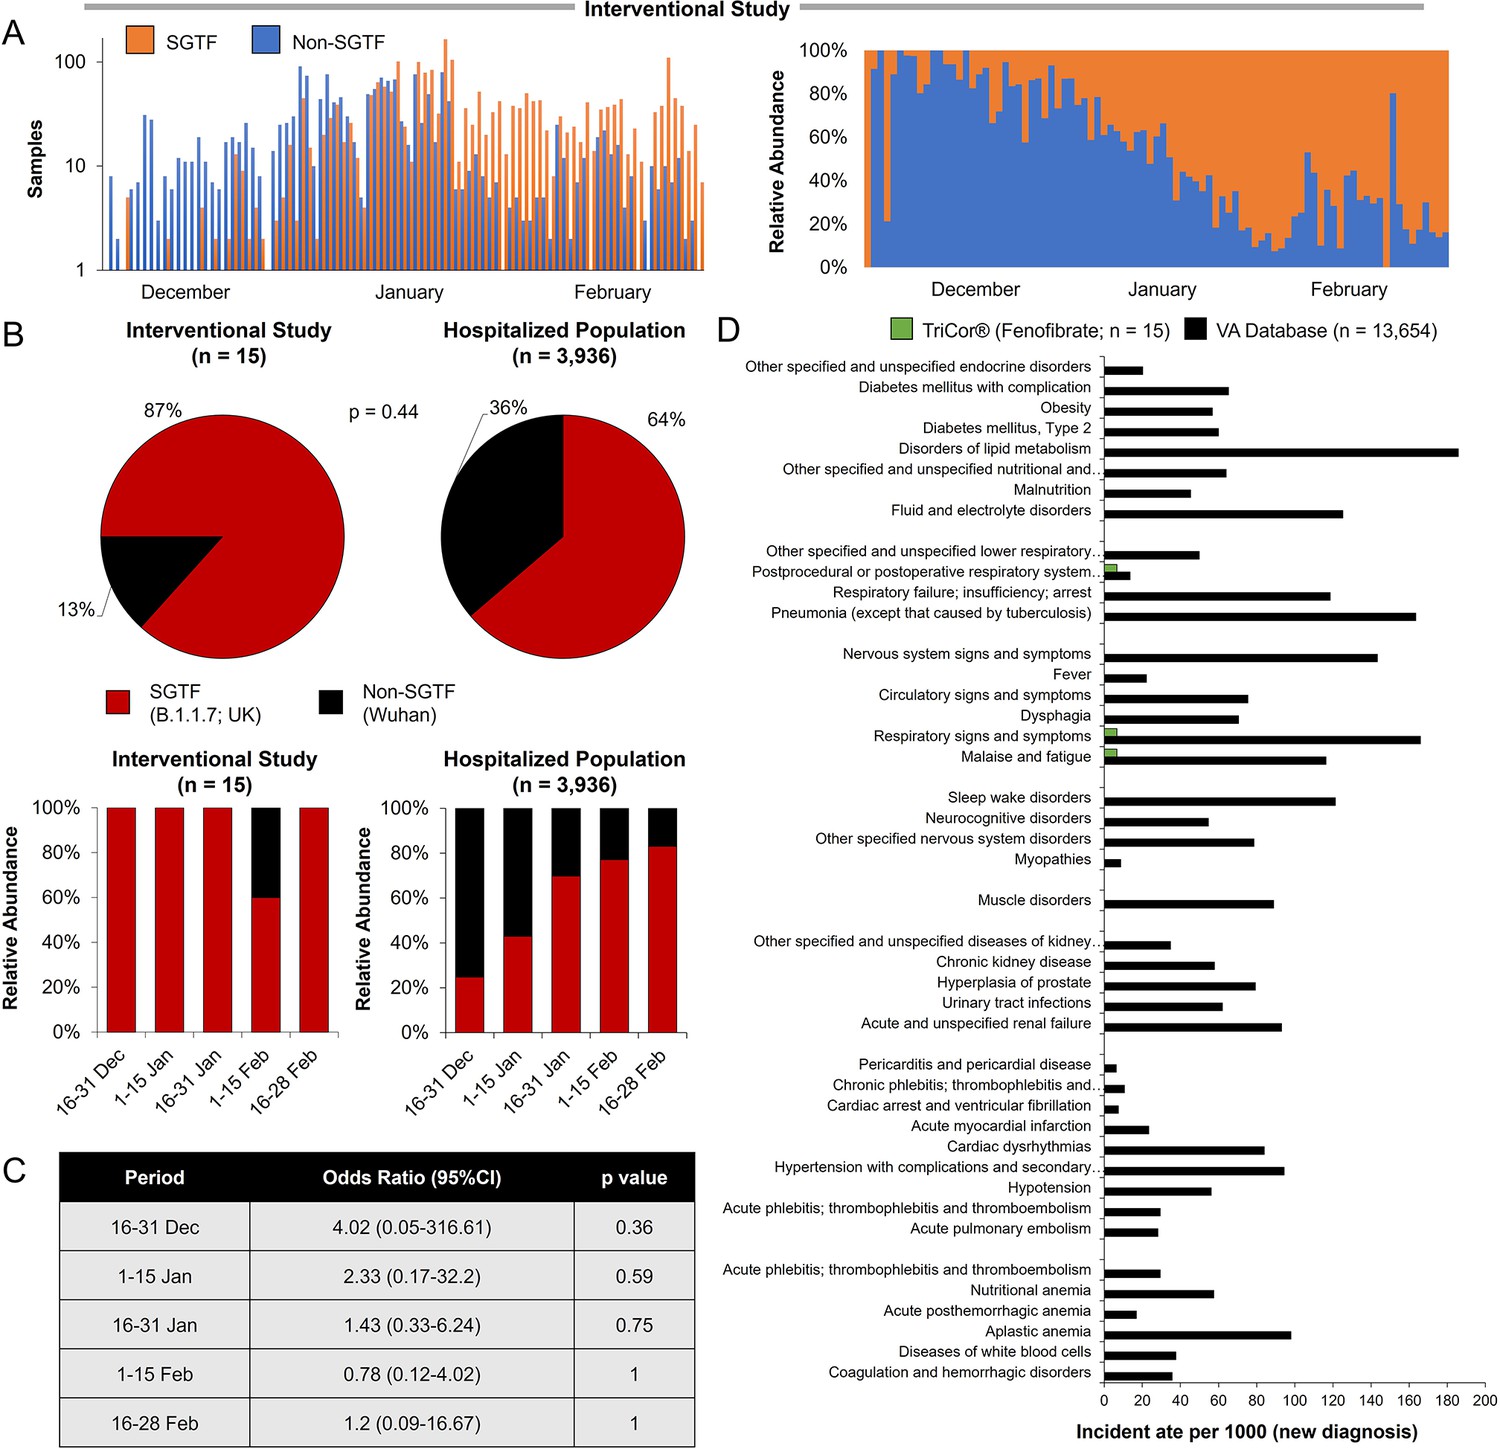
Analysis of variant emergence dynamics and distribution during the study period in participants and other hospitalized patients.
(A) Sample distribution (left) and relative abundance (left), with and without SGTF by day from 30 November 2020 to 28 February 2021. (B) Stratified relative abundance of samples with and without SGTF of patients in the interventional study (left) and other hospitalized patients (right) from 16 December 2020 to 28 February 2021. (C) Pie chart representation of variant distribution between the patient in the interventional study and other patients in other clinical centers in Israel during the same period (OR: 1.36, 0.59–3.1; p=0.44). SGTF, S-gene target failure, serves as a proxy for identifying B.1.1.7 cases (Brown et al., 2021; Davies et al., 2021a). (D) Distribution comparison of sample distribution with and without SGTF in stratified periods. Odds ratios (ORs) and the related p-values were calculated using Fisher’s exact test (methods). SGTF, S-gene target failure, serves as a proxy for identifying B.1.1.7 cases (Brown et al., 2021; Davies et al., 2021a). (E) Assessment of significant post-acute incident diagnoses in people who had been hospitalized with COVID-19 (long COVID) in patients registered in the VA database (Al-Aly et al., 2021) vs. those treated with 145 mg fenofibrate in this study at 6 months after hospital discharge. Incident rates per 1000 at 6 months in hospitalized COVID-19 were ascertained from day 30 after hospital admission until 6 months or end of follow-up. A p-value less than 0.001 was considered statistically significant and included in the analysis. For each outcome, cohort participants without a history of the outcome in the past year were included in the analysis.
Additional files
-
Supplementary file 1
Differentially expressed genes (DEG) analysis in SARS-CoV-2 infected human lung epithelium.
(Tab 2) Normal bronchial epithelial cells (Tab 3) Lung Biopsies (Tab 4) Small airway (Tab 5-6) Epithelial cells in bronchial alveolar lavage fluid. (Tab 7) Primer list used for qPCR gene expression validations.
- https://cdn.elifesciences.org/articles/79946/elife-79946-supp1-v2.xlsx
-
Supplementary file 2
Observational study descriptive statistics.
(Tab 1-8) Characteristics of COVID-19 patients in the cohort. SBP, systolic blood pressure; DBP, diastolic blood pressure; COPD, chronic obstructive pulmonary disease; SpO2, oxygen saturation; ECMO, extracorporeal membrane oxygenation; IQR, interquartile range. Continuous variables were compared with a two-sample t-test and categorical variables with Fisher’s exact test. (Tab 9-11) Observational comparison between unique patients' visits to Hadassah Medical Center taking metabolic regulators and unique patients in various hospitalization conditions in patients with COVID-19 taking metabolic regulators in different periods. Patients taking thiazolidinediones (n=37; P<0.001), metformin (n=321; P<0.01), SGLT2 inhibitors (n=54; P<0.001), statins (n=924; P<0.001), or telmisartan (IRE1α inhibitor; n=278; P<0.001) were over-represented across all severity indicators, while patients taking fibrates (n=21) were significantly underrepresented in hospital admissions (P=0.02) and were not over-represented in other severity indicators regardless of the period examined. Observational comparison between unique patients visiting Hadassah Medical Center during (Tab 9) 11/2018–2019, (Tab 10) 11/2015–2020, or (Tab 11) 11/2010–2020 taking metabolic regulators and unique patients in various hospitalization conditions in patients with COVID-19 taking metabolic regulators. (Tab 12-20) Characteristics of patients included in the study. Patients included in the study were between the age of 45–100, that were hospitalized for more than 3 days (N=1,438). SBP, systolic blood pressure; DBP, diastolic blood pressure; COPD, chronic obstructive pulmonary disease; SpO2, oxygen saturation; ECMO, extracorporeal membrane oxygenation; IQR, interquartile range Continuous variables were compared with a two-sample t-test and categorical variables with Fisher’s exact test. (Tab 21) Cox regression model of 28days mortality in the treatment groups versus control. Adjusted HR and p-values were calculated based using a Cox regression model adjusting for age, gender, and pre-existing comorbidities (smoking, asthma, COPD, DM, hypertension, diabetes, coronary heart disease, obesity, dyslipidemia, cerebrovascular disease, chronic liver disease, and chronic kidney disease). There were no deaths recorded in fibrate patients, resulting in monotone likelihood (non-convergence of likelihood function, Firth’s penalized maximum likelihood bias reduction method was implemented to calculate hazard ratios and confidence intervals). Thiazolidinediones and SGLT2 inhibitors users show a significantly higher risk of death within 28 days of hospitalization (adjusted risk). # indicates that the hazard ratios were calculated using Firth’s correction for monotone likelihood with profile likelihood confidence limits.
- https://cdn.elifesciences.org/articles/79946/elife-79946-supp2-v2.xlsx
-
Supplementary file 3
International comparative validation cohorts descriptive statistics.
(Tab 1) Comparative Cohort of the Outpatient Lipid Clinics of the University of Bologna and of the Niguarda Hospital in Milan. (A) Characteristics of included patients stratified by lipid-lowering treatment. A cohort of 2,123 patients (M: 48.1%, F: 51.9%) on statins (1,791, mean age 59.2±15.2 years), fenofibrate (220, mean age 60.7±15.4 years) or both (112, mean age 62.9±16.3 years) were interviewed. Patients on statins were significantly younger than those on both drugs (P=0.023). 177 patients received a diagnosis of COVID by molecular swab: 9.2% of statin-treated subjects, 3.2% of fenofibrate-treated ones, and 5.4% of those treated with both statins and fenofibrate (P=0.005) without differences in the source of exposition (family members, co-workers; P=0.648). (B) Disease severity stratified by lipid-lowering treatment. 134 reported mild COVID-19 symptoms and 31 patients reported severe COVID-19 symptoms, requiring hospitalization: 1.7% of statin-treated subjects, 0.5% of fenofibrate-treated ones, and 0% of those treated with both statins and fenofibrate (P=0.022) without differences in the source of exposure. (C) Characteristics of included patients according to the personal history of COVID. Patients affected by COVID were more frequently obese, with COPD and/or cardiovascular diseases, and had strict contact with COVID-affected subjects, independent of the lipid-lowering treatment. (D) Characteristics of patients exposed to contact with affected people (n=254). Out of 254 patients reporting contact with affected people, 45 became positive for COVID. 93.3% were in treatment with statins 4.4% with fenofibrate and 4.5% with both (P=0.059). Affected to exposed to positive contacts ratio according to background lipid-lowering was 20.5% in patients treated with statins 7.4% with fenofibrate and 4.5% with both (P=0.059). (Tab 2) Comparative cohort in the American veteran’s health administration (VHA) registry. (A) Characteristics of fenofibrate users compared with non-users before and after PSM. (B) The median duration of hospitalization among fenofibrate users vs. non-users. (C) SARS-CoV-2 infection and COVID-19 severity among fenofibrate users vs. non-users.
- https://cdn.elifesciences.org/articles/79946/elife-79946-supp3-v2.xlsx
-
Supplementary file 4
Interventional study descriptive statistics.
(Tab 1) Characteristics of patients compared in the patients in the interventional study 15 Participants who met the inclusion criteria were assigned to intervention with nanocrystallized fenofibrate (TriCor, AbbVie Inc, North Chicago, IL USA) at a dose of 145 mg (1 tablet) once per day. Standard care for severe-hospitalize COVID-19 patients was provided according to local practice: antiviral treatment, vitamin D3, low-dose glucocorticoids, convalescent plasma, and supportive care as well as antipyretic for symptoms of fever (products containing paracetamol, or non-steroidal anti-inflammatories such as aspirin and ibuprofen) and dextromethorphan for symptoms of cough. Standard chronic treatments were continued unless COVID-19, clinical status, or fenofibrate treatment was a counterindication for the treatment. Control patients were collected from the observational study’s database and filtered to patients that meet the inclusion criteria, were admitted with low immunoinflammatory stress (NLR <10 at admission), and were treated according to the standard care used in the interventional study. SBP, systolic blood pressure; DBP, diastolic blood pressure; COPD, chronic obstructive pulmonary disease; SpO2, oxygen saturation; ECMO, extracorporeal membrane oxygenation; IQR, interquartile range. Continuous variables were expressed as median [IQR] and were compared with a Mann-Whitney U test. Categorical variables were expressed as a count and percentage (%) and compared with a chi-squared test or Fisher’s exact test. The sample size is detailed in each display item. (Tab 2) Cox regression model of 28-days mortality in the treatment group versus control. Adjusted HR and p-values were calculated based using an unadjusted Cox regression model, a Cox regression model adjusting for age, gender, and pre-existing comorbidities (smoking, asthma, COPD, DM, hypertension, diabetes, coronary heart disease, obesity, dyslipidemia, cerebrovascular disease, chronic liver disease, and chronic kidney disease) or a Cox regression model adjusting for significantly different patient characteristics, obesity, chronic kidney disease, and SpO2. (A) Cox regression model of 28 days hospital discharge. (B) Cox regression model of 28 days oxygen withdrawal. (C) Cox regression model of 28 days mortality. There were no deaths recorded in the treatment patients, resulting in monotone likelihood (non-convergence of likelihood function, Firth’s penalized maximum likelihood bias reduction method was implemented to calculate hazard ratios and confidence intervals).
- https://cdn.elifesciences.org/articles/79946/elife-79946-supp4-v2.xlsx
-
MDAR checklist
- https://cdn.elifesciences.org/articles/79946/elife-79946-mdarchecklist1-v2.pdf
-
Reporting standard 1
Strengthening the reporting of observational studies in epidemiology (STROBE) reporting standards used in the observetional studies.
- https://cdn.elifesciences.org/articles/79946/elife-79946-repstand1-v2.pdf
-
Reporting standard 2
Consolidated Standards of Reporting Trials (CONSORT) reporting standards used in the interventional studies.
- https://cdn.elifesciences.org/articles/79946/elife-79946-repstand2-v2.pdf
Download links
A two-part list of links to download the article, or parts of the article, in various formats.
Downloads (link to download the article as PDF)
Open citations (links to open the citations from this article in various online reference manager services)
Cite this article (links to download the citations from this article in formats compatible with various reference manager tools)
Efficacy and safety of metabolic interventions for the treatment of severe COVID-19: in vitro, observational, and non-randomized open-label interventional study
eLife 12:e79946.
https://doi.org/10.7554/eLife.79946


