Feedback between a retinoid-related nuclear receptor and the let-7 microRNAs controls the pace and number of molting cycles in C. elegans
- Department of Biological Chemistry, David Geffen School of Medicine, University of California, Los Angeles, United States
- Department of Biology, Johns Hopkins University, United States
Figures
Figure 1
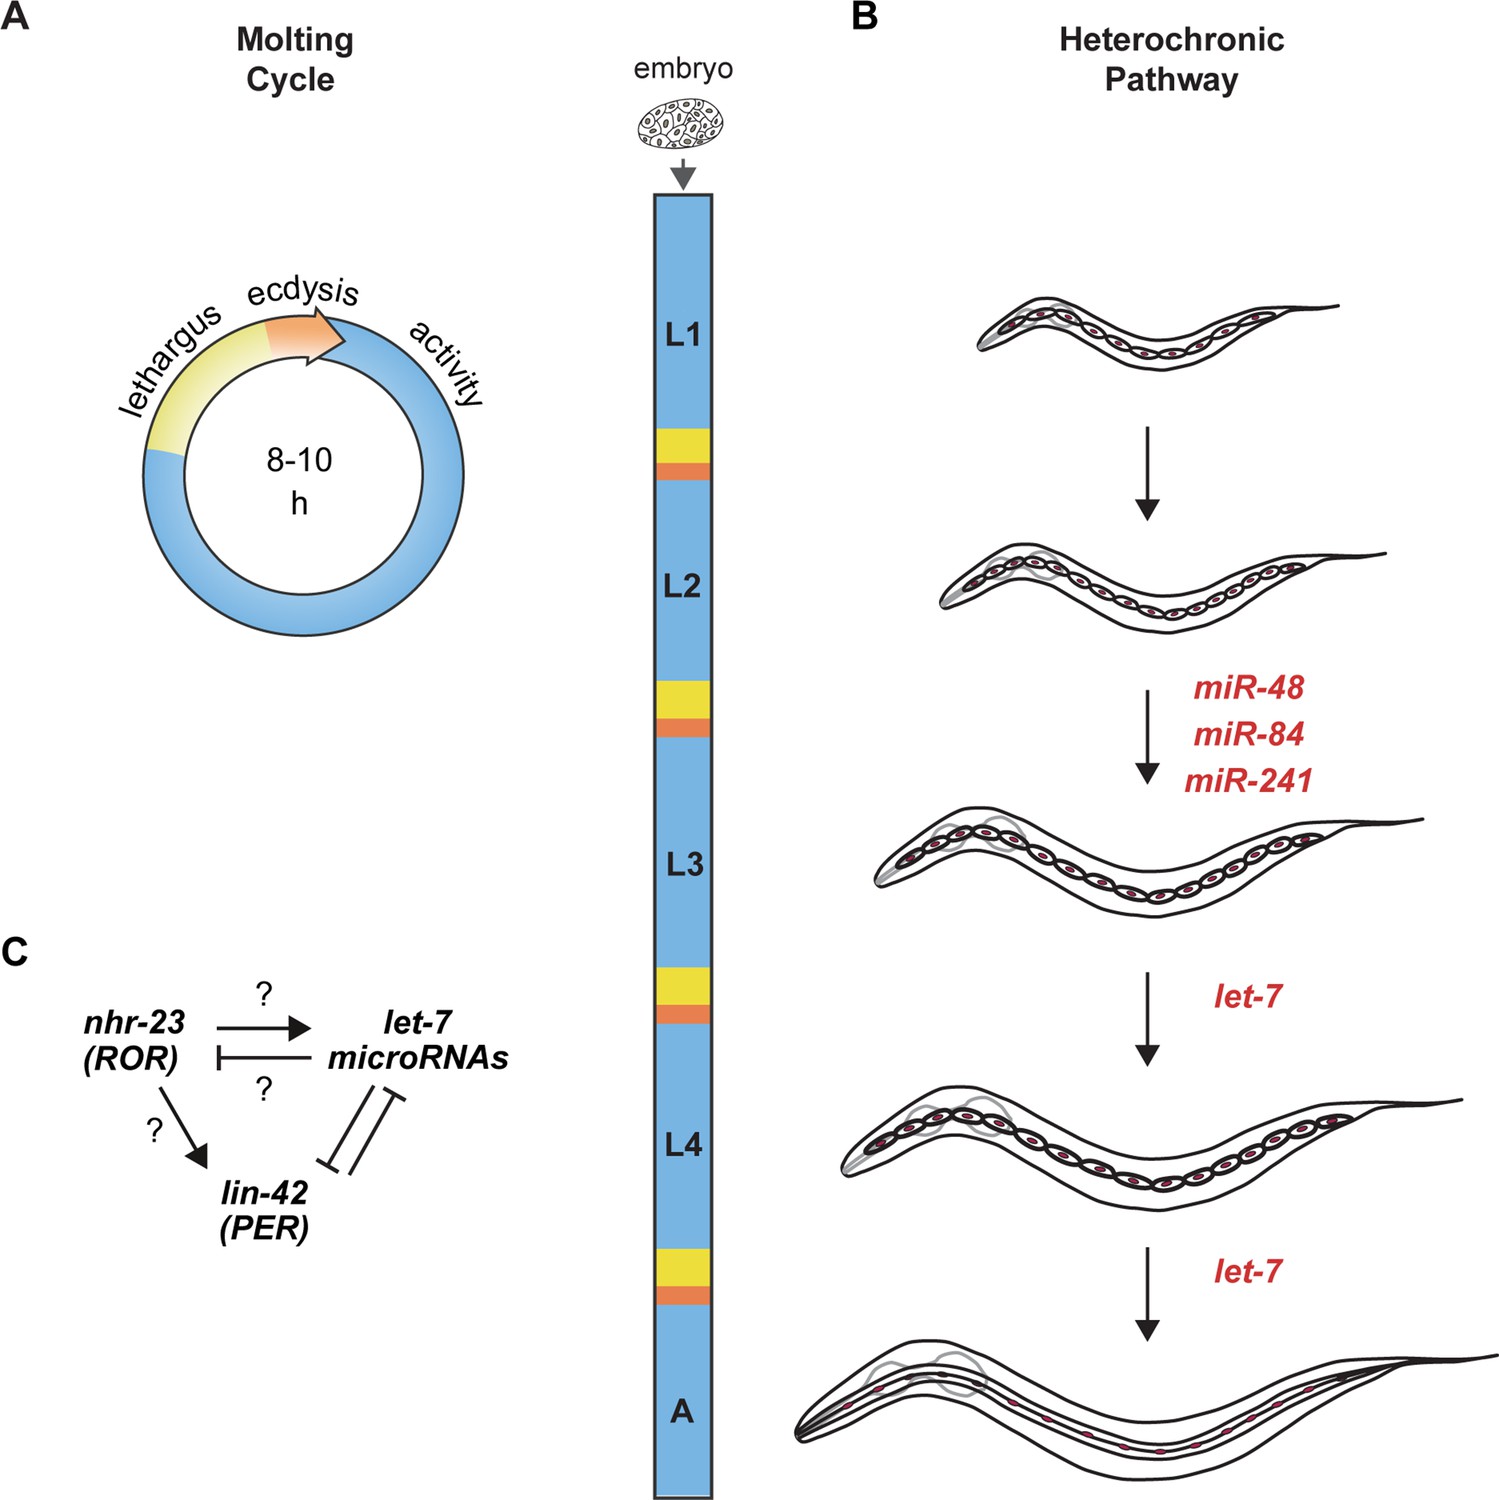
Animal development requires coordination between reiterated processes and successive transitions in cell fate.
(A) Stages of the molting cycle of C. elegans, emphasizing the regular intervals of lethargus (yellow), ecdysis (orange), and physical activity (blue). Upon hatching, the embryo grows and develops through four larval stages that are punctuated by molts. (B) Successive transitions in the fate of the lateral epidermal stem cells, called seam cells (red nuclei), in developing worms. The let-7 family of microRNAs, consisting of miR-48, miR-84, miR-241, and let-7, promote transitions in the fate of seam cells; miR-48, miR-84, and miR-241 are specific to the L2 stage, while let-7 is associated with the L3 and L4 stages. The adult stage is characterized by the presence of cuticular structures called alae. (C) Schematic depiction of interactions between ROR/nhr-23, let-7 microRNAs, and PER/lin-42 in C. elegans. Arrowheads and bars signify positive and negative regulation, respectively. Question marks signify regulatory events evaluated in this study.
Figure 2
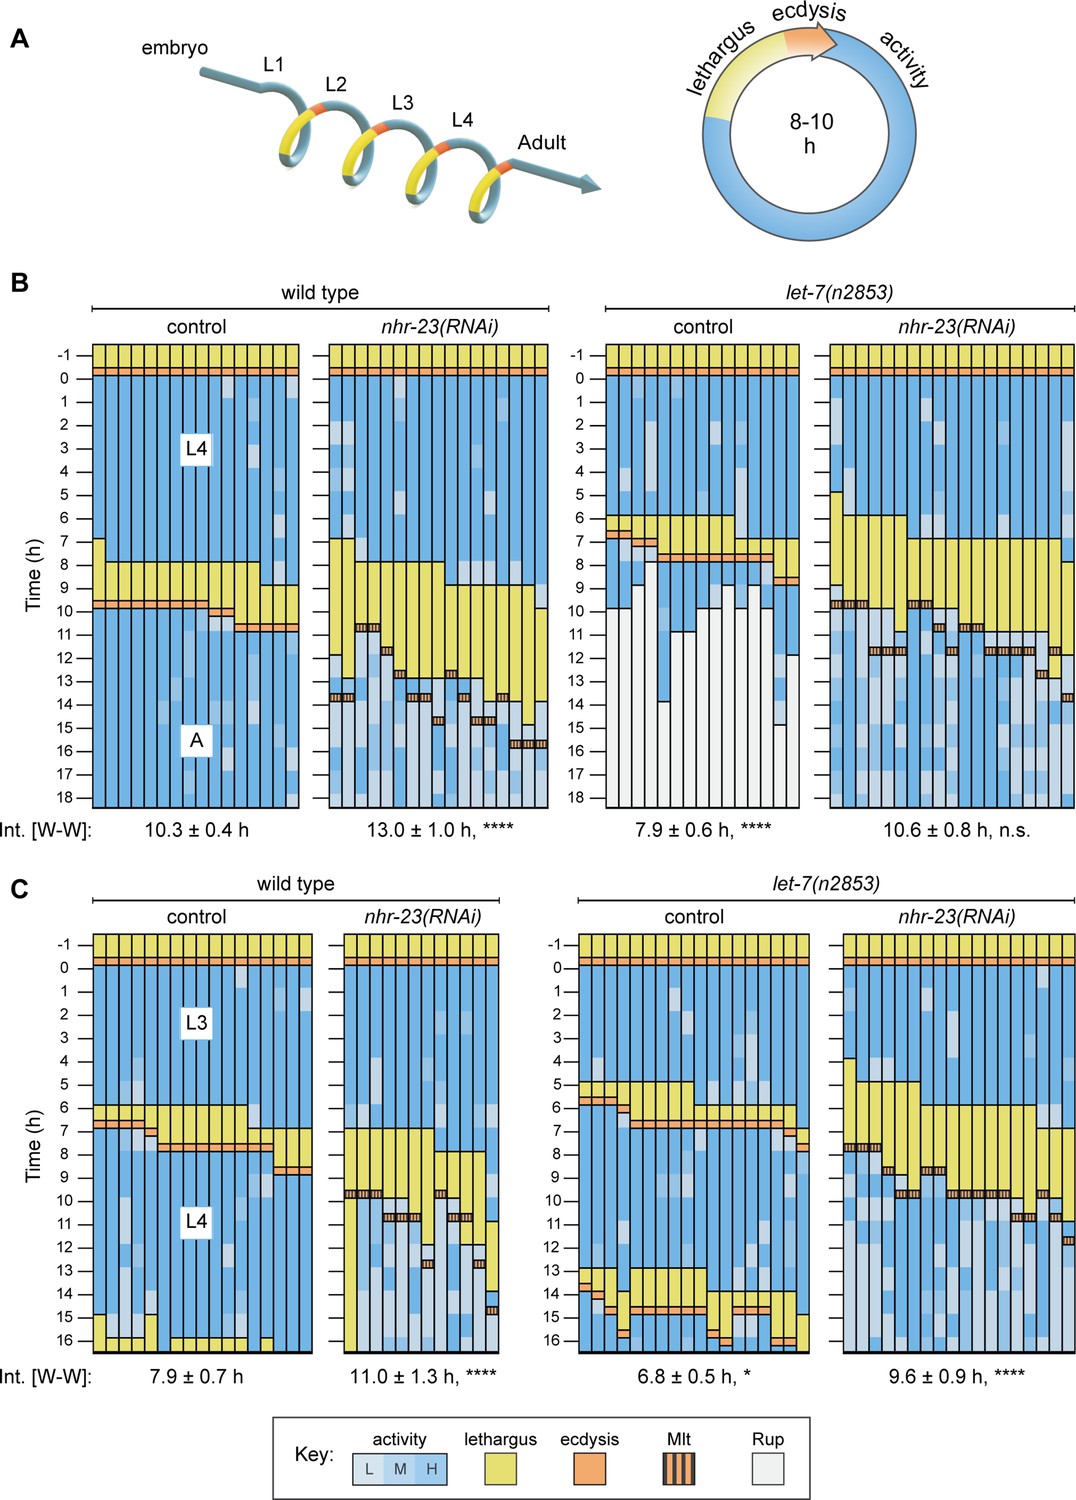
Opposite and codependent effects of nhr-23 and let-7 on molting biorhythms.
(A) Stages of the life cycle (left) and the molting cycle (right) of C. elegans. (B) Actograms depict the behavior, life stage, and phenotype of worms observed at 1h intervals from emergence in L4 onward. Each chart combines records from two independent trials. The records within each column correspond to a single worm. In addition, the molting-defective phenotype is labeled only when first detected. See key at the bottom of Figure 2 for details; activity is designated as low (L), medium (M), or high (H); Mlt and Rup indicate molting and rupture phenotypes, respectively. The wake-to-wake time intervals (W–W) are indicated. Relevant scoring rubrics are further defined in Results and Materials and methods. ****p ≤ 0.0001; ordinary one-way analysis of variance (ANOVA) with Bonferroni’s correction for multiple comparisons. (C) Same as B, except that the actograms depict animals observed from emergence in L3 onward. ****p ≤ 0.0001, *p ≤ 0.05; ordinary one-way ANOVA with Bonferroni’s correction for multiple comparisons. Supplementary file 1 includes the active, lethargic, and W–W intervals of these eight cohorts, as well as additional cohorts of both let-7 family mutants and nhr-23 knockdowns.
Figure 3 with 2 supplements
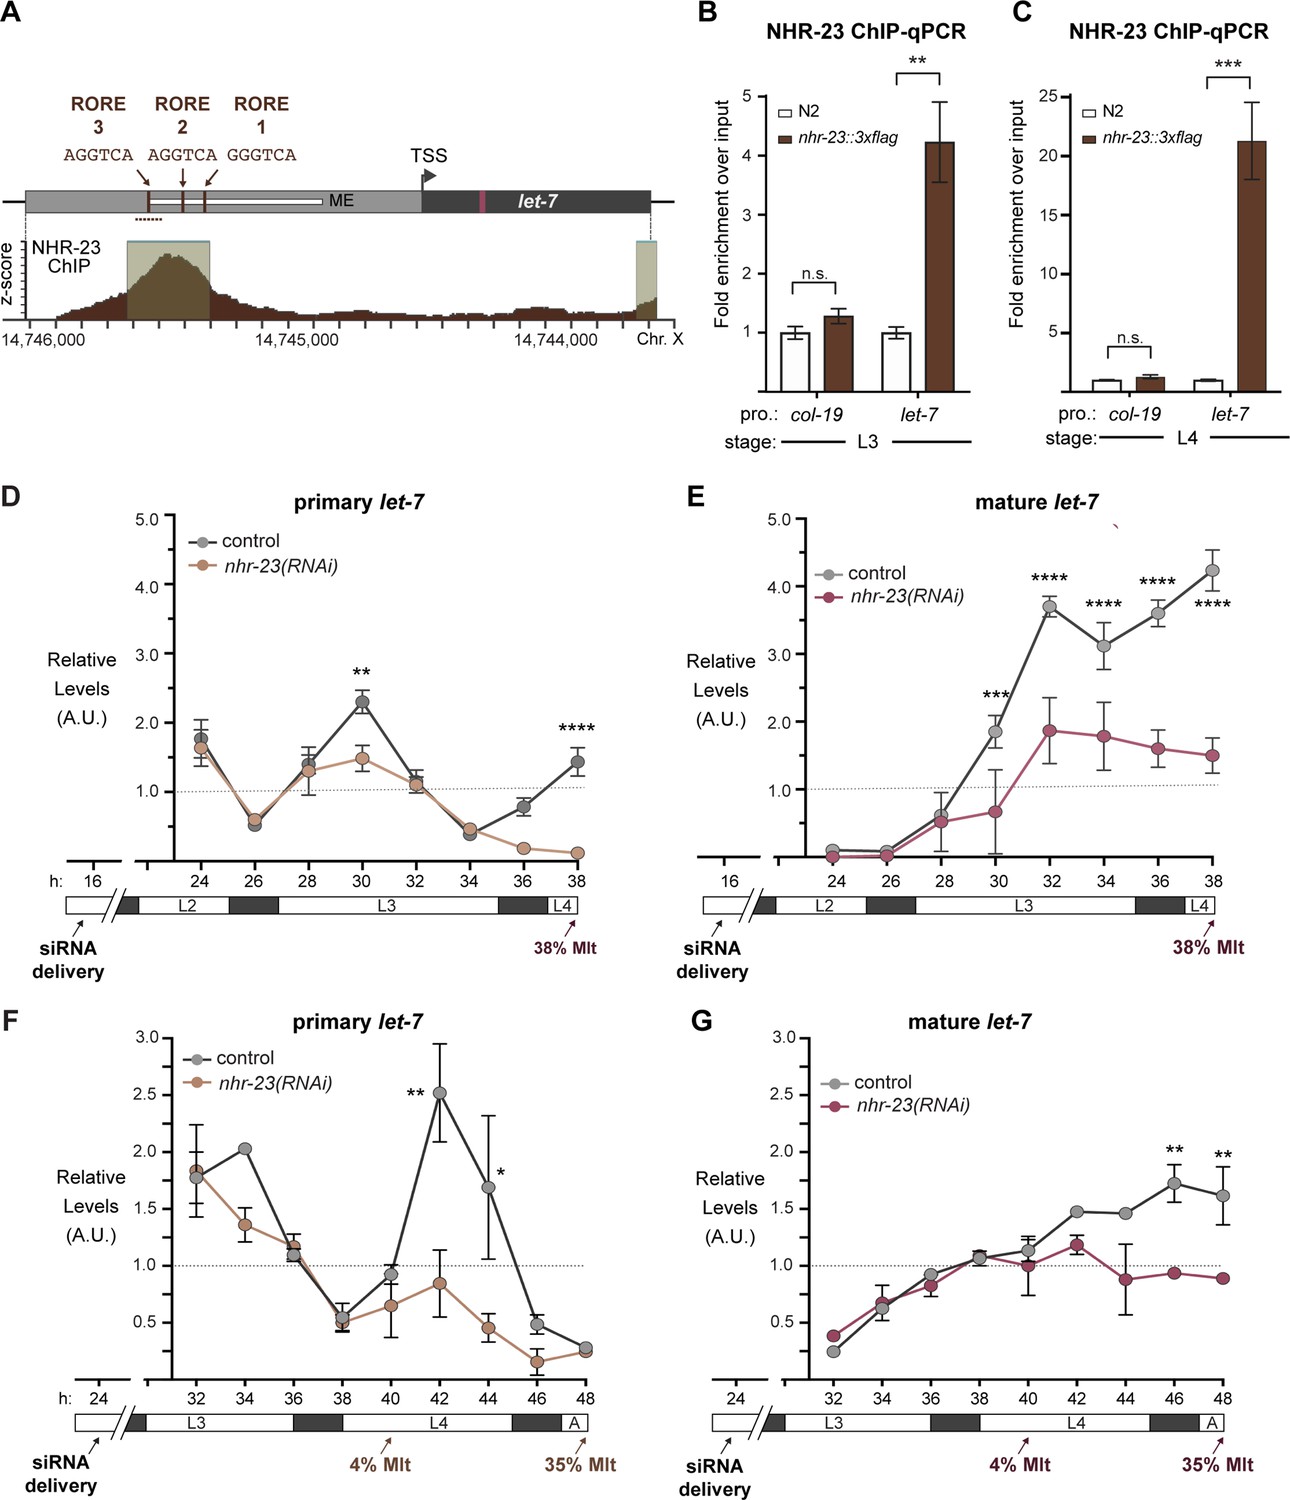
NHR-23 promotes transcription of primary let-7.
(A) Schematic of the let-7 locus in C. elegans (top) and corresponding NHR-23 ChIP-seq peaks (bottom). Top: Mature let-7 (magenta); pri-let-7 (black); upstream DNA sequences (dark gray) present in the let-7p::gfp transcriptional reporter (Kai et al., 2013) the minimal seam-specific enhancer (light gray) (MP) (Johnson et al., 2003); consensus ROREs (brown). TSS indicates the major transcriptional start site for pri-let-7 (Kai et al., 2013). Dotted line represents the amplicon quantified by ChIP-qPCR. Bottom: The NHR-23 ChIP-seq peaks reported by the modENCODE Consortium are indicated. (B, C) ChIP-qPCR analysis of NHR-23::3xFLAG enrichment at the let-7 promoter in L3- and L4-stage wild-type (untagged control) and nhr-23::3xflag larvae. The promoter of col-19, which had no detectable NHR-23 ChIP-seq peaks, was used as a negative control. Values represent the mean ± standard error of the mean (SEM) of three independent trials, each of which included three technical replicates. Values for the amplicon of interest in QK159 [nhr-23::3xflag] and N2 (wild type) were first normalized to the respective input. The average fold enrichment in QK159 samples was then normalized to the average fold enrichment in N2 samples within each trial. **p ≤ 0.01, ***p ≤ 0.001, two-way analysis of variance (ANOVA) with Bonferroni’s correction for multiple comparisons. (D) Levels of primary let-7 transcript determined by TaqMan RT-qPCR in nhr-23(RNAi) and mock-treated larvae developing from the late L2 stage until the L3-to-L4 molt. Each value was normalized to ama-1 transcript levels in the same sample. Values were then normalized to the average of all control time samples. Symbols represent the mean and range from two biological replicates. The x-axis indicates time elapsed (h) on food. The underlying bar depicts developmental stages; gray boxes therein signify lethargi. The times of initial exposure to nhr-23 siRNAs and the appearance of molting-defective nhr-23(RNAi) larvae are indicated. ****p ≤ 0.0001, **p ≤ 0.01; two-way ANOVA with Bonferroni’s correction for multiple comparisons. (E) Same as D, except the levels of mature let-7 transcripts, normalized to levels of the snoRNA U18, are shown. ****p ≤ 0.0001, ***p ≤ 0.001, two-way ANOVA with Bonferroni’s correction for multiple comparisons. (F, G) Same as D and E, respectively, except the larvae were collected from the early L3 stage until the L4-to-adult stage. **p ≤ 0.01, *p ≤ 0.05, two-way ANOVA with Bonferroni’s correction for multiple comparisons.
Figure 3—figure supplement 1

NHR-23 interacts with ROREs upstream of let-7 and its paralogs.
(A, B) (Top) Alignment of verified or predicted ROREs identified in upstream regulatory regions (gray shading) of mir-48, mir-241, and mir-84. Magenta boxes label mature microRNAs and dotted lines mark the location of qPCR primers used in C and D. (Bottom) NHR-23 ChIP-seq data captured in mid-L3s by the modENCODE Consortium (Celniker et al., 2009; Gerstein et al., 2010). Significant NHR-23 ChIP-seq enrichment indicated by beige shading with teal lines. Coordinates refer to C. elegans Chr. V (NC_003283.11) and Chr. X (NC_003284.9) as indicated. (C) NHR-23 ChIP-qPCR analysis in nhr-23::3xflag (QK159) L3-stage larvae. Detection and quantitation of the indicated 100-bp fragments upstream of mir-48, mir-241, and mir-84 as described in Figure 3B, and let-7. The promoter of col-19, which had no NHR-23 ChIP-seq peak, was used as a negative control. Error bars represent the mean ± standard error of the mean (SEM) from six distinct samples: two technical replicates per three biological replicates. ****p ≤ 0.0001, two-way analysis of variance (ANOVA) with Bonferroni’s correction for multiple comparisons. For a particular gene-specific amplicon, the value for each QK159 or N2 sample was first normalized to their respective input. The average fold enrichment in QK159 samples was then normalized to the average fold enrichment in N2 samples. (D) Same as C, except L4-stage larvae were used in the analysis. ****p ≤ 0.0001, ***p ≤ 0.001, **p ≤ 0.01, two-way ANOVA with Bonferroni’s correction for multiple comparisons.
Figure 3—figure supplement 2
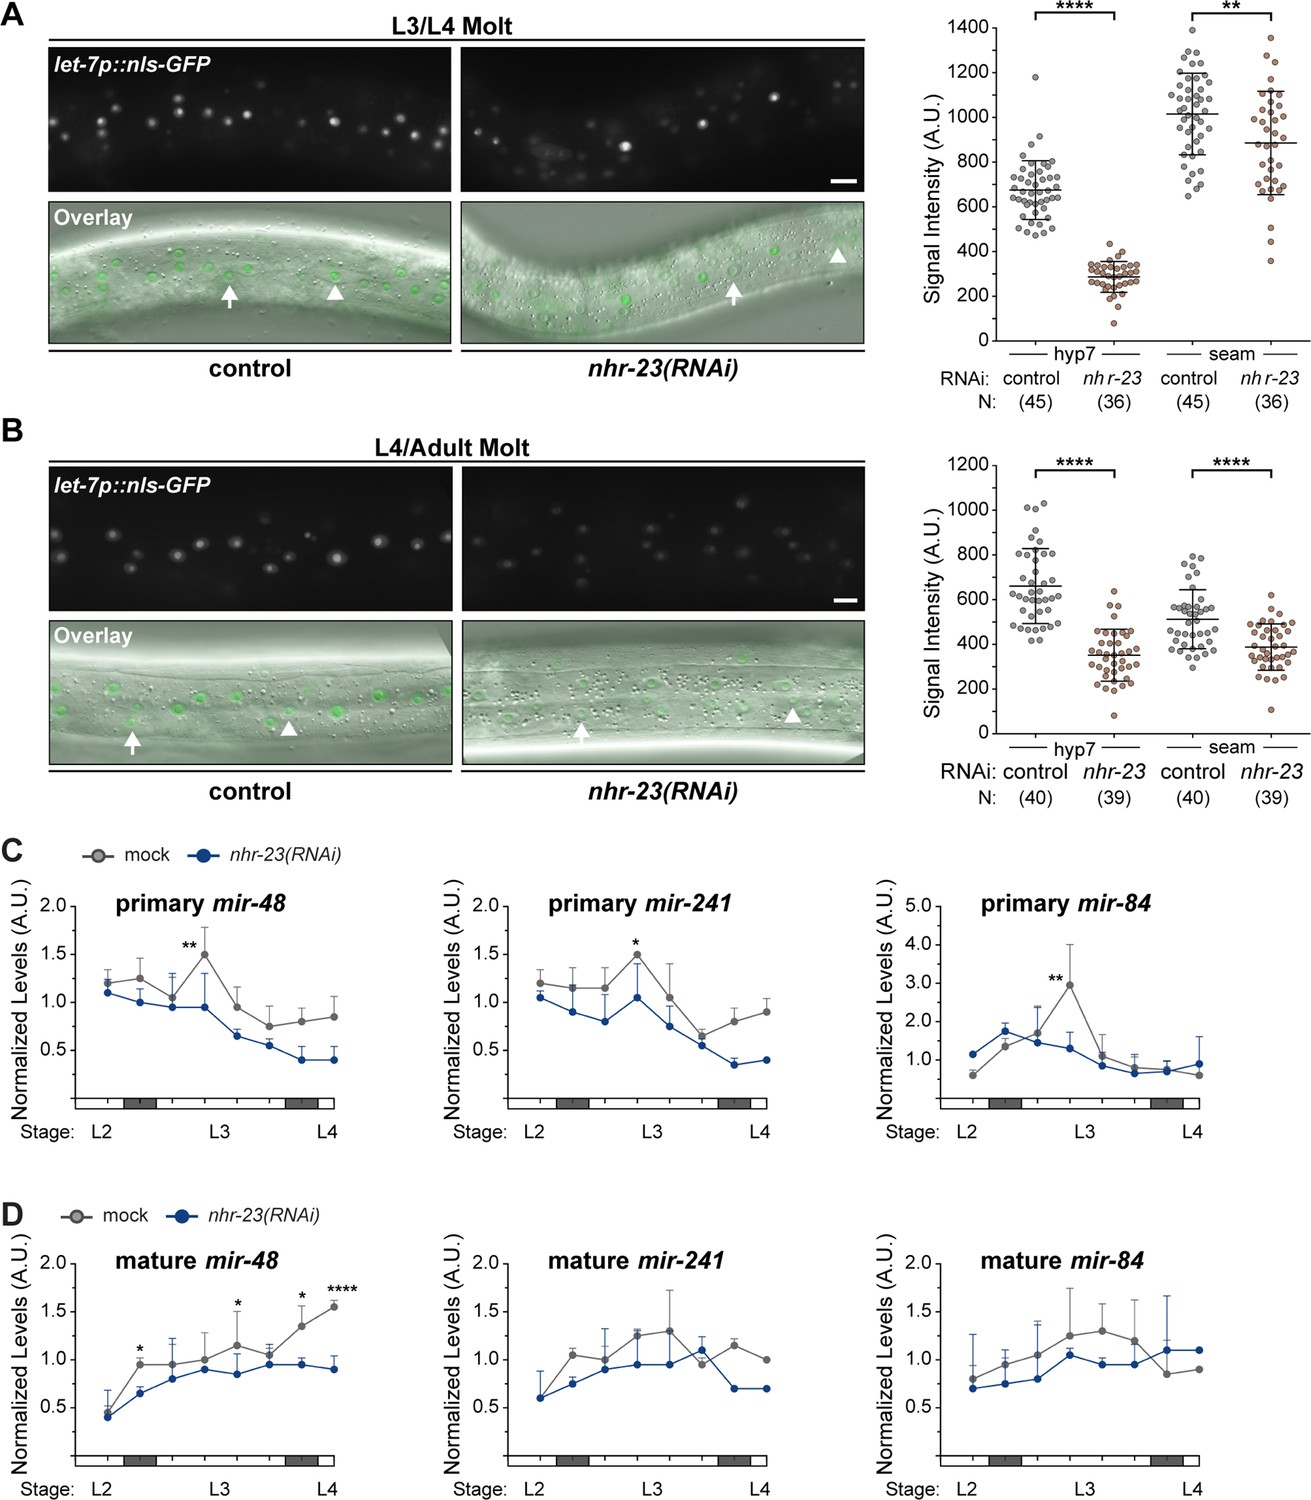
NHR-23 regulates the expression of the let-7 family during the L3 stage.
(A, B) Representative pairs of fluorescence images and respective overlays (GFP/DIC) show nuclear-localized GFP expressed from the promoter of let-7 in the lateral epidermis. Arrows point to nuclei in hyp7 syncytia; arrowheads, seam nuclei. Scale bars = 20 µm. Adjacent scatter plots show aggregated values from two independent trials. Bars signify the mean and SD. ****p ≤ 0.0001, **p ≤ 0.01, ordinary one-way analysis of variance (ANOVA) with Bonferroni’s correction for multiple comparisons. (C) Levels of primary mir-48, primary mir-241, or primary mir-84, determined by TaqMan qRT-PCR in nhr-23(RNAi) and mock-treated larvae developing from the late L2 stage until the L3-to-L4 molt. As described for Figure 3D, each value was normalized to ama-1 transcript levels in the same sample. Values were then normalized to the average of all control time samples. Symbols represent the mean and range from two biological replicates. The x-axis indicates time elapsed (h) on food. The underlying bar depicts developmental stages; gray boxes therein signify periods of lethargus. The times of initial exposure to nhr-23 dsRNAs and the appearance of molting-defective nhr-23(RNAi) larvae are indicated. **p ≤ 0.01, two-way ANOVA with Bonferroni’s correction for multiple comparisons. (D) Same as above, for levels of mature microRNA levels of mir-48, mir-241, and mir-84, each normalized to U18. ****p ≤ 0.0001, *p < 0.05, two-way ANOVA with Bonferroni’s correction for multiple comparisons. N2 was used for this analysis.
Figure 4 with 1 supplement
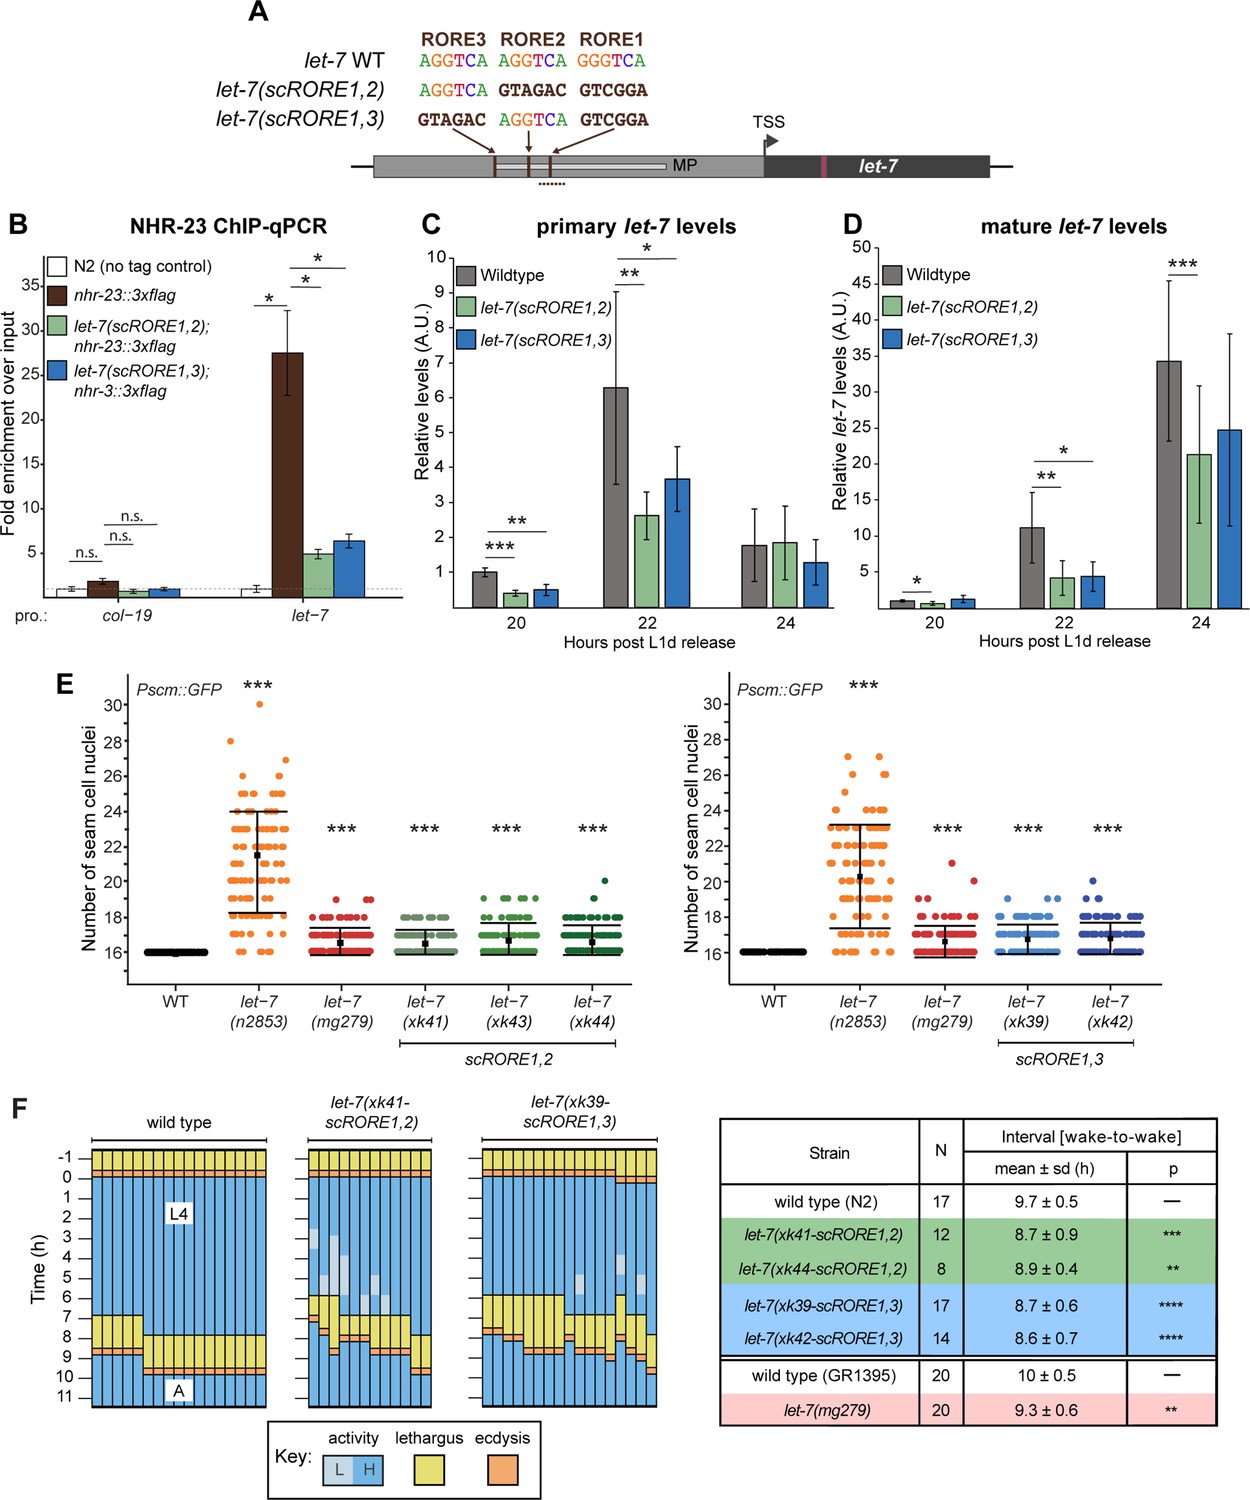
Scrambling the ROREs reduces NHR-23 occupancy at the let-7 promoter and phenocopies let-7(lf) mutants.
(A) The RORE sites in the let-7 promoter were scrambled in pairs using CRISPR/Cas9-mediated genome editing. The dotted line represents the amplicon quantified by ChIP-qPCR. (B) ChIP-qPCR analysis of NHR-23 binding to the let-7 promoter in wild-type nhr-23::3xflag strain and nhr-23::3xflag; let-7(xk41-scRORE1,2) and nhr-23::3xflag; let-7(xk39-scRORE1,3) mutants. The promoter of col-19, which had no NHR-23 ChIP-seq peak, was used as a negative control. One biological replicate of ChIP-qPCR from L4 animals is shown. The bar graph represents the mean of two technical replicates. The error bars represent mean ± standard deviation (SD). Values for the amplicon of interest were first normalized to their respective input samples. The average fold enrichment for each genotype was then normalized to the average fold enrichment in N2 (no tag control) samples; n.s. is not significant; *p < 0.05, two-tailed Student’s unpaired t-test. A second biological replicate is shown in Figure 4—figure supplement 1. (C) Levels of primary let-7 transcript determined by RT-qPCR in let-7(xk41-scRORE1,2) and let-7(xk39-scRORE1,3) mutants immediately after the L2-to-L3 molt. Three biological replicates, with two technical replicates each, are shown. The bar graph represents the mean of the six values first normalized to the levels of eft-2 and then to the value of the N2 sample at 20 h. The error bars represent mean ± SD; *p ≤ 0.05, **p ≤ 0.01, ***p < 0.001; two-tailed Student’s paired t-test. (D) Same as C, except levels of mature let-7 determined using Taqman RT-qPCR were first normalized to U18 snoRNA and then to the value of the N2 sample at 20 h; *p ≤ 0.05, **p ≤ 0.01, ***p < 0.001, two-tailed Student’s paired t-test. (E) The number of seam cell nuclei in three independent lines (xk41, xk43, and xk44) of let-7(scRORE-1,2) and two independent lines (xk39 and xk42) let-7(scRORE-1,3) mutants grown at 25°C are shown. The let-7(n2853) and let-7(mg279) were scored as controls. All scoring was done in the background of JR672 (Pscm::GFP). Mean ± SD shown; N ≥ 100 for each strain; ***p < 0.001, one-way analysis of variance (ANOVA). (F) Left: Actograms depict the behavior and life stage of single wild-type or mutant animals observed at regular 1 h intervals, as described in Figure 2B. Here, high activity (L) refers to continuous pharyngeal pumping, whereas low activity (L) refers to intermittent pharyngeal pumping at the time of observation. Right: Table with wake-to-wake intervals for multiple independent isolates; ****p ≤ 0.0001, ***p ≤ 0.001, **p ≤ 0.01, Mann–Whitney test.
Figure 4—figure supplement 1

Scrambling the ROREs in the let-7 promoter reduces NHR-23 occupancy.
(A) Second biological replicate of ChIP-qPCR for NHR-23 enrichment at the let-7 promoter in nhr-23::3xflag; let-7(xk41-RORE-1,2) and nhr-23::3xflag; let-7(xk39-RORE-1,3) L4 animals. The bar graph represents the mean of the two technical replicates. The error bars represent mean ± standard deviation. Values for the amplicon of interest was first normalized to their respective input. The average fold enrichment for each genotype was then normalized to the average fold enrichment in N2 samples; n.s., not significant; *p < 0.05, two-tailed Student’s t-test.
Figure 5 with 1 supplement

The 3′ UTR of nhr-23 contains a functional let-7 consensus site (LCS).
(A) Predicted base pairing between the LCS in the nhr-23 3′ UTR and mature let-7. Schematic also shows three other predicted let-7-binding sites (brown box) and the stop codon (black box). (B) Design of bicistronic reporters for 3′ UTR-mediated gene regulation. (C) Rows of representative fluorescence images show merged and individual signals from tdTomato and GFP coexpressed in the lateral epidermis of the same worm. Labels indicate the 3′ UTR fused to tdTomato in the corresponding reporter. Arrowheads point to hyp-7 nuclei. Scale bar = 10 µm. All images were captured with an exposure time of 10 ms. (D) Quantitation of the ratiometric signal (tdTomato/GFP) associated with each 3′ UTR reporter detected. Each symbol represents the average value of three region-of-interests or ROIs per worm. N indicates the cumulative sample size from two independent experiments. Bars signify mean ± standard deviation (SD) for the cumulative sample; ****p ≤ 0.0001, ordinary one-way analysis of variance (ANOVA) with Tukey’s correction for multiple comparisons. (E) As in D, except that ratiometric values were normalized to same-day controls. The full-length (WT) nhr-23 construct is depicted in blue; deletion constructs in brown.
Figure 5—figure supplement 1

Design and performance of bicistronic reporters for cis-regulatory elements in 3′ UTRs of interest.
Schematic depicts the following series of anticipated events: (1) transcription of the bicistronic reporter under control of the dpy-7 promoter; (2) trans-splicing of the resulting pre-mRNA, which generates distinct tdTomato::test 3′ UTR and gfp::unc54 3′ UTR mRNAs; and (3) standalone translation of the latter messages into fluorescent proteins.
Figure 6 with 2 supplements
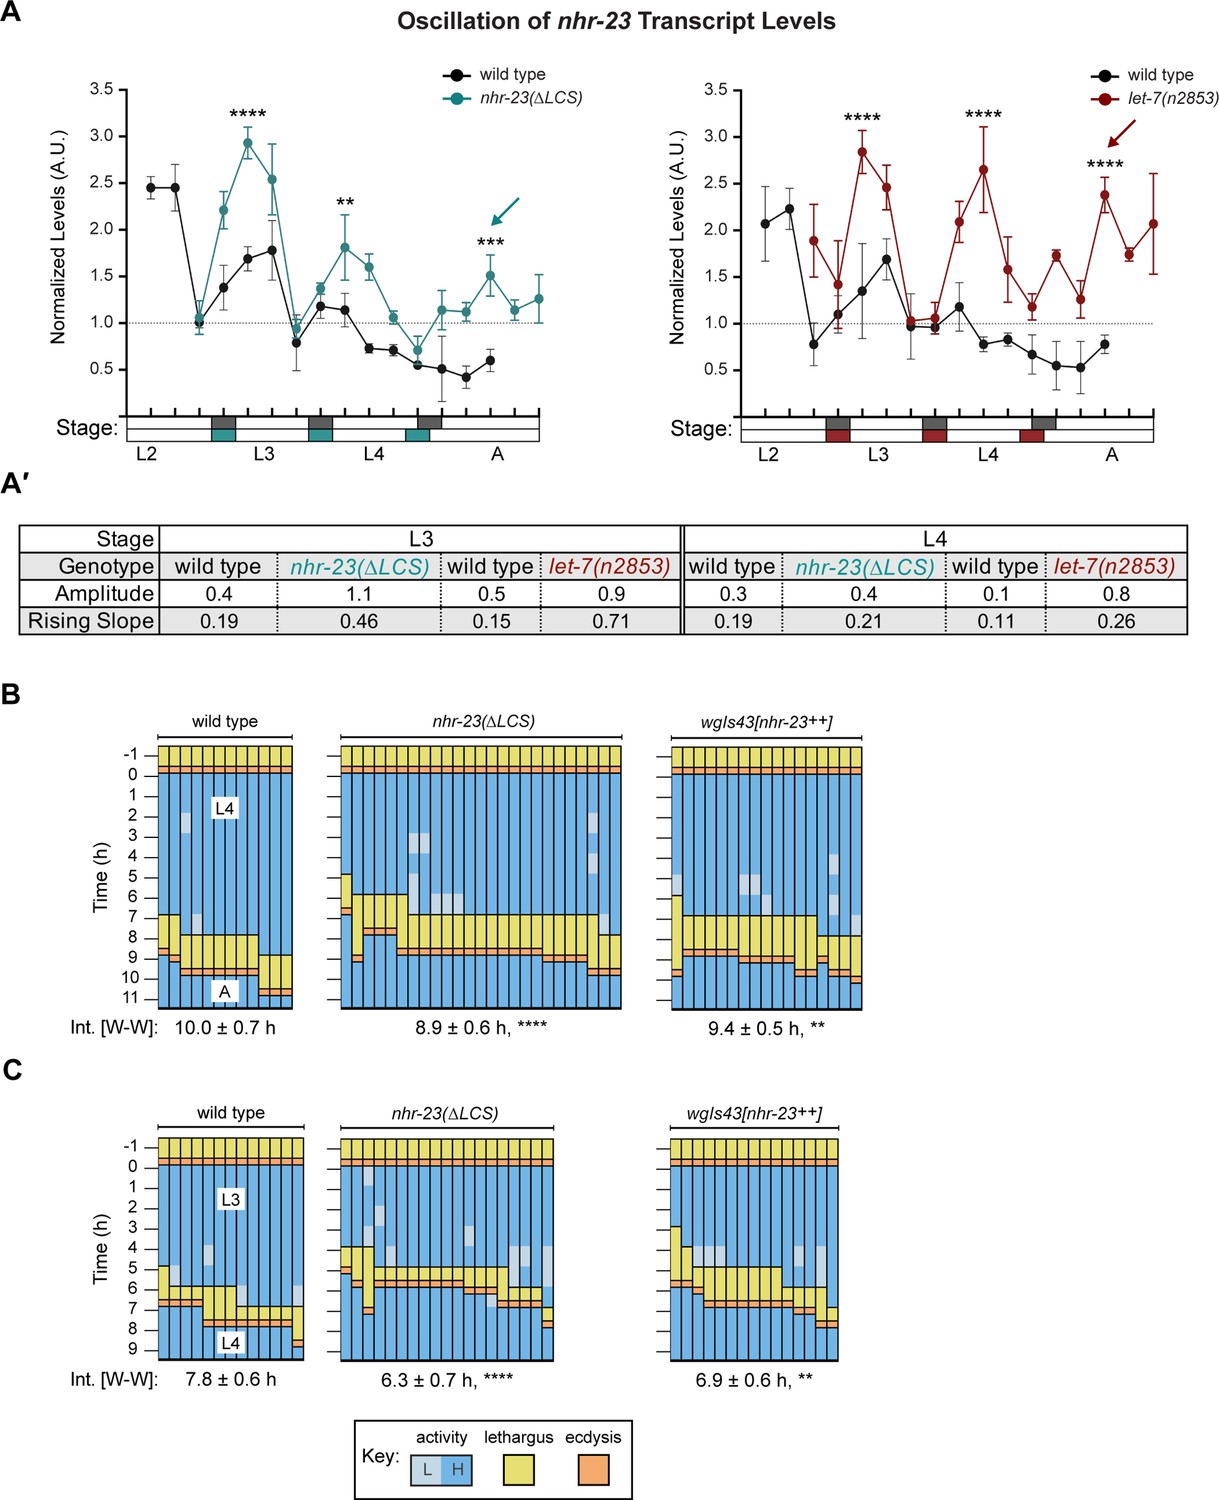
Steeper waveforms of nhr-23 expression and increased pace of development are both associated with the nhr-23(∆LCS) (aaa20 allele) and let-7 mutants.
(A) Levels of nhr-23 transcripts detected by TaqMan RT-qPCR in regular time samples of wild-type, nhr-23(∆LCS), and let-7(n2853) animals collected from late L2 through early adulthood. Shaded rectangles beneath the x-axis signify lethargi in wild-type (dark gray), nhr-23(∆LCS) (teal), and let-7(n2853) (maroon) animals; white rectangles signify intervals of physical activity. Transcript levels for nhr-23 were first normalized to ama-1 transcripts within each time sample and then further normalized to the mean of all wild-type time samples, represented by the dashed gridline. Dots and error bars represent the mean and range from three technical replicates, respectively. As the rates of development of the three genotypes differ from one another, the waveforms for the wild-type samples were shifted to the left by 4 h in both graphs to align the mutant and wild-type samples by developmental stage. The p values shown are for comparisons between wild-type and mutant values at the indicated timepoints; ****p ≤ 0.0001, ***p ≤ 0.001, **p ≤ 0.01, two-way analysis of variance (ANOVA) with Tukey’s correction for multiple comparisons. Figure 6—figure supplement 1A shows the results of an independent biological replicate. Arrows point to the supernumerary peaks in nhr-23 transcript levels detected in both nhr-23(∆LCS) and let-7(n2853) animals. Wild-type animals were sampled 24–50 h after release from L1 diapause; nhr-23(∆LCS) and let-7(n2853) animals were sampled 22–48 h after L1 diapause. (A′) Metrics used to compare the sequential waves of nhr-23 expression associated with each of the indicated genotypes: nhr-23(∆LCS), let-7(n2853), and wild type. The amplitude of the waveforms was calculated using Metacycle. The rising slope refers to the rate at which transcript levels ascend from the trough detected before or during the preceding molt to the peak detected within the specified stage. (B, C) Actograms depict the behavior and life stage of single animals observed at regular 1 h intervals, as described in Figure 2. In this case, high or low activity refers to continuous or sporadic pharyngeal pumping observed during the time sample. As previously described, Supplementary file 1 has the active, lethargic, and W–W intervals of the cohorts in these studies. ****p ≤ 0.0001, **p ≤ 0.01, ordinary one-way ANOVA with Bonferroni’s correction for multiple comparisons.
Figure 6—figure supplement 1
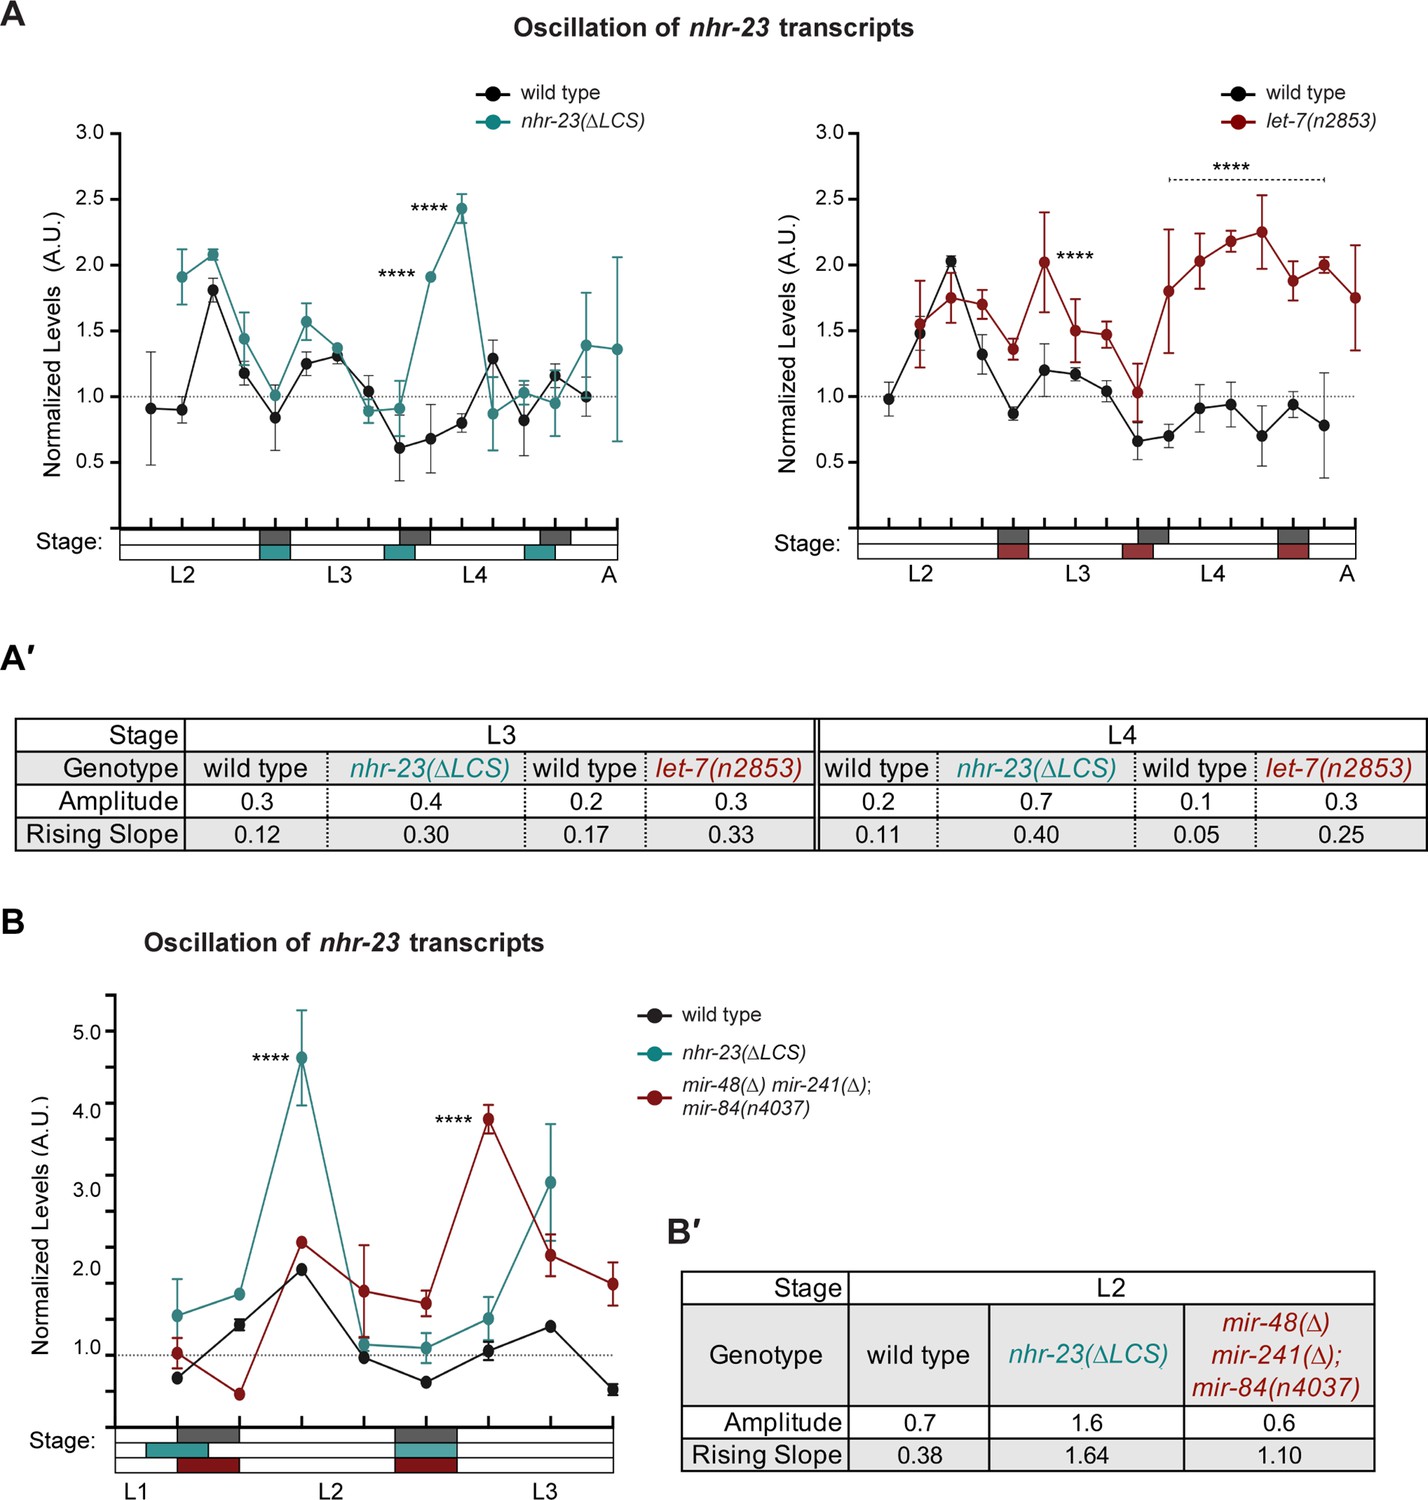
Both the functional let-7 consensus site (LCS) in the 3′ UTR of nhr-23 and let-7-family miRNAs limit the abundance of nhr-23 transcripts across larval development.
(A) An independent replicate of the experiment described in Figure 6A. Briefly, the values represent normalized levels of nhr-23 transcripts detected in regular 2 h time samples of wild-type, nhr-23(∆LCS), and let-7(n2853) larvae and newly emerged adults. As previously described, wild-type samples were shifted to the left by 2 h to account for the apparent difference in the pace of development of this cohort relative to the mutant cohorts. Also, p values are for comparisons between wild-type and mutant values at the indicated timepoints; ****p ≤ 0.0001, two-way analysis of variance (ANOVA) with Tukey’s correction for multiple comparisons. The samples in this trial were collected after hatchlings were cultivated on food for 24–50 h. (A′) Metrics used to compare sequential waves of nhr-23 expression, also as described in Figure 5. (B) Normalized nhr-23 transcript levels detected in wild-type larvae, nhr-23(∆LCS) single mutants, and mir-48(∆) mir-241(∆); mir-84(n4037) triple mutants sampled across the L2 stage. In this chart, time samples for nhr-23(∆LCS) were shifted to the left by 2 h because the pace of development of this strain differed from the others used in this experiment; ****p ≤ 0.0001, two-way ANOVA with Tukey’s correction for multiple comparisons. Both wild-type and let-7s triple mutant larvae were collected after cultivation with food for 14–26 h; nhr-23(∆LCS) larvae, after 16–28 h. (B′) Charts show the amplitude and rising slope of the nhr-23 curve during the L2 stage, calculated as described earlier.
Figure 6—figure supplement 2

The NHR-23 levels cycle across larval development and are elevated in let-7(lf) mutants relative to wild type.
(A) Representative images show NHR-23::GFP fusion proteins detected in the lateral epidermis of OP43 [wgIs43[nhr-23::gfp]] larvae at the indicated stages. Fluorescence images were all captured with an exposure time of 300 ms. In the image of an early L4, the arrowhead points to a nucleus in the seam; the arrow, to a nucleus in hyp7. Scale bars = 10 µm. (B) Quantification of the NHR-23::GFP signal detected in cohorts of larvae collected at regular 1 h intervals across the entirety of the L4 stage. Gray and white rectangles above the x-axis denote phases of lethargus and activity, respectively. Values represent the mean ± standard deviation (SD) derived from samples of 6–10 worms per timepoint. Within each worm, signals detected in three hyp7 nuclei and seam nuclei were measured and the average value applied to further analysis. (C) Pairs of fluorescence and merged GFP/DIC micrographs show NHR-23::GFP fusion proteins detected in the lateral epidermis of wgIs43[nhr-23::gfp++] and wgIs43; let-7(mg279) mir-84(tm1304) animals at the indicated stages. Arrowheads point to nuclei in the syncytial hypodermis. The arrow points to a seam (s) nucleus. The letter g underscores signal detected in several germline nuclei. Scale bar = 10 µm.
Figure 7 with 3 supplements
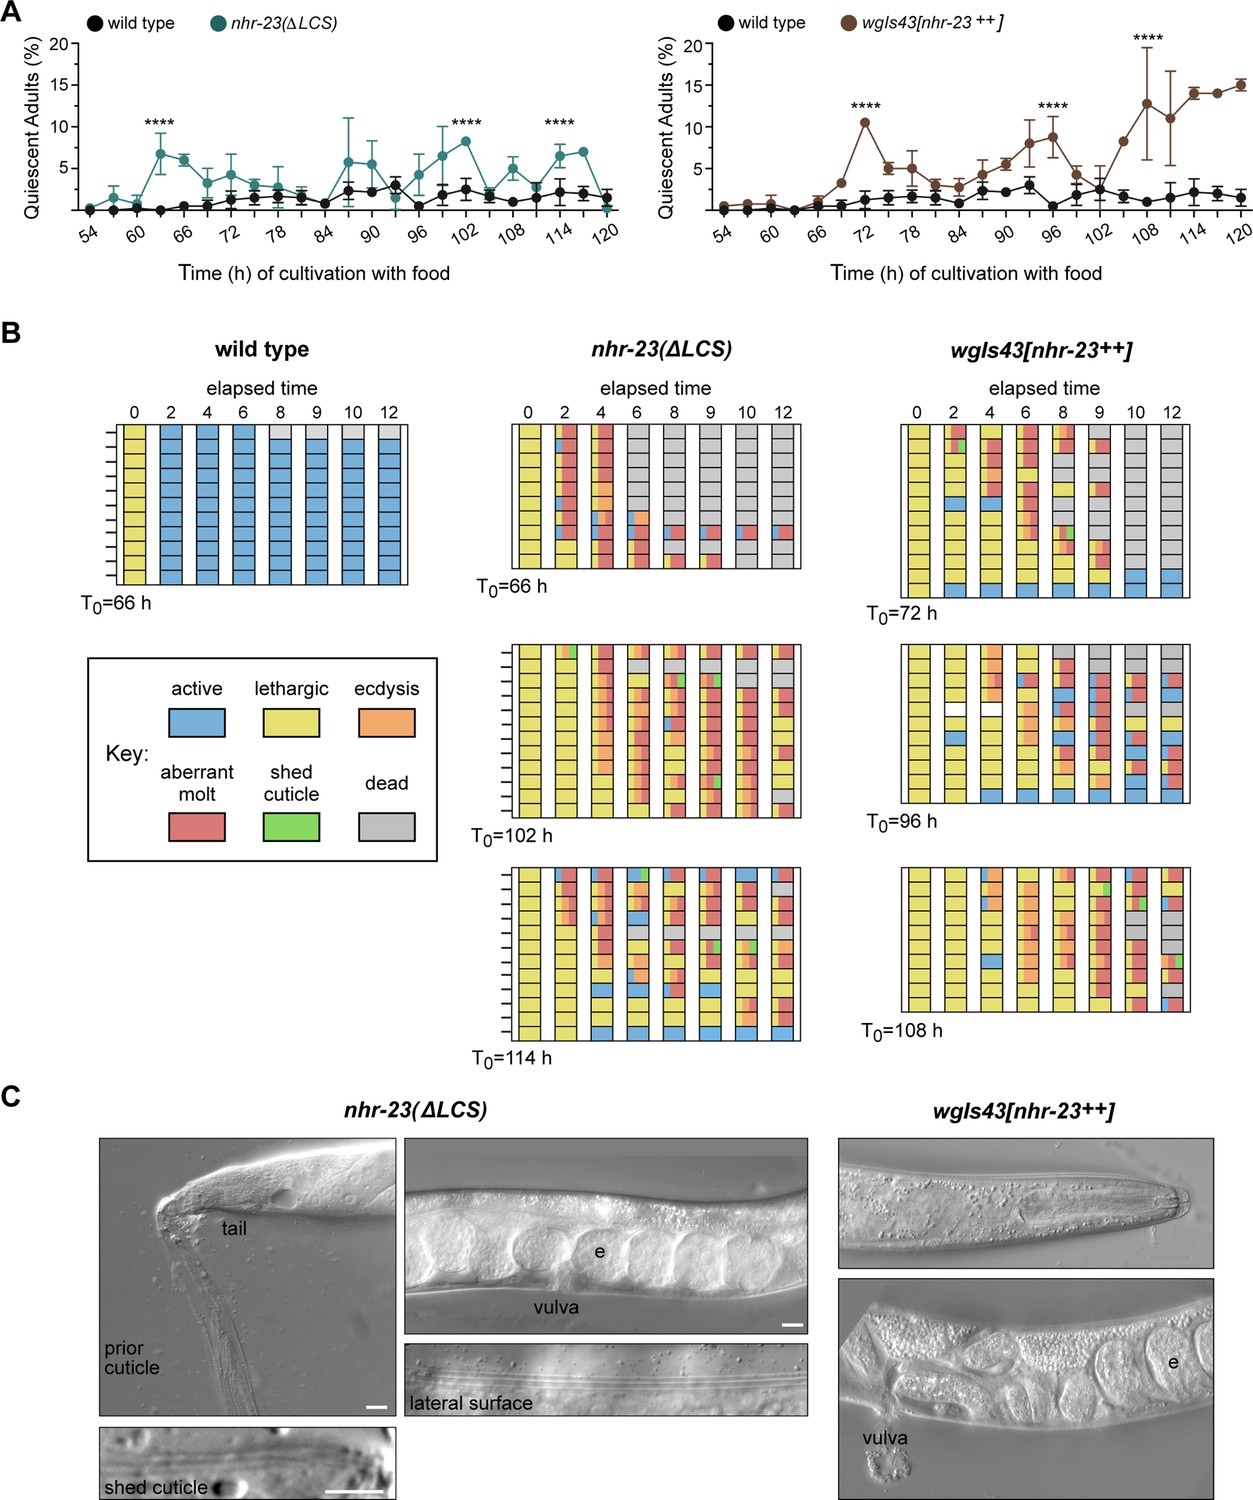
Both derepression and ectopic overexpression of nhr-23 trigger additional molts in reproductively mature animals.
(A) The percentage of adults in wild-type, nhr-23(∆LCS), and the nhr-23 overexpression strain (wgIs43[nhr-23++]) that appeared quiescent at regular timepoints 54–120 h after release from diapause and cultivation with food. Values represent the mean ± standard deviation (SD) from two independent trials, with cumulative sample sizes of 300–400 animals per timepoint. The values for the wild-type cohort were repeated in both graphs for ease of comparison. Significant peaks in the prevalence of quiescent animals are marked by asterisks. The corresponding values significantly exceeded the values for age-matched, wild-type animals (p < 0.0001, chi-square test, χ2 ranged from 39 to 223). (B) Actograms depict the behavior and fate of quiescent adults singled at each timepoint marked by an arrow and then observed at regular 2 h intervals. Records within each row correspond to a single worm. The behavior of a worm at a particular timepoint was scored as active, lethargic, or ecdysing as described in Materials and methods. Aberrant molts and death were also recorded (see Materials and methods). (C) DIC micrographs show examples of adults that attempted to molt. Arrows point to former cuticles dislodged from the tail or head; arrowheads point to alae on both the passing and emergent cuticles. The letter ‘e’ denotes fertilized embryos within the uterus. Scale bars = 10 µm.
Figure 7—video 1
Behavior and fate of a quiescent wild-type adult.
Movie shows the behavior and fate of a wild-type adult, video recorded for 15 s every 2 h, that was quiescent at the initial timepoint of observation. The wild-type adult was still alive 8 h after the initial incidence of behavioral quiescence.
Figure 7—video 2
Behavior and fate of a quiescent nhr-23(∆LCS) adult.
As above, video recordings were done for 15 s at 2 h intervals from the initial detection of quiescence. Quiescence was detected at every time sample, and bits of loose cuticle were found along the head and at the vulva. The animal ultimately bagged.
Figure 7—video 3
Behavior and fate of a quiescent wgIs43[nhr-23++] adult.
Video recording was done as described for Figure 7—videos 1; 2. The animal was quiescent at the first three time samples. At 8 h after the initial detection of quiescence, the grinder of the animal was observed to twitch several times, a behavior that normally accompanies ecdysis. At the 10 h timepoint, the animal resumed pumping, albeit at a visibly lower rate than wild-type adults. At this time, loose cuticle could also be detected at the tail. The animal eventually bagged.
Figure 8 with 1 supplement
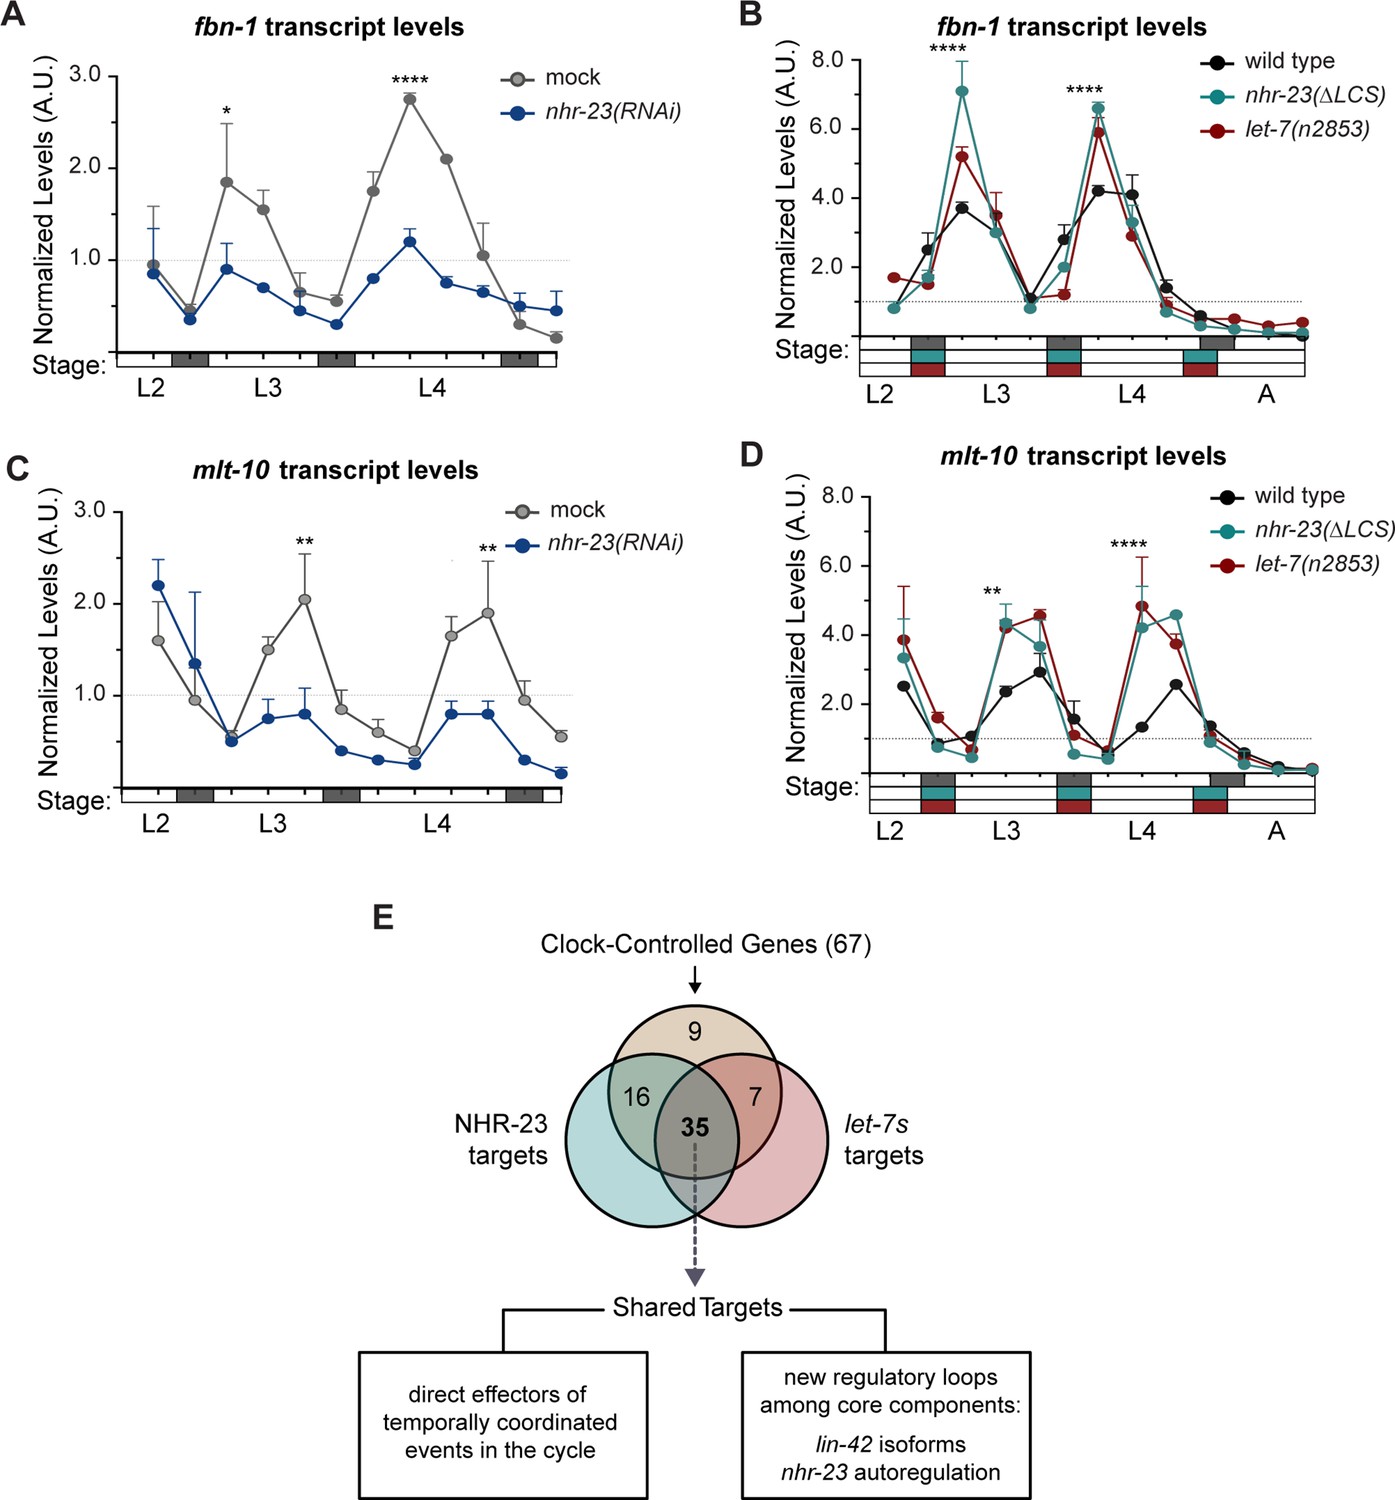
Most genes regulated by the molting clock are shared targets of both NHR-23 and let-7s.
(A) Levels of fbn-1 transcripts detected by TaqMan RT-qPCR in regular time samples of mock-treated and nhr-23(RNAi) animals collected from the late L2 through young adulthood. The data were collected from distinct experiments: one set, which comprised two independent trials, covered the late L2 stage until the L3-to-L4 molt; and the other set, which also comprised two independent trials, covered the late L3 stage until the L4-to-adult molt. Lethargus (dark gray boxes) and intervals of physical activity (white boxes) are denoted beneath the x-axis. Values for fbn-1 were first normalized to ama-1 transcripts within each same time sample and then normalized to the mean of all wild-type time samples, represented by the dashed gridline. Dots and error bars represent the mean and range from two biological replicates, respectively; ****p ≤ 0.0001, *p < 0.05, two-way analysis of variance (ANOVA) with Bonferroni’s correction for multiple comparisons. (B) Same as A, except that the levels of fbn-1 transcripts were measured in wild-type, nhr-23(∆LCS) and let-7(n2853) animals collected from late L2 through early adulthood. Shaded rectangles beneath the x-axis depict the molts in in wild-type (dark gray), nhr-23(∆LCS) (teal), and let-7(n2853) (magenta) animals; ****p ≤ 0.0001, two-way ANOVA with Bonferroni’s correction for multiple comparisons. Wild-type animals were sampled 24–50 h after release from L1 diapause; nhr-23(∆LCS) and let-7(n2853) animals were sampled 22–48 h after L1 diapause. (C, D) Same as B and C, respectively, except the levels of mlt-10 transcripts were measured using Taqman RT-qPCR. ****p ≤ 0.0001, **p < 0.01, two-way ANOVA with Bonferroni’s correction for multiple comparisons. (E) Venn diagram summarizes the classification of 67 clock-controlled genes (CCGs) as direct targets of NHR-23, let-7s, both, or neither based on original bioinformatic approaches and meta-analyses of published ChIP-seq (Gerstein et al., 2010), comparative microarray (Kouns et al., 2011), and ALG-1-iCLIP datasets (Broughton et al., 2016). Supplementary file 4 provides the detailed information used to classify each gene of interest. Relevant scoring rubrics are fully described in Results and Materials and methods. The flowchart beneath the Venn diagram shows examples of prospective components of the molting timer and effectors of specific subroutines of the molting cycle that emerged as dual targets from the meta-analysis.
Figure 8—figure supplement 1
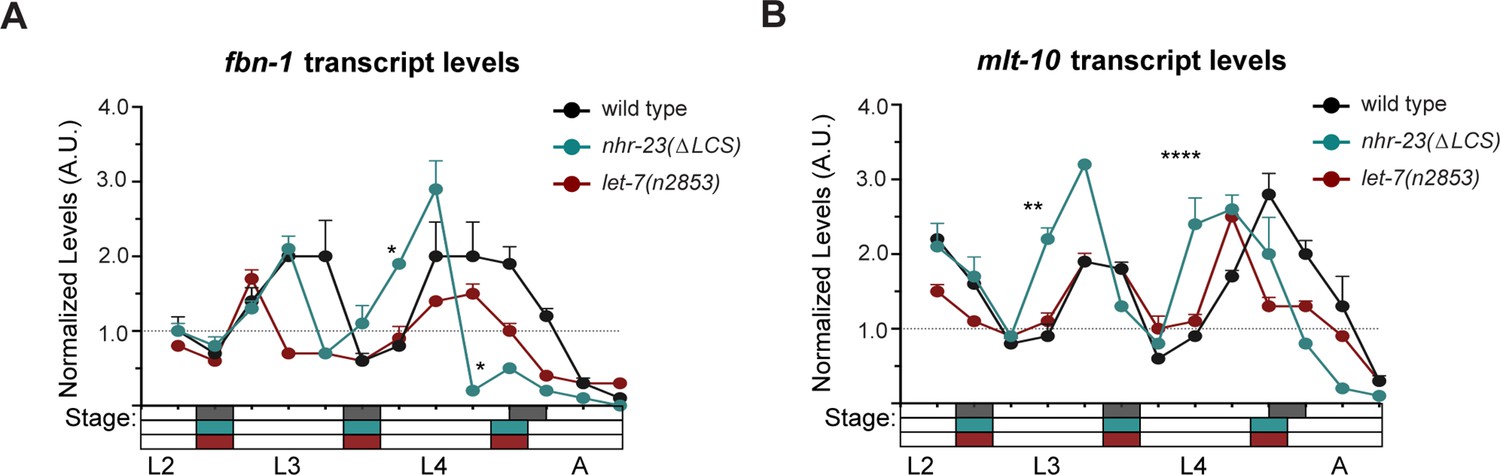
The genes fbn-1 and mlt-10 are shared targets of NHR-23 and let-7s.
(A) An independent replicate of the experiment described in Figure 8B. The values represent levels of fbn-1 transcripts, normalized to ama-1, detected in regular 2 h time samples of wild-type, nhr-23(∆LCS), and let-7(n2853) larvae and newly emerged adults. These particular samples were collected after hatchlings were cultivated on food for 24–50 h. (B) Same as A, except the levels of mlt-10 transcripts are shown; ****p ≤ 0.0001, **p ≤ 0.01, *p ≤ 0.05, two-way analysis of variance (ANOVA) with Bonferroni’s correction for multiple comparisons.
Figure 9 with 1 supplement

NHR-23 and let-7s govern the temporal expression profile of other key clock genes.
(A) ChIP-qPCR for NHR-23 enrichment at lin-42 and nhr-23 promoters in N2 (untagged NHR-23) or nhr-23::3xflag L3-stage larvae. Values represent the mean ± standard error of the mean (SEM) of three independent trials, each of which included two technical replicates. Values for the amplicon of interest in each sample was first normalized to the respective input and then the average values for QK159 [nhr-23::3xflag] were normalized to the average value of the amplicon in N2 within each trial. ****p ≤ 0.0001, **p ≤ 0.01, two-way analysis of variance (ANOVA) with Bonferroni’s correction for multiple comparisons. (B) Levels of lin-42 transcripts detected by TaqMan RT-qPCR in regular time samples of mock-treated and nhr-23(RNAi) animals collected from the late L2 through young adulthood, as described in Figure 8A. ***p ≤ 0.001, *p < 0.05, two-way ANOVA with Bonferroni’s correction for multiple comparisons. (C) Levels of lin-42 transcripts detected by TaqMan RT-qPCR in regular time samples of wild-type, nhr-23(∆LCS), and let-7(n2853) animals collected from late L2 through early adulthood, as described in Figure 8B. ****p ≤ 0.0001, ***p ≤ 0.001, two-way ANOVA with Bonferroni’s correction for multiple comparisons. (D) Schematic of the nhr-23 genomic locus (top) and the nhr-23::gfp fusion gene (bottom) that was used to determine the extent to which NHR-23 regulates the expression of itself. The region 2.5 kb upstream (light teal) of the start codon of nhr-23 isoform A, nhr-23 exons (dark teal), and the nhr-23 3′ UTR (light gray) are shown in the genomic locus. In the nhr-23::gfp::unc-54 reporter, the last two and half exons of nhr-23 were replaced by the coding sequence for gfp as shown. The nhr-23 3′ UTR was replaced by the unc-54 3′ UTR (dark gray). The ROREs are shown as red boxes. The dotted line represents the region targeted by nhr-23 RNAi clone. (E) Fluorescence and DIC micrographs show the signal from GFP detected in the lateral epidermis of mid-L4-stage animals that express the nhr-23∷gfp∷unc-54 reporter in the mock-treated control animal (left) and nhr-23(RNAi) animal (right). The arrow points to a seam cell nucleus and the arrow head points to a hyp7 nucleus. (F) Quantified signal intensities of the nhr-23∷gfp∷unc-54 reporter as in E. Each circle represents the average of three separate nuclei within the same worm, and error bars indicate the mean ± standard deviation (SD). Scale bar = 15 µm; exposure time = 25 ms. ****p ≤ 0.0001, ***p ≤ 0.001, one-way ANOVA with Bonferroni’s correction for multiple comparisons.
Figure 9—figure supplement 1

NHR-23 and let-7s govern the temporal expression profile of other key clock genes.
(A) (Top) Schematic showing the alignment of the major isoforms of lin-42. Purple rectangles depict coding sequences in the exons; gray rectangles depict UTRs in the exons; dotted line represents the putative promoter regions; brown rectangles depict ROREs; red lines (A, B) depict the position of the ChIP-qPCR amplicons from Figure 9A. (Bottom) NHR-23 ChIP-seq data captured in mid-L3s by the modENCODE Consortium (Celniker et al., 2009; Gerstein et al., 2010). Significant NHR-23 ChIP-seq enrichment indicated by beige shading with teal lines. Coordinates refer to reverse complement of C. elegans Chr II (NC_003280.10). (B) Schematic similar to A, except depicting isoforms of nhr-23 (top) and NHR-23 ChIP-seq enrichment at the nhr-23 locus (bottom). Coordinates refer to reverse complement of C. elegans Chr I (NC_003279.8) as indicated. (C) Levels of lin-42 transcripts detected by TaqMan RT-qPCR in regular time samples of wild-type, nhr-23(∆LCS) and let-7(n2853) animals collected from late L2 through early adulthood, as described in Figure 9C; ****p ≤ 0.0001, two-way analysis of variance (ANOVA) with Bonferroni’s correction for multiple comparisons. (D) Schematic depicting let-7 consensus sites (LCSs) (gold) in the 3′ UTR of C. elegans lin-42a/b and H. sapiens PER2. Gradients and bold labels distinguish sites with perfect complementarity to the seed sequence of the let-7s. Each 3′ UTR was retrieved from the UCSC genome browser and verified by comparison with curated expressed sequence tags (ESTs); and LCS-let-7 duplexes were examined using RNAhybrid.
Figure 10 with 1 supplement

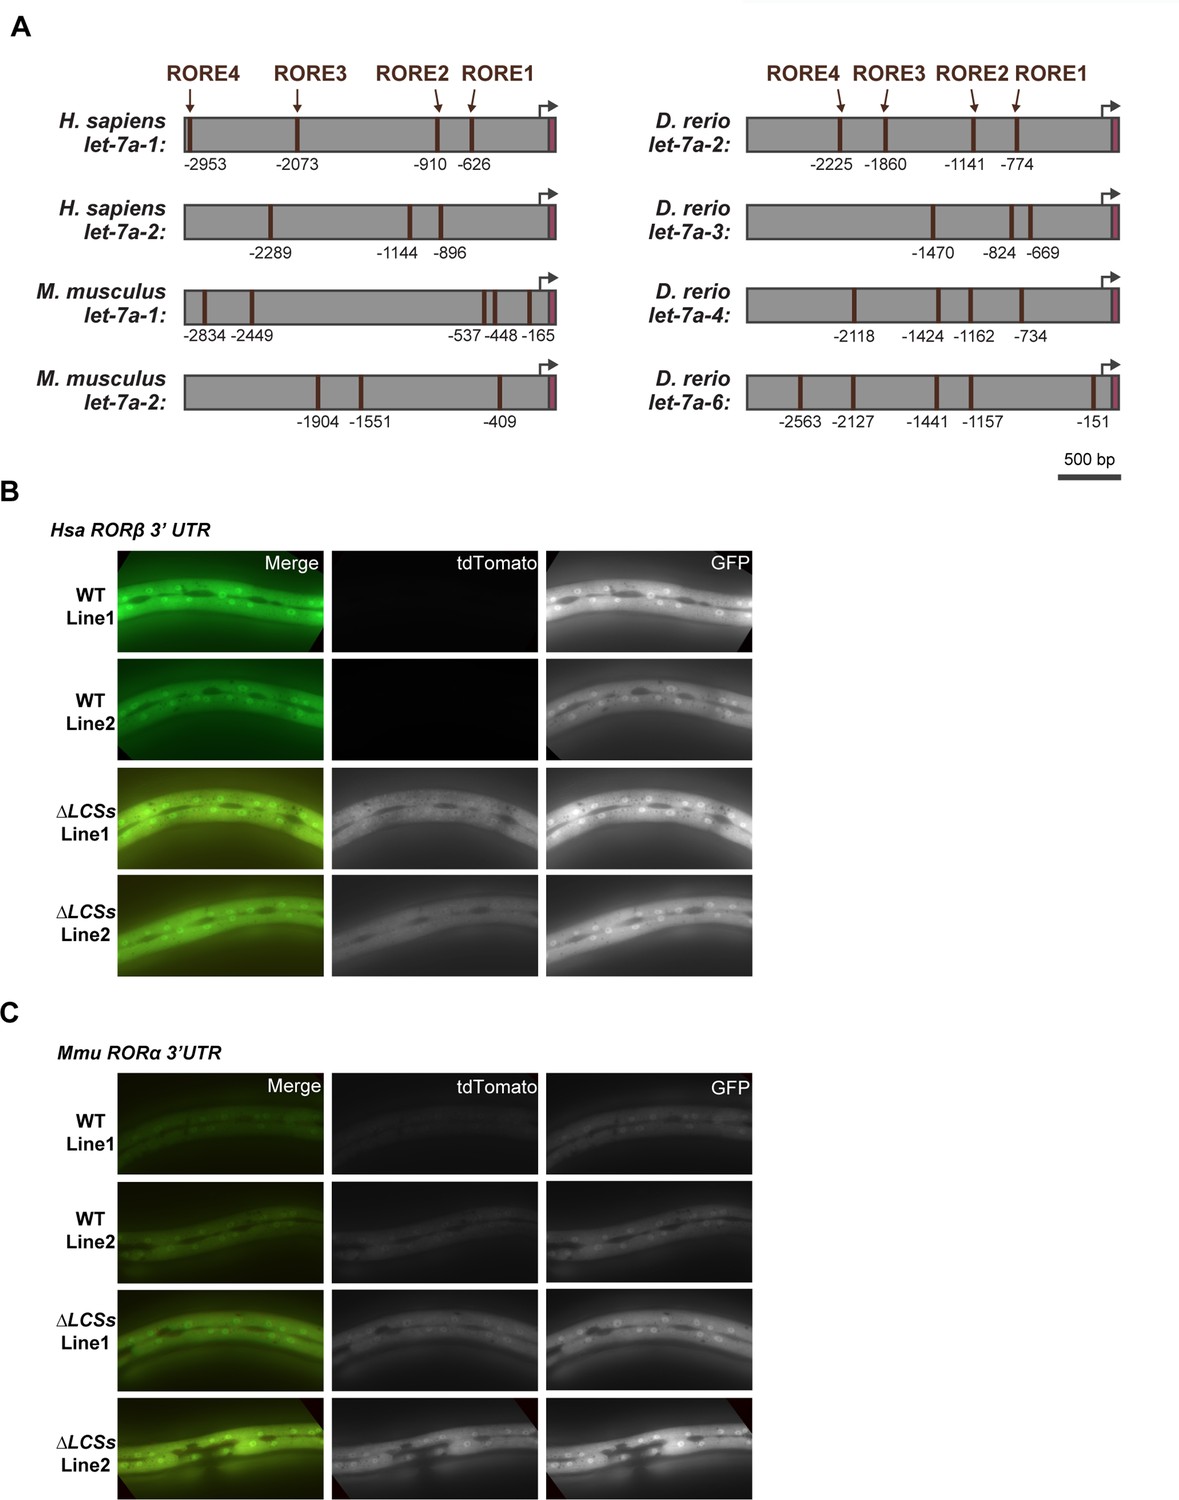
RORE and let-7 consensus site (LCS) elements may be conserved in mammalian let-7 and ROR genes, respectively.
(A) Each schematic depicts the 3-kb region upstream of selected homologs of let-7. ROREs identified upstream of mature let-7 (magenta) in the indicated species are shown. Black arrows indicate probable, but not experimentally verified, let-7 transcriptional start sites. (B, C) A transgenic C. elegans strain expressing a GFP reporter driven by a 3-kb fragment upstream of M. musculus let-7 was used to determine the extent to which C. elegans nhr-23 regulates the expression of M. musculus let-7. Fluorescence and DIC micrographs show expression of the GFP reporter in the pharynx (dotted rectangle) of mock-treated and nhr-23(RNAi) animals undergoing the L4-to-adult molt. Quantification of fluorescence intensity is shown in the graph in C. Each data point represents the mean of three region-of-interests or ROIs measured within the pharynx and error bars depict the mean ± standard deviation (SD) in measurements across the entire sample. The yellow asterisk represents the GFP signal in the neurons attributed to the ttx-3::gfp coinjection marker. Scale bar = 15 µm; exposure time = 200 ms. **p ≤ 0.01, one-way analysis of variance (ANOVA) with Bonferroni’s correction for multiple comparisons. (D) Predicted LCSs (gold) in the 3′ UTRs of four annotated homologs of nhr-23/ROR. The red hexagon depicts the stop codon. Gradients and bold labels distinguish sites with perfect complementarity to the seed sequence of let-7s. The dotted boxes indicate regions tested in E–H. Each 3′ UTR was retrieved from the UCSC genome browser and verified by comparison with curated ESTs; LCS-let-7 duplexes were also examined by RNAhybrid. Supplementary file 2 provides additional information about the prospective duplexes between each of these LCSs and let-7. Accession numbers for the related ESTs and genomic sequences are included in the Key Resources Table. (E–H) Representative images and quantitation of the ratiometric signal of tdTomato/GFP from bicistronic 3′ UTR reporters (as in Figure 5B) of H. sapiens RORβ and M. musculus RORα 3′ UTRs and variants thereof that lack the LCSs. Each data point in F and H represents the average value of three ROIs per worm. N indicates the total sample size from two independent experiments. Bars signify the mean ± SD for the sample. ****p ≤ 0.0001, ordinary one-way ANOVA with Bonferroni’s correction for multiple comparisons. Representative images from multiple independent isolates are shown in Figure 10—figure supplement 1.
Figure 10—figure supplement 1
Reciprocal regulatory elements may be conserved in mammalian RORs and let-7.
A) The 3-kb region upstream of selected homologs of let-7. Brown boxes label ROREs, magenta labels mature let-7. ROREs are numbered relative to the first nucleotide of the mature microRNA. Black arrows denote probable, but not experimentally verified, transcriptional start sites of the microRNAs. Similar to Figure 10E, G, representative images show the tdTomato and GFP reporter signals associated with fragments of the 3′ UTRs of (B) H. sapiens RORβ and (C) M. musculus RORα and variants thereof that lack both LCSs indicated in Figure 10D.
Figure 11
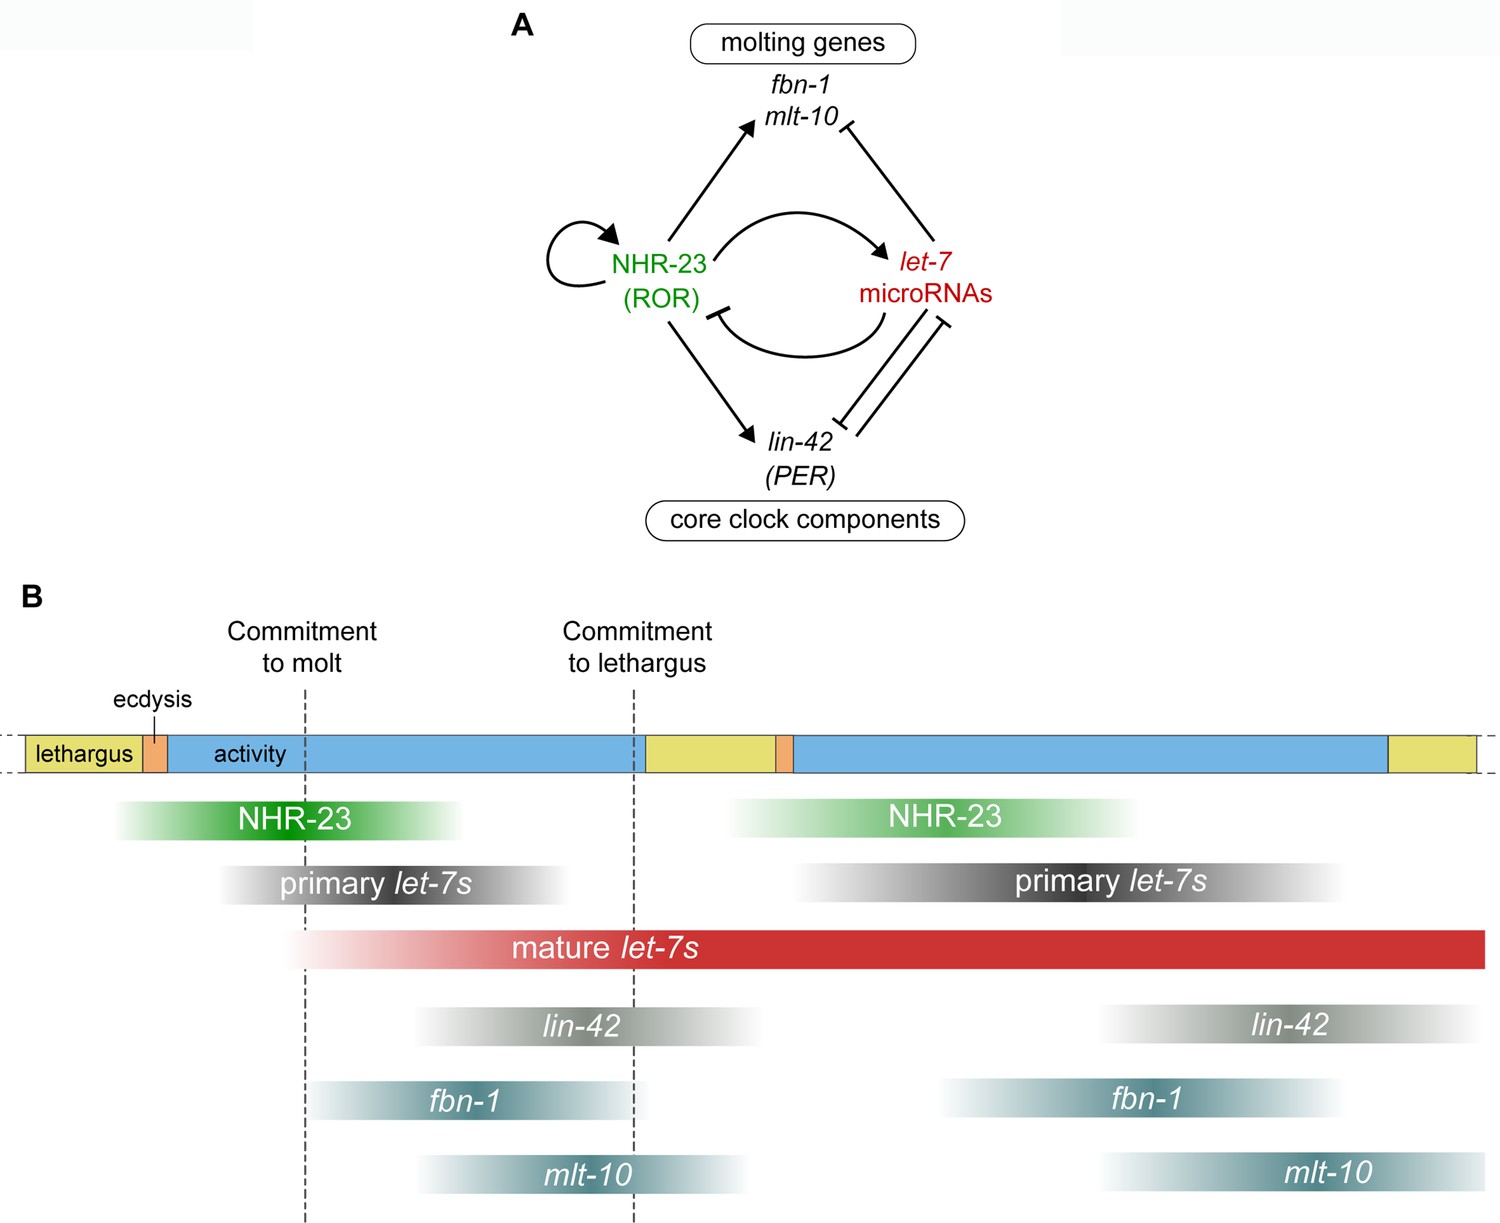
Negative feedback between NHR-23 and let-7s regulates the gene expression dynamics of core clock components and molting genes, and thus unites the molting timer with unidirectional transitions in the life cycle of C. elegans.
(A) Genetic pathways investigated in this study. NHR-23 promotes transcription of let-7s and let-7s, in turn, inhibit the accumulation of nhr-23 transcripts, setting up a negative feedback loop. NHR-23 can autoregulate the transcription of its own gene product. NHR-23 and let-7 together regulate levels of core clock component, lin-42 and molting genes, mlt-10 and fbn-1. Arrowheads depict positive regulation and bars indicate negative regulation. (B) Schematic summarizing the expression profiles and relative timing of NHR-23, primary let-7s, mature let-7s and clock-controlled genes (CCGs), investigated in this study, over two molts. The top bar depicts progression of the molting cycle, as color coded in Figure 1. Gradient shading in green depicts the rise and fall of NHR-23 protein levels during each larval stage. Similar gradients shaded in dark gray and red depict the levels of primary let-7s and mature let-7s, respectively. Lighter gradients in shades of gray depict the levels of lin-42, fbn-1, and mlt-10. Dampening of NHR-23 oscillations during the second cycle relative to the first cycle has been indicated. The timepoints at which the depicted gene products rise and fall were estimated based on findings of this report and other experimental evidence (Hendriks et al., 2014; Kim et al., 2013).
Author response image 1

RT-qPCR of pri-let-7 and nhr-23 measured in the same experiment in wild type animals indicates that nhr-23 expression peaks before pri-let-7.
Tables
Appendix 1—key resources table
| Reagent type (species) or resource | Designation | Source or reference | Identifiers | Additional information |
|---|---|---|---|---|
| Gene (Caenorhabditis elegans) | nhr-23 | WormBaseWS272 | nhr-23; C01H6.5 | |
| Gene (C. elegans) | let-7 | WormBaseWS272 | let-7; C05G5.6 | |
| Gene (C. elegans) | lin-42 | WormBaseWS272 | lin-42; F47F6.1 | |
| Gene (C. elegans) | mir-84 | WormBaseWS272 | mir-84; B0395.4 | |
| Gene (C. elegans) | mir-48 | WormBaseWS272 | mir-48; F56A12.3 | |
| Gene (C. elegans) | mir-241 | WormBaseWS272 | mir-241; F56A12.4 | |
| Gene (C. elegans) | col-19 | WormBaseWS272 | col-19; ZK1193.1 | |
| Gene (C. elegans) | unc-54 | WormBaseWS272 | unc-54; F11C3.3 | |
| Gene (C. elegans) | lin-41 | WormBaseWS272 | lin-41; C12C8.3 | |
| Gene (C. elegans) | mlt-10 | WormBaseWS272 | mlt-10; C09E8.3 | |
| Gene (C. briggsae) | nhr-23 | WormBase ParaSite WBPS9 | nhr-23; WBGene00040598 | |
| Gene (D. melanogaster) | HR3 | Aug. 2014 (BDGP Release 6+ISO1 MT/dm6) | NM_001259307.3 | Coordinates - chr2: 10,203,995–10,227,957 GenBank Accession EC058128, C0278043, EC080062, AY094723 |
| Gene (X. tropicalis) | RORA | Jul. 2016 (Xenopus_tropicalis_v9.1/xenTro9) | NM_001079195.1 | Coordinates - chr3: 83,889,614–83,948,330 GenBank mRNAs BC123953 |
| Gene (D. rerio) | mirlet7a-1 | Sep. 2014 (GRCz10/danRer10) | NR_029976.1 | |
| Gene (D. rerio) | mirlet7a-2 | Sep. 2014 (GRCz10/danRer10) | NR_029977.1 | |
| Gene (D. rerio) | mirlet7a-3 | Sep. 2014 (GRCz10/danRer10) | NR_029978.1 | |
| Gene (D. rerio) | mirlet7a-4 | Sep. 2014 (GRCz10/danRer10) | NR_029979.1 | |
| Gene (D. rerio) | mirlet7a-5 | Sep. 2014 (GRCz10/danRer10) | NR_039088.1 | |
| Gene (D. rerio) | mirlet7a-6 | Sep. 2014 (GRCz10/danRer10) | NR_029981.1 | |
| Gene (D. rerio) | RORAB | Sep. 2014 (GRCz10/danRer10) | NM_201067.1 | Coordinates - chr7: 29,267,488–29,300,423 GenBank Accession BC051158 |
| Gene (D. rerio) | RORB | Sep. 2014 (GRCz10/danRer10) | NM_001082856.1 | Coordinates - chr5: 24,761,303–24,776,994 GenBank Accession CK396220, CK679114, EB861010, B092168, EF107093 |
| Gene (D. rerio) | RORC | Sep. 2014 (GRCz10/danRer10) | NM_001082819.1 | Coordinates - chr8: 18,851,532–18,862,800 GenBank Accession EB954643, CA472317, CN51179, CN511196, EB893435, EF107094 |
| Gene (G. gallus) | RORA | Nov. 2011(ICGSC Gallus_gallus-4.0/galGal4) | NM_001289887.1 | Coordinates - chr10: 4,187,635–4,536,712 GenBank Accession BU453250, BU298761 |
| Gene (G. gallus) | RORB | Nov. 2011(ICGSC Gallus_gallus-4.0/galGal4) | NM_205093.1 | Coordinates - chrZ: 36,402,033–36,535,271 GenBank Accession Y08638 |
| Gene (M. musculus) | Mirlet7a-1 | Dec. 2011(GRCm38/mm10) | NR_029725.1 | |
| Gene (M. musculus) | Mirlet7a-2 | Dec. 2011(GRCm38/mm10) | NR_029726.1 | |
| Gene (M. musculus) | RORA | Dec. 2011(GRCm38/mm10) | NM_013646 | Coordinates - chr9: 68,653,786–69,388,246 GenBank Accession AK043990, AK035351, AK087905, AK163917 |
| Gene (M. musculus) | RORB | Dec. 2011(GRCm38/mm10) | NM_146095 | Coordinates - chr19: 18,930,605–19,111,196 GenBank Accession AK159011, BC058269 |
| Gene (M. musculus) | RORC | Dec. 2011(GRCm38/mm10) | NM_011281 | Coordinates - chr3: 94,377,432–94,398,276 GenBank Accesion AJ132394 |
| Gene (H. sapiens) | MIRLET7A1 | Dec. 2013 (GRCh38/hg38) | NR_029476.1 | |
| Gene (H. sapiens) | MIRLET7A2 | Dec. 2013 (GRCh38/hg38) | NR_029477.1 | |
| Gene (H. sapiens) | MIRLET7A3 | Dec. 2013 (GRCh38/hg38) | NR_029478.1 | |
| Gene (H. sapiens) | RORA | Dec. 2013 (GRCh38/hg38) | NM_134261 | Coordinates - chr15: 60,488,284–61,229,302 GenBank Accesion AL832164, AK055969, BC008831 |
| Gene (H. sapiens) | RORB | Dec. 2013 (GRCh38/hg38) | NM_006914 | Coordinates - chr9: 74,497,335–74,693,177 GenBank Accesion BX647070, AK125162 |
| Gene (H. sapiens) | RORC | Dec. 2013 (GRCh38/hg38) | NM_005060.3 | Coordinates - chr1: 151,806,071–151,831,802 GenBank Accession - AL834219 |
| Gene (H. sapiens) | PER2 | Dec. 2013 (GRCh38/hg38) | NM_022817.3 | Coordinates - chr2: 238,244,044–238,288,610 GenBank Accession - AB002345 |
| Strain (E. coli) | OP50-1 | Caenorhabditis Genetics Center (CGC) | E. coli OP50-1 | |
| Strain (E. coli) | HB101 | Caenorhabditis Genetics Center (CGC) | E. coli HB101 | |
| Strain (E. coli) | DH5α | New England Biolabs | E. coli DH5α | |
| Strain (E. coli) | vector only' bacteria; control for feeding RNAi | Julie Ahringer; PMID: 12529635 | E. coli HT115(DE3)+pPD129.36 | |
| Strain (E. coli) | bacteria expressing nhr-23 dsRNAs | Julie Ahringer; PMID: 12529635 | E. coli HT115(DE3)+pPD129.36 with nhr-23 insert | |
| Strain (C. elegans) | wild type; N2 | CGC | N2 | wild type (Bristol) |
| Genetic reagent (C. elegans) | let-7(n2853) | CGC | MT7626 | let-7(n2853) X not out-crossed |
| Genetic reagent (C. elegans) | mir-48(∆) mir-241(∆); mir-84(n4037); let-7s triple knockout | CGC | VT1066 | nDf51 V; mir-84(n4037) X. Used in Figure 6—figure supplement 1B, Supplementary file 1. |
| Genetic reagent (C. elegans) | wgIs43[nhr-23++]; high-copy or increased dosage of nhr-23 | CGC | OP43 | unc-119(ed3) III; wgIs43[nhr-23::TY1::EGFP::3xFLAG(92 C12)+unc 119(+)]. Used in Figure 6—figure supplement 2A,B,C |
| Genetic reagent (C. elegans) | mgIs49; mlt-10 transcriptional reporter strain | Frand Lab; PMID: 16122351 | GR1395 | mgIs49[mlt-10p::gfp-pest ttx-3p::gfp] IV. Used in Supplementary file 1 |
| Genetic reagent (C. elegans) | let-7(mg279); partial loss-of-function let-7 mutation | Frand Lab; PMID: 17065234 | GR1436 | mgIs49[mlt-10p::gfp-pest ttx-3p::gfp] IV; let-7(mg279) X. Used in Supplementary file 1 |
| Genetic reagent (C. elegans) | let-7(mg279) mir-84(tm1304) | Frand Lab; PMID: 17065234 | ARF249 | mgIs49[mlt-10p::gfp-pest ttx-3p::gfp] IV; let-7(mg279) mir-84(tm1304) X. Used in Supplementary file 1 |
| Genetic reagent (C. elegans) | let-7p::nls-GFP; transcriptional reporter for let-7 | Amy Pasquinelli; PMID: 23201578 | PQ462 | apIs[let-7bp::NLS::gfp::let-858 3'UTR unc-119(+)] II; unc-119(ed9) III. Used in Figure 3—figure supplement 2A,B |
| Genetic reagent (C. elegans) | let-7(n2853); strong loss-of-function let-7 mutation | Kim Lab | QK059 | let-7(n2853) X out-crossed 3 x. Used in Figure 2B,C, Figure 6A, Figure 8B,D, Figure 9C, Figure 6—figure supplement 1A, Figure 8—figure supplement 1A, B, Figure 9—figure supplement 1C, Supplementary file 1 |
| Genetic reagent (C. elegans) | nhr-23::GFP partial translational reporter strain | Marta Kostrouchova; PMID: 9521900 | ||
| Genetic reagent (C. elegans) | nhr-23(aaa20) CRISPR allele - initial isolate | This report | ARF413 | nhr-23(aaa20) I not out-crossed. See "Editing the C. elegans Genome" in Materials and Methods. |
| Genetic reagent (C. elegans) | nhr-23(aaa20); nhr-23 3'UTR(ΔLCS) mutant strain | This report | ARF414 | nhr-23(aaa20) I out-crossed 3 x. See "Editing the C. elegans Genome" in Materials and Methods. Used in Figures 6A,B,C—9, Figure 6—figure supplement 1A, Figure 8—figure supplement 1A,B, Figure 9—figure supplement 1C, Supplementary file 1 |
| Genetic reagent (C. elegans) | nhr-23::3xflag; nhr-23(xk22) | This report | QK159 | nhr-23(xk22) I out-crossed 5 x. See "Editing the C. elegans Genome" in Materials and Methods. Used in Figure 3C,B, Figure 4B, Figure 9A, Figure 3—figure supplement 1C,D, Figure 4—figure supplement 1. |
| Genetic reagent (C. elegans) | aaaEx97; unc-54 3'UTR reporter strain; negative control for bicistronic reporter system | This report | ARF370 | aaaEx97[dpy-7p::tdtomato::unc-54 3'UTR::SL2::gfp::unc-54 3'UTR +ttx-3::gfp] See "Construction of Fusion Genes and Transgenic Strains" in Materials and Methods. Used in Figure 5C,D |
| Genetic reagent (C. elegans) | aaaEx129; nhr-23 3'UTR reporter strain | This report | ARF372 | aaaEx129[dpy-7p::tdtomato::nhr-23 3'UTR::SL2::gfp::unc-54 3'UTR +ttx-3::gfp]. See "Construction of Fusion Genes and Transgenic Strains" in Materials and Methods. Used in Figure 5C,D,E |
| Genetic reagent (C. elegans) | aaaEx146; lin-41 3'UTR reporter strain; positive control for bicistronic reporter system | This report | ARF399 | aaaEx146[dpy-7p::tdtomato::lin-41 3'UTR::SL2::gfp::unc-54 3'UTR +ttx-3::gfp]. See "Construction of Fusion Genes and Transgenic Strains" in Materials and Methods. Used in Figure 5C,D |
| Genetic reagent (C. elegans) | aaaEx131; nhr-23 3'UTR(ΔLCS) reporter strain | This report | ARF374 | aaaEx131[dpy-7p::tdtomato::nhr-23 3'UTR(ΔLCS)::SL2::gfp::unc-54 3'UTR +ttx-3::gfp]. See "Construction of Fusion Genes and Transgenic Strains" in Materials and Methods. Used in Figure 5C,E |
| Genetic reagent (C. elegans) | aaaEx165; nhr-233'UTR(Δ623–646) reporter strain | This report | ARF400 | aaaEx165[dpy-7p::tdtomato::nhr-23 3'UTR(Δ623–646)::SL2::gfp::unc-54 3'UTR +ttx-3::gfp]. See "Construction of Fusion Genes and Transgenic Strains" in Materials and Methods. Used in Figure 5E |
| Genetic reagent (C. elegans) | aaaEx166; nhr-233'UTR(Δ227–249) reporter strain | This report | ARF401 | aaaEx166[dpy-7p::tdtomato::nhr-23 3'UTR(Δ227–249)::SL2::gfp::unc-54 3'UTR ttx-3::gfp]. See "Construction of Fusion Genes and Transgenic Strains" in Materials and Methods. Used in Figure 5E |
| Genetic reagent (C. elegans) | aaaEx130; nhr-23 3'UTR(Δ26–42) reporter strain | This report | ARF373 | aaaEx130[dpy-7p::tdtomato::nhr-23 3'UTR(Δ26–42)::SL2::gfp::unc-54 3'UTR ttx-3::gfp]. See "Construction of Fusion Genes and Transgenic Strains" in Materials and Methods. Used in Figure 5E. |
| Genetic reagent (C. elegans) | wgIs43; let-7(mg279) mir-84(tm1304) | This report | ARF422 | wgIs43[nhr 23::TY1::EGFP::3xFLAG(92 C12)+unc 119(+)]; let-7(mg279) mir-84(tm1304) X. See "Construction of Fusion Genes and Transgenic Strains" in Materials and Methods. Used in Figure 6—figure supplement 2C |
| Genetic reagent (C. elegans) | aaaEx180, mouse let-7p::gfp transcriptional reporter | This report | ARF431 | aaaEx180[Mmu-let-7a-1p::gfp ttx-3::gfp]. See "Construction of Fusion Genes and Transgenic Strains" in Materials and Methods. Used in Figure 10B, C |
| Genetic reagent (C. elegans) | aaaEx172; Hs. RORB 3'UTR reporter - line 1 | This report | ARF423 (RA101) | aaaEx172[dpy-7p::tdtomato::Hs. RORB 3'UTR::SL2::gfp::unc-54 3'UTR +ttx-3::gfp]. See "Construction of Fusion Genes and Transgenic Strains" in Materials and Methods. Used in Figure 10E,F, Figure 10—figure supplement 1B |
| Genetic reagent (C. elegans) | aaaEx173, Hs. RORB 3'UTR reporter - line 2 | This report | ARF424 (RA102) | aaaEx173[dpy-7p::tdtomato::Hs. RORB 3'UTR::SL2::gfp::unc-54 3'UTR +ttx-3::gfp].See "Construction of Fusion Genes and Transgenic Strains" in Materials and Methods. Used in Figure 10F, Figure 10—figure supplement 1B |
| Genetic reagent (C. elegans) | aaaEx174; Hs. RORB 3'UTR(ΔLCS) reporter strain - line 1 | This report | ARF425 (RA106) | aaaEx174[dpy-7p::tdtomato::Hs. RORB 3'UTR(ΔLCS)::SL2::gfp::unc-54+3'UTR; ttx-3::gfp]. See "Construction of Fusion Genes and Transgenic Strains" in Materials and Methods. Used in Figure 10E, F, Figure 10—figure supplement 1B |
| Genetic reagent (C. elegans) | aaaEx175; Hs. RORB 3'UTR reporter strain - line 2 | This report | ARF426 (RA107) | aaaEx175[dpy-7p::tdtomato::Hs. RORB 3'UTR(ΔLCS)::SL2::gfp::unc-54 3'UTR +ttx-3::gfp]. See "Construction of Fusion Genes and Transgenic Strains" in Materials and Methods. Used in Figure 10F, Figure 10—figure supplement 1C |
| Genetic reagent (C. elegans) | aaaEx176; Ms. RORA 3'UTR reporter strain - line 1 | This report | ARF427 (RA104) | aaaEx176[dpy-7p::tdtomato::Ms. RORA 3'UTR::SL2::gfp::unc-54 3'UTR +ttx-3::gfp]. See "Construction of Fusion Genes and Transgenic Strains" in Materials and Methods. Used in Figure 10H, Figure 10—figure supplement 1C |
| Genetic reagent (C. elegans) | aaaEx177; Ms. RORA 3'UTR reporter strain - line 2 | This report | ARF428 (RA105) | aaaEx177[dpy-7p::tdtomato::Ms. RORA 3'UTR::SL2::gfp::unc-54 3'UTR +ttx-3::gfp]. See "Construction of Fusion Genes and Transgenic Strains" in Materials and Methods. Used in Figure 10G,H, Figure 10—figure supplement 1C |
| Genetic reagent (C. elegans) | aaaEx178; Ms. RORA 3'UTR(ΔLCS) reporter strain - line 1 | This report | ARF429 (RA109) | aaaEx178[dpy-7p::tdtomato::Ms. RORA 3'UTR(ΔLCS)::SL2::gfp::unc-54 3'UTR +ttx-3::gfp]. See "Construction of Fusion Genes and Transgenic Strains" in Materials and Methods. Used in Figure 10G, H, Figure 10—figure supplement 1C |
| Genetic reagent (C. elegans) | aaaEx179; Ms. RORA 3'UTR(ΔLCS) reporter strain - line 2 | This report | ARF430 (RA110) | aaaEx179[dpy-7p::tdtomato::Ms. RORA 3'UTR(ΔLCS)::SL2::gfp::unc-54 3'UTR +ttx-3::gfp]. See "Construction of Fusion Genes and Transgenic Strains" in Materials and Methods. Used in Figure 10H, Figure 10—figure supplement 1C |
| Genetic reagent (C. elegans) | aaaEx181; NHR-23::GFP strain | This report | ARF432 | aaaEx181[nhr-23p::nhr-23::gfp::unc-54 3'UTR +ttx-3::gfp]. See "Construction of Fusion Genes and Transgenic Strains" in Materials and Methods. Used in Figure 9D,E,F |
| Genetic reagent (C. elegans) | let-7(scRORE1, scRORE3) CRISPR allele; let-7(xk39) | This report | QK198 | let-7(xk39)X outcrossed 3 x. See Materials and Methods: Editing the C. elegans genome. Used in Figure 4C,D,F |
| Genetic reagent (C. elegans) | let-7(scRORE1, scRORE3) CRISPR allele; let-7(xk42) | This report | QK199 | let-7(xk42)X outcrossed 3 x. See Materials and Methods: Editing the C. elegans genome. Used in Figure 4F |
| Genetic reagent (C. elegans) | let-7(scRORE1, scRORE2) CRISPR allele; let-7(xk41) | This report | QK201 | let-7(xk41) X out-crossed 3 x. See Materials and Methods: Editing the C. elegans genome. Used in Figure 4C,D,F |
| Genetic reagent (C. elegans) | let-7(scRORE1, scRORE2) CRISPR allele; let-7(xk43) | This report | QK202 | let-7(xk43)X out-crossed 3 x. See Materials and Methods: Editing the C. elegans genome. Used in Figure 4F |
| Genetic reagent (C. elegans) | let-7(scRORE1, scRORE2) CRISPR allele; let-7(xk44) | This report | QK203 | let-7(xk44) X out-crossed 3 x. See Materials and Methods: Editing the C. elegans genome. Used in Figure 4F |
| Genetic reagent (C. elegans) | wIs54(scm::GFP); let-7(scRORE1, scRORE3) CRISPR allele; let-7(xk39) | This report | QK204 | wIs54(scm::GFP); let-7(xk39) X. Used in Figure 4E |
| Genetic reagent (C. elegans) | wIs54(scm::GFP); let-7(scRORE1, scRORE3) CRISPR allele; let-7(xk42) | This report | QK205 | wIs54(scm::GFP); let-7(xk42) X. Used in Figure 4E |
| Genetic reagent (C. elegans) | wIs54(scm::GFP); let-7(mg279) | This report | QK206 | wIs54(scm::GFP); let-7(mg279) X. Used in Figure 4E |
| Genetic reagent (C. elegans) | wIs54(scm::GFP); let-7(scRORE1, scRORE2) CRISPR allele; let-7(xk41) | This report | QK208 | wIs54(scm::GFP); let-7(xk41) X. Used in Figure 4E |
| Genetic reagent (C. elegans) | wIs54(scm::GFP); let-7(scRORE1, scRORE2); let-7(xk43) | This report | QK209 | wIs54(scm::GFP); let-7(xk43)X. Used in Figure 4E |
| Genetic reagent (C. elegans) | wIs54(scm::GFP); let-7(scRORE1, scRORE2) CRISPR allele; let-7(xk44) | This report | QK210 | wIs54(scm::GFP); let-7(xk44) X. Used in Figure 4E |
| Genetic reagent (C. elegans) | wIs54(scm::GFP); let-7(n2853) | This report | QK036 | wIs54(scm::GFP); let-7(n2853) X. Used in Figure 4E |
| Genetic reagent (C. elegans) | nhr-23(xk22); let-7(scRORE1, scRORE3) CRISPR allele; let-7(xk39) | This report | QK211 | nhr-23(xk22)I; let-7(xk39) X. Used in Figure 4C, Figure 4—figure supplement 1 |
| Genetic reagent (C. elegans) | nhr-23(xk22); let-7(scRORE1, scRORE2) CRISPR allele; let-7(xk41) | This report | QK212 | nhr-23(xk22) I; let-7(xk41) X. Used in Figure 4C, Figure 4—figure supplement 1 |
| Recombinant DNA reagent | unc-54 3'UTR reporter; negative control for bicistronic fusion genes | This report | pHR011 | dpy-7p::tdtomato::unc-54 3'UTR::SL2::gfp::unc-54 3'UTR. See "Construction of Fusion Genes and Transgenic Strains" in Methods. |
| Recombinant DNA reagent | nhr-23 3'UTR bicistronic reporter construct | This report | pHR017 | dpy-7p::tdtomato::nhr-23 3'UTR::SL2::gfp::unc-54 3'UTR. See "Construction of Fusion Genes and Transgenic Strains" in Methods. |
| Recombinant DNA reagent | lin-41 3'UTR reporter; positive control for bicistronic fusion genes | This report | pHR023 | dpy-7p::tdtomato::lin-41 3'UTR::SL2::gfp::unc-54 3'UTR. See "Construction of Fusion Genes and Transgenic Strains" in Methods. |
| Recombinant DNA reagent | nhr-23 3'UTR(ΔLCS) bicistronic reporter construct | This report | pHR021 | dpy-7p::tdtomato::nhr-23 3'UTRΔLCS::SL2::gfp::unc-54 3'UTR. See section titled "Construction of Fusion Genes and Transgenic Strains" in Methods. |
| Recombinant DNA reagent | nhr-23 3'UTR(Δ623–646) bicistronic reporter construct | This report | pHR022 | dpy-7p::tdtomato::nhr-23 3'UTRΔ623–646::SL2::gfp::unc-54 3'UTR. See section titled "Construction of Fusion Genes and Transgenic Strains" in Methods. |
| Recombinant DNA reagent | nhr-23 3'UTR(Δ227–249) bicistronic reporter construct | This report | pHR026 | dpy-7p::tdtomato::nhr-23 3'UTRΔ227–249::SL2::gfp::unc-54 3'UTR. See section titled "Construction of Fusion Genes and Transgenic Strains" in Methods. |
| Recombinant DNA reagent | nhr-23 3'UTR(Δ26–42) bicistronic reporter construct | This report | pHR020 | dpy-7p::tdtomato::nhr-23 3'UTRΔ26–42::SL2::gfp::unc-54 3'UTR. See section titled "Construction of Fusion Genes and Transgenic Strains" in Methods. |
| Recombinant DNA reagent | mouse let-7 promoter fused to GFP | This report | pRA46 | aaaEx180[Mmu-let-7a-1p::gfp ttx-3::gfp]. See section titled "Construction of Fusion Genes and Transgenic Strains" in Methods. |
| Recombinant DNA reagent | Mm.RORA 3'UTR bicistronic reporter construct | This report | pRA41 | dpy-7p::tdtomato::Mm RORA 3'UTR::SL2::gfp::unc-54 3'UTR. See section titled "Construction of Fusion Genes and Transgenic Strains" in Methods. |
| Recombinant DNA reagent | Mm. RORA 3'UTR(ΔLCS) bicistronic reporter construct | This report | pRA43 | dpy-7p::tdtomato::Mm RORA 3'UTRΔLCS::SL2::gfp::unc-54 3'UTR. See section titled "Construction of Fusion Genes and Transgenic Strains" in Methods. |
| Recombinant DNA reagent | Hs. RORB 3'UTR bicistronic reporter construct | This report | pRA38 | dpy-7p::tdtomato::Hs RORB 3'UTR::SL2::gfp::unc-54 3'UTR. See section titled "Construction of Fusion Genes and Transgenic Strains" in Methods. |
| Recombinant DNA reagent | Hs. RORB 3'UTR(ΔLCS) bicistronic reporter construct | This report | pRA40 | dpy-7p::tdtomato::Hs RORB 3'UTRΔLCS::SL2::gfp::unc-54 3'UTR. See section titled "Construction of Fusion Genes and Transgenic Strains" in Methods. |
| Recombinant DNA reagent | nhr-23::GFP partial translational reporter | Kostrouchova et al., 1998 | plasmid 4271 | nhr-23p::nhr-23::gfp::unc-543'UTR |
| Antibody | Monoclonal Anti-Flag M2 antibody | Sigma-Aldrich | F3165 | |
| Peptide, recombinant protein | CAS9 protein | PNA Bio | CP01 | |
| Peptide, recombinant protein | 1 x HALT Protease and Phosphatase Inhibitor | ThermoFisher Scientific | 78443 | |
| Peptide, recombinant protein | Proteinase K | ThermoFisher Scientific | 25530015 | |
| Peptide, recombinant protein | RNase A | ThermoFisher Scientific | 12091021 | |
| Peptide, recombinant protein | RNAsin Plus RNase inhibitor, 1 U/µL | Promega | N2611 | |
| Peptide, recombinant protein | Transcriptor Reverse Transcriptase, 0.5 U/µL | Roche | 3531295001 | |
| Peptide, recombinant protein | KpnI-HF | New England Biolabs | R3142S | |
| Peptide, recombinant protein | NotI-HF | New England Biolabs | R3189S | |
| Commercial assay or kit | Gibson DNA Assembly Kit | New England Biolabs | E5510S | |
| Commercial assay or kit | TOPO TA Cloning Kit | ThermoFisher Scientific | 450641 | |
| Commercial assay or kit | Phusion High-Fidelity DNA Polymerase | New England Biolabs | M0530S | |
| Commercial assay or kit | Q5 Site-Directed Mutagenesis Kit | New England Biolabs | E0554S | |
| Commercial assay or kit | TURBO DNase Kit | ThermoFisher Scientific | AM1907 | |
| Commercial assay or kit | High-Capacity cDNA Reverse Transcription Kit | ThermoFisher Scientific | 4368814 | |
| Commercial assay or kit | SuperScript III Reverse Transcriptase | Invitrogen | 18080044 | |
| Commercial assay or kit | TaqMan Universal PCR Master Mix, no AmpErase UNG | ThermoFisher Scientific | 4364341 | |
| Commercial assay or kit | TaqMan assay for lin-42 | ThermoFisher Scientific | CE02593603_M1 | |
| Commercial assay or kit | TaqMan assay for nhr-23 | ThermoFisher Scientific | CE02405513_G1 | |
| Commercial assay or kit | TaqMan assay for mlt-10 | ThermoFisher Scientific | CE02426995_M1 | |
| Commercial assay or kit | TaqMan assay for fbn-1 | ThermoFisher Scientific | CE02449109_G1 | |
| Commercial assay or kit | TaqMan assay for ama-1 | ThermoFisher Scientific | CE02462732_G1 | |
| Commercial assay or kit | TaqMan assay for primary let-7 | ThermoFisher Scientific | AJ1RUH0 | |
| Commercial assay or kit | TaqMan assay for primary mir-84 | ThermoFisher Scientific | AJ5IO2R | |
| Commercial assay or kit | TaqMan assay for primary mir-48 | ThermoFisher Scientific | AJ205NW | |
| Commercial assay or kit | TaqMan assay for primary mir-241 | ThermoFisher Scientific | AJ39QT4 | |
| Commercial assay or kit | TaqMan assay for mature let-7 | ThermoFisher Scientific | 377 | |
| Commercial assay or kit | TaqMan assay for mature mir-84 | ThermoFisher Scientific | 236 | |
| Commercial assay or kit | TaqMan assay for mature mir-48 | ThermoFisher Scientific | 208 | |
| Commercial assay or kit | TaqMan assay for mature mir-241 | ThermoFisher Scientific | 249 | |
| Commercial assay or kit | TaqMan assay for U18 | ThermoFisher Scientific | 1764 | |
| Chemical compound | Isopropyl β-D-1-thiogalactopyranoside (IPTG) | Laguna Scientific | 6055–5 | |
| Chemical compound | TRIzol | ThermoFisher Scientific | 15596026 | |
| Chemical compound | Chloroform: Isoamyl alcohol (24:1) | OmniPur | 3160–450 ML | |
| Chemical compound | Acid Phenol: Chloroform (5:1) | ThermoFisher Scientific | AM9720 | |
| Chemical compound | Isopropanol, 100% | Sigma-Aldrich | I9516 | |
| Chemical compound | GlycoBlue | Sigma-Aldrich | AM9515 | |
| Chemical compound | Random primers, 25 ng/µL | Promega | C1181 | |
| Chemical compound | dNTPs, 1 mM | New England Biolabs | N0446S | |
| Chemical compound | Novex Tris- Glycine SDS Sample Buffer | ThermoFisher Scientific | LC2676 | |
| Chemical compound | Absolute Blue SYBR Green | ThermoFisher Scientific | AB4322B | |
| Chemical compound | Dynabeads M-280 Streptavidin | ThermoFisher Scientific | 11205D | |
| Software or algorithm | Photoshop 21.0.1 | Adobe | NA | |
| Software or algorithm | Illustrator 24.0.1 | Adobe | NA | |
| Software or algorithm | NCBI BLAST | National Insitutes of Health | NA | |
| Software or algorithm | ImageJ v2.0.0-rc-43/1.50e | National Insitutes of Health | NA | |
| Software or algorithm | SnapGene | GSL Biotech LLC | NA | |
| Software or algorithm | RNAhybrid | PMID:15383676 | NA | |
| Software or algorithm | GraphPad Prism v6.0h | GraphPad Software, Inc | NA | |
| Software or algorithm | Volocity 6.3 | Perkin Elmer | NA | |
| Software or algorithm | R version 3.5.2 | R Studio | NA | |
| Software or algorithm | RStudio version 1.1.463 | R Studio | NA |
Author response table 1
Multiple comparison of p values (one-way ANOVA with Bonferroni correction) for wake-to-wake intervals between the genotypes/conditions in the row versus column.
| L4 (Figure 2B) | wild type (N2) | wild type, nhr-23 RNAi | let-7(n2853) | |
|---|---|---|---|---|
| wild type, nhr-23 RNAi | **** | |||
| let-7(n2853) | **** | **** | ||
| let-7(n2853), nhr-23 RNAi | n.s. | **** | **** | |
| L4 (Figure 4F) | wild type (N2) | let-7 (xk41-scRORE1,2) | let-7 (xk44-scRORE1,2) | let-7 (xk39-scRORE1,3) |
| let-7(xk41-scRORE1,2) | *** | |||
| let-7(xk44-scRORE1,2) | * | n.s. | ||
| let-7(xk39-scRORE1,3) | *** | n.s. | n.s. | |
| let-7(xk42-scRORE1,3) | *** | n.s. | n.s. | n.s. |
| L4 (Figure 6B) | wild type (N2) | wgIs43[nhr-23++] | ||
| wgIs4 [nhr-23++] | ** | |||
| nhr-23(aaa20-∆LCS) | **** | n.s. | ||
| L3 (Figure 2C) | wild type (N2) | wild type, nhr-23 RNAi | let-7(n2853) | |
| wild type, nhr-23 RNAi | **** | |||
| let-7(n2853) | * | **** | ||
| let-7(n2853), nhr-23 RNAi | **** | **** | **** | |
| L3 (Figure 6C) | wild type (N2) | wgIs43[nhr-23++] | ||
| wgIs43 [nhr-23++] | ** | |||
| nhr-23 (aaa20-∆LCS) | **** | * | ||
| L2 | wild type (N2) | wild type, nhr-23 RNAi | mir-48 mir-241(nDf51); mir-84(n4037) | |
| wild type, nhr-23 RNAi | **** | |||
| mir-48 mir-241(nDf51); mir-84(n4037) | n.s. | **** | ||
| mir-48 mir-241(nDf51); mir-84(n4037), nhr-23 RNAi | **** | n.s. | **** |
Additional files
-
Supplementary file 1
Metrics of the molting biorhythm associated with specific genotypes.
The active, lethargic, and wake-to-wake intervals are defined in the text. The values derived from longitudinal studies of stage-specific cohorts of singled, isogenic worms. The top row of each section corresponds to the same-day cohort of singled, wild-type worms. Dashes (–) beneath ‘RNAi’ indicate continuous cultivation of the worms on E. coli HT115(DE3). ‘N’ is the cumulative sample size from two independent trials. All p values were generated by pairwise comparisons between individual metrics tabulated for a specific cohort of test subjects and also for the same-day, age-matched cohort of control subjects: ****p ≤ 0.0001, ***p ≤ 0.001, *p ≤ 0.05, ordinary one-way ANOVA with Bonferroni’s correction for multiple comparisons. Entries in the top row of each subsection correspond to six distinct cohorts of control subjects. By order of first appearance in the table, the strains tested were N2, QK509 [let-7(n2853)], GR1395 [mgIs49], GR1436 [let-7(mg279)], ARF249 [let-7(mg279); mir-84(tm1304)], QK201 [let-7(xk41)], QK203 [let-7(xk44)], QK198 [let-7(xk39)], QK199 [let-7(xk42)], OP43 [wgIs43], ARF414 [nhr-23(aaa20)] and VT1066 [mir-48 mir-241(nDf51); mir-84(n4037)]. Notably, both QK509 [let-7(n2853)] and the ancestral strain MT7626 [let-7(n2853)] developed at an accelerated pace: 71% of QK059 hatchlings and 79% of MT7626 hatchlings transited the larval stages and emerged as young adults within 42 h of cultivation with food, as compared with 12% of N2 hatchlings (N = 100, p ≤ 0.0001, chi-square test).
- https://cdn.elifesciences.org/articles/80010/elife-80010-supp1-v1.docx
-
Supplementary file 2
LCSs found in selected nematode and vertebrate homologs of ROR.
Entries correspond to sites shown in Figure 10D. The number of nucleotides between the 3′ end of each LCS and the stop codon is indicated. The thermostability of every RNA duplex between a prospective LCS and mature let-7, as predicted by RNAhybrid, was lower than the predicted thermostability (−29 kcal/mol) of duplexes between the functional LCS in the 3′ UTR of lin-41 and let-7 (Rehmsmeier et al., 2004). The 3′ UTRs were supported by ESTs archived in WBcel235/ce11, WBPS9, GRCh38/hg38, GRCm38/mm10, and GRCz10/danRer10.
- https://cdn.elifesciences.org/articles/80010/elife-80010-supp2-v1.docx
-
Supplementary file 3
Metrics of the expression curves of nhr-23 in the indicated genetic backgrounds.
As described in Materials and methods, Metacycle was used to calculate the amplitude and phase of expression of the waveforms. The peak values and the slope of rise and decay were obtained by manual calculation.
- https://cdn.elifesciences.org/articles/80010/elife-80010-supp3-v1.docx
-
Supplementary file 4
Evaluation and classification of clock-controlled genes as direct targets of NHR-23, let-7s, neither, or both.
The bioinformatic approaches and criteria for assignment of queries to categories are described in Materials and methods. The name and WormBase accession number of each gene are listed. ‘# Obs./# Exp.’ stands for the number of observed DNA or RNA response elements divided by the number of elements predicted by chance alone. The down arrows denote downregulation of the query transcript in nhr-23(RNAi) animals as compared with wild-type controls. The ‘+’ symbol in column 12 denotes identification of the transcript in ALG-1 iCLIP datasets in vivo (Broughton et al., 2016). The symbol ‘♒’ indicates that expression of the gene oscillates across larval development. Relevant datasets are identified in the text, Materials and Methods, and Key Resources Table.
- https://cdn.elifesciences.org/articles/80010/elife-80010-supp4-v1.docx
-
Supplementary file 5
Oligonucleotides used in this study.
DNA or RNA sequences appear in the first column. For primers and gene blocks used to construct a particular bicistronic reporter for cis-regulatory elements in a 3′ UTR of interest, the resulting plasmid and corresponding extrachromosomal array are identified in the ‘application’ column. All seven reporters and respective transgenic strains of C. elegans are further described in The Key Resources Table.
- https://cdn.elifesciences.org/articles/80010/elife-80010-supp5-v1.docx
-
MDAR checklist
- https://cdn.elifesciences.org/articles/80010/elife-80010-mdarchecklist1-v1.docx
Download links
A two-part list of links to download the article, or parts of the article, in various formats.
Downloads (link to download the article as PDF)
Open citations (links to open the citations from this article in various online reference manager services)
Cite this article (links to download the citations from this article in formats compatible with various reference manager tools)
Feedback between a retinoid-related nuclear receptor and the let-7 microRNAs controls the pace and number of molting cycles in C. elegans
eLife 11:e80010.
https://doi.org/10.7554/eLife.80010


