The Drosophila ZAD zinc finger protein Kipferl guides Rhino to piRNA clusters
- Institute of Molecular Biotechnology of the Austrian Academy of Sciences, Vienna BioCenter, Austria
- Vienna BioCenter PhD Program, Doctoral School of the University of Vienna and Medical University of Vienna, Austria
Figures
Figure 1 with 1 supplement
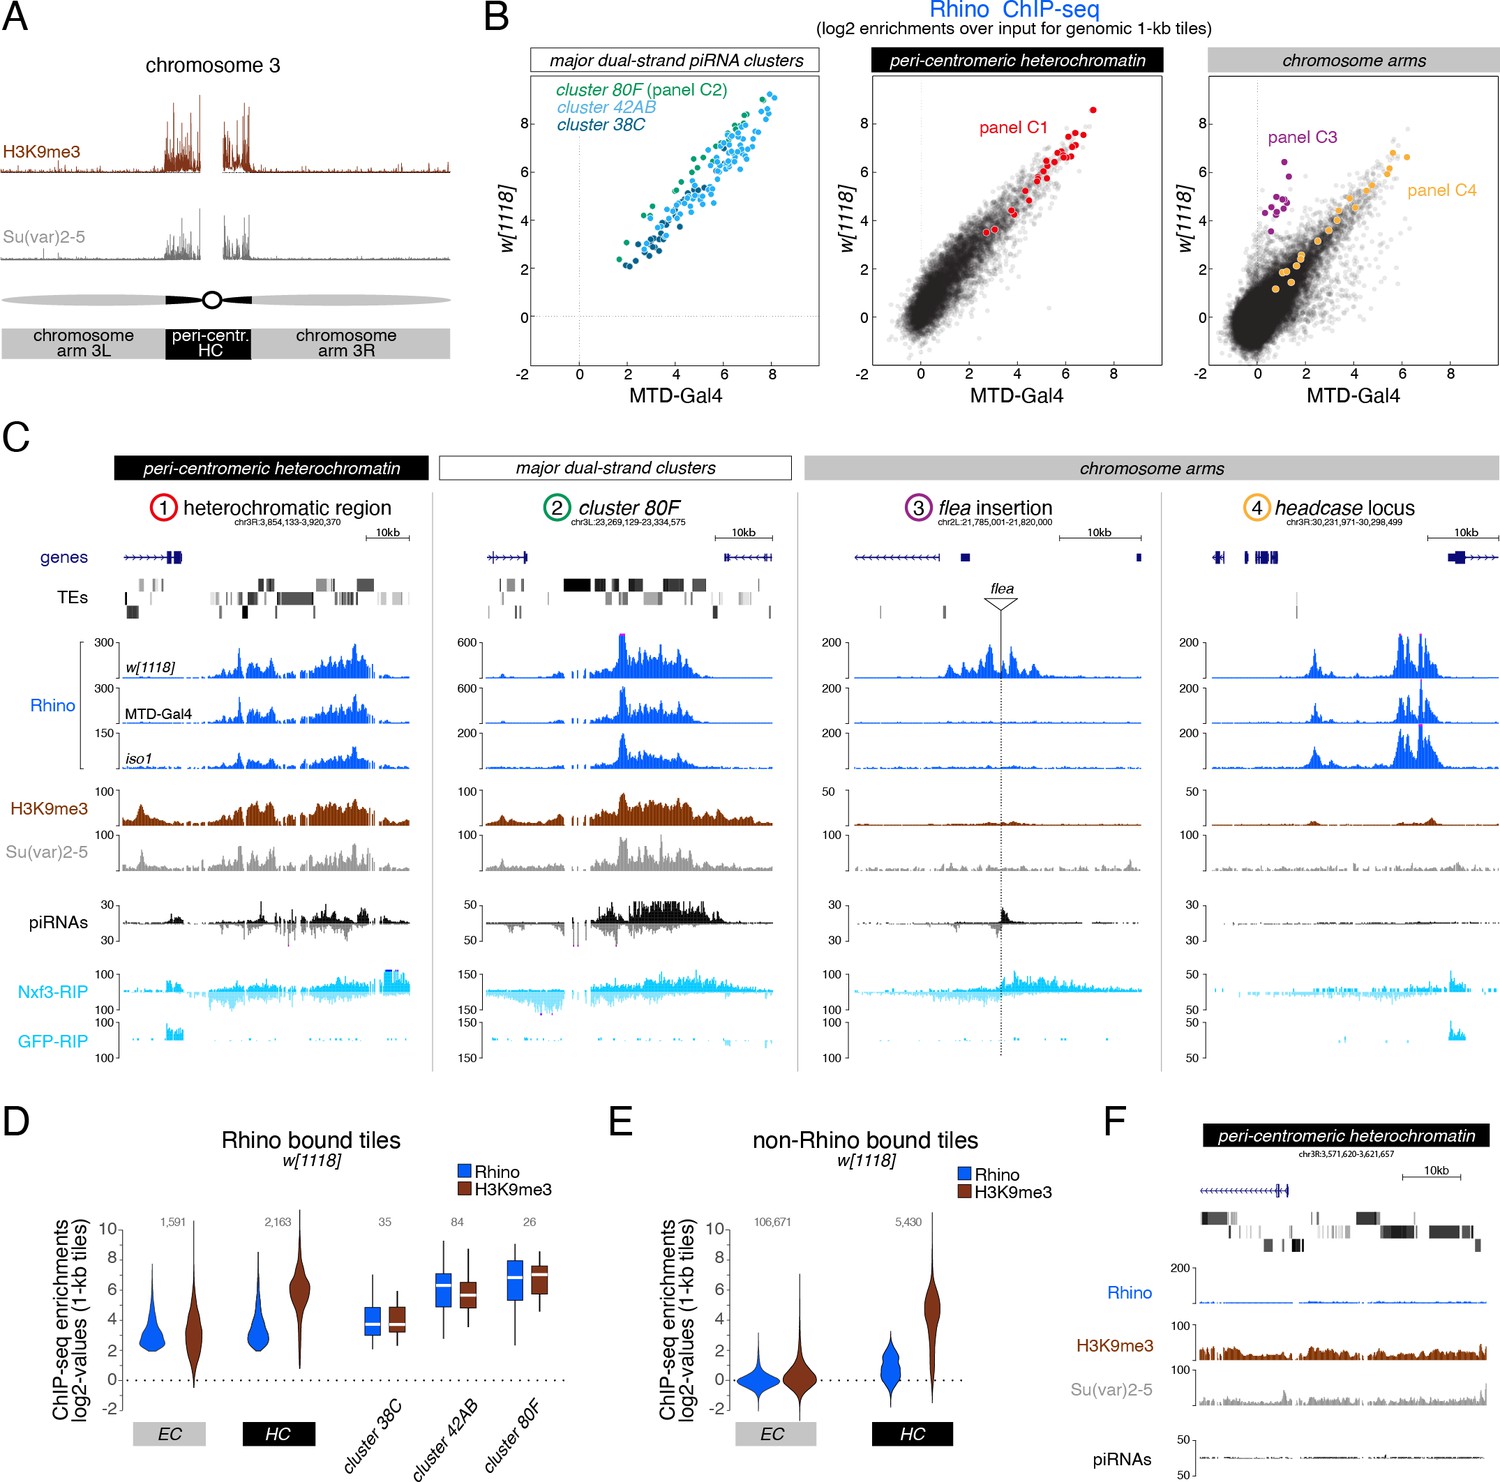
H3K9me3 is insufficient to define the large diversity of genomic Rhino domains.
(A) ChIP-seq enrichment (genome unique reads; 1-kb tiles, one representative replicate each) of H3K9me3 and Su(var)2–5 along the assembled chromosome 3 sequence in w1118 ovaries. Pericentromeric heterochromatin and euchromatic chromosome arms are indicated. (B) Scatter plot comparing average log2 ChIP-seq enrichments for Rhino in ovaries from w1118 (n=2) versus MTD-Gal4 >w-sh (n=3) strains (1-kb tiles separated into pericentromeric heterochromatin and chromosomal arms; piRNA clusters 38C, 42AB, and 80F are shown separately; colored 1-kb tiles correspond to example loci in panel C). (C) UCSC genome browser tracks depicting the diversity of Rhino domains. 1: heterochromatic, transposon-rich locus; 2: piRNA cluster 80F; 3: strain-specific flea insertion (ElMaghraby et al., 2019) in w1118; 4: Rhino domain proximal to euchromatic headcase locus. Unless indicated otherwise, data are from w1118ovaries (ChIP and RIP signal are depicted as coverage per million reads, piRNA coverage normalized to miRNA reads, data is displayed for one representative replicate). GFP-RIP-seq serves as control for non-specific mRNA binding. (D, E) Violin plots showing average log2 fold enrichment of Rhino ChIP-seq over input for 1-kb tiles (n=2) from w1118 ovaries. Tiles were grouped into Rhino-bound and non-Rhino-bound based on a cutoff of fourfold enrichment (corresponding to p=0.036, Z-score=2.1) of Rhino ChIP-seq signal over input in each replicate experiment. Rhino-dependent piRNA clusters 38C, 42AB, and 80F were analyzed separately (shown as box plots due to low number of tiles). Box plots show median (center line), with interquartile range (box) and whiskers indicate 1.5x interquartile range. (F) UCSC genome browser tracks depicting a pericentromeric heterochromatin locus marked by H3K9me3 and bound by Su(var)2–5, but not Rhino (ChIP-seq signal: coverage per million reads; piRNA coverage normalized to miRNA reads; all data obtained from w1118 ovaries, data is displayed for one representative replicate).
Figure 1—figure supplement 1

Relationships between methylated H3K9 and chromatin target sites of HP1 family members.
(A) Scatter plots contrasting average log2 ChIP-seq enrichment for Rhino in w1118 (n=2) or MTD-Gal4 (n=3) versus iso1 (n=2) ovaries. Depicted are 1-kb tiles separated into pericentromeric heterochromatin and chromosomal arms. piRNA clusters 38C, 42AB, and 80F are excluded from the categorization into heterochromatin and euchromatin and are depicted separately. Indicated colored 1-kb tiles correspond to example loci in Figure 1F. (B, C) Violin plots showing the average log2-fold ChIP-seq enrichment of endogenous and germline specific Su(var)2–5 (transgene expressed under the control of the rhino promoter) and H3K9me2 (C) over input on 1-kb tiles. Tiles are grouped into Rhino-bound and non-Rhino-bound analogous to Figure 1D and E with Rhino-dependent piRNA clusters 38C, 42AB, and 80F depicted separately for comparison. Box plots show median (center line), with interquartile range (box) and whiskers indicate 1.5x interquartile range. (D) Heat map centered on HP1b (left) or HP1c (right) peaks, respectively, depicting the indicated ChIP-seq signal (n=1) in ovaries from the w1118 strain.
Figure 2 with 2 supplements

The ZAD-zinc finger CG2678 interacts with Rhino and binds Rhino domains genome-wide.
(A) Genomic CG2678 locus depicting the two annotated transcripts and CG2678 protein domain architecture (location of the frame shift mutation (red asterisk), internal 3xFLAG affinity tag (red circle), and cleavage sites for full locus deletion (red arrows) are indicated). (B) Volcano plot showing fold enrichment of proteins determined by quantitative mass spectrometry (Doblmann et al., 2019) in GFP-Rhino TurboID samples versus nuclear GFP TurboID control (n = 3 biological replicates; statistical significance based on two-sided t-test; P values corrected for multiple testing (Benjamini–Hochberg), see also Figure 2—figure supplement 2A and Figure 2—source data 1). (C, D) Confocal images of nurse cell nuclei (C) and germarium (D). Single channel and merged color images depict immunofluorescence signal for endogenous CG2678 (left, cyan) and Rhino (middle, magenta). Scale bar: 5 µm, dotted line: nuclear outline based on DAPI. (E) Scatter plot depicting correlation of log2-fold Rhino versus CG2678 ChIP-seq enrichment in w1118 ovaries (average of 2 replicates each). CG2678-only tiles are highlighted in green and were defined by significantly higher enrichment for Rhino than CG2678 (n=2, Z-score=3), plus a Rhino enrichment of max. 4-fold in two independent experimental replicates. (F, G) UCSC browser tracks illustrating CG2678 signal at diverse Rhino domains (F) and at CG2678-only peaks (G). ChIP-seq signal is shown as coverage per million sequenced reads for w1118 ovaries for one representative replicate. (H) Violin plots depicting log2-fold enrichment of H3K9me2 (orange, n=1) and H3K9me3 (brown, n=2) at euchromatic 1-kb tiles bound by neither Rhino nor CG2678, both proteins, or CG2678 only. Classification into groups was performed based on binary cutoffs for Rhino (fourfold) and a linear fit for CG2678 co-occupancy in two independent replicate ChIP-seq experiments from w1118 ovaries to extract CG2678-only tiles highlighted in (E).
-
Figure 2—source data 1
Imputed enrichment and p-values (n=3) for quantitative mass spectrometry data underlying Figure 2B.
- https://cdn.elifesciences.org/articles/80067/elife-80067-fig2-data1-v1.txt
Figure 2—figure supplement 1
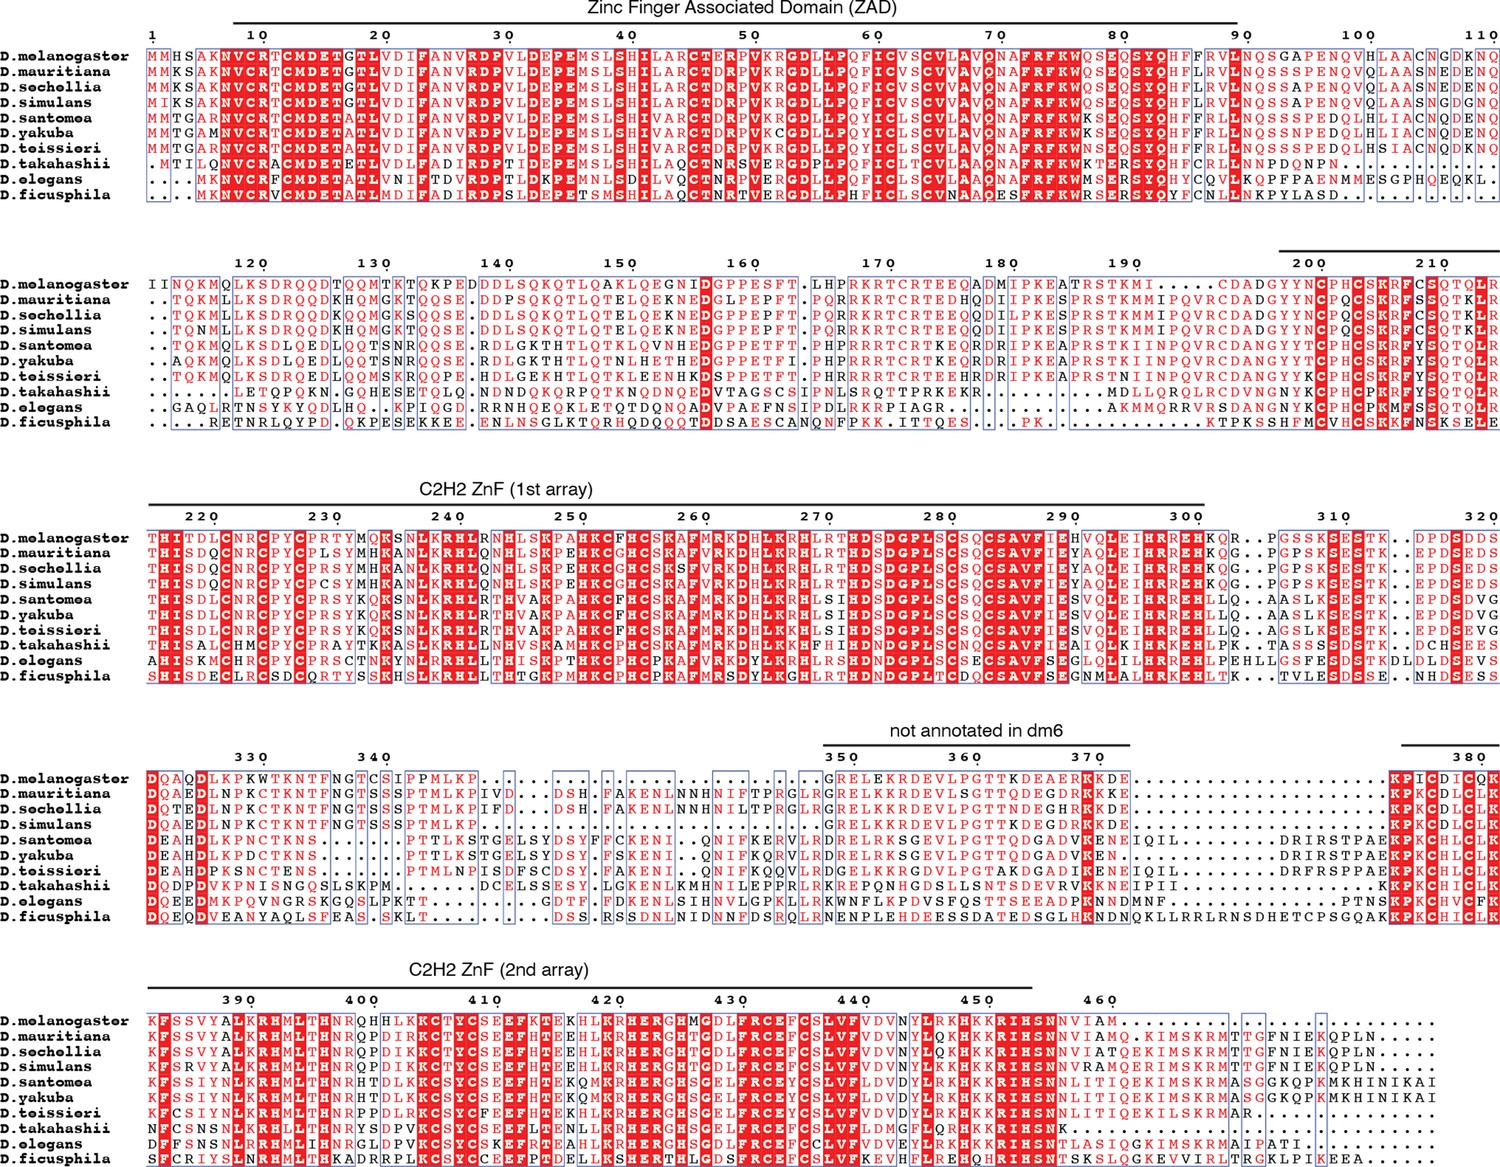
Multiple sequence alignment of selected reciprocal best CG2678 homologs generated with mafft v7.505 (Rozewicki et al., 2016) and visualized with espript v3.0 (Robert and Gouet, 2014).
Protein sequences included in the alignment were obtained from the NCBI non-redundant database, their protein accessions being XP_033162862, XP_032579476, EDX12039, XP_039231961, XP_039493628, XP_043654173, XP_044252272, XP_017119505, XP_017057177.
Figure 2—figure supplement 2
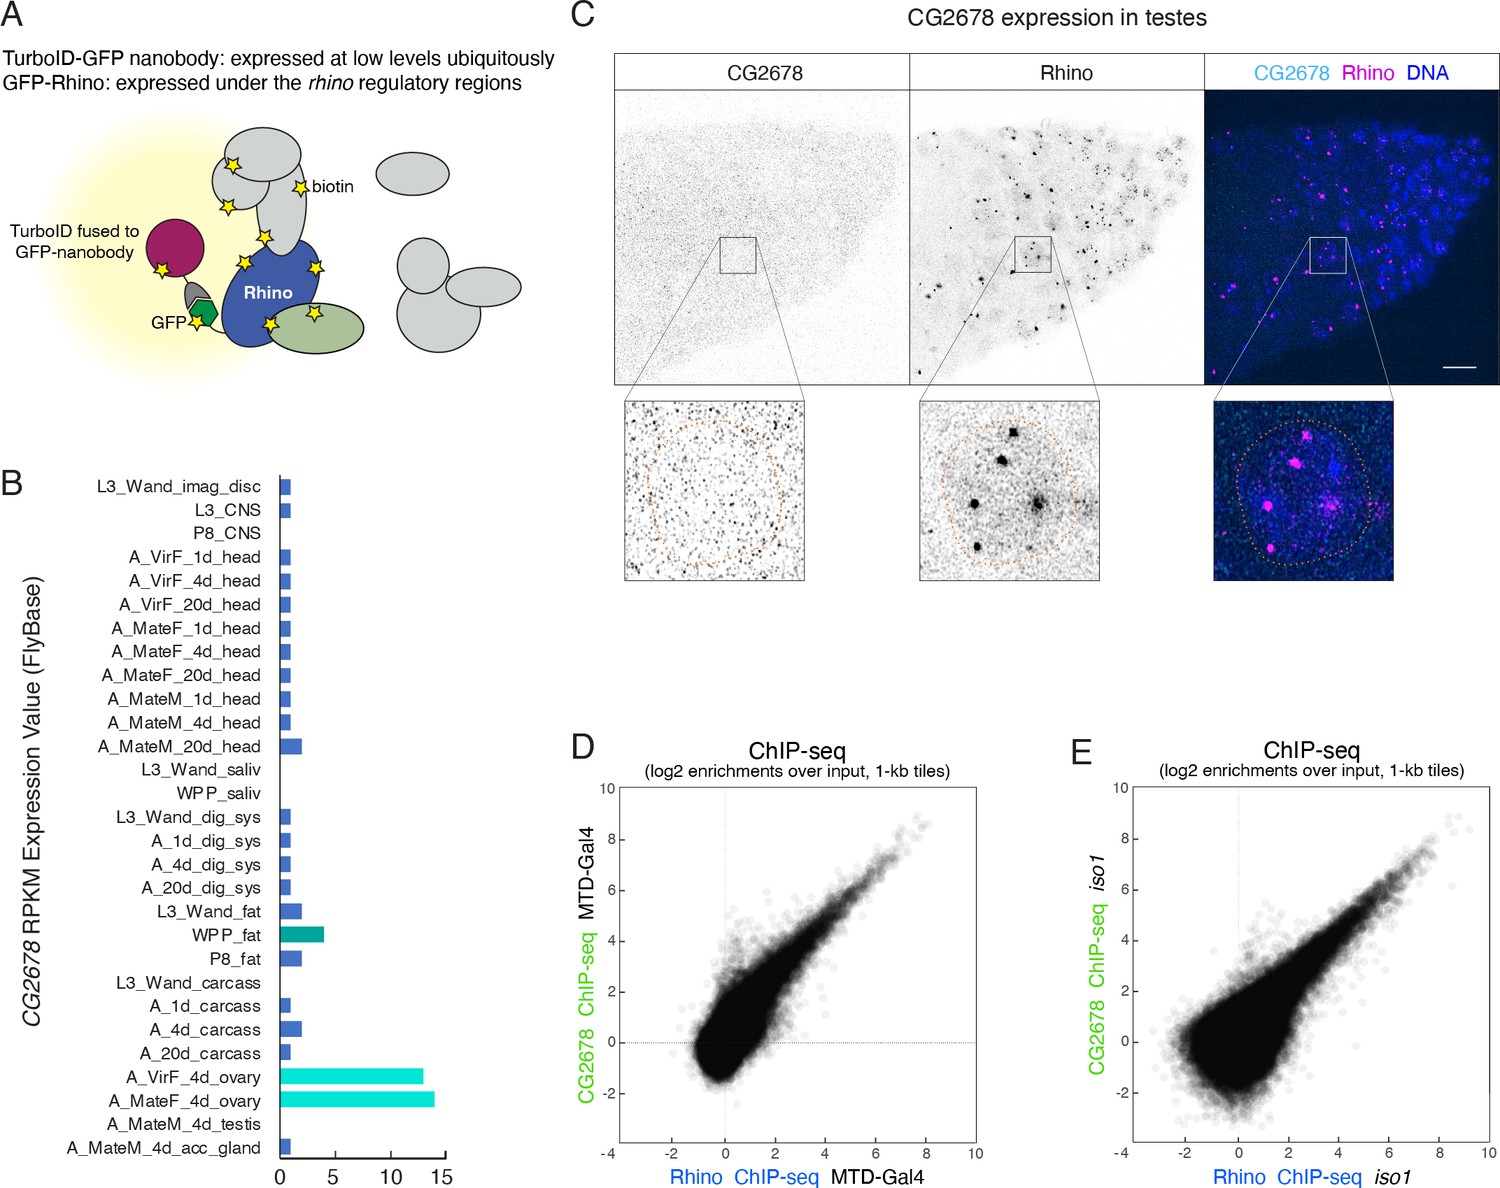
CG2678 is expressed in ovaries but not in testes and binds Rhino domains on chromatin.
(A) Cartoon illustrating flexible GFP-nanobody-TurboID setup used for the characterization of proteins in close proximity to GFP-tagged Rhino. (B) Bar graph indicating the expression pattern of CG2678 (Flybase modENCODE Anatomy RNA-Seq; L: larva; P: pupa; A: adult; M: male; F: female). (C) Confocal image of anterior tip of a testes stained for endogenous CG2678 (left, cyan) and Rhino (middle, magenta) with enlarged view of one nucleus (dotted line: nuclear outline based on DAPI; scale bar: 5 µm). (D, E) Scatter plots depicting the correlation of log2-fold Rhino versus CG2678 ChIP-seq enrichments in MTD-Gal4 (D; n=2) or iso1 ovaries (E; n=1).
Figure 3 with 1 supplement
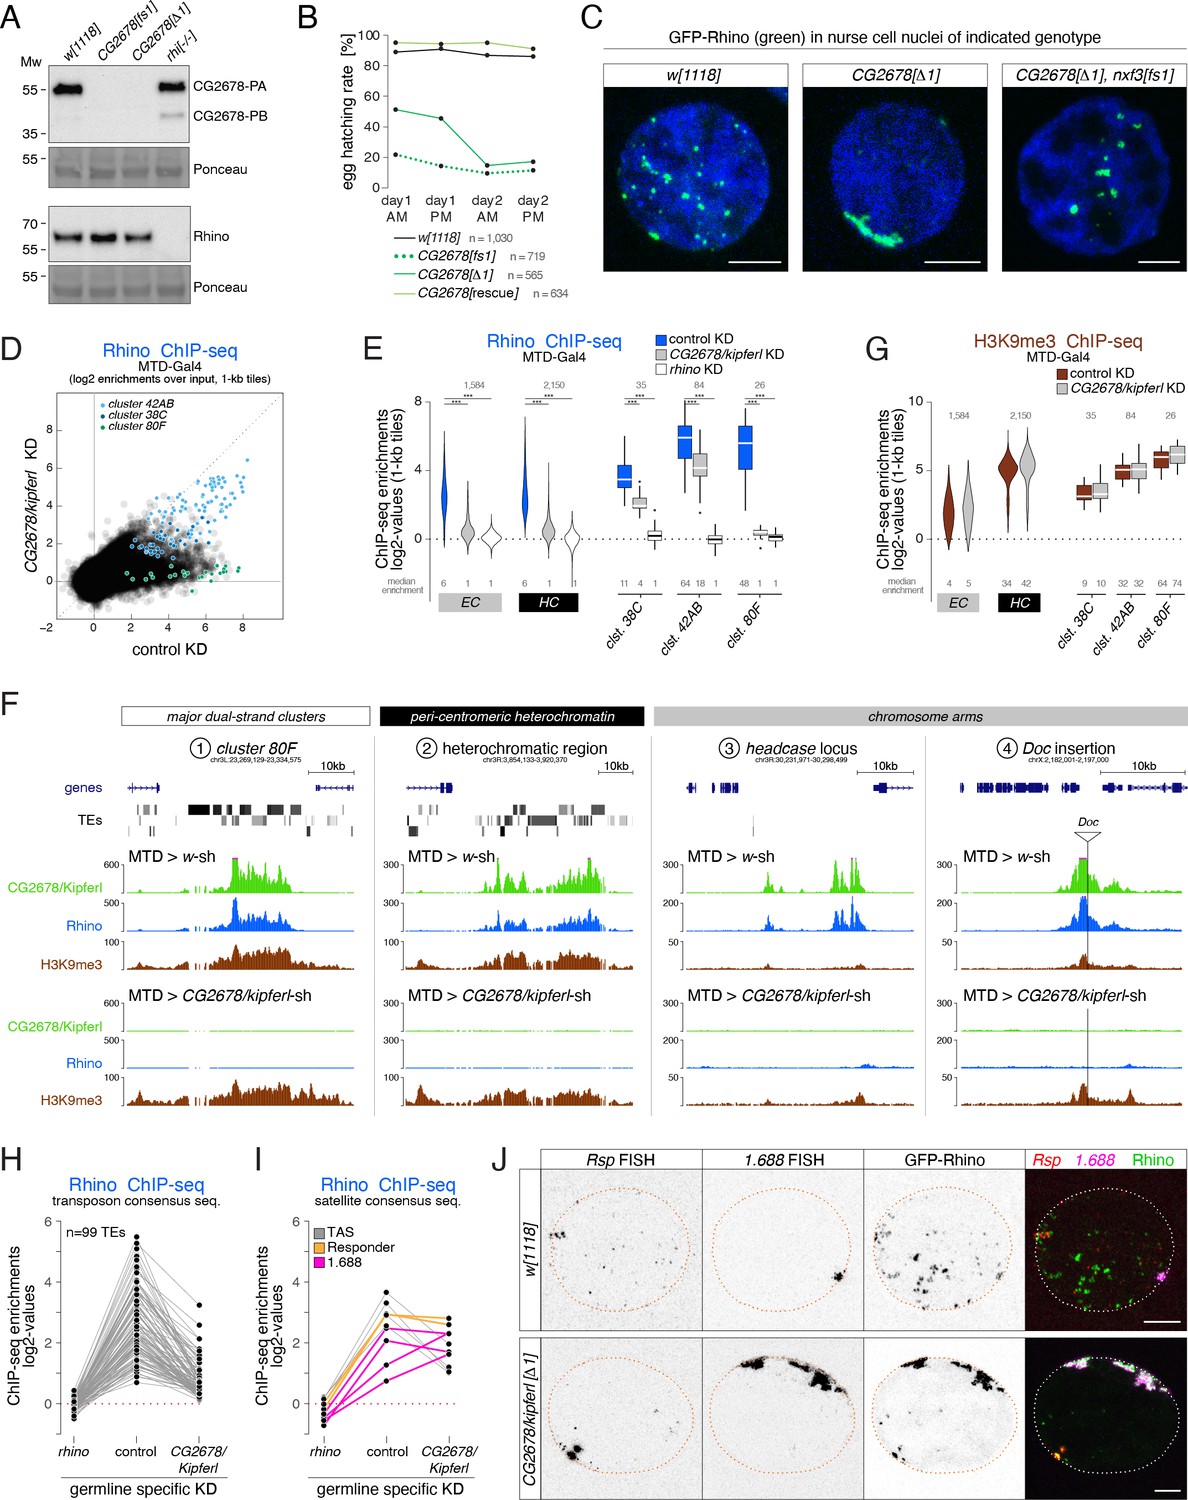
Rhino’s chromatin occupancy changes dramatically in CG2678/kipferl mutants.
(A) Western blot analysis verifying CG2678 frame shift (fs1) and locus deletion (Δ1) alleles using a monoclonal antibody against CG2678 (top; CG2678-PB is a minor protein isoform) and depicting Rhino levels in the absence of CG2678 (bottom). Ponceau staining: loading control. (B) Time-resolved hatching rates for eggs laid by w1118 control females in comparison to females carrying a CG2678 frame shift (fs1), locus deletion (Δ1), or tagged rescue construct instead of the CG2678 locus, respectively (AM, PM indicates egg laying time). Total number of eggs laid is indicated for each genotype. (C) Confocal images illustrating localization of GFP-Rhino in nurse cell nuclei of w1118, CG2678 locus deletion (Δ1), and CG2678,nxf3 double mutant females (scale bar: 5 µm). (D) Scatter plot of genomic 1-kb tiles contrasting average log2-fold Rhino ChIP-seq enrichment in ovaries with MTD-Gal4 driven CG2678/kipferl knock down versus control ovaries (average of two replicate experiments each). (E) Violin plots showing average log2-fold Rhino ChIP-seq enrichment in control (n=3) as well as CG2678/kipferl (n=2) or rhino (n=1) germline knockdown ovaries on Rhino-bound 1-kb tiles (defined in Figure 1D) in heterochromatin (HC) and chromosome arms (EC). piRNA clusters 38C, 42AB, and 80F are depicted separately. *** corresponds to P<0,001 based on student’s t-test. Box plots show median (center line), with interquartile range (box) and whiskers indicate 1.5x interquartile range. (F) UCSC browser tracks (ChIP-seq) depicting diverse Rhino domains in control and CG2678/kipferl germline knockdown ovaries (signal shown as coverage per million sequenced reads for one representative replicate). (G) Violin plots showing average log2-fold H3K9me3 ChIP-seq enrichment in control (n=3) and CG2678/kipferl (n=2) germline knockdown for Rhino-bound 1-kb tiles (defined in Figure 1D) in heterochromatin (HC) and along chromosome arms (EC). piRNA clusters 38C, 42AB, and 80F are depicted separately. *** and n.s. corresponds to p<0.001 or p>0.05, respectively, based on student’s t-test. Box plots show median (center line), with interquartile range (box) and whiskers indicate 1.5x interquartile range. (H, I) Jitter plots depicting the log2-fold Rhino ChIP-seq enrichments on transposon (H) and Satellite (I) consensus sequences in indicated genetic backgrounds. (J) Confocal images showing Rsp and 1.688 Satellite RNA FISH signal and GFP-Rhino in nurse cells of w1118 or CG2678/kipferl mutant flies (scale bar: 5 µm).
Figure 3—figure supplement 1
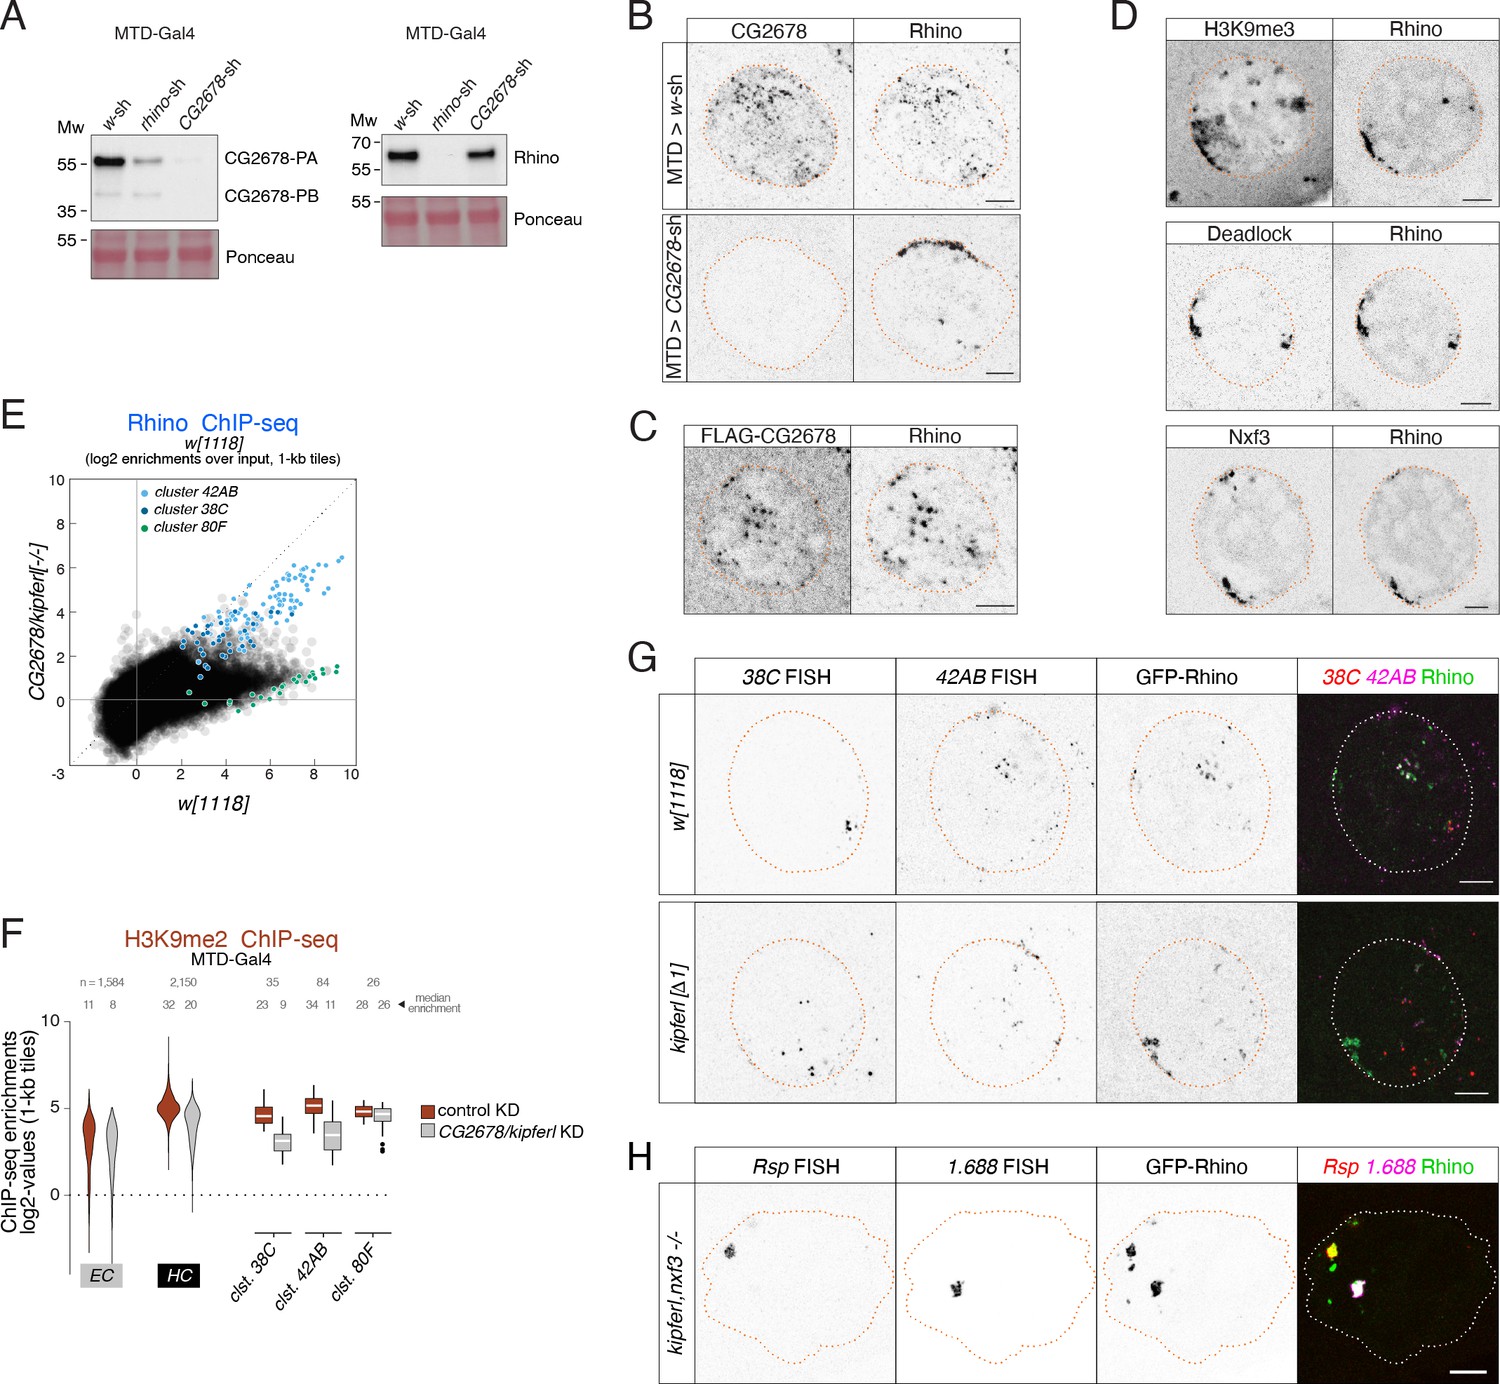
CG2678/Kipferl impacts Rhino's nuclear localization and chromatin occupancy.
(A) Western blots showing CG2678 or Rhino protein levels in ovarian lysate from indicated genotypes (Ponceau staining served as loading control). Changes in protein levels and isoform ratios between control and rhino depleted ovaries were not reproducible and are likely caused by differences in ovary morphology, which distort the protein composition across samples. (B) Confocal images showing immunofluorescence signal for CG2678 and Rhino in nurse cells of MTD-Gal4-driven control or CG2678 knockdown ovaries (scale bar: 5 µm). (C) Confocal images showing FLAG-tagged CG2678 and Rhino signal in nurse cells expressing an internally FLAG-tagged CG2678 in the CG2678 mutant background (see Figure 2B for location of FLAG tag; scale bar: 5 µm). (D) Confocal images showing the localization of GFP-Rhino with H3K9me3 (top), Deadlock (middle), or Nxf3 (bottom) in CG2678 null mutant nurse cells (scale bar: 5 µm). (E) Scatter plot of genomic 1-kb tiles contrasting average log2-fold enrichment for Rhino ChIP-seq signal in CG2678 knock out versus w1118 control ovaries (three and two replicate experiments, respectively). (F) Violin plots showing average log2-fold H3K9me2 ChIP-seq enrichment for Rhino-bound 1-kb tiles in MTD-Gal4 background in heterochromatin (HC) and along chromatin arms (EC) contrasting control (n=2) to RNAi-mediated CG2678/kipferl knockdown (n=1). Rhino-dependent piRNA clusters 38C, 42AB, and 80F are shown separately. Box plots show median (center line), with interquartile range (box) and whiskers indicate 1.5x interquartile range. (G) Confocal images showing the localization of piRNA cluster RNA via RNA FISH in respect to GFP-Rhino in nurse cells of w1118 or CG2678/kipferl locus deletion flies (scale bar: 5 µm). Imaging conditions were chosen to avoid photo bleaching and to optimally display the large Rhino-GFP accumulations to show that these are not corresponding to either of these clusters. (H) Confocal images showing Rsp and 1.688 Satellite RNA FISH signal in respect to GFP-Rhino in nurse cells of CG2678/kipferl,nxf3 double mutant flies (scale bar: 5 µm).
Figure 4 with 1 supplement
kipferl mutant ovaries display piRNA losses and transposon de-repression.
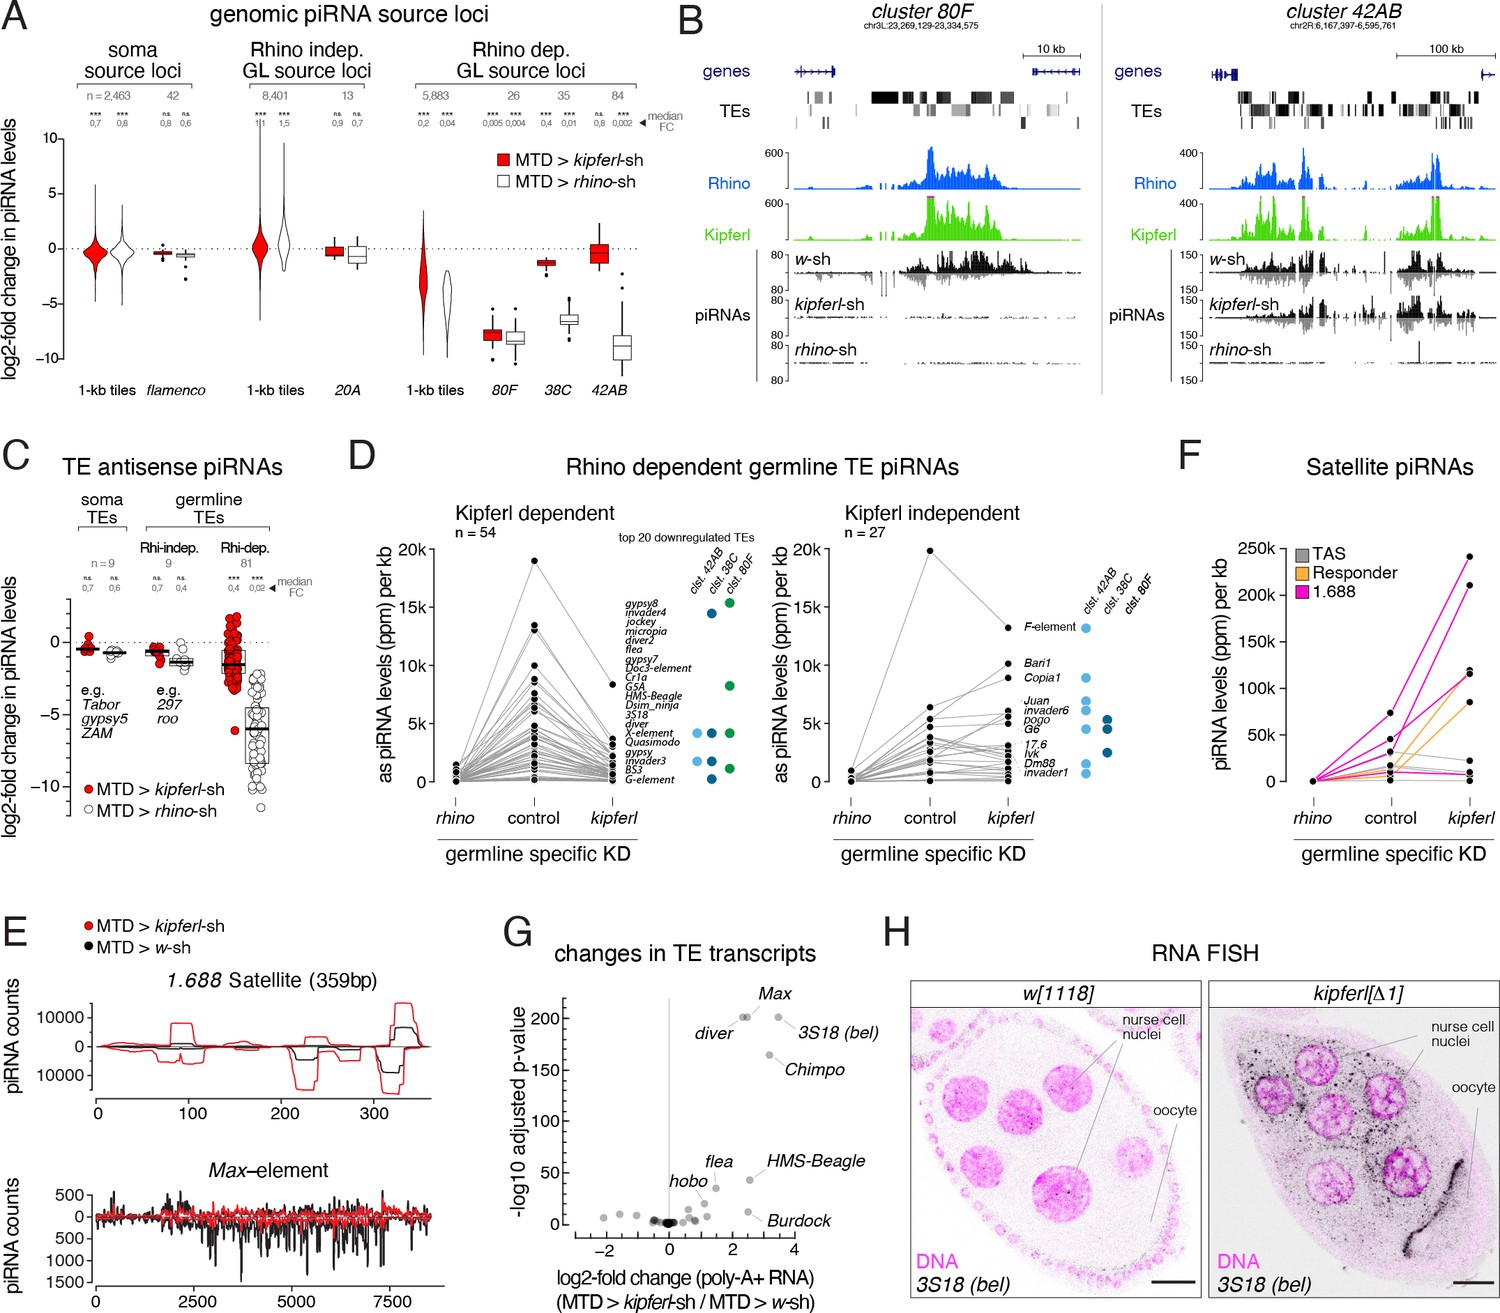
(A) Violin plots showing log2-fold changes in levels of uniquely mapping piRNAs on 1-kb tiles relative to control upon MTD-Gal4 mediated knock down of rhino or kipferl (1-kb tiles were categorized into somatic source loci, Rhino-independent germline source loci and Rhino-dependent germline source loci according to Figure 4—figure supplement 1B, n=1). *** and n.s. corresponds to p<0.001 or p>0.05, respectively, based on Wilcoxon signed-rank test. Box plots show median (center line), with interquartile range (box) and whiskers indicate 1.5x interquartile range. (B) UCSC genome browser tracks displaying piRNA levels at clusters 80F and 42AB in control, kipferl, and rhino knock down ovaries (ChIP-seq signal from MTD-Gal4 control ovaries is depicted as coverage per million reads, piRNA coverage was normalized to miRNA reads, data is given for one replicate). (C) Jitter plot depicting log2-fold changes for piRNA levels mapping antisense to transposon consensus sequences in indicated MTD-Gal4 mediated knock downs compared to control (transposons classified analogous to panel A, n=1). *** and n.s. corresponds to p<0.001 or p>0.05, respectively, based on Wilcoxon signed-rank test. (D, E) Jitter plots showing piRNA levels (per kb sequence) in indicated genotypes mapping to transposons (antisense only) giving rise to Rhino-dependent piRNAs (D) or to Satellite repeats (E). Blue and green dots in panel D indicate fragments of the respective transposon in piRNA clusters 38C, 42AB, or 80F (n=1, compare to Figure 4—figure supplement 1C for full mutant data, and see Figure 4—source data 1). (F) piRNA profiles across the consensus sequences for a representative transposon (Max) and the 359bp 1.688 Satellite. piRNA counts (normalized to miRNAs) are displayed for indicated genotypes. (G) Volcano plot depicting the log2-fold changes in poly-adenylated transposon transcripts in kipferl-depleted versus control ovaries (n=3). (H) Confocal images showing RNA FISH signal for 3S18 transcripts in w1118 and kipferl null mutant ovaries (scale bar: 20 µm).
-
Figure 4—source data 1
Normalized small RNA-seq counts and their mappings to transposable element sequences.
- https://cdn.elifesciences.org/articles/80067/elife-80067-fig4-data1-v1.xlsx
Figure 4—figure supplement 1

Loss of Kipferl affects the expression of repetitive elements but not mRNAs in ovaries.
(A) Size profiles of Argonaute-bound small RNAs (miRNA-normalized) isolated from ovaries of indicated genotypes. microRNA reads are shown separately (grey bars). Percentages represent total piRNA levels (23-33nt) relative to control (100%). (B) Classification of genomic 1-kb tiles into somatic (e.g. flamenco), Rhino-independent (e.g. cluster 20A), and Rhino-dependent germline source loci (e.g. clusters 38C, 42AB, 80F). Binary cutoffs are applied at a soma index of 2 do distinguish somatic from germline source loci (see Methods section) and a fourfold reduction in piRNAs upon rhino depletion to determine dependency on Rhino. (C) Jitter plots showing piRNA levels (per kb sequence) in indicated genotypes mapping to transposons (antisense only) giving rise to Rhino-dependent piRNAs or to Satellite repeats. (D) Confocal images showing RNA FISH signal of transcripts for the indicated transposons in w1118 and kipferl whole locus deletion egg chambers (scale bar: 20 µm; purple signal: DAPI). (E) Scatter plots contrasting RNAseq signal (poly-A plus) for expressed genes in indicated genotypes. Values are displayed as Gene length corrected trimmed mean of M-values (GeTMM; Blue dot: rhino. Green dot: kipferl. n=3).
Figure 5 with 1 supplement

Kipferl binds guanosine-rich DNA motifs and nucleates Rhino domains within H3K9me2/3 loci.
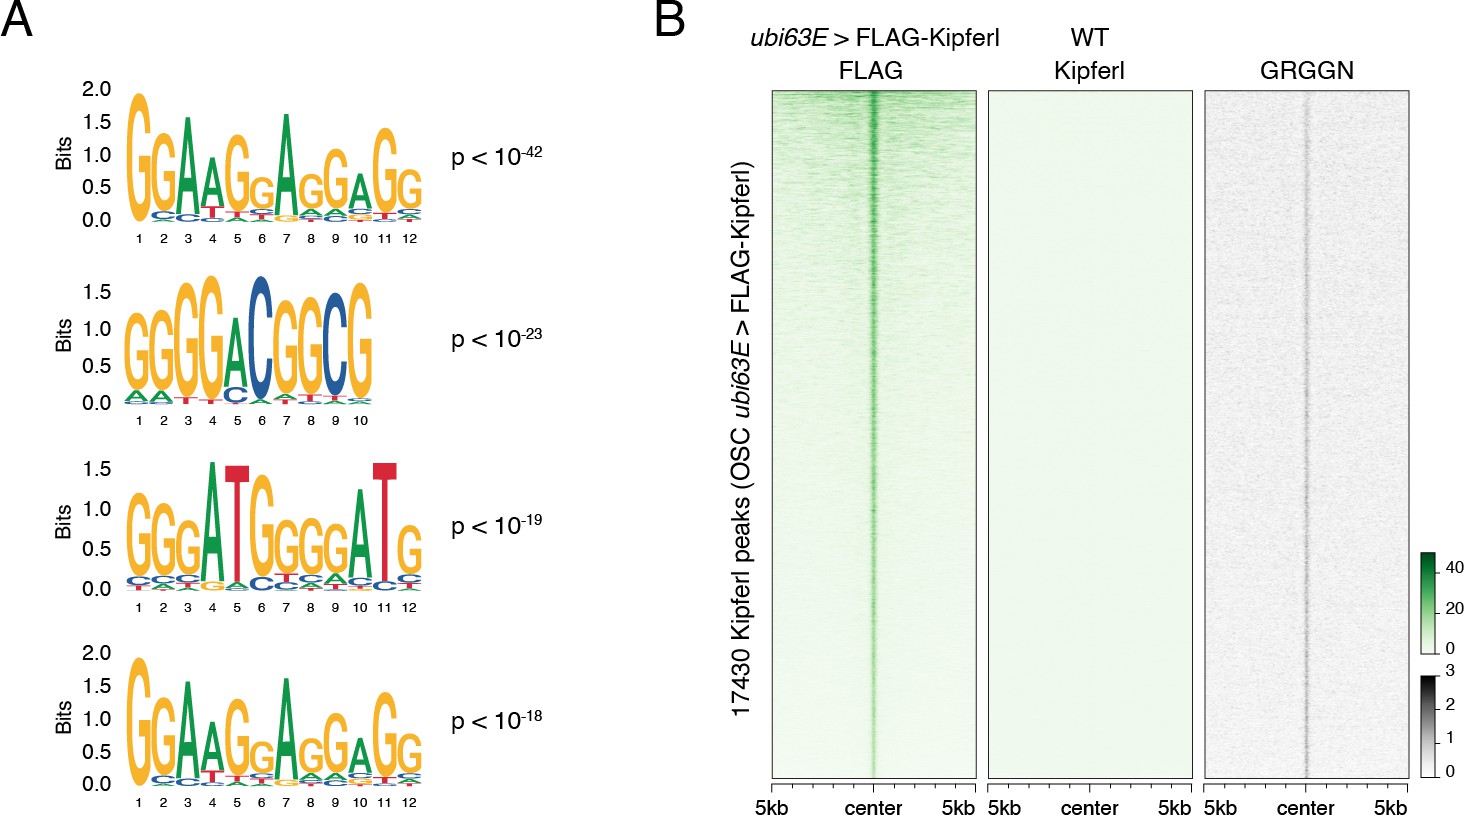
(A) Confocal images of nurse cell nuclei expressing FLAG-tagged Kipferl in indicated genetic backgrounds (scale bar: 5 µm; nuclear outlines based on DAPI as orange dotted line). (B) Scatter plot of genomic 1-kb tiles contrasting average log2-fold Kipferl ChIP-seq enrichment in ovaries with MTD-Gal4 driven rhino knock down (n=2) versus control ovaries (n=3). (C) Heat maps depicting ChIP-seq signal for Kipferl and Rhino in indicated genotypes from representative replicate experiments, centered on broad Kipferl peaks detected in two independent ChIP-seq experiments of w1118 ovaries (data sorted by Kipferl signal in w1118). (D) Meta profile showing Kipferl signal in wildtype and rhino mutant ovaries at all narrow Kipferl peaks determined in rhino mutant ovaries (top). The same peaks are divided into Rhino-Kipferl co-occupied (dotted line) and Kipferl-only peaks (dashed line) based on intersection with wildtype Rhino domains (bottom). (E) Heat maps depicting indicated ChIP-seq signal in indicated genotypes from representative replicate experiments centered on narrow Kipferl peaks detected in two independent ChIP-seq experiments of rhino mutant ovaries (data sorted by Rhino signal in w1118). (F, G) UCSC genome browser tracks depicting Kipferl and Rhino ChIP-seq signals in indicated genotypes for diverse Rhino domains with (F) or without (G) pronounced Kipferl nucleation sites. Zoomed in view of cluster 42AB is given to appreciate small Kipferl enrichments in the peripheral part of the cluster (ChIP-seq signal depicted as coverage per million reads; piRNA coverage normalized to miRNA reads, data is given for one representative replicate). (H) Schematic representation of Kipferl protein domain architecture and binding motifs predicted for the two ZnF arrays (Princeton Cys2His2 PWM predictor). (I) Position weight matrix of Kipferl consensus motif determined by HOMER from top 3000 narrow Kipferl peaks found in two independent ChIP-seq replicates from rhino mutant ovaries. The GRGGN motif was found at least once in 83.4% of peaks versus 50.3% in control sequences (P<10–322). (J) Heat map depicting Rhino-independent Kipferl ChIP-seq signal and GRGGN motif enrichment centered on narrow Kipferl peaks analogous to panel E, sorted by Kipferl signal in rhi[-/-] (motif count: # of motifs per non-overlapping genomic 100-bp window).
Figure 5—figure supplement 1
Kipferl binds guanosine-rich DNA motifs.
(A) Position weight matrices for highest ranking additional motifs recovered in the top 3000 narrow Kipferl peaks present in two independent replicates of rhino mutant ovaries (p-values indicate significance of motif enrichment over sequence matched control regions). (B) Heat map centered on Kipferl peaks detected via FLAG ChIP-seq in cultured ovarian somatic stem cells (OSCs) stably expressing FLAG-tagged Kipferl under control of the ubi63E promoter. GRGGN motif count is given as count per non-overlapping genomic 100-bp window. ChIP signal is depicted as coverage per million reads for one experiment.
Figure 6 with 1 supplement
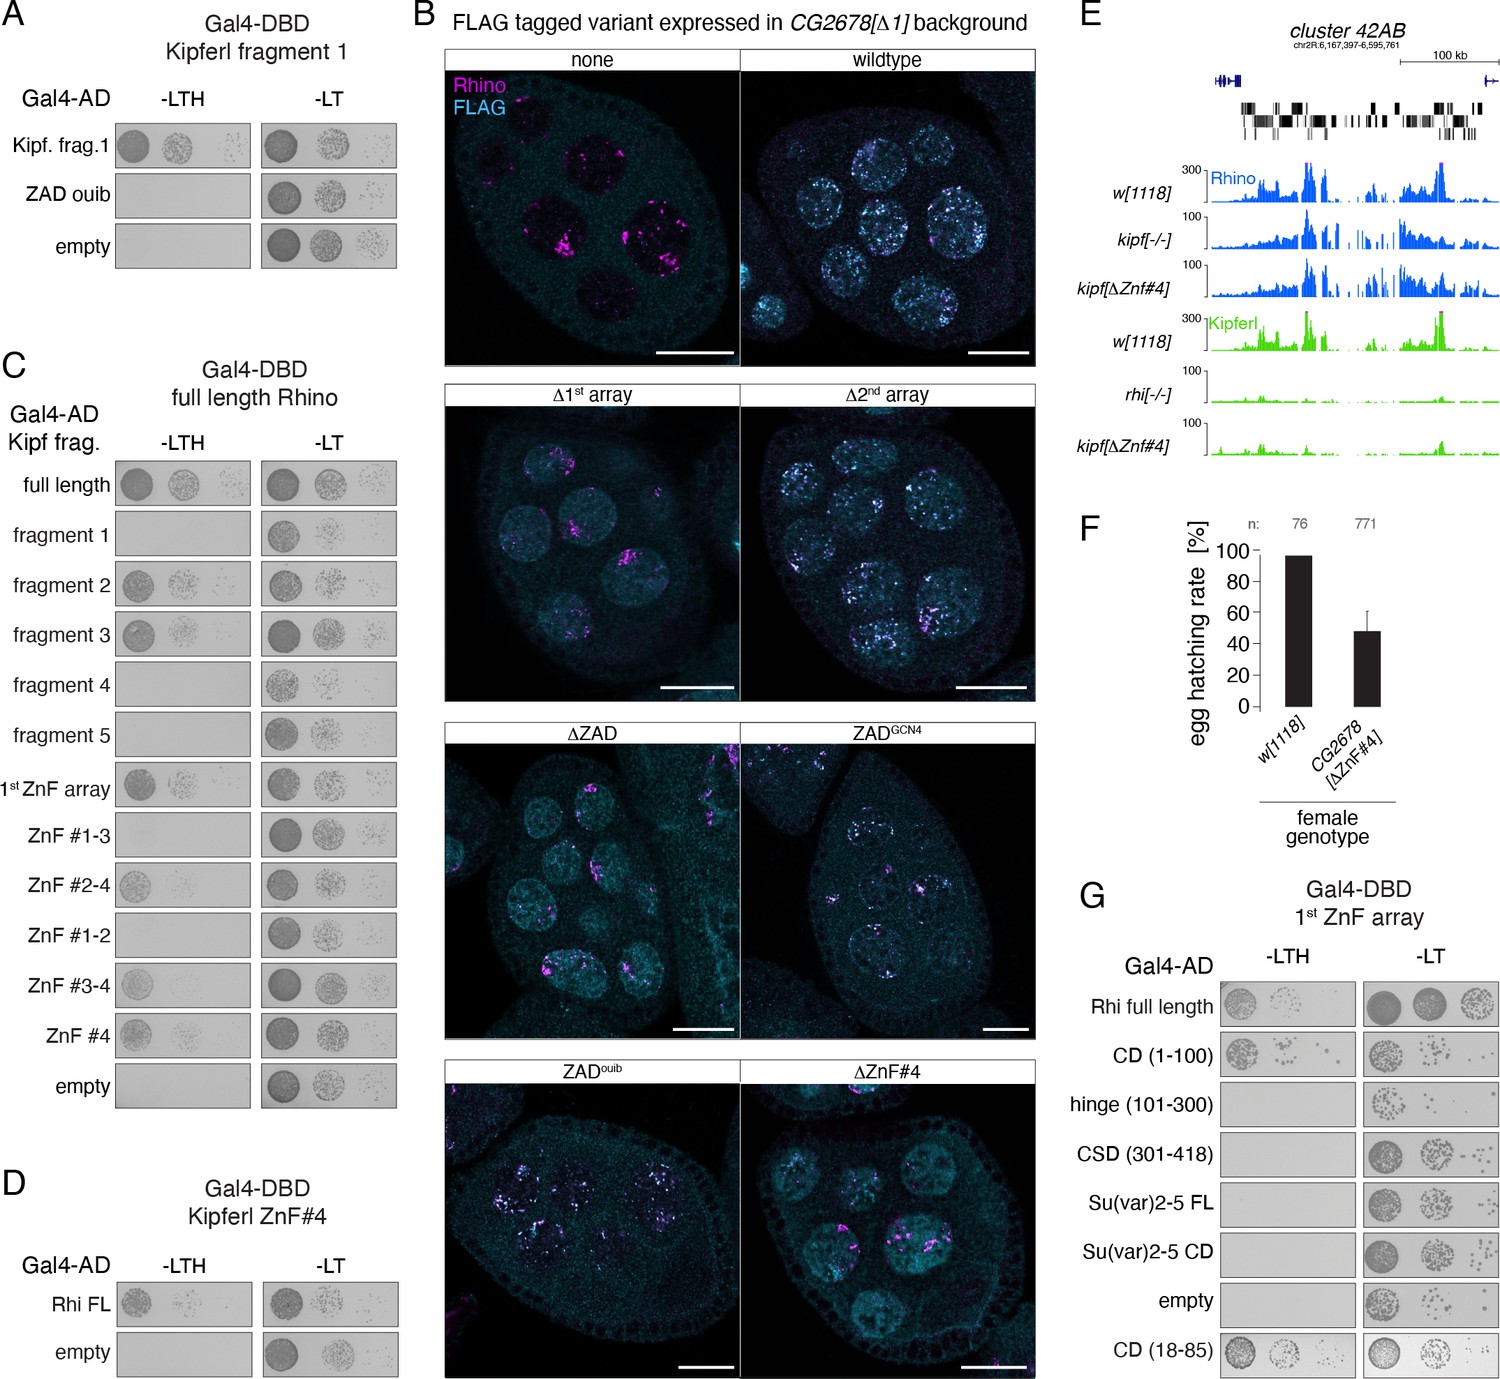
Structure-function analysis of Kipferl’s DNA and Rhino binding activities.
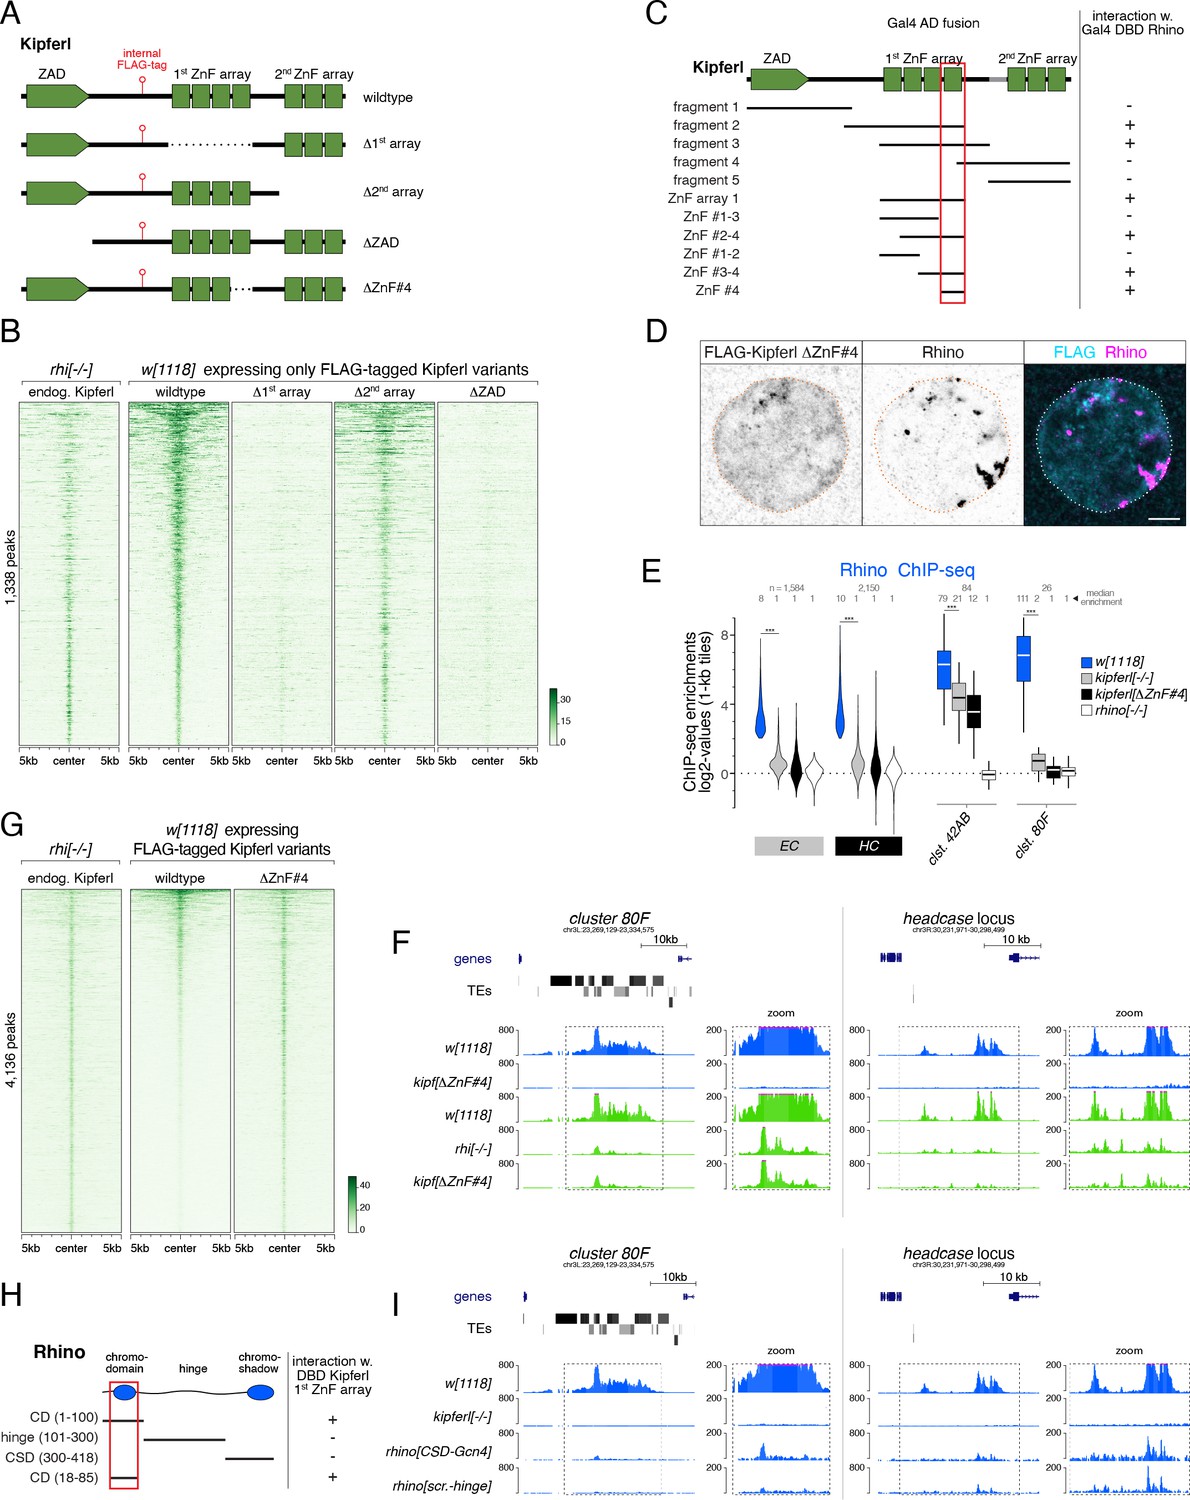
(A) Schematic representation of Kipferl rescue constructs harboring the wildtype protein sequence or indicated deletions, as well as an internal 3xFLAG tag. Rescue constructs were introduced into the endogenous kipferl locus via RMCE. (B) Heat map displaying Kipferl variant ChIP-seq signal centered on peaks bound by Kipferl in rhino mutants (data sorted by the ChIP signal detected for the wildtype Kipferl rescue construct; shown are only peaks that are Kipferl-bound in ovaries expressing wildtype tagged Kipferl). (C) Schematic overview of yeast two-hybrid experiments determining the minimal Rhino-interacting fragment in the Kipferl protein. Positive interactions between Kipferl fragments fused to the Gal4 activating domain (AD) and Rhino fused to the Gal4 DNA binding domain (DBD) are indicated. The minimal Kipferl fragment required for the Rhino interaction is highlighted in red (the grey bar indicates a 25 amino acid exon not contained in the reference genome which we identified in a subset of lab strains and included here for completeness). (D) Confocal images of a representative nurse cell nucleus depicting localization of Kipferl lacking ZnF#4 and Rhino in flies expressing only KipferlΔZnF#4 (scale bar: 5 µm). (E) Violin plots showing the average log2-fold enrichment of Rhino ChIP-seq signal over input for Rhino-bound 1-kb tiles (classified in Figure 1D) in w1118 (n=2), kipferl mutant (n=3), KipferlΔZnF#4 (n=1) and rhino mutant (n=1) ovaries. *** corresponds to p<0.001 based on student’s t-test. Box plots show median (center line), with interquartile range (box) and whiskers indicate 1.5x interquartile range. (F) USCS genome browser tracks showing ChIP-seq signal (coverage per million sequenced reads for one representative replicate) for indicated proteins and genotypes at piRNA cluster 80F (left) and the headcase locus (right). (G) Heat map showing indicated ChIP-seq signal, centered on narrow Kipferl peaks detected in two independent ChIP-seq experiments of rhino mutant ovaries (data sorted by ChIP-seq signal detected for wildtype Kipferl rescue). (H) Schematic overview of yeast two-hybrid experiments determining the minimal Kipferl-interacting fragment in Rhino. Positive interactions between Rhino fragments fused to the Gal4 activating domain (AD) and the first ZnF array of Kipferl fused to the Gal4 DNA binding domain (DBD) are indicated. The minimal Rhino fragment required for the Kipferl interaction is highlighted in red. (I) USCS genome browser tracks showing ChIP-seq signal (coverage per million sequenced reads for one replicate) for indicated Rhino variants at piRNA cluster 80F (left) or the headcase locus (right).
Figure 6—figure supplement 1
Kipferl's 4th zinc finger is required and sufficient for the interaction with Rhino.
(A, C, D) Yeast two-hybrid assay on selective (left) and nonselective medium (right). AD: activation domain; DBD: DNA binding domain. Fragment identity is indicated in Figure 6C. (B) Confocal images showing entire egg chambers with immunofluorescence stainings for Rhino (magenta) and indicated FLAG-tagged Kipferl variants (cyan) (scale bars: 20 µm). (E) USCS genome browser tracks showing indicated ChIP-seq signal as coverage per million sequenced reads in indicated genotypes at piRNA cluster 42AB for one experiment. (F) Bar graph indicating average embryo hatching rate of eggs laid by w1118 control females in comparison to females harboring a deletion of Kipferl’s ZnF #4. Data represents average of three technical replicates for KipferΔZnF#4 (with error bar representing the standard deviation of the mean) and one replicate for w1118. Total number of eggs laid is indicated as n. (G) Yeast two-hybrid assay on selective (left) and nonselective medium (right). FL: full length. AD: activation domain; DBD: DNA binding domain. Fragment identity is indicated in Figure 6H.
Figure 7 with 1 supplement
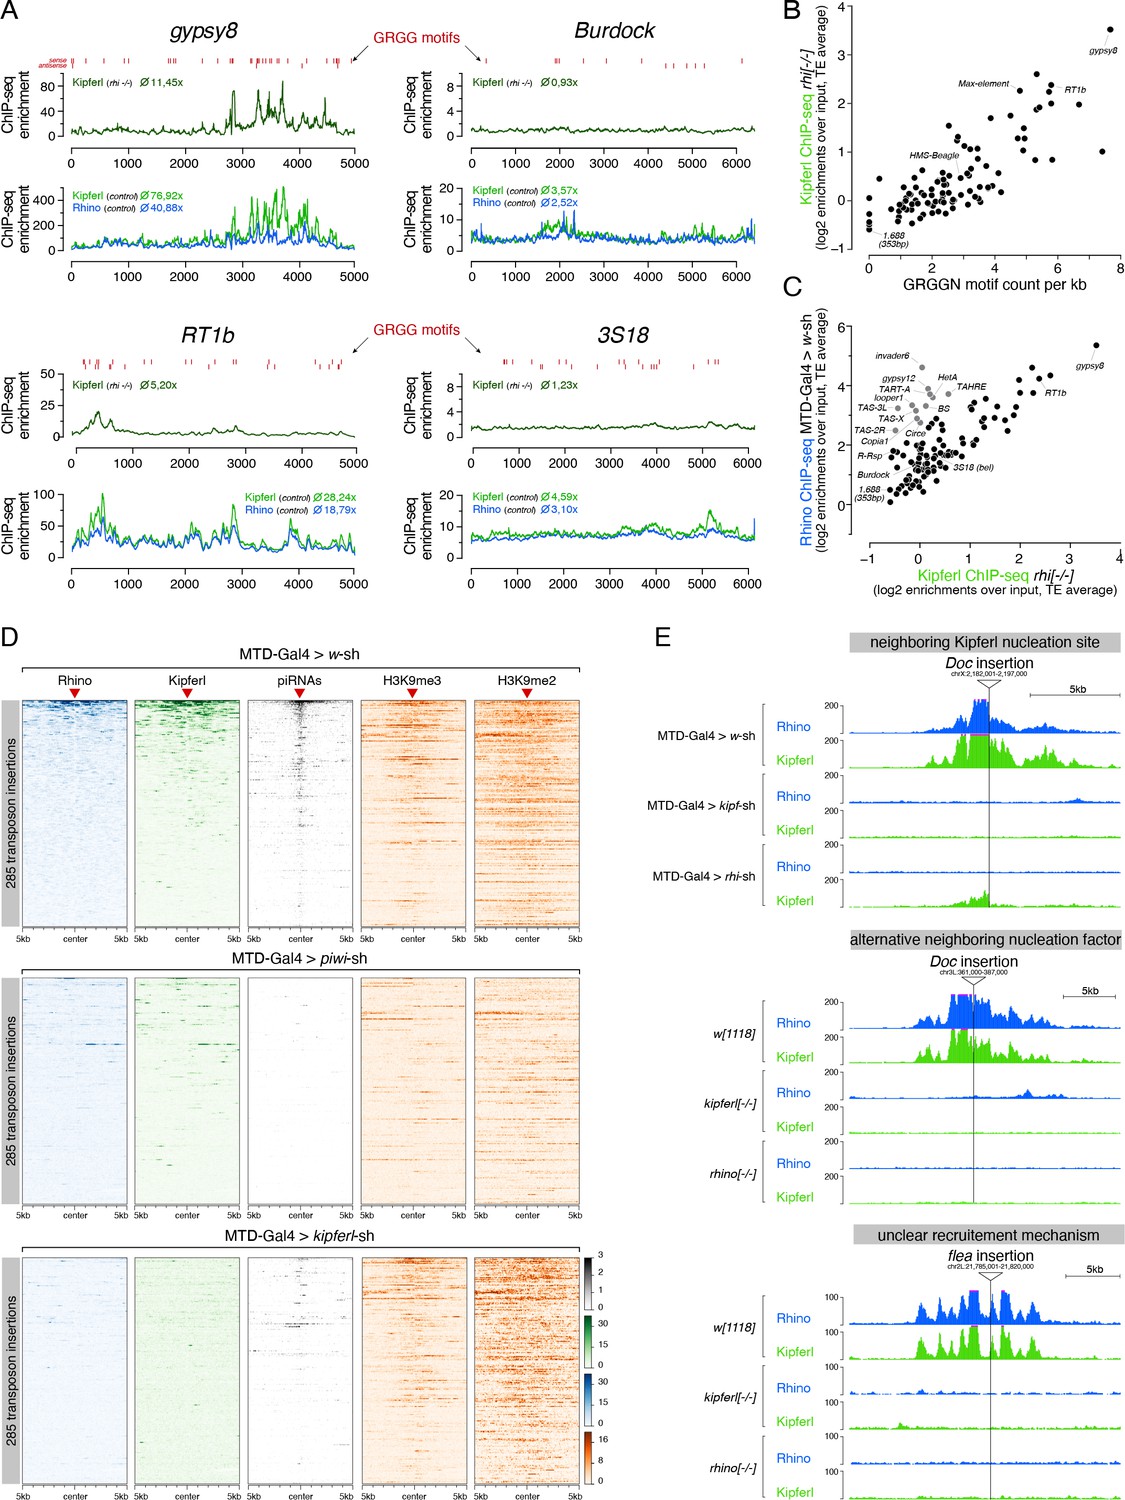
Kipferl is required for the establishment of Rhino domains at stand-alone transposon loci.
(A) ChIP-seq enrichment profiles on consensus sequences of transposons with high (gypsy8 and Rt1b) or low (Burdock and 3S18) number of Kipferl DNA binding motifs per kb sequence. Indicated ChIP-seq signals are displayed as average enrichment over input in two (Kipferl) or three replicates (Rhino) of ovaries from rhino mutant (top tracks) or MTD-Gal4 >wsh control ovaries (bottom tracks). Red bars indicate motif instances on the sense or antisense strand. Numbers indicate average enrichment across the entire element. (B) Scatter plot correlating the GRGGN motif count (normalized to element length) to the Rhino-independent Kipferl ChIP-seq enrichment for each transposon (ChIP-seq enrichments depict average of two independent experiments). (C) Scatter plot depicting the relation between wildtype Rhino ChIP-seq enrichments and Rhino-independent Kipferl ChIP-seq enrichments per transposon (average of two (Kipferl) or three (Rhino) independent experiments; elements indicated in grey are bound by Rhino in a largely Kipferl-independent manner, see also Figure 7—figure supplement 1D). (D) Heat maps depicting indicated ChIP-seq signal in the genomic regions flanking 285 euchromatic stand-alone insertions (red triangles) of Rhino-dependent transposons with low Rhino-independent Kipferl binding (data sorted by the ChIP-seq signal detected for Rhino in MTD-Gal4 >w-sh ovaries). (E) UCSC genome browser tracks of stand-alone transposon insertions found in MTD-Gal4 or w1118 strains, depicting examples of different potential modes of Kipferl dependency. ChIP-seq signal is shown as coverage per million reads for one representative replicate.
Figure 7—figure supplement 1
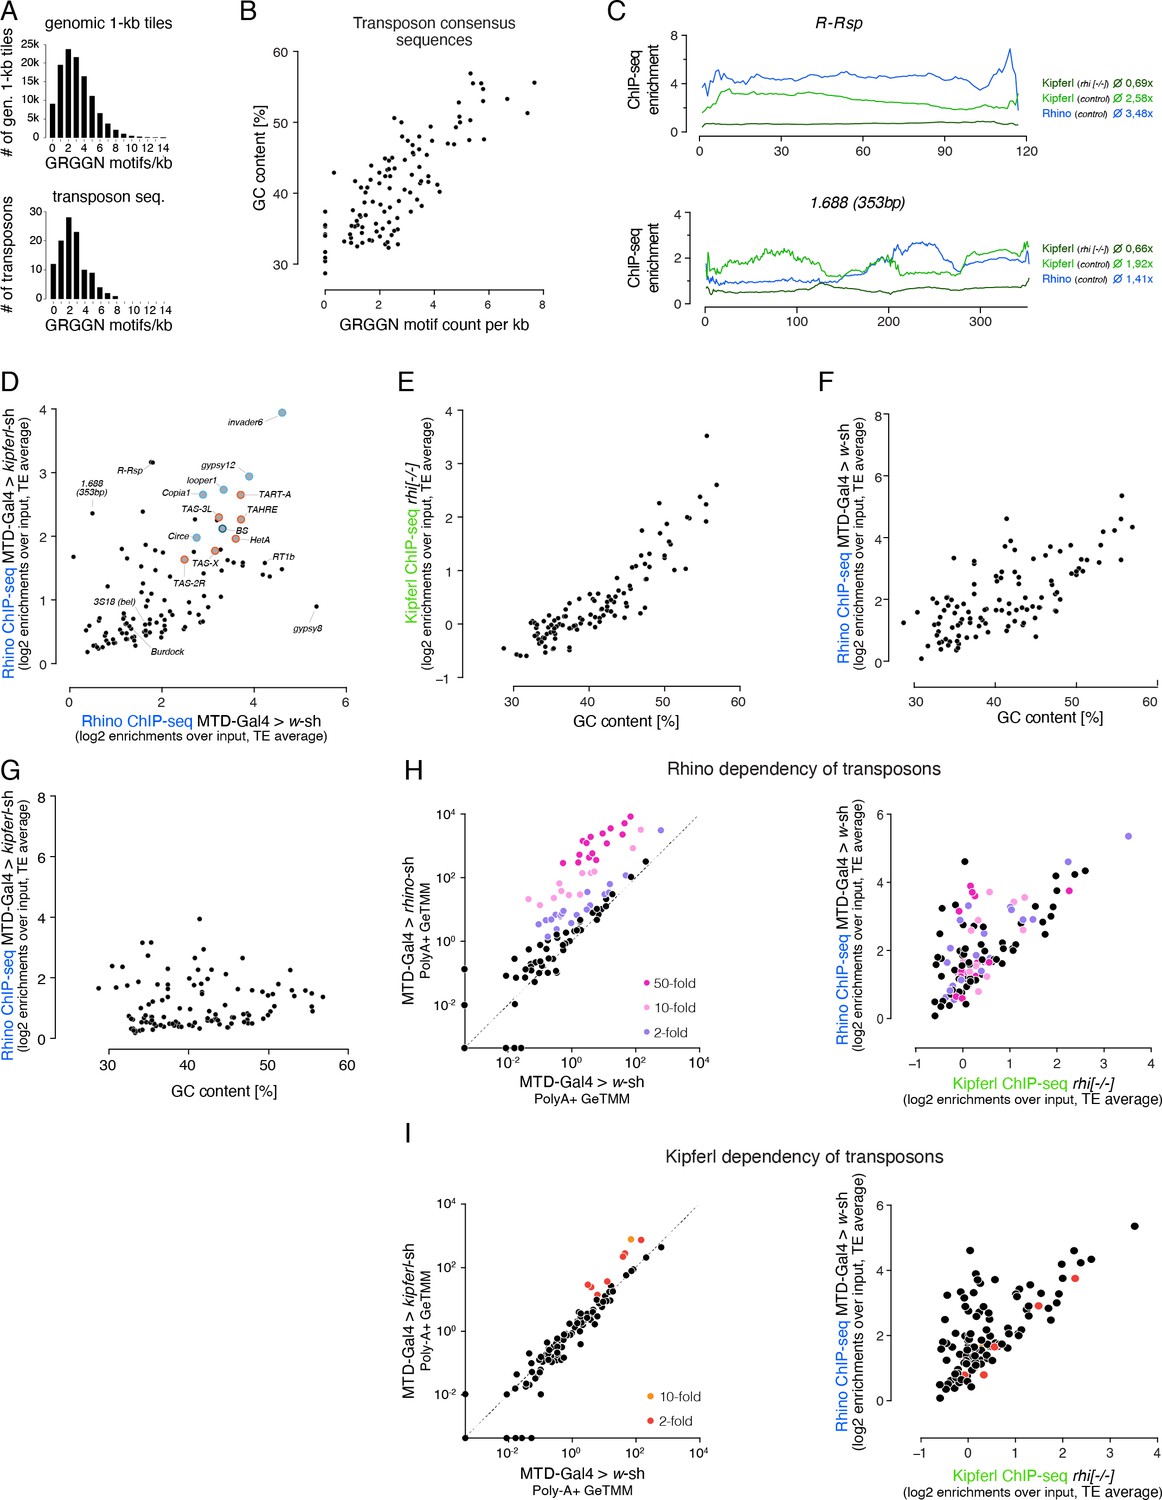
GC content and number of GRGGN motifs are predictive of Kipferl and Rhino binding at transposon loci.
(A) Bar graphs showing the distribution of motif frequency in all genomic 1-kb tiles (top) and in transposon consensus sequences (bottom). (B) Scatter plot of overall GC content per transposon sequence versus the number of GRGGN motifs normalized to transposon length. (C) ChIP-seq enrichment profiles (over input) along the length of representative members of the Rsp and 1.688 family of Satellite repeats (both repeats lack Kipferl GRGGN motifs). Indicated ChIP-seq signals are displayed as average enrichment over input in two (Kipferl) or three replicates (Rhino) of ovaries from rhino mutant or control (MTD-Gal4 >w-sh) ovaries. Average enrichment across the entire element is indicated for each ChIP. (D) Scatter plot contrasting Rhino ChIP-seq enrichment (over input) on transposon sequences in control (n=3) versus kipferl-depleted (n=2) ovaries. Elements bound by Rhino independently of Kipferl (see Figure 7C) are enlarged and highlighted in grey (those elements with insertions in piRNA clusters 42AB and 38C are additionally indicated in light and dark blue, respectively, and telomeric elements are indicated in red). (E, F) Scatter plots correlating the overall GC nucleotide content per transposon to the ChIP-seq enrichment detected for Kipferl in rhino knock out ovaries (F) and for Rhino in wildtype (G) or kipferl-depleted ovaries. (G) Scatter plot comparing the average Rhino ChIP-seq enrichment in two replicate experiments on kipferl-depleted ovaries to the overall GC nucleotide content per transposon. (H, I) Left: Classification of transposons into different grades of Rhino (H) and Kipferl (I) dependency based on poly-adenylated sense transcripts detected in wildtype control ovaries versus rhino or kipferl-depleted ovaries (three replicates each). Values are displayed as Gene length corrected trimmed mean of M-values (GeTMM). Right: Scatter plot analogous to Figure 7C depicting the distribution of Rhino (H) or Kipferl (I) dependent elements in respect to their occupancy by Rhino in MTD-Gal4 >w-sh ovaries, as well as their Rhino-independent Kipferl affinity.
Tables
Appendix 1—key resources table
| Reagent type (species) or resource | Designation | Source or reference | Identifiers | Additional information |
|---|---|---|---|---|
| Antibody | anti-CG2678#2 (Rabbit polyclonal) | This paper | CG2678#2_4P39glyc, raised against Kipferl peptide R171-I190 | Anti-Kipferl polyclonal antibody, available from Brennecke lab; ChIP (7 µL per IP) |
| Antibody | anti-CG2678 M4 (Mouse monoclonal) | This paper | M4 3A6-3E1-E11, raised against Kipferl amino acids M2-K188 | Anti-Kipferl monoclonal WB antibody, available from Brennecke lab; WB (1:250) |
| Antibody | anti-CG2678 M3 (Mouse monoclonal) | This paper | M3 2 C5-3C3, raised against Kipferl amino acids M2-K188 | Anti-Kipferl monoclonal IF antibody, available from Brennecke lab; IF (1:500) |
| Antibody | anti-Rhino (Mouse monoclonal) | This paper | 6B7-F2, raised against full length denatured Rhino protein | Anti-Rhino monoclonal WB antibody, available from Brennecke lab; WB (1:10) |
| Antibody | anti-Rhino (Rabbit polyclonal) | Mohn et al., 2014 | Rhino#1_3573gly | ChIP (5 µL per IP), IF (1:1000) |
| Antibody | anti-Deadlock (Mouse monoclonal) | Andersen et al., 2017 | 5B5-6D7-3H10 | IF (1:100) |
| Antibody | anti-Nxf3 (Mouse monoclonal) | ElMaghraby et al., 2019 | 8E4-F1 | IF (1:50) |
| Antibody | Histone H3K9me3 antibody (Rabbit polyclonal) | Active motif | ID_source:39161 | ChIP (5 µL per IP), IF (1:100) |
| Antibody | Anti-Histone H3 (di methyl K9) (mouse monoclonal) | Abcam | ID_source:mAbcam1220 | ChIP (5 µL per ChIP) |
| Antibody | C1A9 HP1 (Su(var)2–5) (Mouse monoclonal) | DSHB | ID_source:C1A9 | ChIP (5 µL per IP), IF (1:100) |
| Antibody | ANTI-FLAG(R) M2 (Mouse monoclonal) | Sigma Aldrich | ID_source:F1804-1MG | ChIP (2 µL per IP), IF (1:2000) |
| genetic reagent (D. melanogaster) | w1118;;; | Bloomington stock 3605 | w1118 | wildtype, cultivated in our lab for several years |
| genetic reagent (D. melanogaster) | w;;; | Susan Celniker | iso1 | wildtype |
| genetic reagent (D. melanogaster) | Cog-GAL4; NGT-GAL4; nos-GAL4; | Bloomington stock 31777 | Referred to as 'maternal triple driver' (MTD) | Gal4 driver |
| genetic reagent (D. melanogaster) | w;; pW20>w_sh[attP2]/TM3, Sb; | Mohn et al., 2014, VDRC-ID 313772 | white (CG2759) | RNAi line |
| genetic reagent (D. melanogaster) | w;; pW20>rhi_sh[attP2]/TM3, Sb; | Mohn et al., 2014, VDRC-ID 313156 | Rhino (CG10683) | RNAi line |
| genetic reagent (D. melanogaster) | w;; pW20>CG2678_sh2 [attP2]/TM3, Sb; | this paper | Kipferl (CG2678) | Kipferl RNAi line, available from VDRC; sh-oligo sequence: ctagcagtCTCGAAGG CTTTCATGCGTAA tagttatattcaagcata TTACGCATGAAA GCCTTCGAGgcg |
| genetic reagent (D. melanogaster) | w;; pGLKD >piwi_sh2 [attP2]/TM3,Sb; | Senti and Brennecke, 2010, VDRC-ID 313199 | Piwi (CG6122) | RNAi line |
| genetic reagent (D. melanogaster) | w;; CG2678[Δ1] (dsRed+)/TM3,Sb; | this paper | Kipferl (CG2678) | Kipferl mutant allele, available from VDRC; LB1-RMCEm31 |
| genetic reagent (D. melanogaster) | w;; CG2678[Δ2](dsRed+)/TM3,Sb; | this paper | Kipferl (CG2678) | Kipferl mutant allele, available from VDRC; LB1-RMCEm21; has aberrant deregulation of blood transposon |
| genetic reagent (D. melanogaster) | w;; CG2678[fs1]/TM3,Sb; | this paper | Kipferl (CG2678) | Kipferl mutant allele, available from VDRC; LB1-FSm52; indel (–7); sequence CCTGCGT CCTGGCCGTGC------- TTTCCGGTTCAAGT GGCAAAGCGAGCAGAG |
| genetic reagent (D. melanogaster) | w;; CG2678RMCE[S161- 3xFLAG]/TM3,Sb; | this paper | Kipferl (CG2678) | Kipferl tagged construct (RMCE), available from VDRC; wildtype 3xFLAG tagged rescue construct inserted into LB1-RMCEm31 |
| genetic reagent (D. melanogaster) | w; prhino >3xFLAG/V5/ Precission/GFP- Rhino[attP40],rhi[g2m11]/CyO; CG2678[Δ1](dsRed+), nxf3[A2-2]/TM3,Sb; | this paper | Rhino, Kipferl, Nxf3 | mutant allele combination, available from VDRC; Nxf3[A2-2] allele published in ElMaghraby et al., 2019 |
| genetic reagent (D. melanogaster) | w; prhino >3xFLAG/V5/Precission/GFP-Rhino[attP40],rhi[g2m11]/CyO;; | this paper | Rhino (CG10683) | tagged Rhino construct, available from VDRC |
| genetic reagent (D. melanogaster) | w; prhino >3xFLAG/V5/Precission/GFP-Rhino[attP40],rhi[g2m11]/CyO; CG2678[Δ1](dsRed+)/TM3,Sb; | this paper | Rhino, Kipferl | mutant allele combination, available from VDRC |
| genetic reagent (D. melanogaster) | w; rhi[18-7]/CyO;; | Andersen et al., 2017, VDRC-ID 313488 | Rhino (CG10683) | mutant allele |
| genetic reagent (D. melanogaster) | w; rhi[g2m11]/CyO;; | this paper | Rhino (CG10683) | Rhino mutant allele, available from VDRC; indel –7; seq: ATGTCT CGCAACCA-------cc-A ATCTTGGTCTGGTC GATGCACCGCCTAATG |
| genetic reagent (D. melanogaster) | w;; pUASz >CG2678[attP2]; | this paper | Kipferl (CG2678) | tagged Kipferl construct, available from VDRC; intron containing CG2678 sequence including non-mapped exon3 |
| genetic reagent (D. melanogaster) | w;; CG2678RMCE [ΔZnFarray1-S161- 3xFLAG]/TM3,Sb; | this paper | Kipferl (CG2678) | tagged Kipferl construct (RMCE), available from VDRC; 3xFLAG tagged ZnF array 1 deletion construct inserted into LB1-RMCEm31 |
| genetic reagent (D. melanogaster) | w;; CG2678RMCE [ΔZnFarray2-S161- 3xFLAG]/TM3,Sb; | this paper | Kipferl (CG2678) | tagged Kipferl construct (RMCE), available from VDRC; 3xFLAG tagged ZnF array 2 deletion construct inserted into LB1-RMCEm31 |
| genetic reagent (D. melanogaster) | w;; CG2678RMCE [3xFLAG-ΔZAD]/TM3,Sb; | this paper | Kipferl (CG2678) | tagged Kipferl construct (RMCE), available from VDRC; 3xFLAG tagged ZAD deletion construct inserted into LB1-RMCEm31 |
| genetic reagent (D. melanogaster) | w;; CG2678RMCE[3xFLAG-ZAD::GCN4]/TM3,Sb; | this paper | Kipferl (CG2678) | tagged Kipferl construct (RMCE), available from VDRC; 3xFLAG tagged ZAD GCN4 replacement construct inserted into LB1- RMCEm31 |
| genetic reagent (D. melanogaster) | w;; CG2678RMCE [3xFLAG-ouibZAD]/TM3,Sb; | this paper | Kipferl (CG2678) | Tagged Kipferl construct (RMCE), available from VDRC; 3xFLAG tagged ZAD replacement construct inserted into LB1-RMCEm31 |
| genetic reagent (D. melanogaster) | w;; CG2678RMCE[ΔZnF#4-S161-3xFLAG]/TM3,Sb; | this paper | Kipferl (CG2678) | tagged Kipferl construct (RMCE), available from VDRC; 3xFLAG tagged ZnF4 deletion construct inserted into LB1-RMCEm31 |
| genetic reagent (D. melanogaster) | w; prhino >3xFLAG/V5/ Precission/GFP- Rhino(CSD::GCN4) [attP40],rhi[g3m13]/CyO;; | this paper | Rhino (CG10683) | tagged Rhino construct, available from VDRC; Rhino indel –14; seq: TGGGCGTCCCCAGG---------------AGCGGTTTTCCGAA CGAGAACAACACC, Rhino CSD was replaced by the Gcn4 dimerization domain, homozygous not viable, crossed to w; rhi[18-7]/CyO;; for experiments |
| genetic reagent (D. melanogaster) | w; prhino >3xFLAG/ V5/Precission/GFP- Rhino(art.hinge) [attP40],rhi[g3m13]/CyO;; | this paper | Rhino (CG10683) | tagged Rhino construct, available from VDRC; Rhino indel –14; seq: TGGGCGTCCCCAGG--------------- AGCGGTTTTCCGA ACGAGAACAACACC, Rhino hinge was replaced by a scrambled amino acid sequence of the same length, homozygous not viable, crossed to w; rhi[18-7]/CyO;; for experiments |
| genetic reagent (D. melanogaster) | w;; prhino >3xFLAG/ V5/Precission/GFP- Su(var)2-5[attP2]; | this paper | HP1a (CG8409) | tagged HP1a construct, available from VDRC |
| genetic reagent (D. melanogaster) | w, 3xFLAG/V5/ Precission/GFP-HP1b;;; | this paper | HP1b (CG7041) | Endogenously tagged HP1b, available from VDRC |
| genetic reagent (D. melanogaster) | w;; 3xFLAG/V5/ Precission/GFP-HP1c; | this paper | HP1c (CG6990) | Endogenously tagged HP1c, available from VDRC |
| genetic reagent (D. melanogaster) | w; peggless >TurboID- linker-vhhGFP-3xHA- NLS[attP40]/CyO;; | this paper | - | Transgenic construct, available from VDRC; TurboID biotin ligase fused to GFP nanobody |
| genetic reagent (D. melanogaster) | w;; 3xFLAG/V5/Precission/ GFP(replacing CG13741 CDS)-NLS [attP2]/TM3,Sb; | ElMaghraby et al., 2019 | Boot (CG13741) | tagged construct; nuclear GFP used as contol |
| Sequence-based reagent | Rhino_g2 | This paper | CRISRP guide RNA (indel) | GACCAAGATTTGGTCGCTGA |
| Sequence-based reagent | Rhino_g3 | This paper | CRISRP guide RNA (indel) | GTCCCCAGGTTCTGGTGAAG |
| Sequence-based reagent | CG2678_g1 | This paper | CRISRP guide RNA (RMCE left) | GTACAAATGATCAGTGCGA |
| Sequence-based reagent | CG2679_g2 | This paper | CRISRP guide RNA (RMCE right) | GAAGGCATTAAGTAGCATG |
| Sequence-based reagent | CG2678_g3 | This paper | CRISRP guide RNA (indel) | GAACCGGAAAGCATTCTGCA |
| Sequence-based reagent | HP1b_g2 | This paper | CRISRP guide RNA (N-terminal endogenous tagging) | CACAATGGCCGAATTCTCAG |
| Sequence-based reagent | HP1c_g2 | This paper | CRISRP guide RNA (N-terminal endogenous tagging) | GATGCGCTCCACCACGAAGT |
| Strain, strain background (Saccharomyces cerevisiae) | Matα, trp1-901, leu2-3, 112, ura3-52, his3-200, gal4Δ, gal80Δ, GAL2- ADE2, LYS2::GAL1-HIS3, met2::GAL7-lacZ | Mohn et al., 2014 | ||
| Strain, strain background (Saccharomyces cerevisiae) | MatA, trp1-901, leu2-3, 112, ura3-52, his3-200, gal4Δ, gal80Δ, GAL2- ADE2, LYS2::GAL1-HIS3, met2::GAL7-lacZ | Mohn et al., 2014 | ||
| Strain, strain background (Saccharomyces cerevisiae) | pOAD | Mohn et al., 2014 | in YGS2 (MatA) | |
| Strain, strain background (Saccharomyces cerevisiae) | pOAD-Rhino | Mohn et al., 2014 | in YGS2 (MatA) | |
| Strain, strain background (Saccharomyces cerevisiae) | pOBD-Rhino | Mohn et al., 2014 | in YGS1 (Matα) | |
| Strain, strain background (Saccharomyces cerevisiae) | pOAD-HP1a | Mohn et al., 2014 | in YGS2 (MatA) | |
| Strain, strain background (Saccharomyces cerevisiae) | pOAD-Rhino(1-100) | Mohn et al., 2014 | in YGS2 (MatA) | |
| Strain, strain background (Saccharomyces cerevisiae) | pOAD-Rhino(101-300) | Mohn et al., 2014 | in YGS2 (MatA) | |
| Strain, strain background (Saccharomyces cerevisiae) | pOAD-Rhino(301-418) | Mohn et al., 2014 | in YGS2 (MatA) | |
| Strain, strain background (Saccharomyces cerevisiae) | pOBD-CG2678-ZF4nolinker | this paper | Y2H construct, available from Brennecke lab; in YGS1 (Matα) | |
| Strain, strain background (Saccharomyces cerevisiae) | pOBD-CG2678-190-311 | this paper | Y2H construct, available from Brennecke lab; in YGS1 (Matα) | |
| Strain, strain background (Saccharomyces cerevisiae) | pOAD-CG2678FL | this paper | Y2H construct, available from Brennecke lab; in YGS2 (MatA) | |
| Strain, strain background (Saccharomyces cerevisiae) | pOAD-CG2678frag1 | this paper | Y2H construct, available from Brennecke lab; in YGS2 (MatA) | |
| Strain, strain background (Saccharomyces cerevisiae) | pOAD-CG2678frag2 | this paper | Y2H construct, available from Brennecke lab; in YGS2 (MatA) | |
| Strain, strain background (Saccharomyces cerevisiae) | pOAD-CG2678frag3 | this paper | Y2H construct, available from Brennecke lab; in YGS2 (MatA) | |
| Strain, strain background (Saccharomyces cerevisiae) | pOAD-CG2678frag4 | this paper | Y2H construct, available from Brennecke lab; in YGS2 (MatA) | |
| Strain, strain background (Saccharomyces cerevisiae) | pOAD-CG2678frag5 | this paper | Y2H construct, available from Brennecke lab; in YGS2 (MatA) | |
| Strain, strain background (Saccharomyces cerevisiae) | pOAD-CG2678-ZF1-2 | this paper | Y2H construct, available from Brennecke lab; in YGS2 (MatA) | |
| Strain, strain background (Saccharomyces cerevisiae) | pOAD-CG2678-ZF1-3 | this paper | Y2H construct, available from Brennecke lab; in YGS2 (MatA) | |
| Strain, strain background (Saccharomyces cerevisiae) | pOAD-CG2678ZF2-4 | this paper | Y2H construct, available from Brennecke lab; in YGS2 (MatA) | |
| Strain, strain background (Saccharomyces cerevisiae) | pOAD-CG2678ZF3-4 | this paper | Y2H construct, available from Brennecke lab; in YGS2 (MatA) | |
| Strain, strain background (Saccharomyces cerevisiae) | pOAD-CG2678ZF4nolinker | this paper | Y2H construct, available from Brennecke lab; in YGS2 (MatA) | |
| Strain, strain background (Saccharomyces cerevisiae) | pOAD-OuibZAD | this paper | Y2H construct, available from Brennecke lab; in YGS2 (MatA) | |
| Strain, strain background (Saccharomyces cerevisiae) | pOAD-Rhi19-85 | this paper | Y2H construct, available from Brennecke lab; in YGS2 (MatA) | |
| Strain, strain background (Saccharomyces cerevisiae) | pOAD-CG2678-190-311 | this paper | Y2H construct, available from Brennecke lab; in YGS2 (MatA) | |
| Strain, strain background (Saccharomyces cerevisiae) | pOBD-CG2678frag1 | this paper | Y2H construct, available from Brennecke lab; in YGS1 (Matα) | |
| Strain, strain background (Saccharomyces cerevisiae) | pOAD-HP1CD | this paper | Y2H construct, available from Brennecke lab; in YGS2 (MatA) |
Additional files
-
Supplementary file 1
Chromosomal coordinates of major heterochromatic and euchromatic compartments used in this study.
- https://cdn.elifesciences.org/articles/80067/elife-80067-supp1-v1.xlsx
-
Supplementary file 2
Putative protein-protein interactors of Rhino identified through a yeast two-hybrid screen.
- https://cdn.elifesciences.org/articles/80067/elife-80067-supp2-v1.xlsx
-
Supplementary file 3
Sequences of RNA FISH probes used in this study.
- https://cdn.elifesciences.org/articles/80067/elife-80067-supp3-v1.xlsx
-
Supplementary file 4
Consensus sequences of transposable elements analyzed in this study.
- https://cdn.elifesciences.org/articles/80067/elife-80067-supp4-v1.xlsx
-
Supplementary file 5
Chromosomal coordinates of stand-alone transposon insertions identified in the MTD-Gal4 background that are absent in the reference genome.
- https://cdn.elifesciences.org/articles/80067/elife-80067-supp5-v1.xlsx
-
MDAR checklist
- https://cdn.elifesciences.org/articles/80067/elife-80067-mdarchecklist1-v1.pdf
Download links
A two-part list of links to download the article, or parts of the article, in various formats.
Downloads (link to download the article as PDF)
Open citations (links to open the citations from this article in various online reference manager services)
Cite this article (links to download the citations from this article in formats compatible with various reference manager tools)
The Drosophila ZAD zinc finger protein Kipferl guides Rhino to piRNA clusters
eLife 11:e80067.
https://doi.org/10.7554/eLife.80067


