Combined lineage tracing and scRNA-seq reveals unexpected first heart field predominance of human iPSC differentiation
- Stanford Cardiovascular Institute, Stanford University, United States
- Institute for Stem Cell Biology and Regenerative Medicine, Stanford University, United States
- Department of Pharmacy, Sungkyunkwan University, United States
- Division of Pediatric Cardiology, Department of Pediatrics, Stanford University, United States
- School of Medicine, University of California, San Diego, United States
- Department of Biomedicine, Aarhus University, Denmark
- Department of Pediatrics, Stanford University, United States
- Division of Cardiovascular of Medicine, Department of Medicine, Stanford University, United States
Figures
Figure 1 with 1 supplement
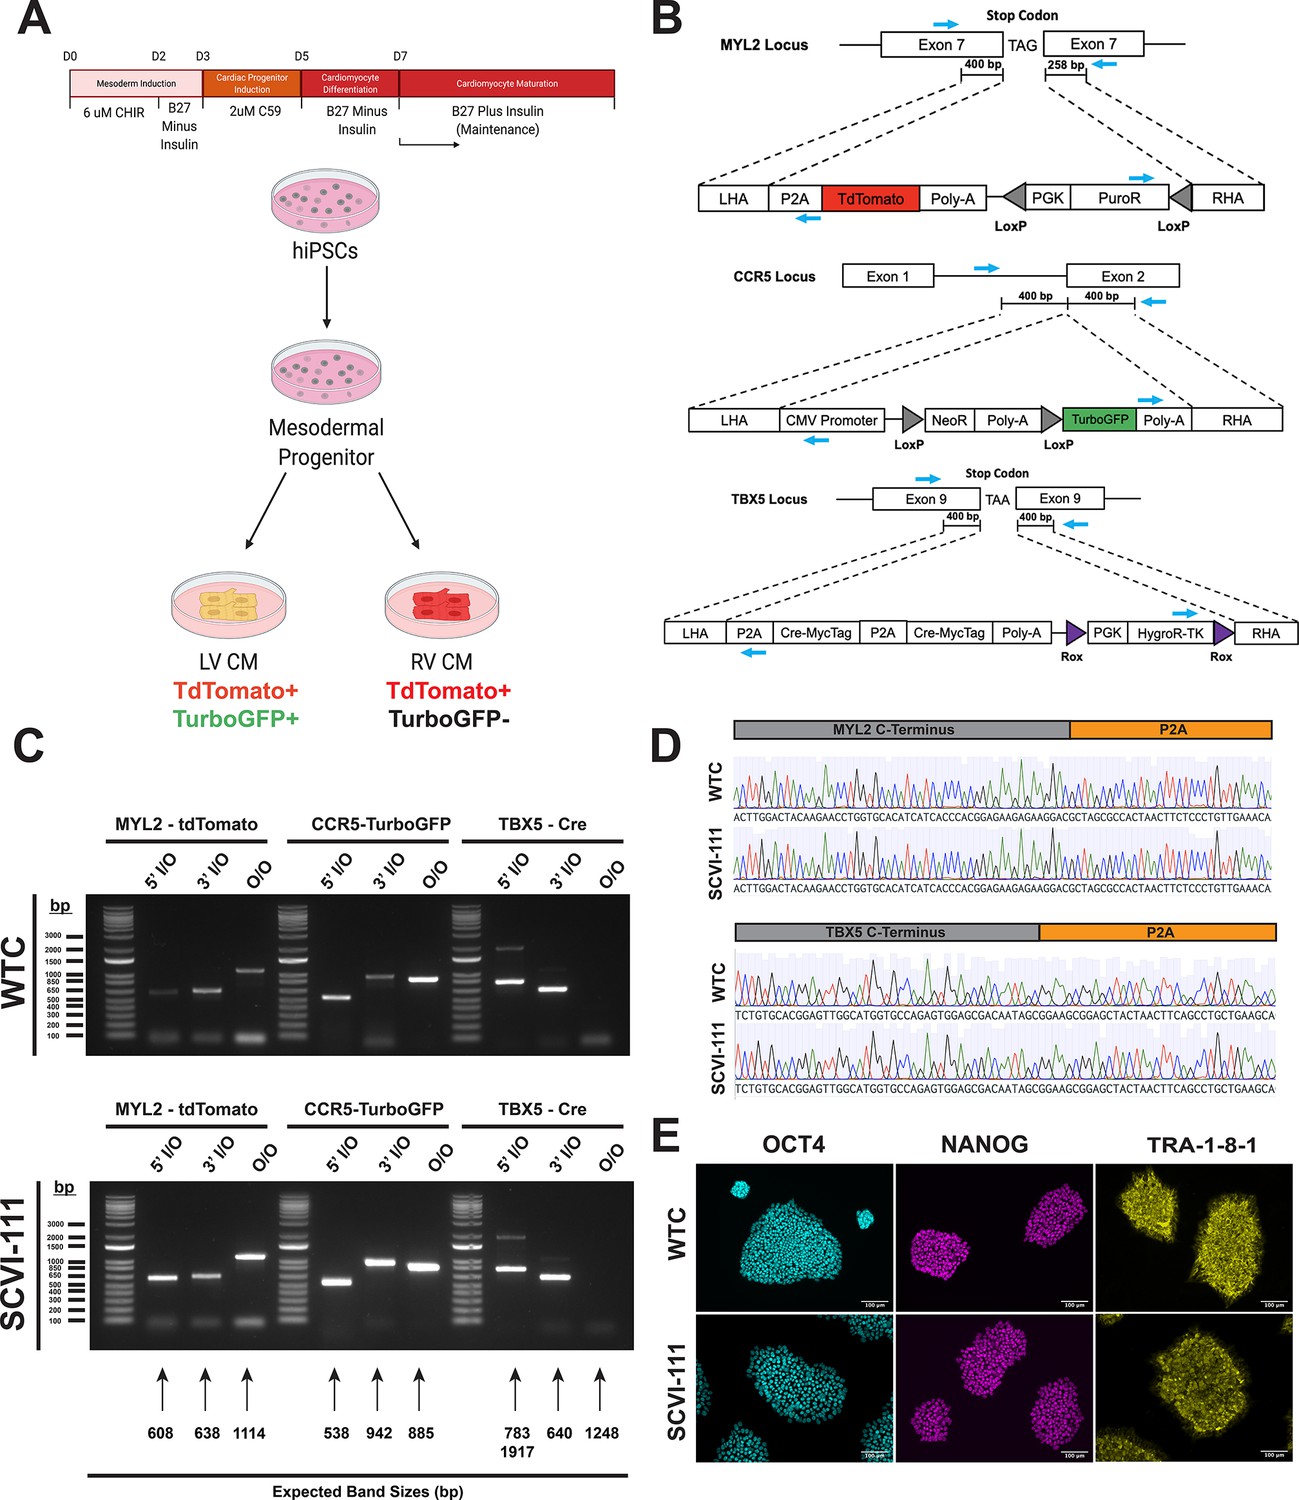
Integration of T-box transcription factor (TBX5)/myosin light chain-2 (MYL2) lineage tracing reporter system into human-induced pluripotent stem cells.
(A) Schematic of lineage tracing strategy for identifying left ventricular cardiomyocytes in vitro. (B) CRISPR/Cas9 gene targeting strategy of genetic constructs for TBX5 lineage tracing and MYL2 direct reporter. MYL2, CCR5, and TBX5 constructs contain Puromycin (PuroR), Neomycin (NeoR), and Hygromycin (HygroR) resistance cassettes for the selection of human-induced pluripotent stem cell (hiPSC) after targeting of genetic constructs. Blue arrows indicate the location of PCR primer binding sites for confirmation of construct integration. LHA = Left Homology Arm, RHA = Right Homology Arm. (C) Inside-Outside (I/O) and Outside-Outside (O/O) PCR DNA agarose gels for confirmation of integration of genetic constructs into MYL2, CCR5, and TBX5 genetic loci. Inside, represents a primer inside the construct region while Outside represents a primer that binds outside the homology arm regions of genetic constructs. Expected band sizes are noted with arrows for each lane. (D) Sanger sequencing traces for C-terminal regions of MYL2 and TBX5 genes indicating in-frame integration of P2A site. (E) Bright field and immunofluorescence images of pluripotency marker expression in hiPSC lines after integration of all three genetic constructs.
-
Figure 1—source data 1
Raw and uncropped DNA electrophoresis image data for genotyping PCR for genetic constructs presented in Figure 1C.
- https://cdn.elifesciences.org/articles/80075/elife-80075-fig1-data1-v2.zip
-
Figure 1—source data 2
Single guide RNA sequences used for gene targeting.
- https://cdn.elifesciences.org/articles/80075/elife-80075-fig1-data2-v2.xlsx
-
Figure 1—source data 3
Genotyping primer sequences for identification of genetic constructs.
- https://cdn.elifesciences.org/articles/80075/elife-80075-fig1-data3-v2.xlsx
Figure 1—figure supplement 1
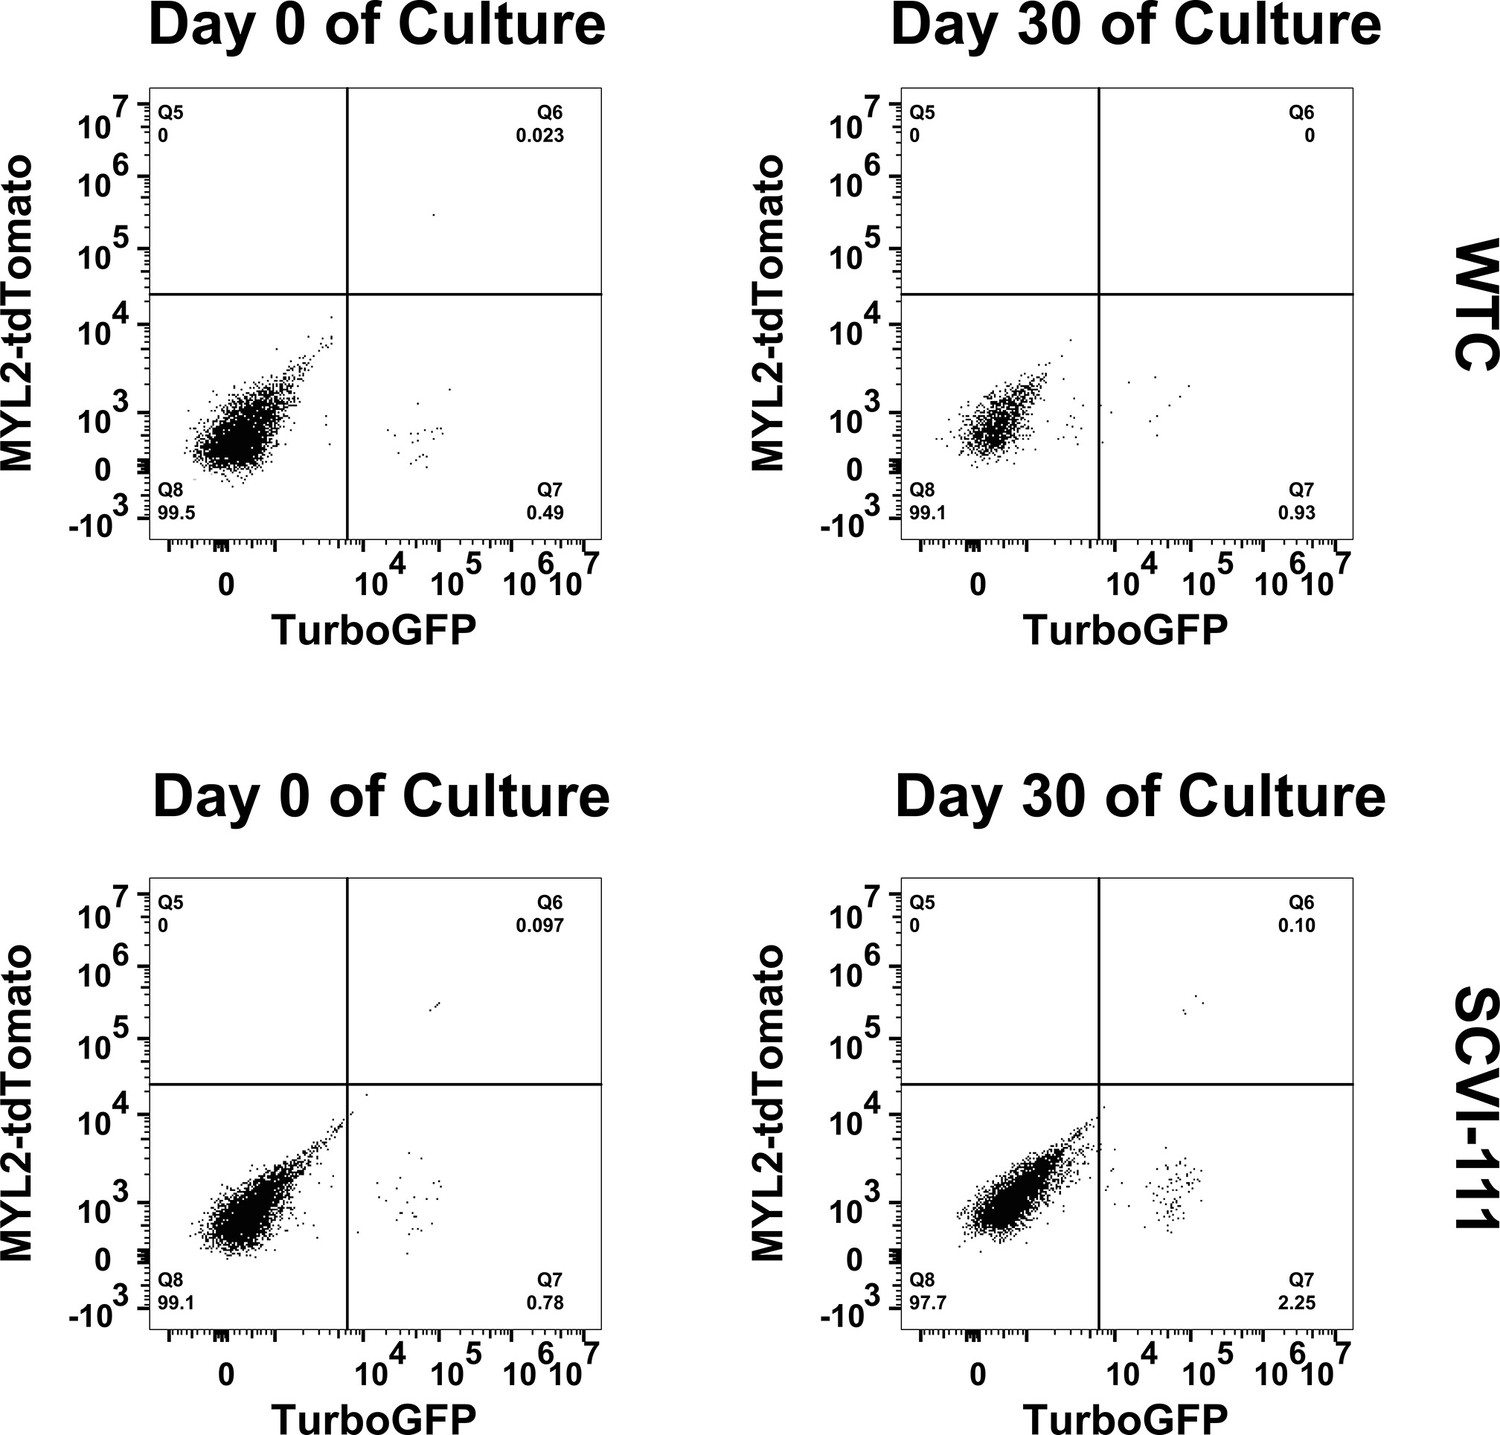
Flow cytometry analysis of TurboGFP expression in genome-edited human-induced pluripotent stem cells (hiPSCs) after 30 days of pluripotency culture.
Genome edited SCVI-111 and WTC were cultured in pluripotency media for 30 days. Flow cytometry plots are shown for day 0 of culture and day 30 of culture.
Figure 2 with 1 supplement
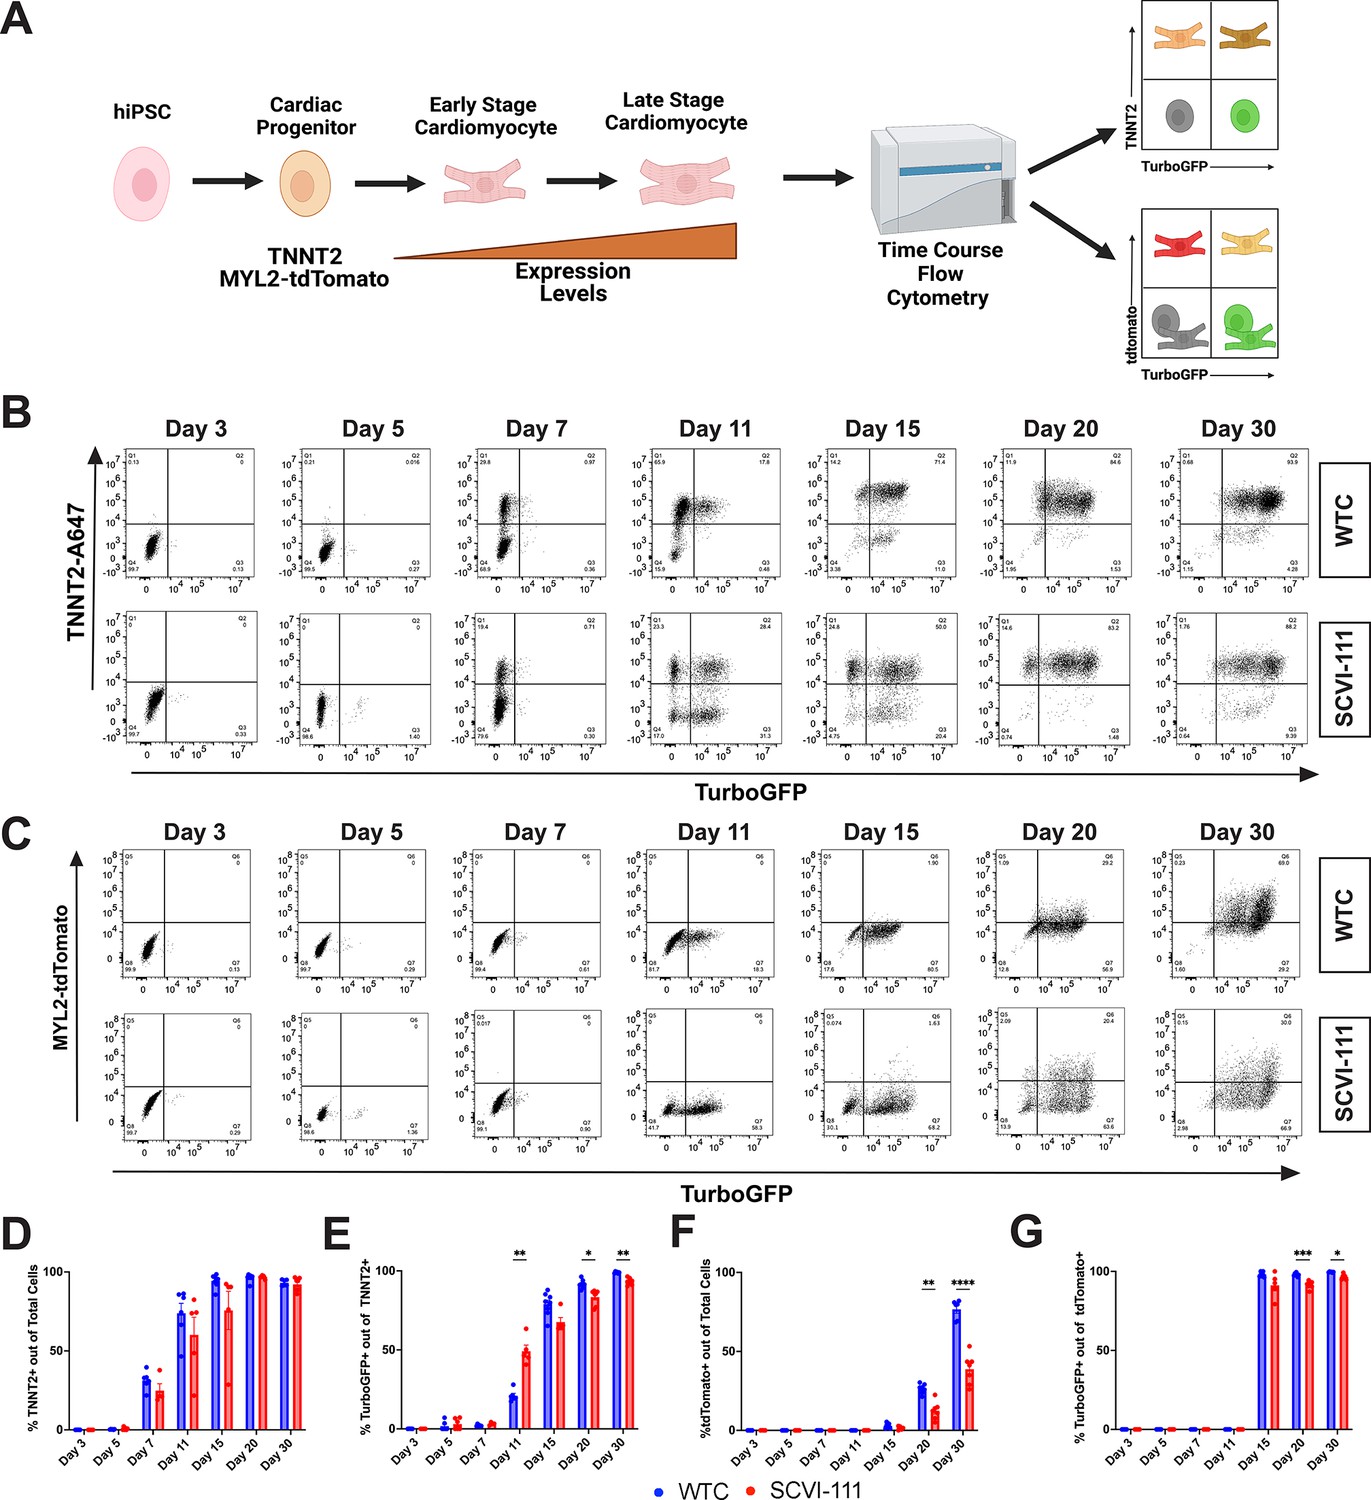
T-box transcription factor (TBX5)-lineage tracing reveals a predominance of lineage positive cardiomyocytes through the course of human-induced pluripotent stem cell (hiPSC) cardiac differentiation.
(A) Schematic of analysis approach of reporter system expression through the course of cardiac differentiation. (B) Representative flow cytometry plots for the expression of TurboGFP and cardiac troponin T staining between day 3–30 of differentiation for WTC and SCVI-111 reporter lines. Gating set based on day 3 of differentiation. (C) Representative flow cytometry for the expression MYL2-tdTomato and TurboGFP between day 3 and30. Gating set based on day 3 of differentiation. (D) Quantification of percentage cardiac troponin T (TNNT2) expressing cells across all cells sampled. (E) Quantification of the percentage of TurboGFP-positive cells out of cardiac troponin-positive cardiomyocytes. (F) Quantification of tdTomato expressing cells across total cells sampled. Quantification of TurboGFP-positive cells out of MYL2-Tdtomato cardiomyocytes. N=4-8 independent biological replicates were collected per sample. Statistical significance determined by two-way ANOVA with first independent variable analyzed being time and the second variable being cell line. *p <0.05, **p<0.01, ***p<0.001, ****p<0.0001. Error bars represent standard error of the mean (SEM).
Figure 2—figure supplement 1
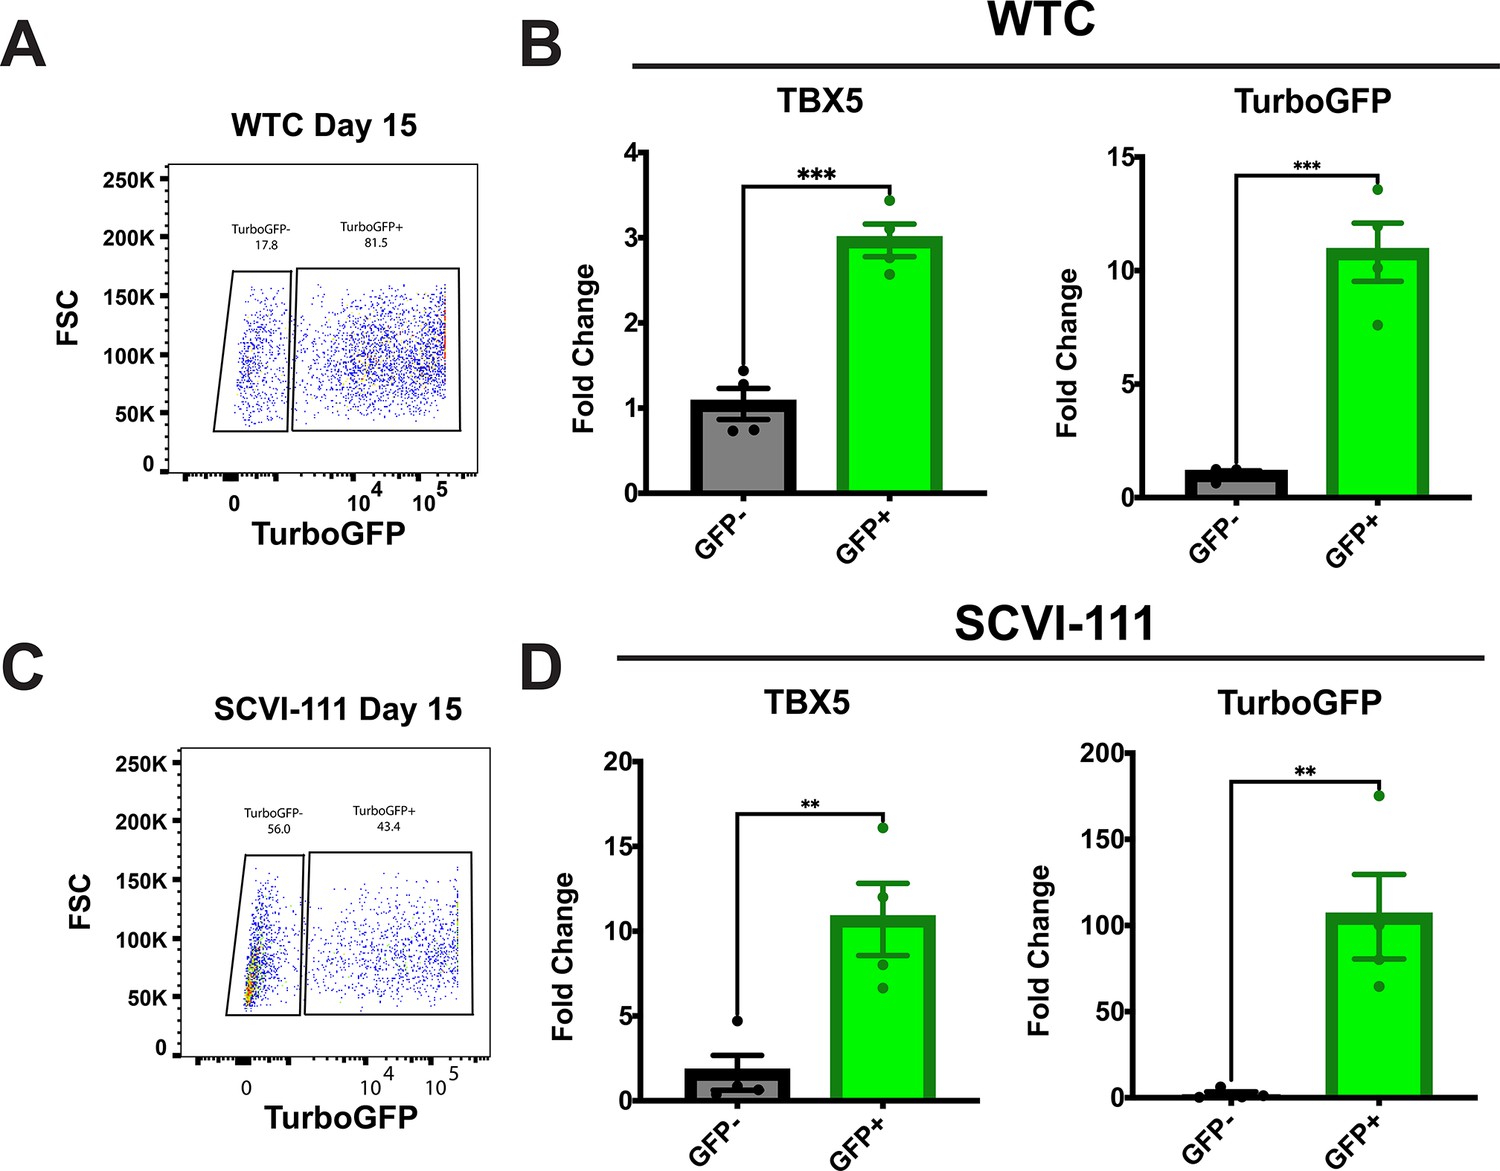
FACS sorted TurboGFP positive cells enrich for T-box transcription factor (TBX5) xxpression.
(A) Representative FACS plot of sort GFP+ and GFP− day 15 WTC reporter line cardiac differentiations. (B) RT-qPCR for TBX5 and TurboGFP expression of GFP+ and GFP− sorted day 15 WTC cardiac differentiations. N=4 independent biological replicates. ***p<0.001. (C) Representative FACS plot of sort GFP+ and GFP− day 15 SCVI-111 reporter line cardiac differentiations. (D) RT-qPCR for TBX5 and TurboGFP expression of GFP+ and GFP− sorted day 15 SCVI-111 cardiac differentiations. N=4 independent biological replicates. Statistical significance calculated by two-tailed students T-test. ***p<0.001. Error bars represent standard error of the mean (SEM).
Figure 3
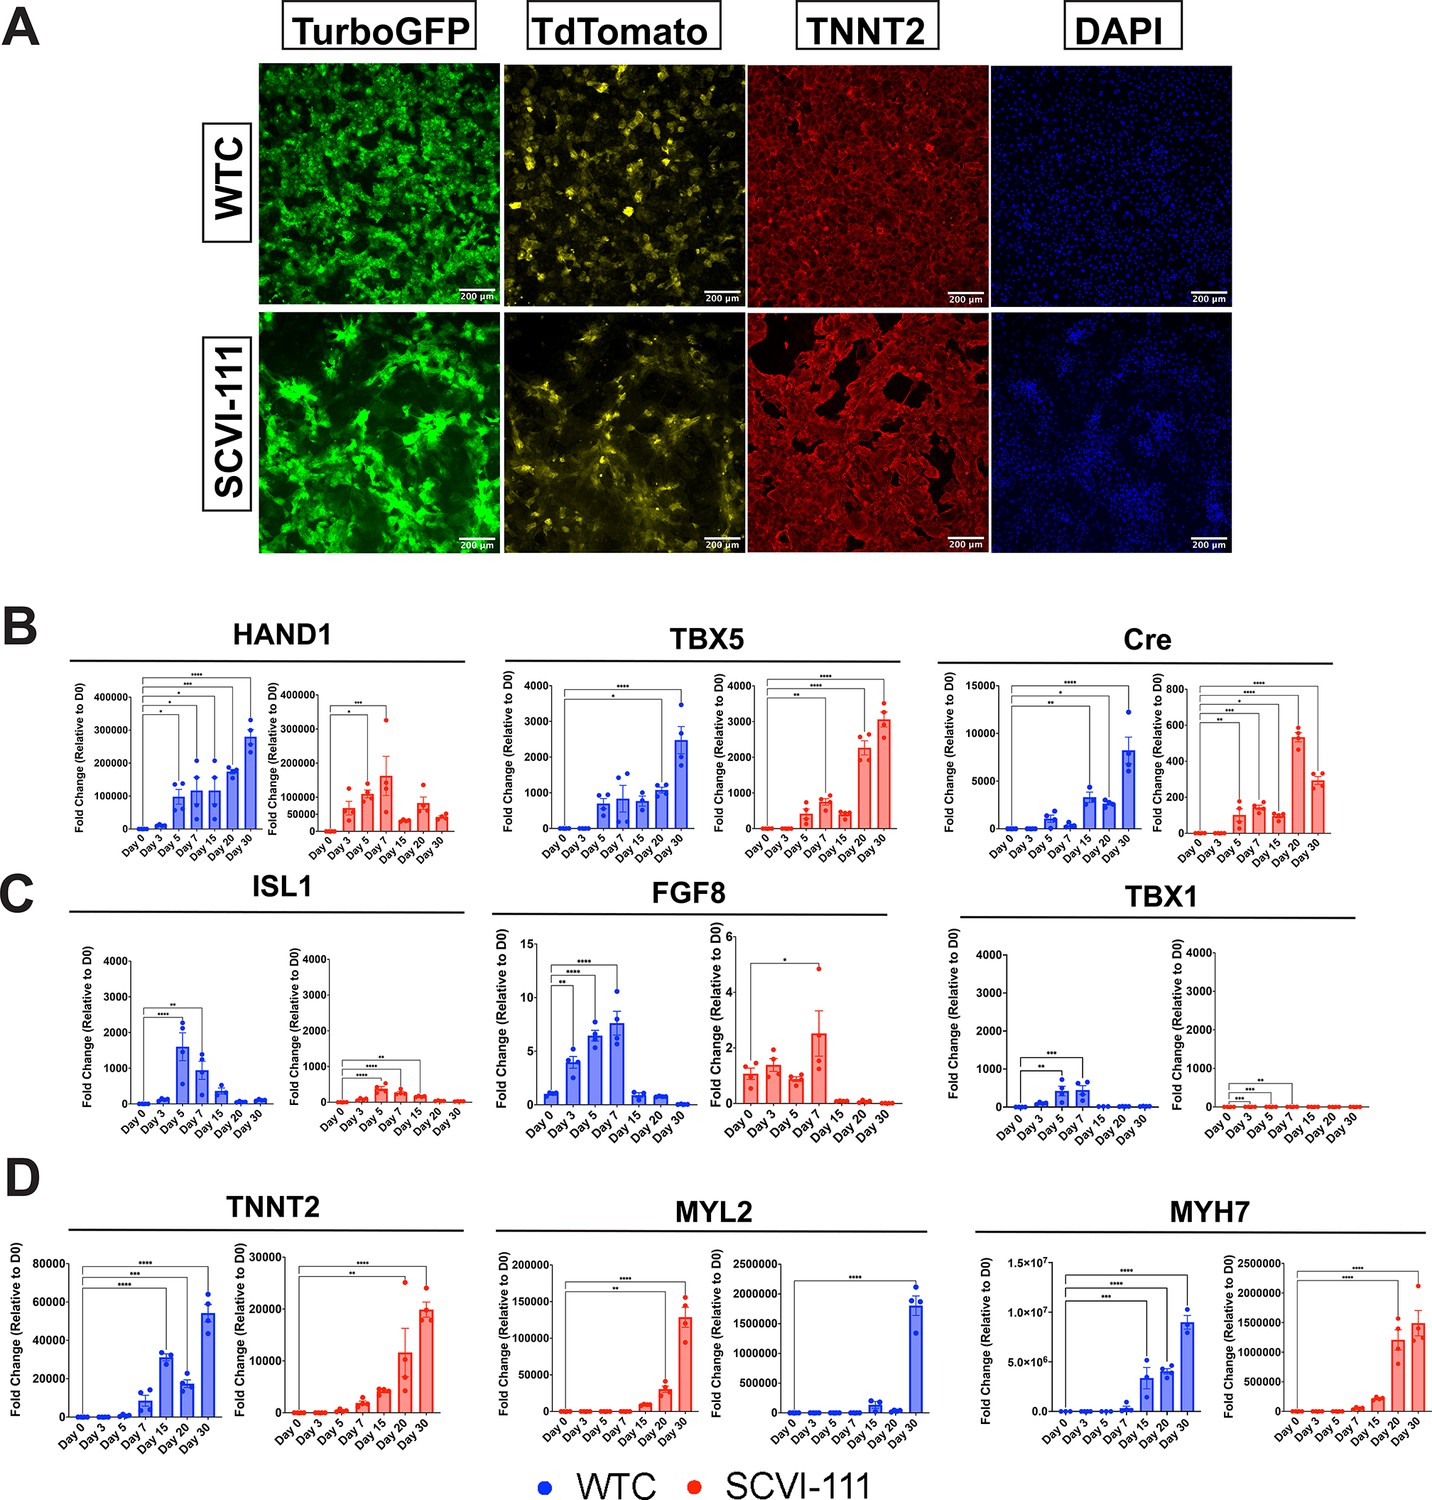
Immunofluorescence imaging of day 30 reporter cardiomyocytes and RT-qPCR profiling of first heart field (FHF) and second heart field (SHF) markers across differentiation.
(A) Immunofluorescence images of TurboGFP, TdTomato, and TNNT2 expression at day 30 of cardiac differentiation for WTC and SCVI-111 reporter lines. (B) RT-qPCR profiling of FHF markers HAND1 and TBX5 along with Cre Recombinase between day 0 and 30 of differentiation. (C) RT-qPCR profiling of pan-cardiac progenitor marker ISL1, and SHF markers TBX1 and FGF8 between day 030 of differentiation. (D) RT-qPCR profiling of pan-cardiomyocyte marker TNNT2. (E) RT-qPCR profiling of ventricular marker myosin light chain-2 (MYL2). N=3–4 biological replicates per timepoint. Significance determined by one-way ANOVA with Dunnet’s multiple comparisons correction. *p<0.05, **p<0.01, ***p<0.001, ****p<0.0001. Error bars represent standard error of the mean (SEM).
-
Figure 3—source data 1
qPCR human primer sequences.
- https://cdn.elifesciences.org/articles/80075/elife-80075-fig3-data1-v2.xlsx
Figure 4 with 7 supplements
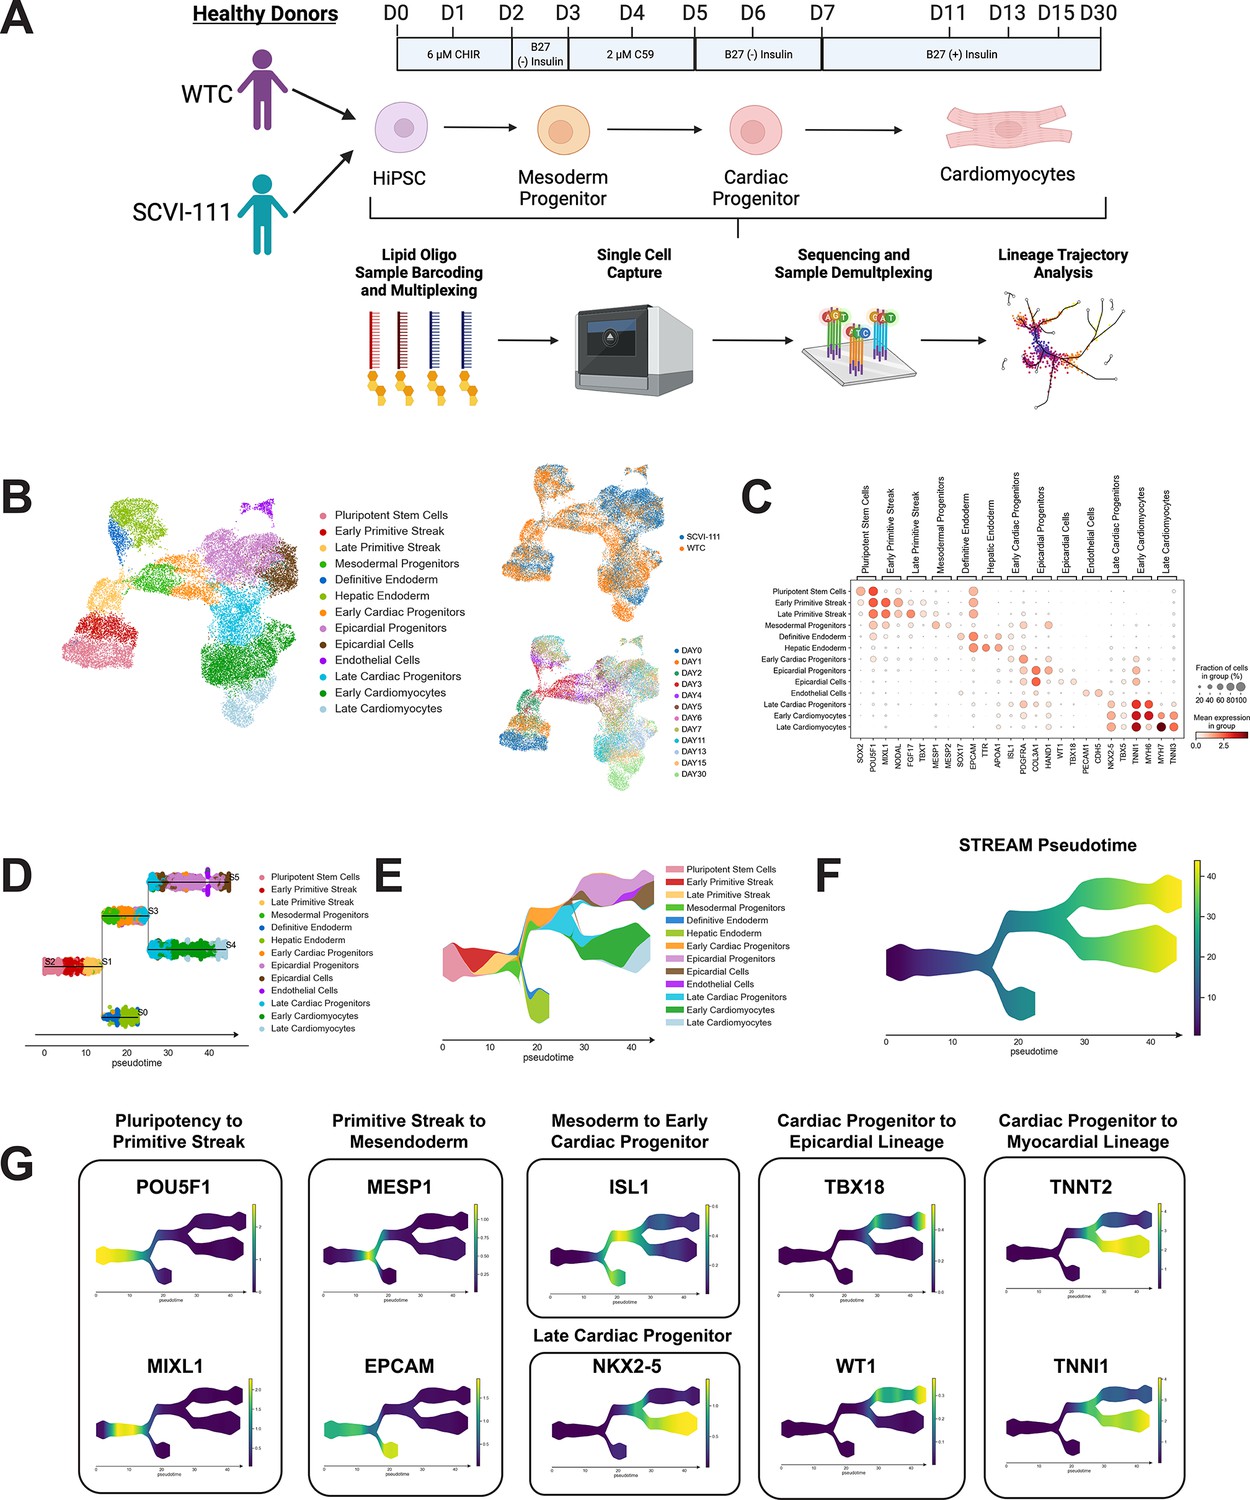
single-cell RNA sequencing (scRNA-seq) profiling and trajectory inference reveals emergence of myocardial and epicardial lineages during human-induced pluripotent stem cell (hiPSC) cardiac differentiation.
(A) Diagram of scRNA-seq multiplexing for profiling of 12 timepoints across two lines during hiPSC cardiac differentiation. (B) Left, UMAP plot with identification of 13 cell populations over the course of cardiac differentiation. Right-Top, Plot indicating labeling of cells captured from WTC and SCVI-111 line. Right-Bottom, Plot indicating timepoints of differentiation at which cells were captured for scRNA-seq. N=27,595 single cells. (C) Dotplot presenting the expression of top markers for major cell populations identified during hiPSC cardiac differentiation. (D) Subway map plot showing the projection of cells along cell lineages detected using STREAM analysis. (E) Stream plot indicating the relative cell type composition along each branch of differentiation identified by STREAM. (F) Graph indicating pseudotime values calculated by STREAM for ordering cells along a continuous developmental projection axis. (G) Feature plots for top gene markers identified during each major developmental phase of hiPSC cardiac differentiation.
-
Figure 4—source data 1
GEO Accession Numbers for Datasets.
- https://cdn.elifesciences.org/articles/80075/elife-80075-fig4-data1-v2.xlsx
-
Figure 4—source data 2
Differentially Expressed Genes Identified For Annotated Cell Types.
- https://cdn.elifesciences.org/articles/80075/elife-80075-fig4-data2-v2.xlsx
-
Figure 4—source data 3
Genes Correlated with Differentiation Trajectories Identified During hiPSC Cardiac Differentiation.
- https://cdn.elifesciences.org/articles/80075/elife-80075-fig4-data3-v2.xlsx
-
Figure 4—source data 4
Description of scRNA-seq Run and hashtag oligo sequences used for sample multiplexing.
- https://cdn.elifesciences.org/articles/80075/elife-80075-fig4-data4-v2.xlsx
Figure 4—figure supplement 1
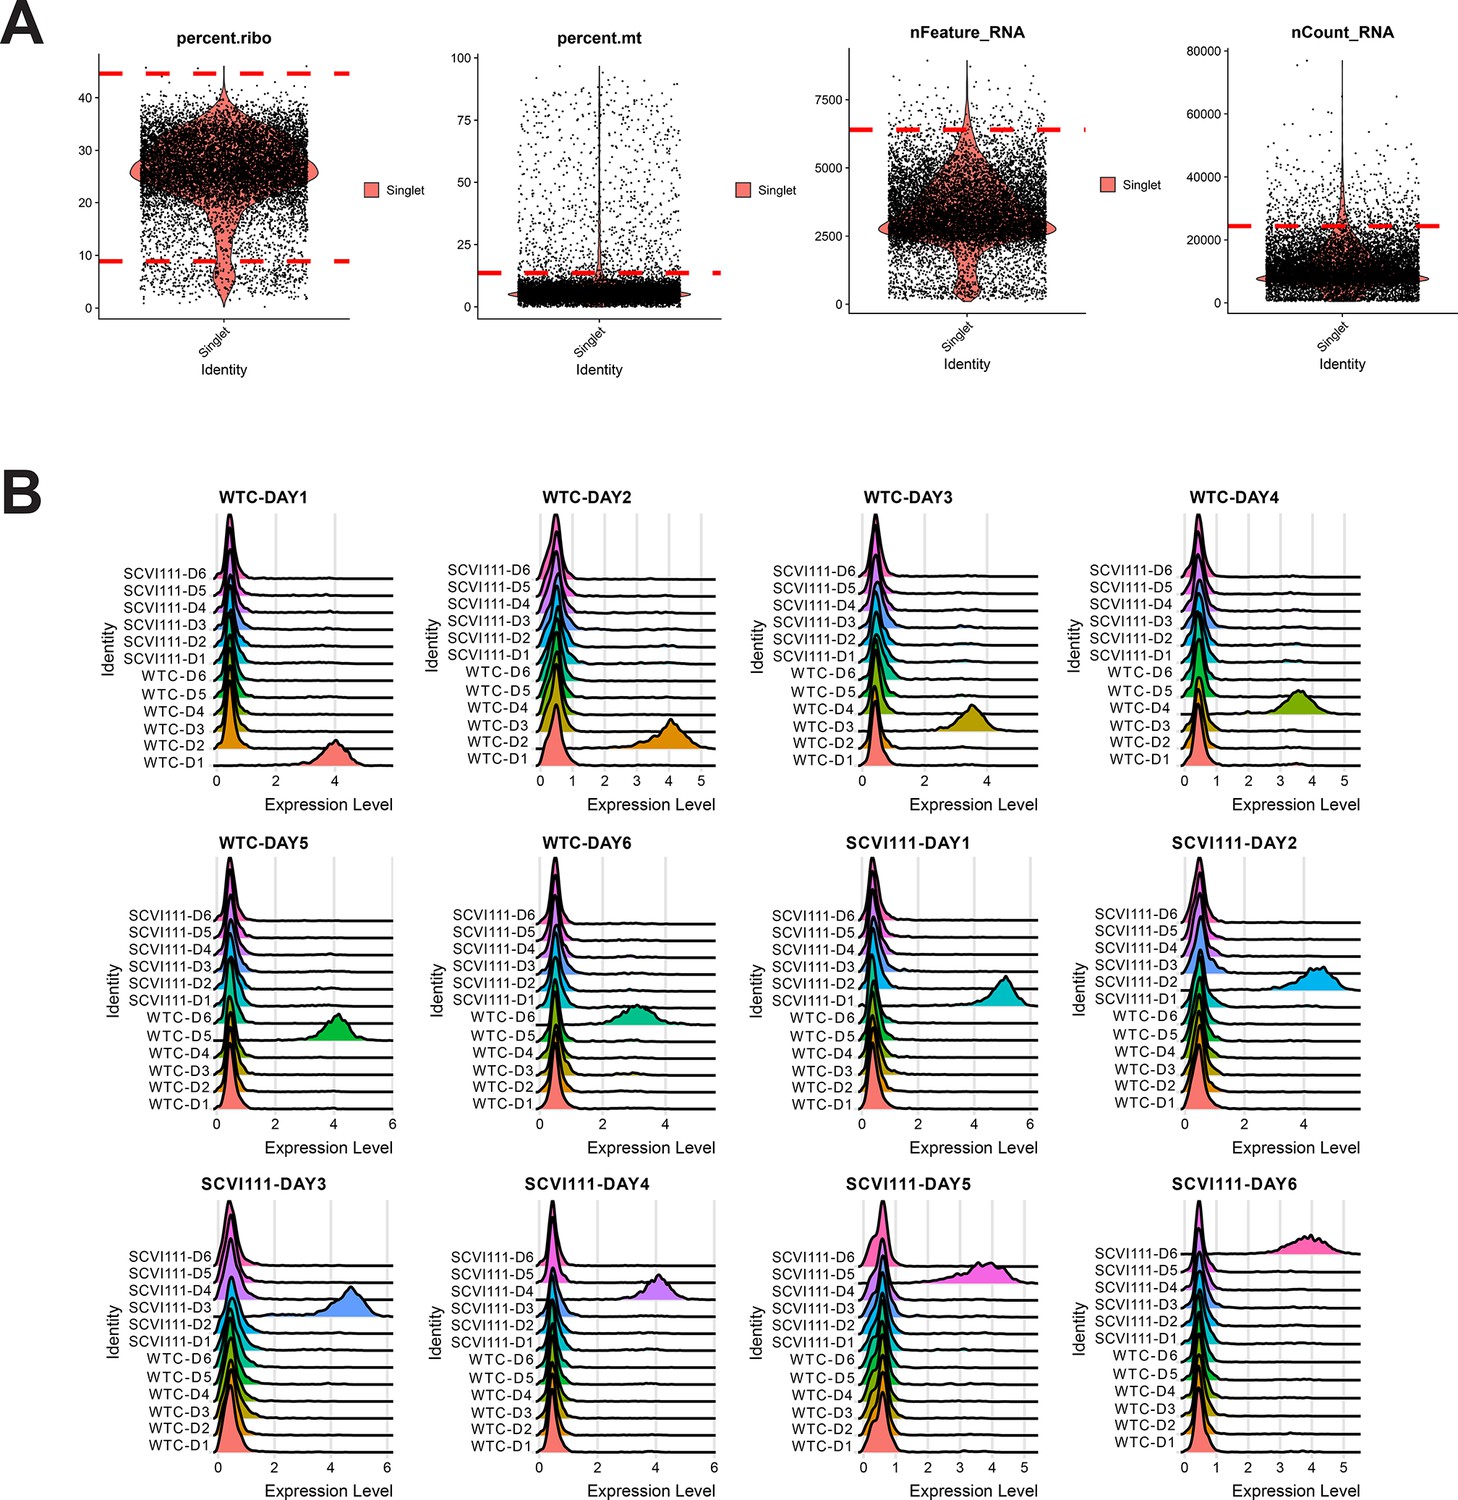
Quality control and hashtag oligo labeling of samples for scRNA-seq sample Galdos_Seq_Run1.
(A) Cutoff values (dotted red lines) were calculated for quality control filtering of four metrics evaluated. (B) Ridge plots demonstrating highly specific labeling of chemically modified oligos for multiplexing of day 1–6 samples across two human-induced pluripotent stem cell (hiPSC) lines.
Figure 4—figure supplement 2
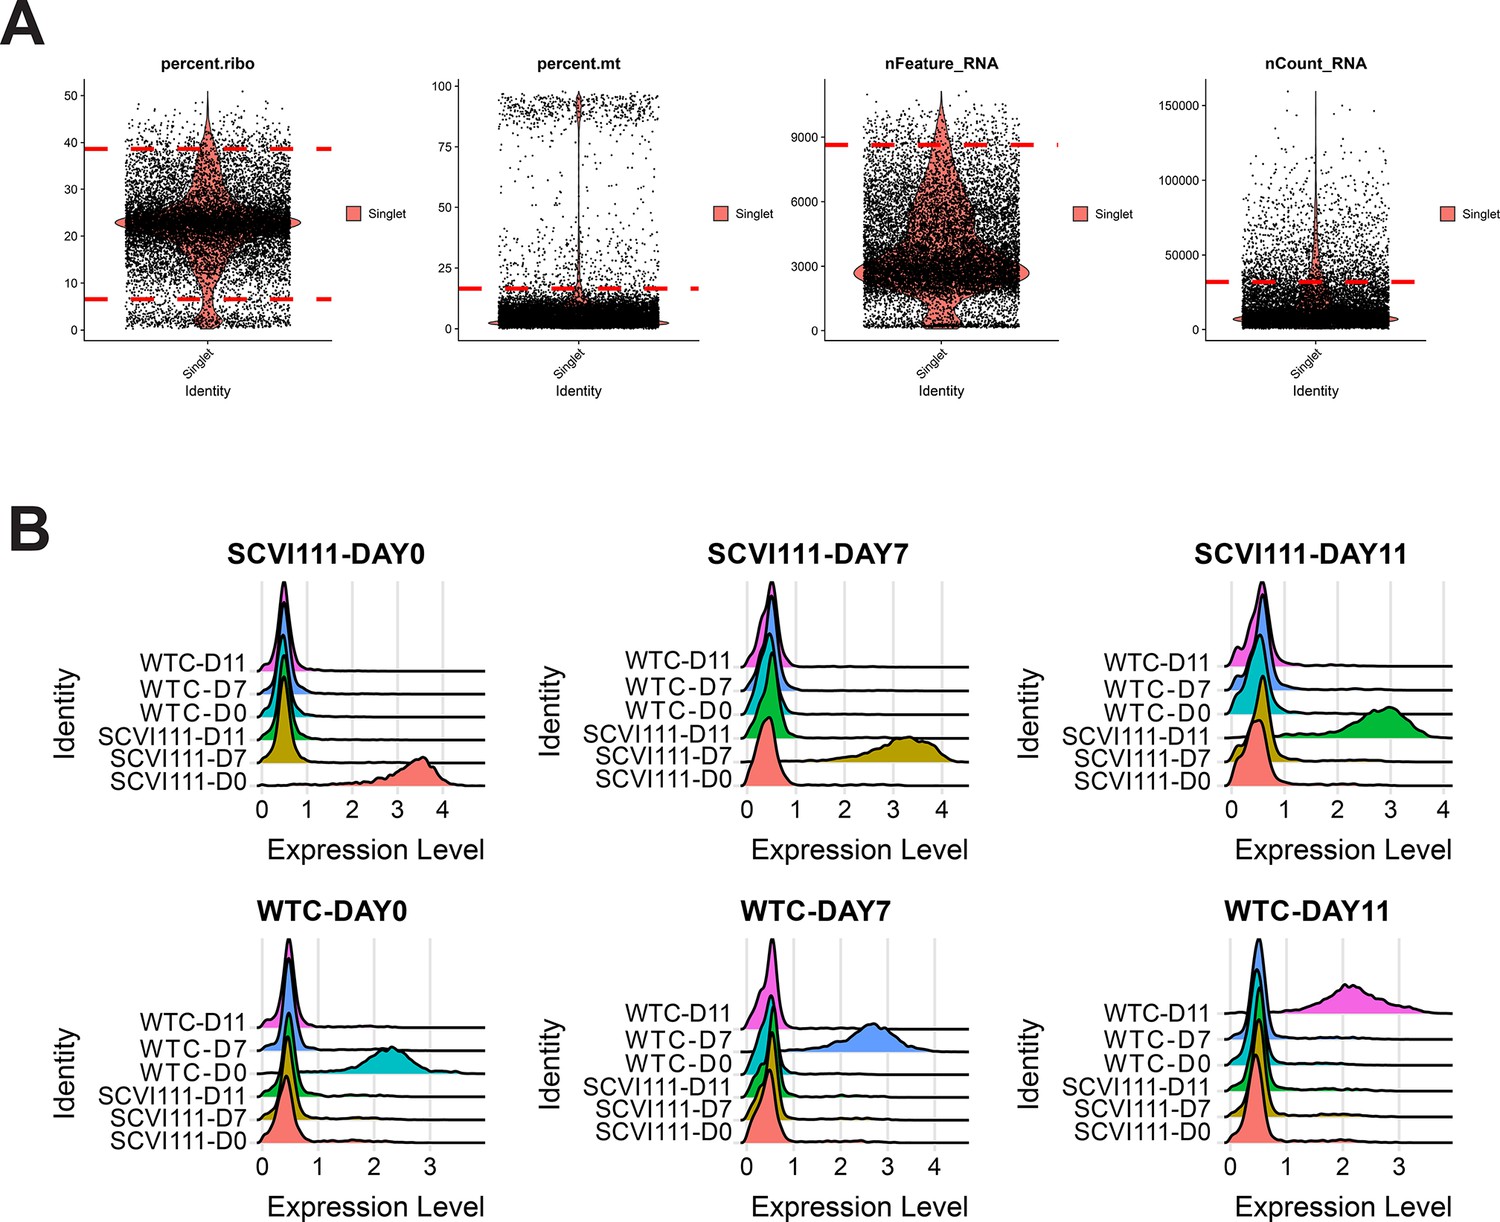
Quality control and hashtag oligo labeling of samples for scRNA-seq sample Galdos_Seq_Run2.
(A) Cutoff values (dotted red lines) were calculated for quality control filtering of four metrics evaluated. (B) Ridge plots demonstrating highly specific labeling of chemically modified oligos for multiplexing of day 0, 7, and 11 samples across two human-induced pluripotent stem cell (hiPSC) lines.
Figure 4—figure supplement 3
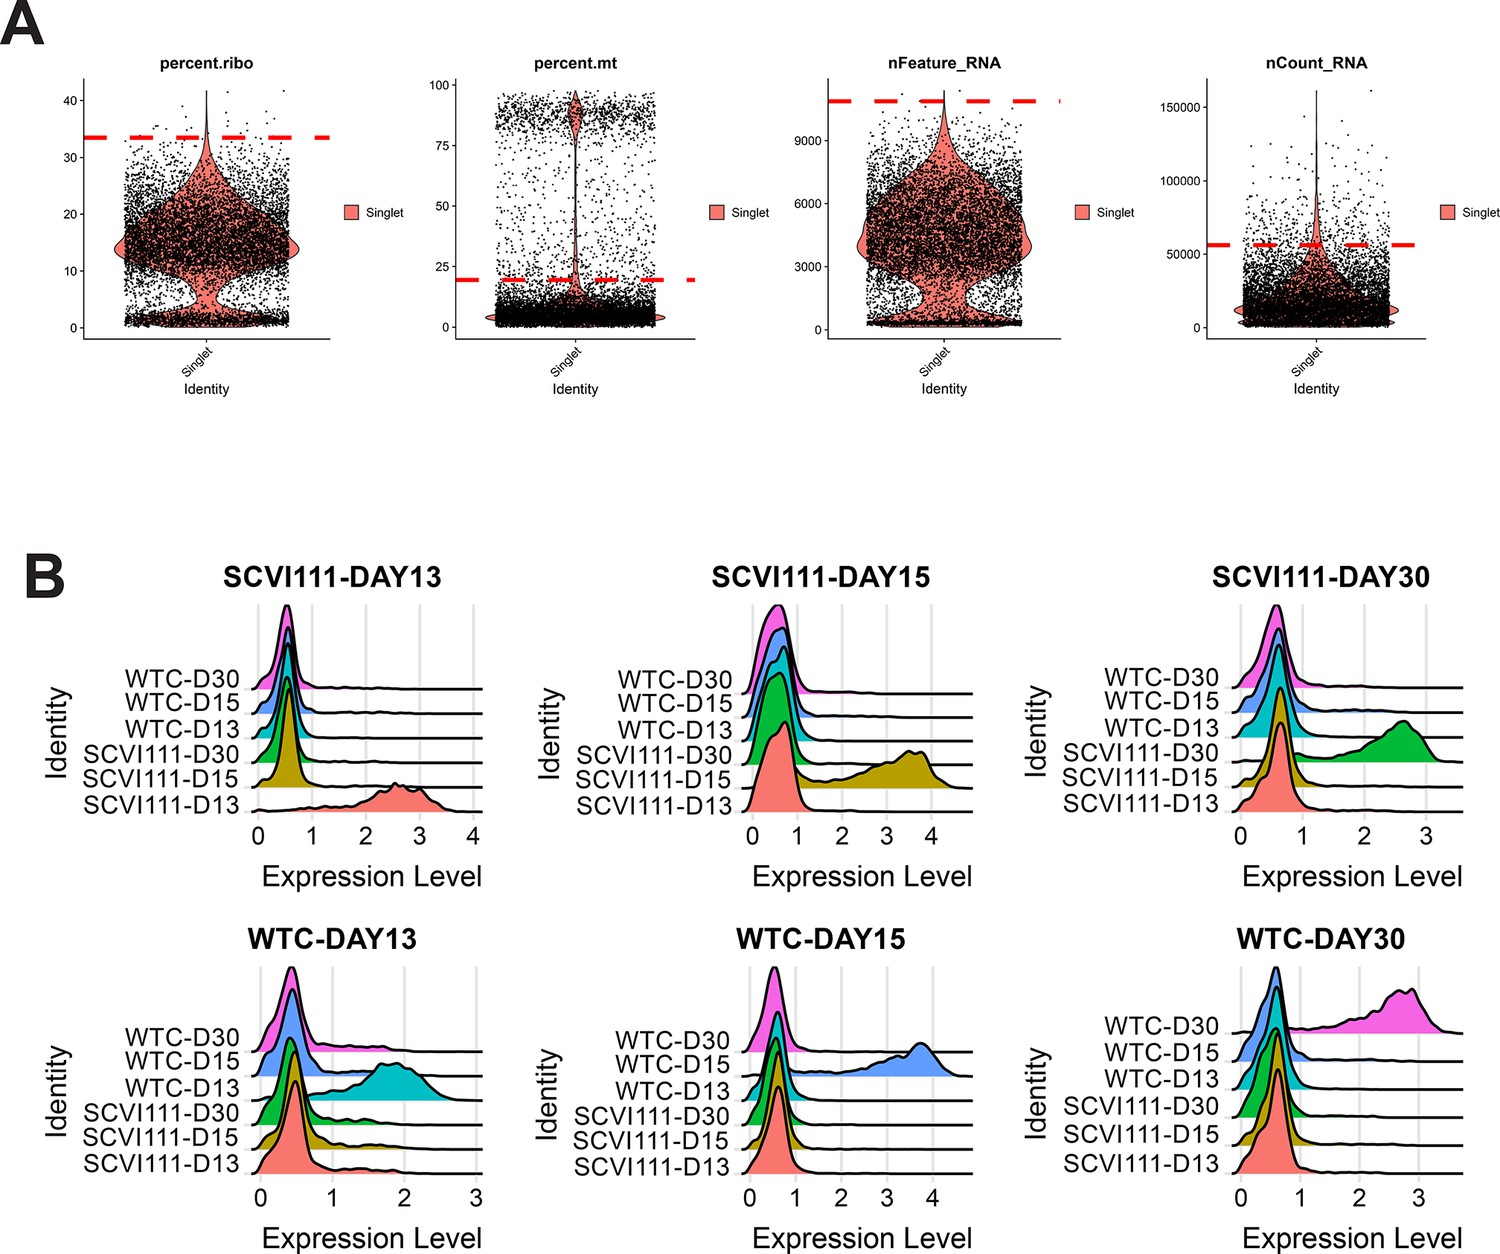
Quality control and hashtag oligo labeling of samples for scRNA-seq sample Galdos_Seq_Run3.
(A) Cutoff values (dotted red lines) were calculated for quality control filtering of four metrics evaluated. (B) Ridge plots demonstrating highly specific labeling of chemically modified oligos for multiplexing of day 13, 15, and 30 samples across two human-induced pluripotent stem cell (hiPSC) lines.
Figure 4—figure supplement 4
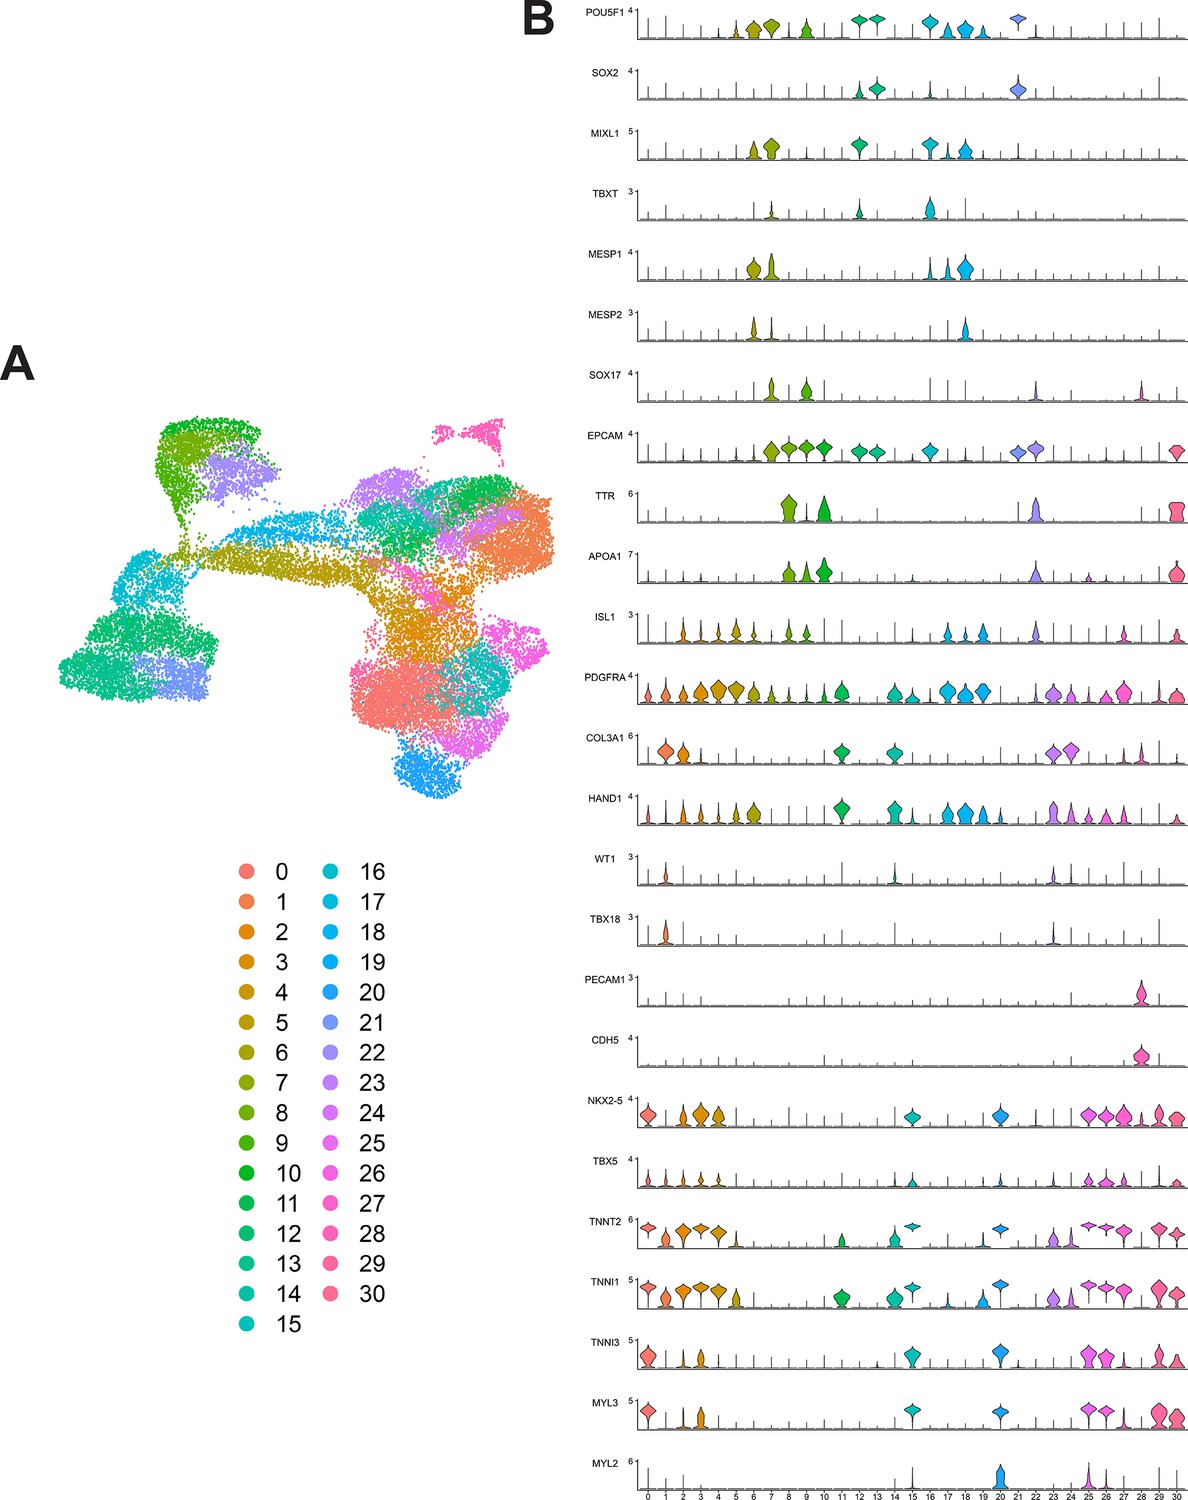
Unsupervised clustering and marker expression of combined human-induced pluripotent stem cell (hiPSC) single-cell RNA sequencing (scRNA-seq) data from WTC and SCVI-111 lines.
(A) UMAP embedding for combined scRNA-seq data from WTC and SCVI-111 lines, along with unsupervised clustered identified. (B) Stacked violin plots for distinct cell markers enriched across all clusters identified.
Figure 4—figure supplement 5
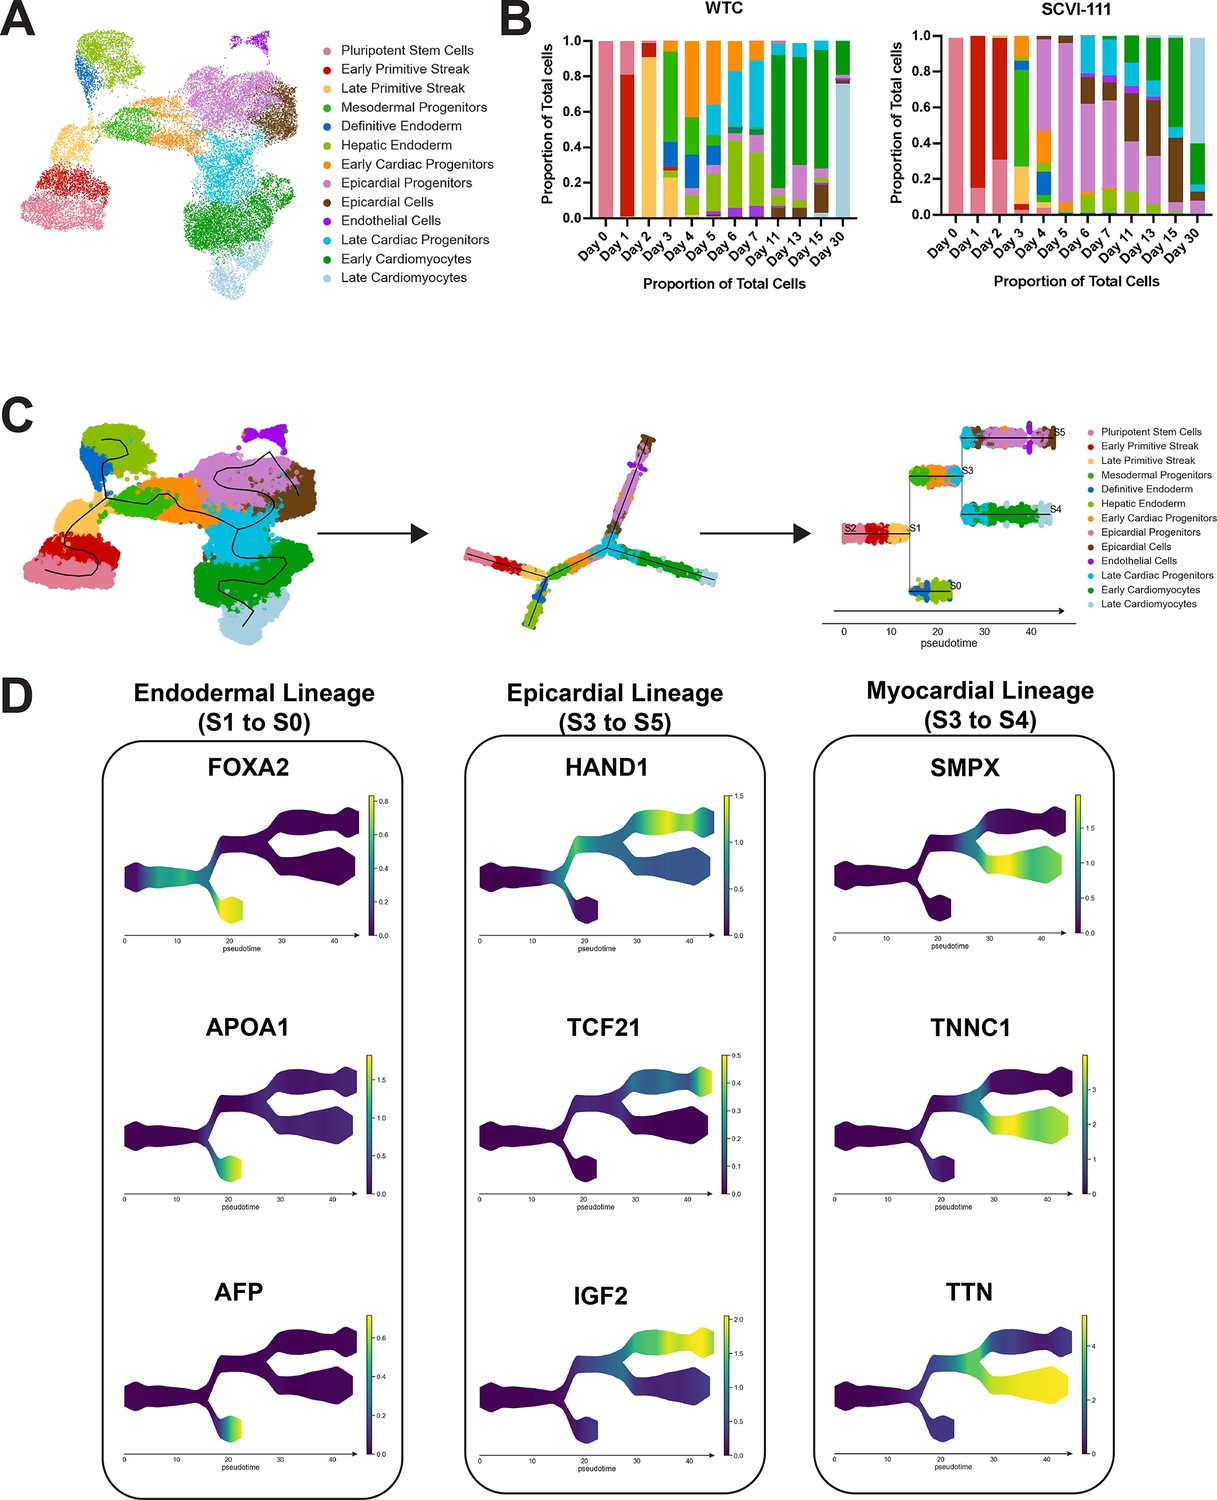
Trajectory inference analysis of human-induced pluripotent stem cell (hiPSC) cardiac differentiation across WTC and SCVI-111 Lines.
(A) UMAP embedding reproduced from Figure 4A demonstrates annotation of 12 distinct cell types. (B) Compositional analysis showing the proportion of each cell type identified across all timepoints for both WTC and SCVI-111 lines. (C) STREAM algorithm fitting of principal graphs and trajectory inference detection. Cells were ordered along principal graphs and calculated pseudotime values. (D) Expression of statistically significant gene markers along differentiation trajectories identified during hiPSC cardiac differentiation.
Figure 4—figure supplement 6
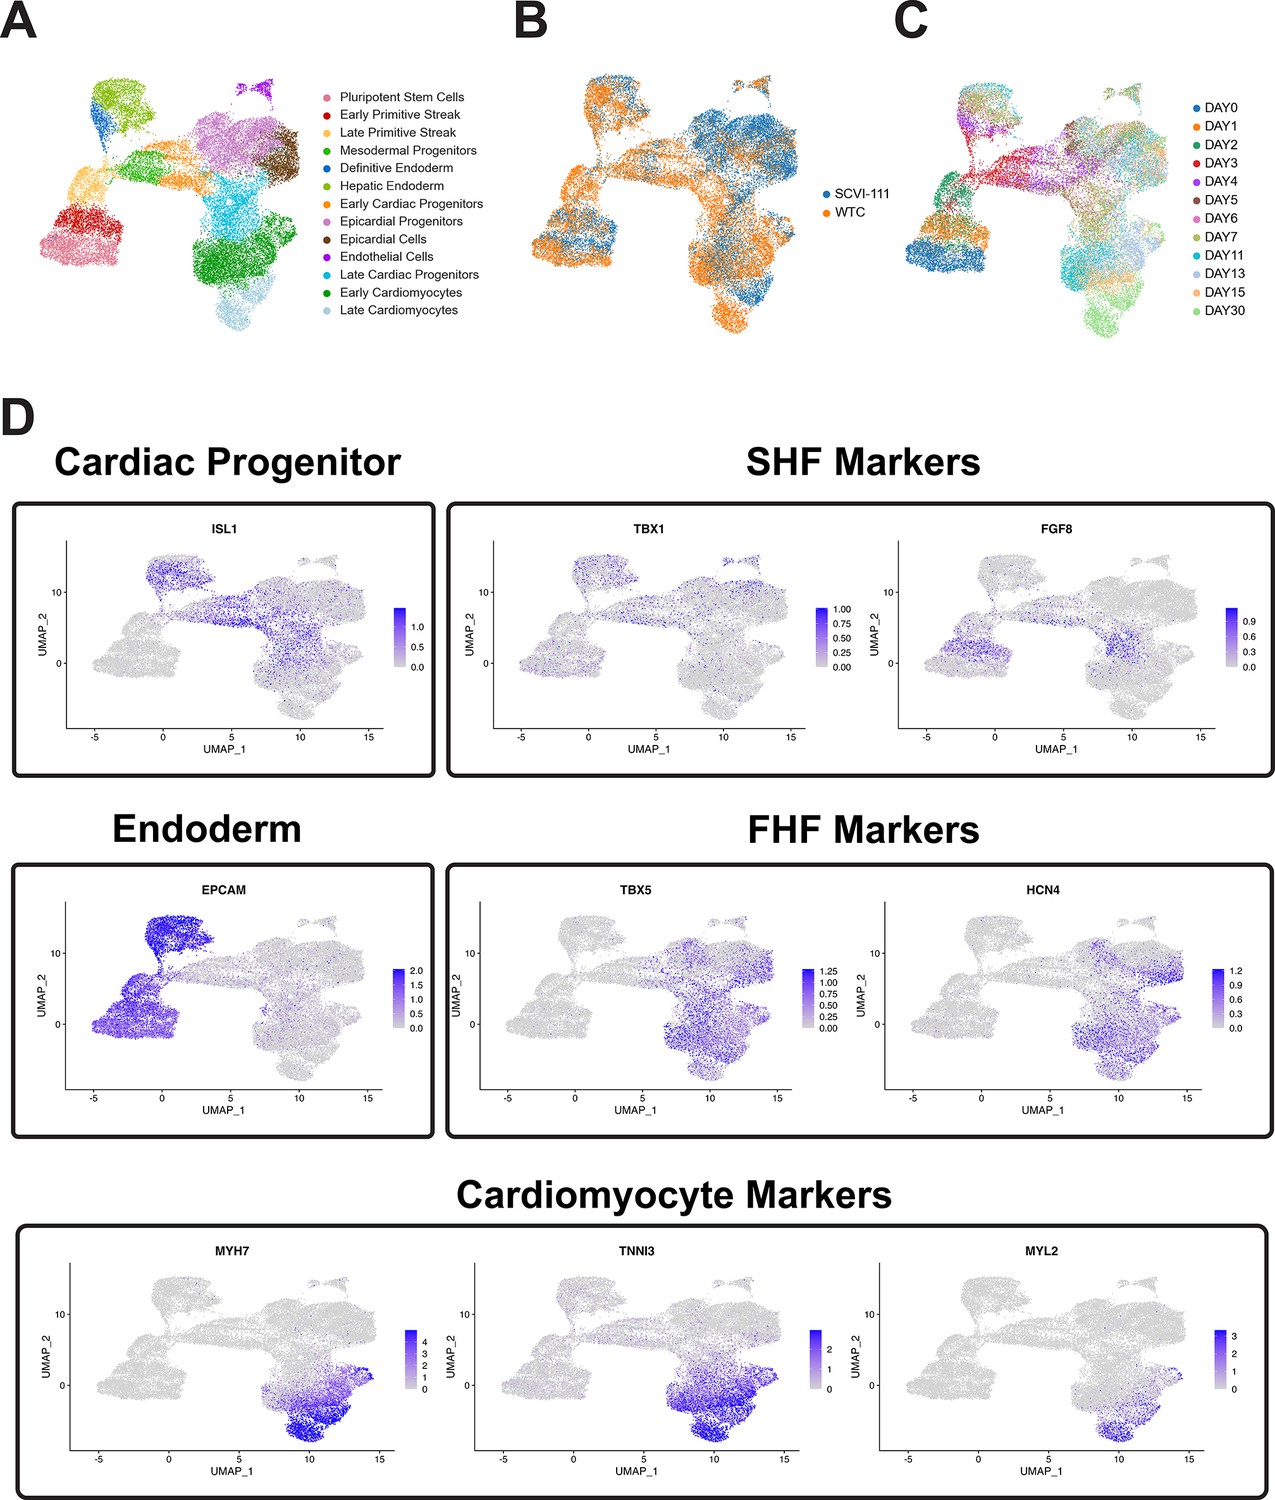
Feature plots of selected first heart field (FHF), second heart field (SHF), endoderm, and cardiomyocyte markers.
(A) UMAP of human-induced pluripotent stem cell (hiPSC) cardiac differentiation showing cell type annotation, (B) cell line of origin, and (C) timepoint during differentiation. (D) Feature plots showing gene expression of selected genes in individual cells along the UMAP plot.
Figure 4—figure supplement 7
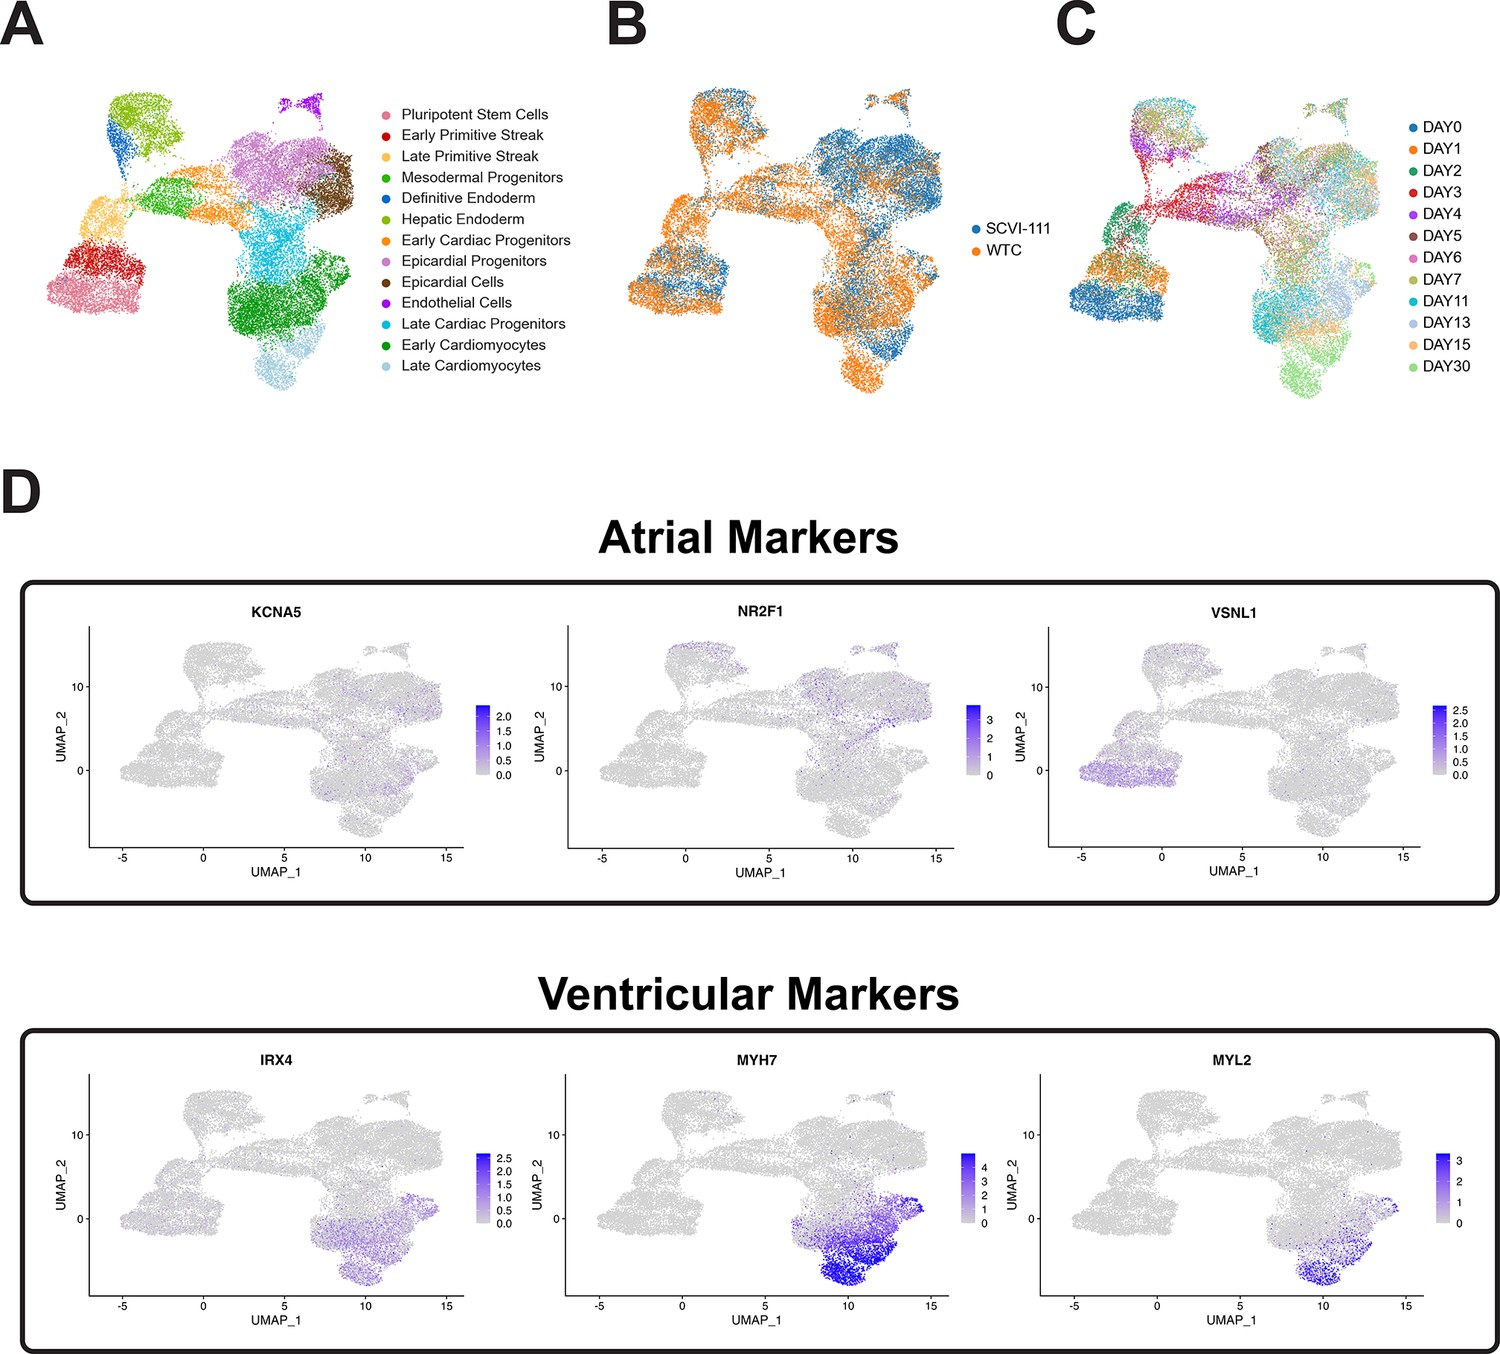
Comparison of expression of atrial and ventricular cardiomyocyte markers in human-induced pluripotent stem cell (hiPSC)-CM single-cell RNA sequencing (scRNA-seq) time course.
(A) UMAP of hiPSC cardiac differentiation showing cell type annotation, (B) cell line of origin, and (C) timepoint during differentiation. (D) Feature plots showing gene expression of atrial markers (KCNA5, NR2F1, and VSNL1) and ventricular markers (IRX4, MYH7, and MYL2).
Figure 5
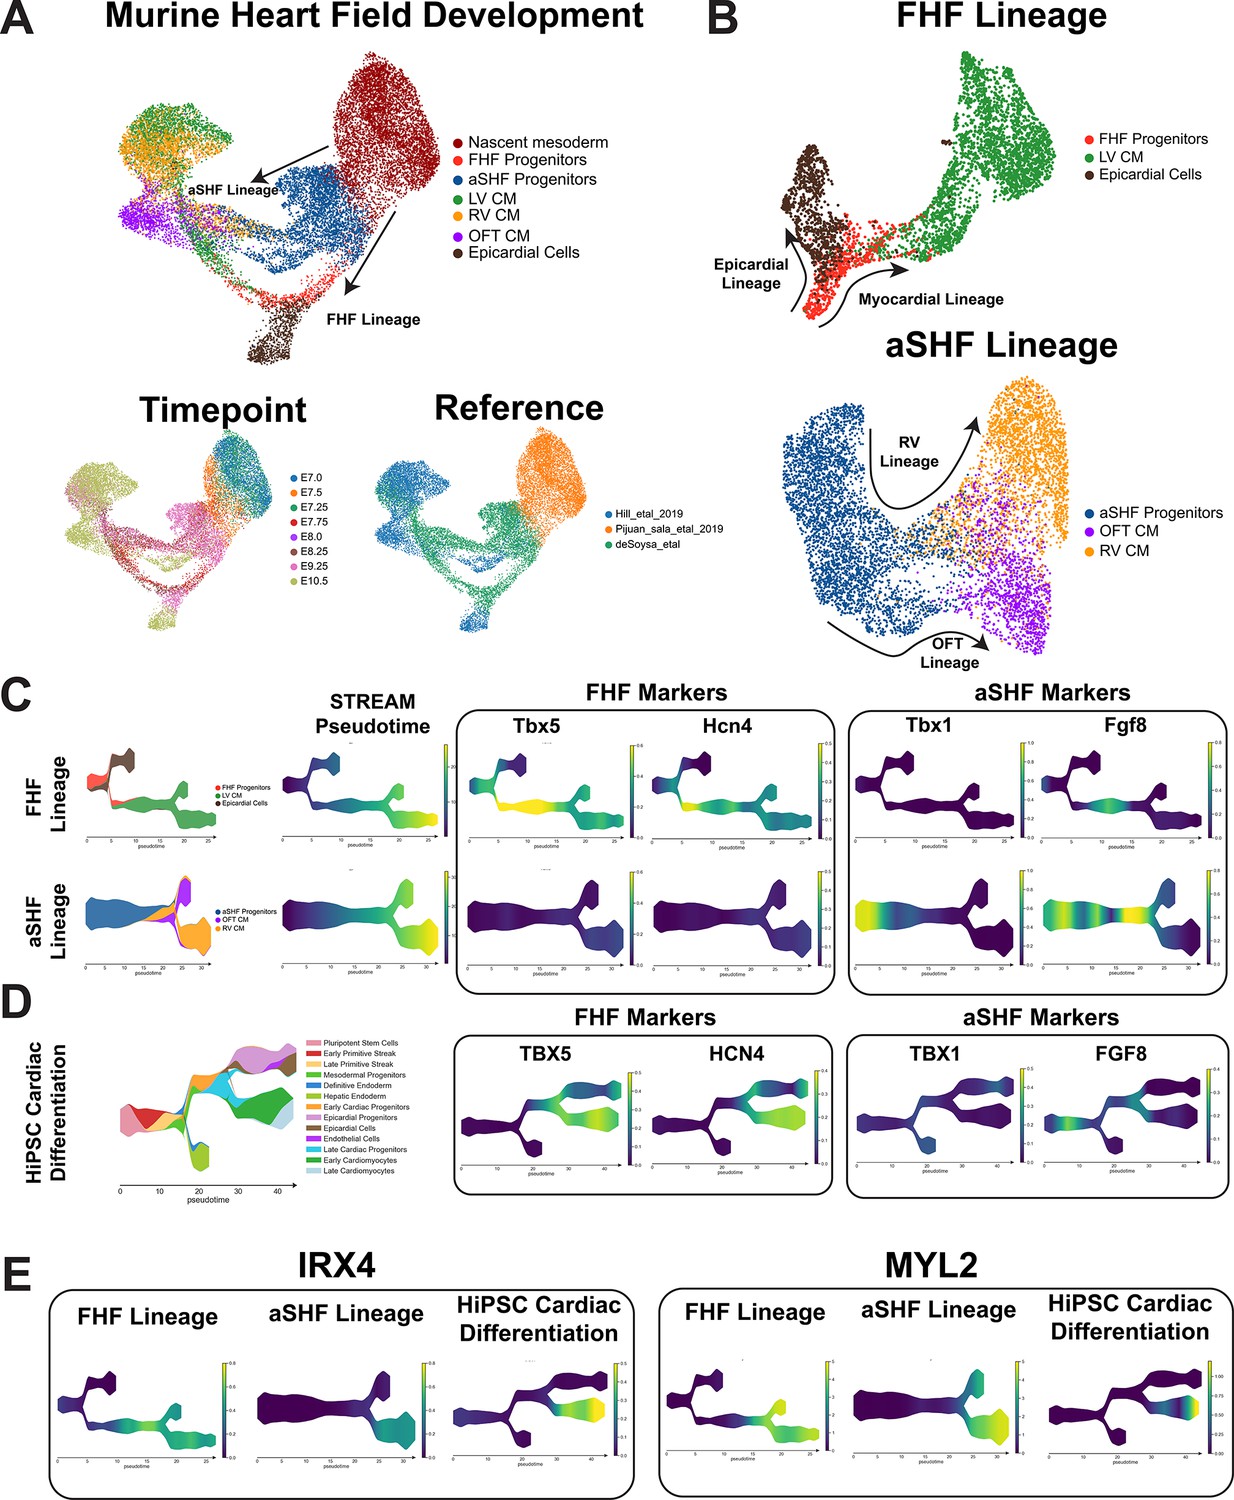
Comparison of heart field development between murine and human-induced pluripotent stem cell (hiPSC) cardiac differentiation reveals first heart field (FHF) identity of hiPSC cardiac lineages.
(A) Top, UMAP plot showing clustering of murine cell types encompassing early mesodermal progenitors, FHF/second heart field (SHF) progenitors, LV/RV/OFT cardiomyocytes, and epicardial cells. Bottom-left, labeling of cell types by timepoint analyzed. Bottom-right, annotation by reference from which data was obtained. (B) UMAP embeddings of heart field development split by FHF and SHF lineages. (C) FHF and aSHF trajectory analysis and plotting of expression FHF (TBX5 and HCN4) and anterior SHF (TBX1 and FGF8) markers. (D) Analysis of FHF and aSHF marker expression during hiPSC cardiac differentiation. (E) Gene expression analysis of ventricular markers Iroquois transcription factor (IRX4) and myosin light chain-2 (MYL2) during hiPSC cardiac differentiation.
Figure 6
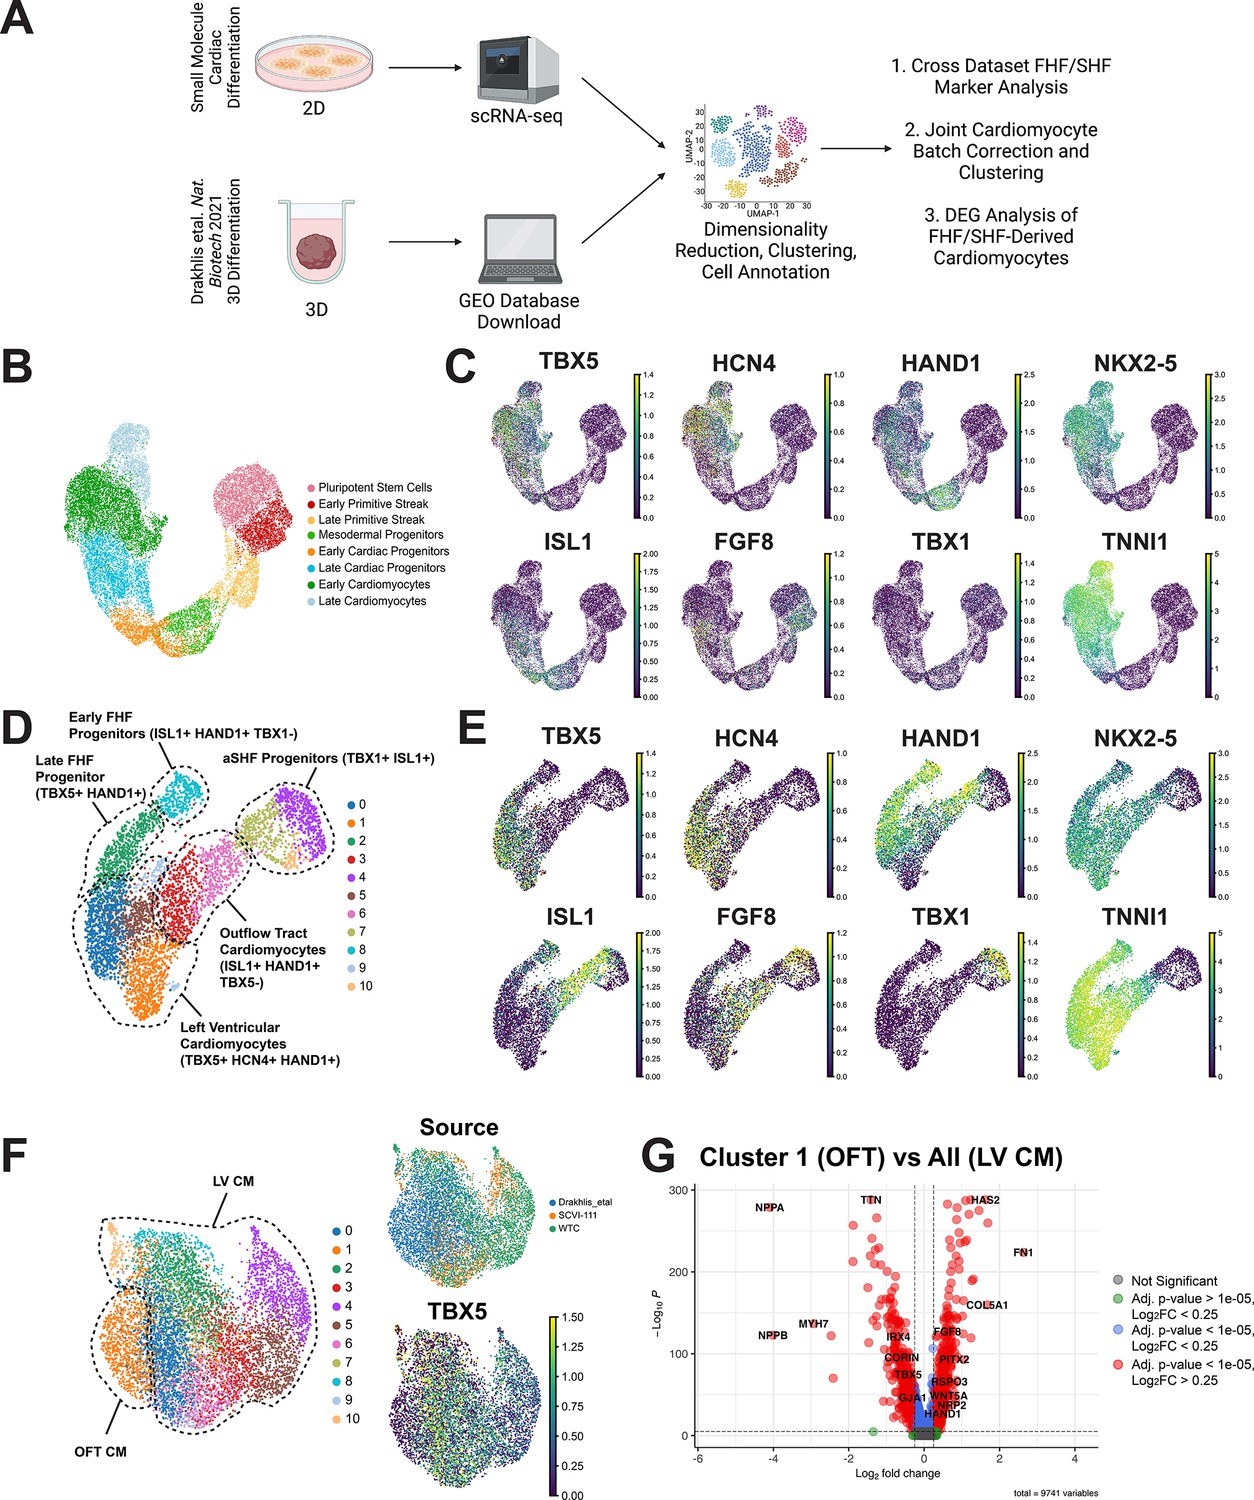
Comparison of 2D and 3D cardiac differentiation uncovers potential of organoid system for second heart field (SHF) generation.
(A) Schematic of comparison strategy of single-cell RNA sequencing (scRNA-seq) data from 2D human-induced pluripotent stem cell (hiPSC) cardiac differentiation generated using our 2D protocol and a previously published organoid protocol. (B) UMAP plot of the myocardial lineage identified during 2D hiPSC cardiac differentiation. (C) Feature plots of first heart field (FHF) (TBX5, HCN4, HAND1), pan-cardiac (ISL1, NKX2-5, TNNI1), and SHF (FGF8, TBX1) during 2D hiPSC differentiation. (D) UMAP plot of Drakhlis et al., cardiac lineage cells with annotation of unsupervised clusters. (E) Feature plots of FHF (TBX5, HCN4, HAND1), pan-cardiac (ISL1, NKX2-5, TNNI1), and SHF (FGF8, TBX1) during organoid differentiation. (F) Co-clustering of 2D and 3D cardiomyocytes with annotation of source dataset (right-top) and expression of T-box transcription factor (TBX5) (right-bottom). (G) Volcano plot for top differentially expressed genes between OFT identified cluster and the remainder of identified cardiomyocytes identified as left ventricular.
-
Figure 6—source data 1
Differential gene expression analysis between putative OFT and LV cardiomyocyte clusters in joint 2D and 3D hiPSC-CM Data.
Pct1 and Pct2 represent the percentage of cells in cluster 1 and all other that express a particular gene.
- https://cdn.elifesciences.org/articles/80075/elife-80075-fig6-data1-v2.xlsx
Videos
Video 1
Contractility of SCVI-111 reporter line cardiomyocytes at day 15 of differentiation.
Video 2
Contractility of WTC reporter line cardiomyocytes at day 15 of differentiation.
Additional files
Download links
A two-part list of links to download the article, or parts of the article, in various formats.
Downloads (link to download the article as PDF)
Open citations (links to open the citations from this article in various online reference manager services)
Cite this article (links to download the citations from this article in formats compatible with various reference manager tools)
Combined lineage tracing and scRNA-seq reveals unexpected first heart field predominance of human iPSC differentiation
eLife 12:e80075.
https://doi.org/10.7554/eLife.80075


