Delineating the transcriptional landscape and clonal diversity of virus-specific CD4+ T cells during chronic viral infection
- Blood Research Institute, Versiti Wisconsin, United States
- Department of Microbiology and Immunology, Medical College of Wisconsin, United States
Figures
Figure 1 with 1 supplement
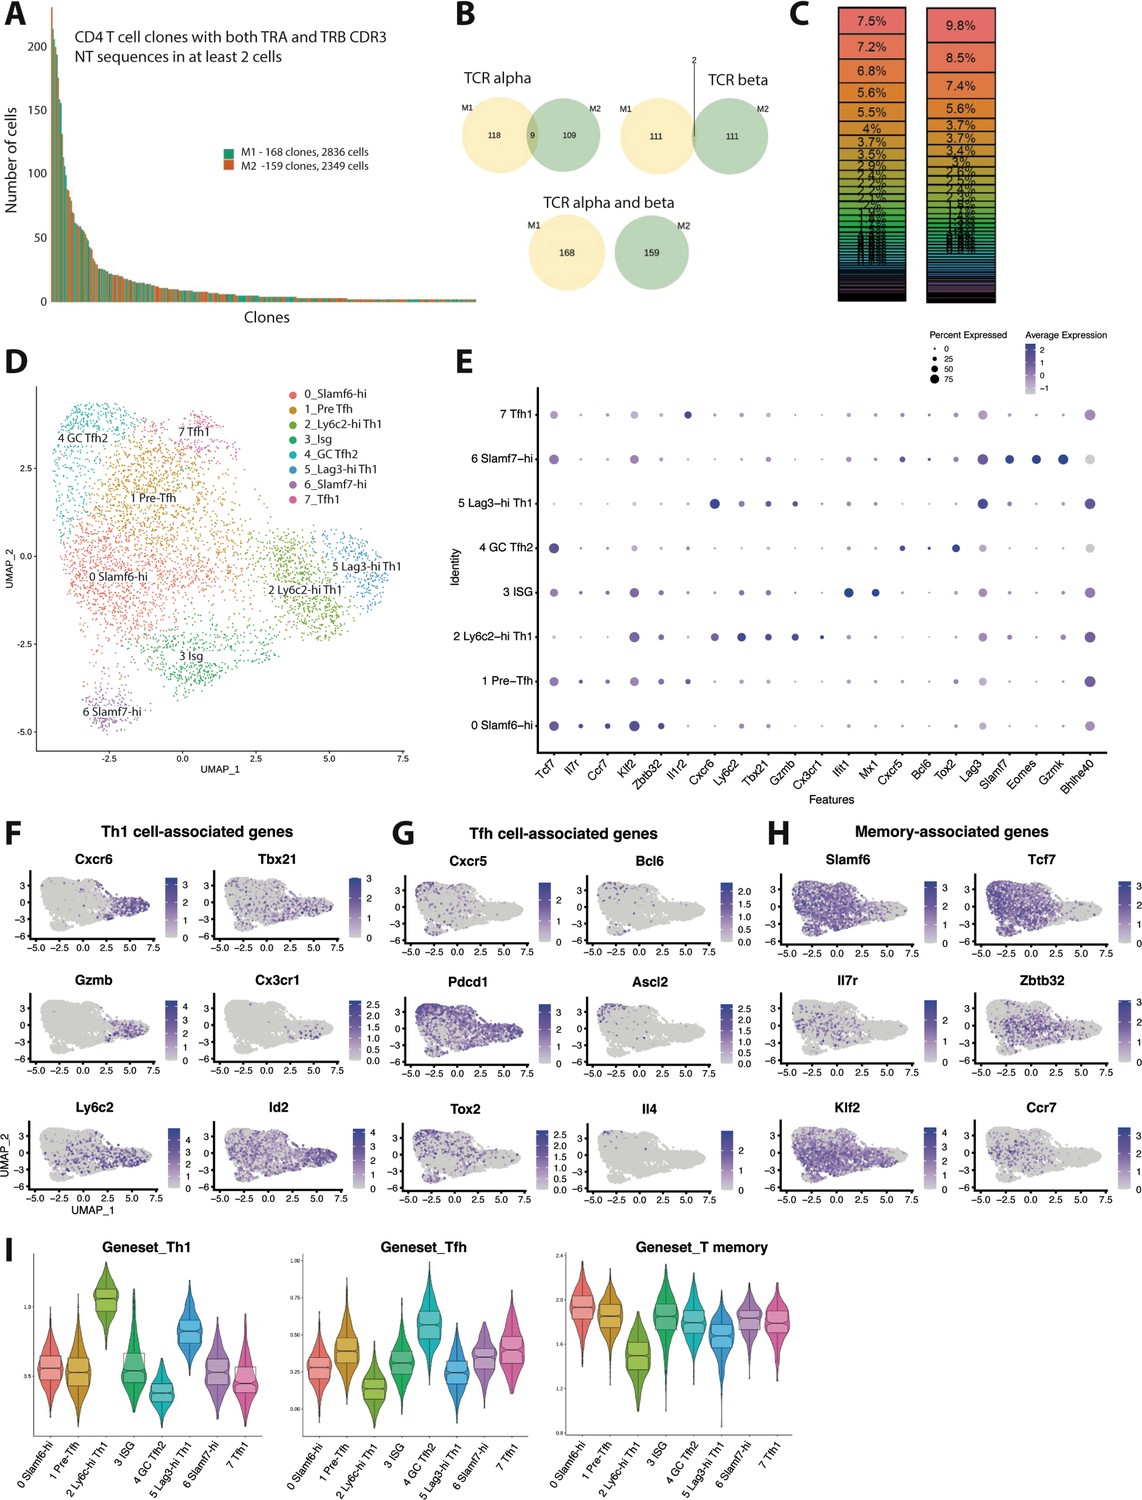
Clonal distribution and transcriptional landscape of GP66-specific CD4+ T cells during chronic lymphocytic choriomeningitis virus (LCMV) infection.
(A–I) GP66-specific splenic CD4 T cells were isolated and sort-purified from two individual LCMV Clone 13 (Cl13)-infected mice on day 10 post-infection, and the 10× Genomics pipeline was used to generate a combined single cell RNA-sequencing (scRNA-seq) + T cell receptor (TCR) seq library. A downstream computational analysis was then performed in R. (A) Summary data showing the size of and clonal distribution of GP66-specific CD4+ T cells (with at least 2 cells per clone) recovered from the two separate mice. (B) Pie charts showing the shared number of public clones when assessing the sequence of either TCR alpha chains, TCR beta chains, or both TCR alpha and beta chains. (C) Summary data showing the relative frequency of each T cell clone recovered from the two mice. (D) Uniform manifold approximation and projection (UMAP) plot showing the presence of eight transcriptionally distinct clusters of GP66-specific CD4 T cells. (E) Dot plot showing the relative expression of differentially expressed genes between the eight clusters. (F–H) UMAP plots depicting the expression of either T helper type 1 (Th1) cell-associated genes (F), T follicular helper (Tfh) cell-associated genes (G), or memory-associated genes (H). (I) Module score analyses were performed to compare the relative Th1, Tfh, and memory T cell signatures among the distinct clusters of GP66-specific CD4+ T cells.
Figure 1—figure supplement 1
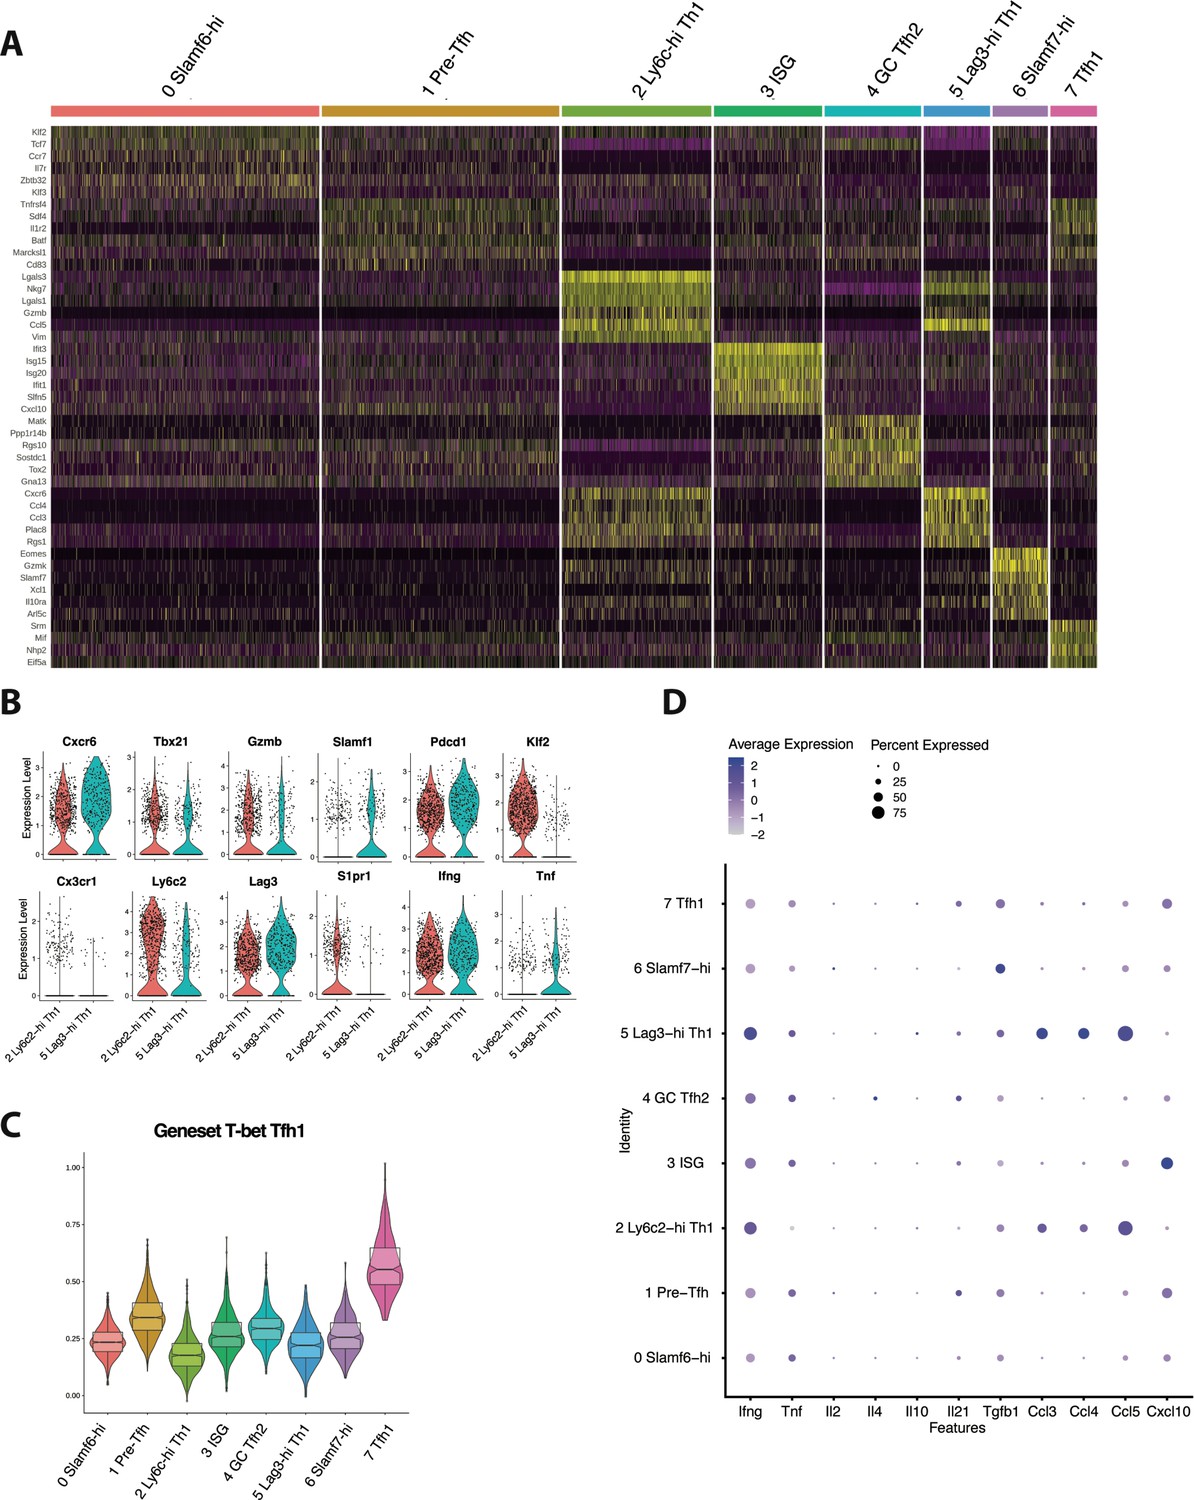
CD4+ T cells responding to chronic viral infection are composed of several transcriptionally and functionally distinct populations.
(A) Heatmap showing the top differentially expressed genes in all eight clusters. (B) Violin plots displaying the relative expression of indicated genes in Ly6c-hi and Lag3-hi T helper type 1 (Th1) cell subsets. (C) Module score analysis showing the average expression levels of the previously identified T-bet T follicular helper type 1 (Tfh1) program in the eight clusters identified in Figure 1D. (D) Dot plot summary showing the average expression of indicated cytokines and chemokines, and the percent of CD4+ T cell subsets expressing each molecule.
Figure 2
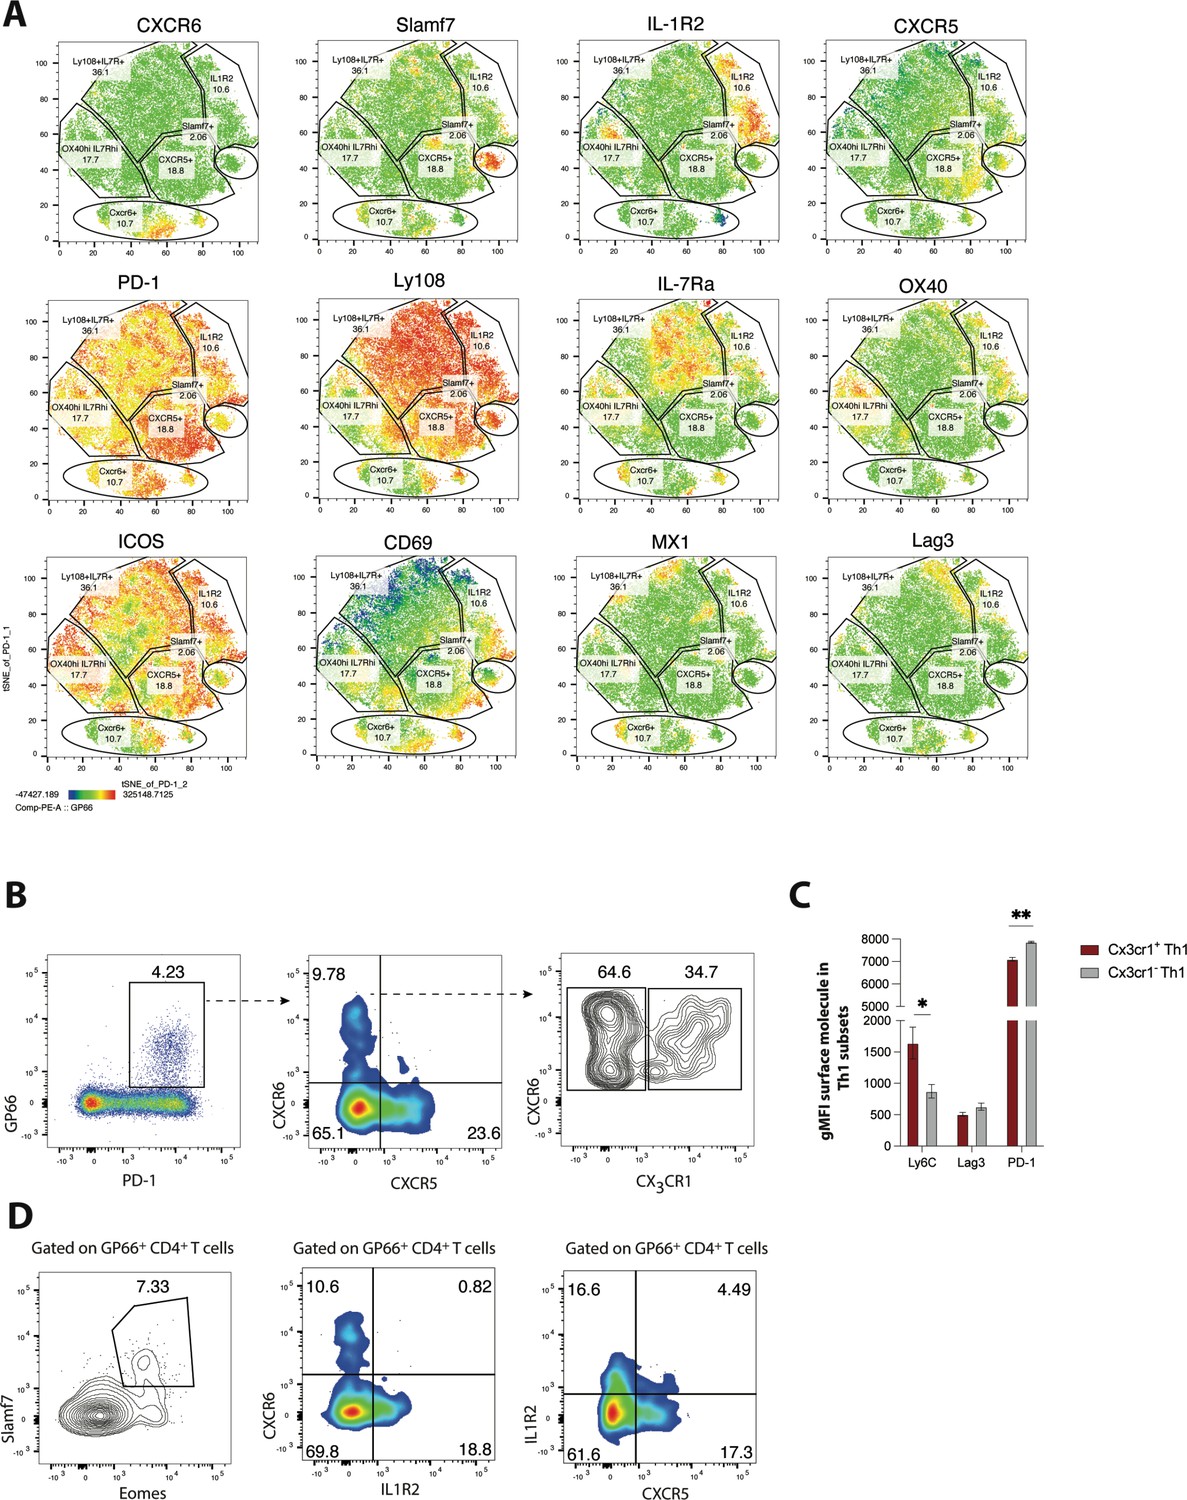
Validation of heterogeneity in CD4 T cells responding to chronic lymphocytic choriomeningitis virus (LCMV) infection using spectral flow cytometry.
(A) MX1-GFP reporter mice were infected with LCMV Clone 13 (Cl13), and spectral flow cytometry was used to assess the phenotype of splenic CD4 T cells on day 25 p.i. Using a panel of 18 parameters, t-distributed stochastic neighbor embedding (t-SNE) visualization was performed on total PD-1hi CD4 T cells (which include both GP66-specific and other LCMV epitope-reactive CD4 T cells). Representative t-SNE flow plots in A are displayed for one mouse, with data being representative of three individual mice. (B) Representative flow plots showing potential gating strategy to identify CX3CR1 ± CXCR6+T helper type 1 (Th1) cell subsets. (C) Summary data showing the relative expression of indicated surface molecules in CX3CR1+ and CX3CR1− Th1 cell subsets. (D) Representative flow plots showing potential gating strategies to identify Slamf7+Eomes + (far left), and IL-1R2+CD4 T cell subsets (which may be composed of pre-T follicular helper [Tfh] and Tfh1 subsets). Data (mean ± SEM) in C are from three individual mice, and were analyzed with unpaired student’s t-tests. Data are representative of at least two independent experiments. * p < 0.05, ** p < 0.01.
Figure 3 with 1 supplement

Trajectory analysis and clonal lineage tracing highlights that most GP66-specific CD4 T cells display developmental plasticity during chronic lymphocytic choriomeningitis virus (LCMV) infection, although a small fraction of clones exhibit a biased cell fate decision.
(A and B) Monocle tree trajectory plots showing predicted cellular differentiation of GP66-specific CD4 T cell subsets based on trajectory analysis. (C) Summary chart displaying clonal overlap among GP66+ CD4 T cell subsets. (D) Uniform manifold approximation and projection (UMAP) plot as in Figure 1D, but colored by clone membership. (E) Heatmap showing subset distribution and frequency of 329 clones (n=168 clones from mouse 1 [M1] and n=159 clones from mouse 2 [M2]) among indicated CD4 T cell lineage (T helper type 1 [Th1], T follicular helper [Tfh], and Slamf6hi memory) as defined by Monocle state.
Figure 3—figure supplement 1
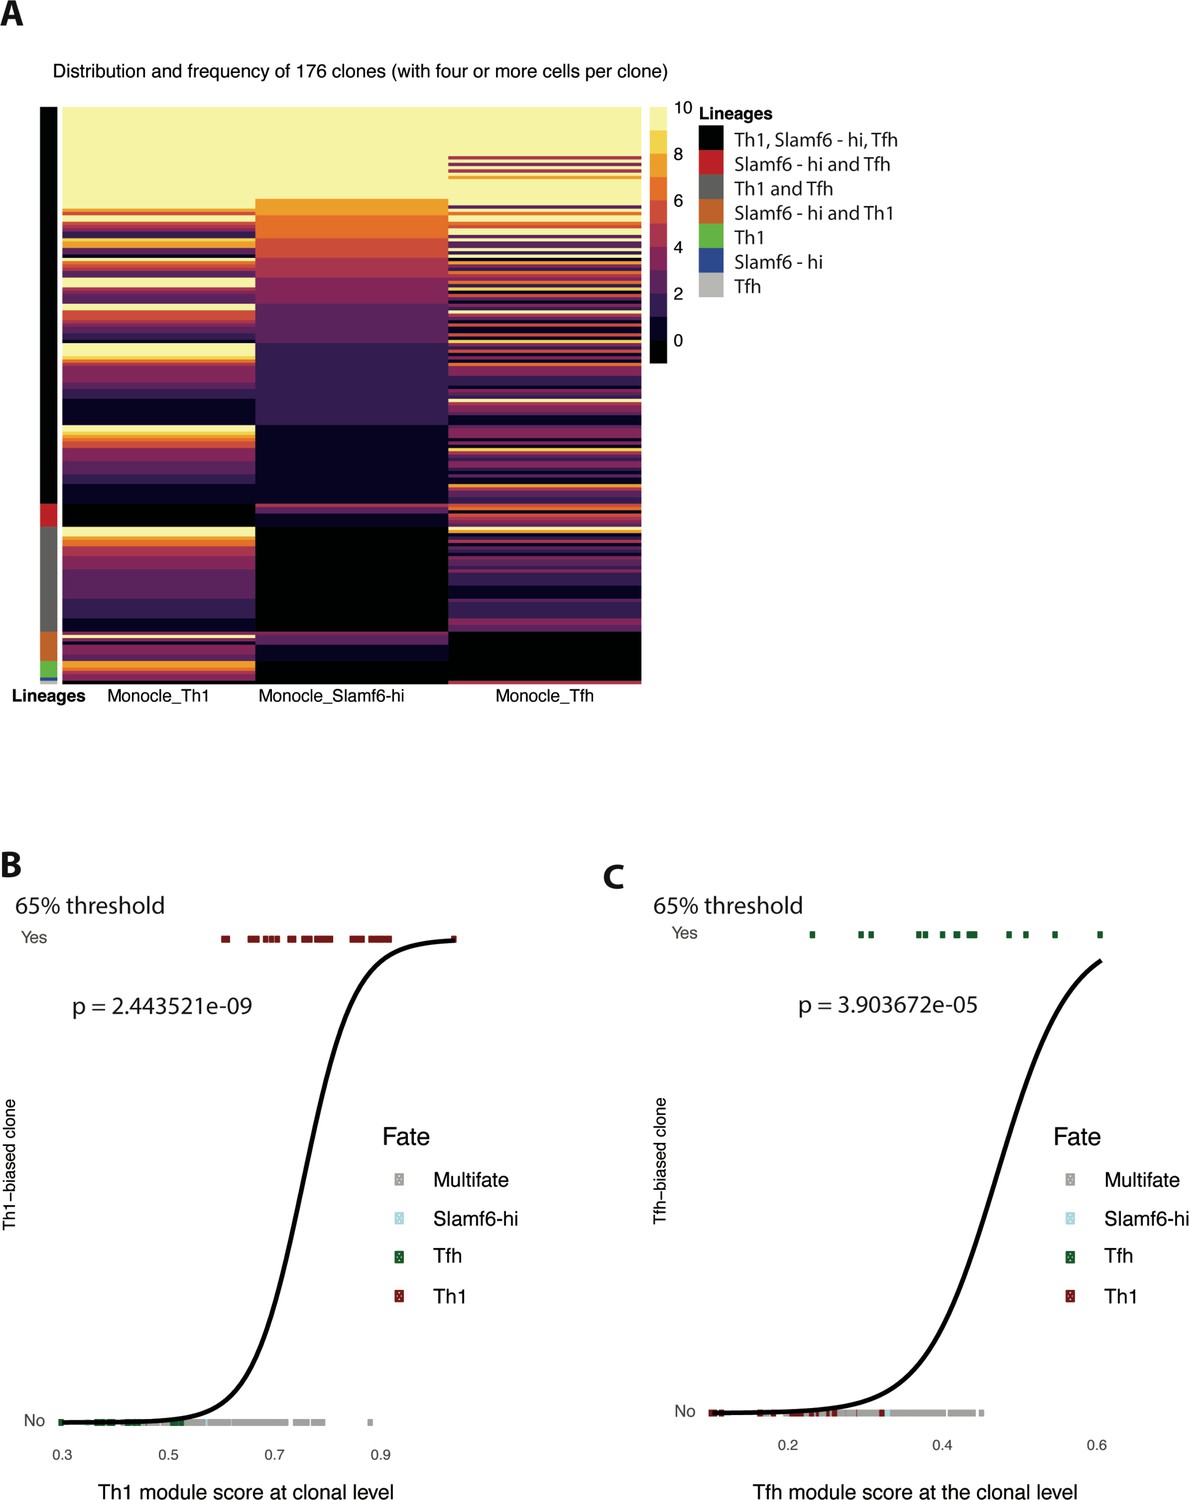
Trajectory analysis and clonal lineage tracing indicate that a small fraction of GP66-specific CD4 T cells display display a biased cell fate decision.
(A) Heatmap showing subset distribution and frequency of 176 clones (with four or more cells per clone) among indicated CD4 T cell lineage (T helper type 1 [Th1], T follicular helper [Tfh], and Slamf6hi memory) as defined by Monocle state. (B–C) Logistic regression analysis comparing Th1 (B) or Tfh (C) single cell-fate biased clones vs subset-specific (Th1, (B); Tfh (C)) module scores calculated at the clonal level. p Values were calculated using Wald test.
Figure 4 with 1 supplement
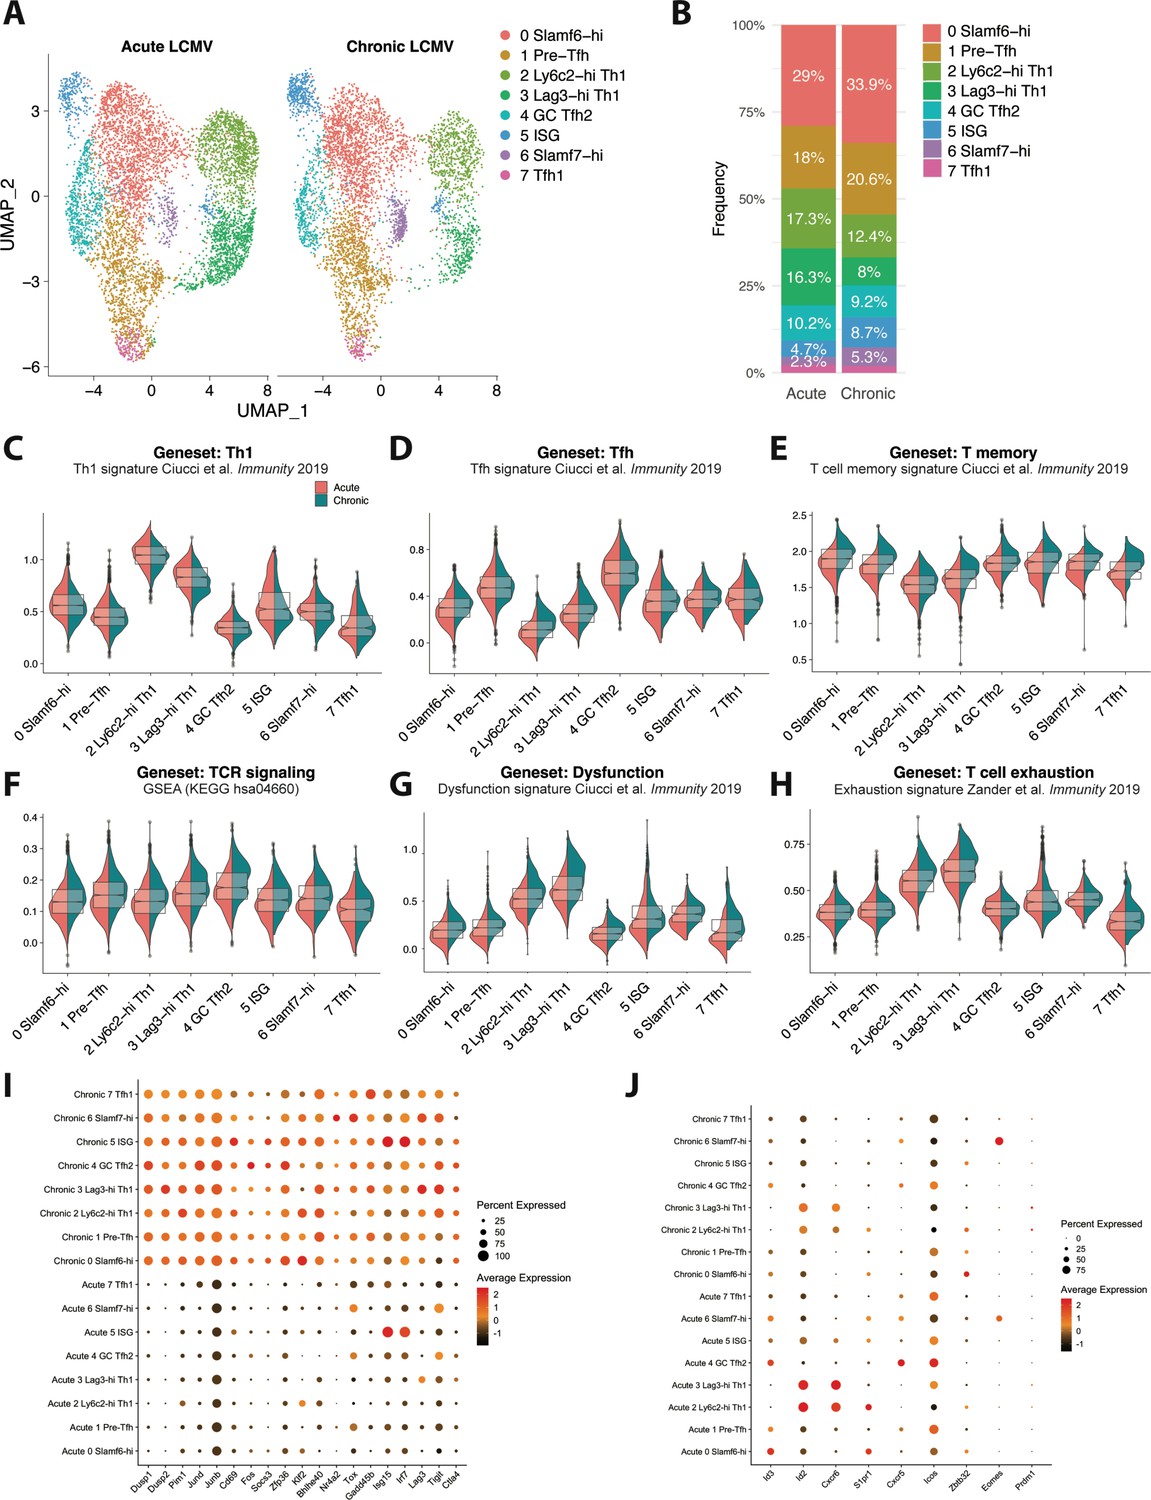
CD4 T cells responding to chronic viral infection display altered subset distribution patterns and core gene expression modules compared to their acute infection counterparts.
(A) A canonical correlation analysis (CCA) was performed on single cell RNA-sequencing (scRNA-seq) libraries obtained from GP66-specific CD4+ T cells during chronic lymphocytic choriomeningitis virus (LCMV) Clone 13 (Cl13) infection (this study) and acute LCMV Armstrong infection (Khatun et al., 2021) that were integrated together using the integration function in Seurat (Butler et al., 2018). (B) Summary graph showing the relative subset distribution of GP66 + CD4 T cells subsets during acute and chronic LCMV infection on day 10 p.i. (C–H) Module score analyses showing the average expression levels of the T helper type 1 (Th1), T follicular helper (Tfh), memory T cell, T cell receptor (TCR) signaling, and T cell dysfunction programs among the CD4 T cell subsets identified in A. (I–J) Summary dot plots showing the average gene expression and the proportion of each cell subset expressing indicated gene. All genes listed in (I) were among the top 50 differentially expressed genes that were upregulated across multiple distinct subsets in response to chronic LCMV infection.
Figure 4—figure supplement 1
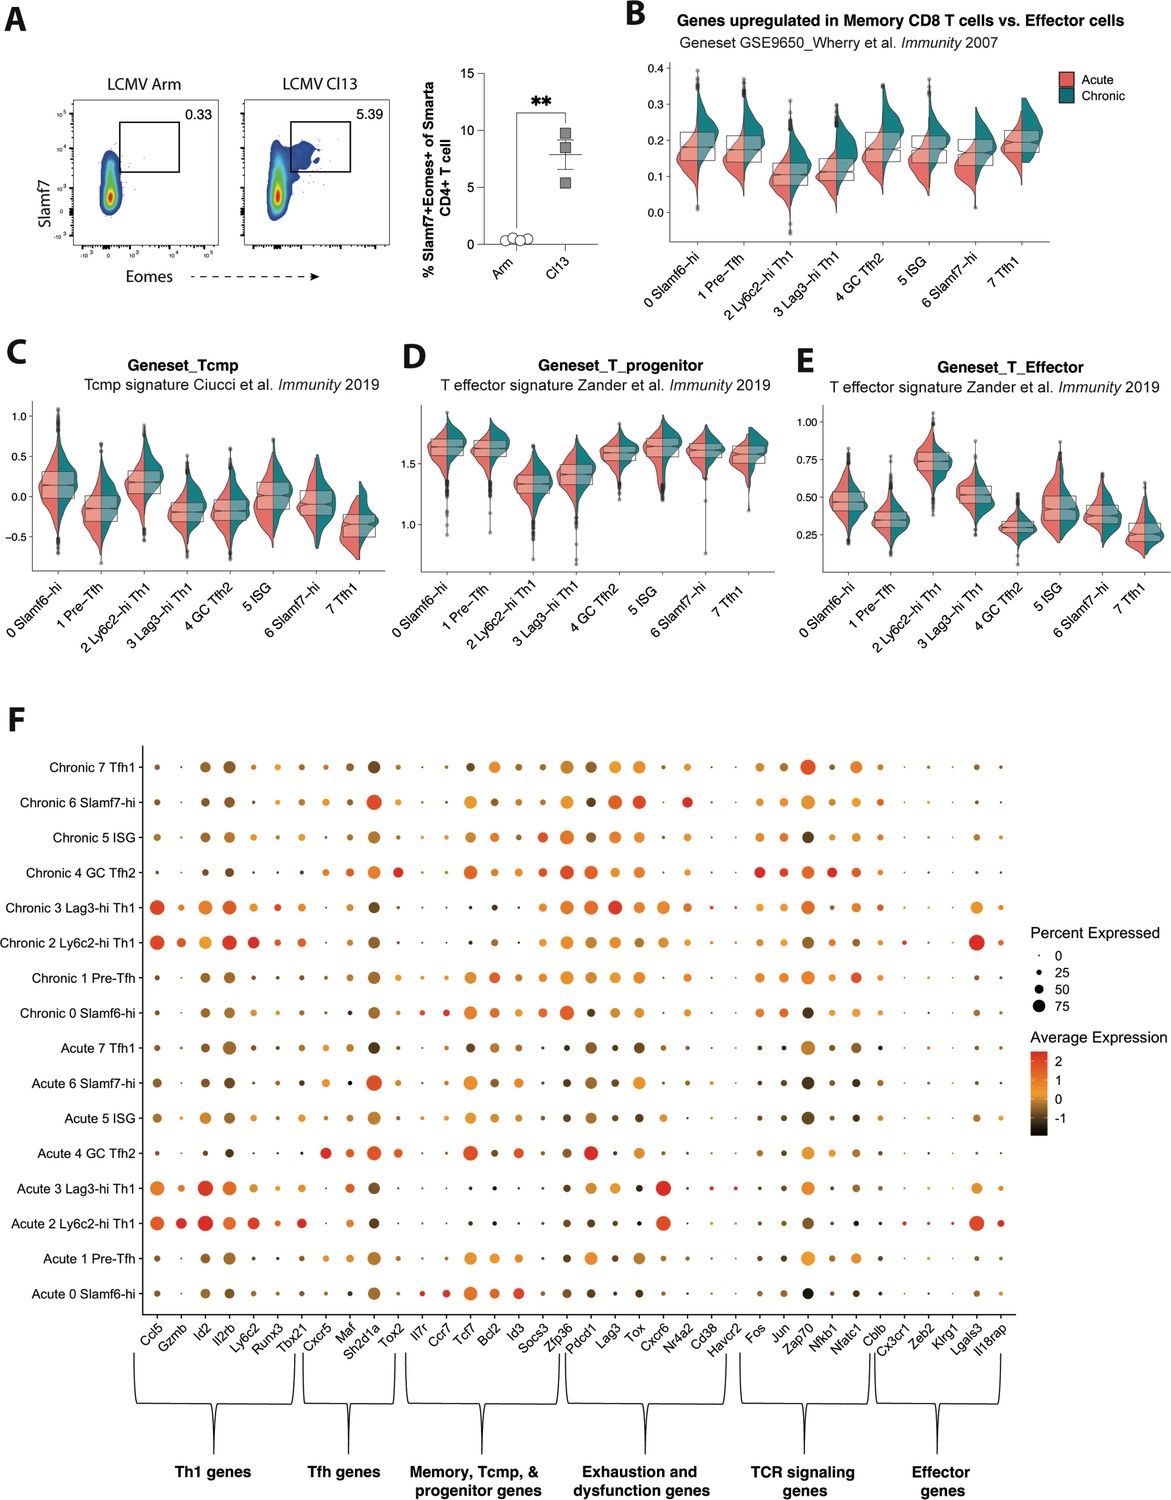
CD4 T cells responding to chronic lymphocytic choriomeningitis virus (LCMV) infection display altered subset distribution patterns and changes in gene expression programs compared to their acute infection counterparts.
(A) Representative flow plots (left) and summary data (right) showing the proportion of the Slamf7+Eomes+ subset among T cell receptor (TCR) Tg Smarta CD4+ T cells on day 14 p.i. (B–E) Module score analyses showing the average expression levels of genes upregulated in memory cells vs effector cells (B), T cell memory precursor (Tcmp) or progenitor CD8 T cell signatures (C and D), or an effector CD8 T cell gene signature in each of the eight clusters identified in our single cell RNA-sequencing (scRNA-seq) analysis. (F) Summary dot plot showing the relative expression of each indicated gene (that were selected from gene sets used for module score analyses) and the proportion of each CD4+ T cell subset expressing the respective gene. Data (mean ± SEM) in (A) are from three to four mice per group, were analyzed using an unpaired student’s t-test, and are representative of at least two independent experiments. ** p < 0.01.
Tables
Key resources table
| Reagent type (species) or resource | Designation | Source or reference | Identifiers | Additional information |
|---|---|---|---|---|
| Strain and strain background | Lymphocytic choriomeningitis virus (LCMV) Clone 13 (Cl13) strain | Rafi Ahmed Laboratory | Grew up in house | |
| Strain and strain background | LCMV Armstrong strain | Rafi Ahmed Laboratory | Grew up in house | |
| Antibody | APC/fire rat monoclonal anti-mouse CD4 (GK1.5) | Biolegend | Cat #100460 RRID:AB_2572111 | 1:300 |
| Antibody | AF647 rat monoclonal anti-mouse CD4 (GK1.5) | Biolegend | Cat #100460 RRID:AB_2572111 | 1:300 |
| Antibody | Pe/Cyanine7 rat monoclonal anti-mouse PD.1 (RMP1-30) | Biolegend | Cat #109110 RRID:AB_572017 | 1:200 |
| Antibody | APC/Cyanine7 rat monoclonal anti-mouse PD.1 (29F.1A12) | Biolegend | Cat #135224 RRID:AB_ 2563523 | 1:200 |
| Antibody | APC/Cyanine7 rat monoclonal anti-mouse/human CD44 (IM-7) | Biolegend | Cat #103028 RRID:AB_830785 | 1:1000 |
| Antibody | APC rat monoclonal anti-mouse CXCR5 (L138D7) | Biolegend | Cat #145506 RRID: AB_2561970 | 1:100 |
| Antibody | PE/Dazzle 594 rat monoclonal anti-mouse CXCR6 (SA051D1) | Biolegend | Cat #151117 RRID:AB_2721700 | 1:200 |
| Antibody | PerCPeFluor710 rat monoclonal anti-mouse CXCR6 (Danid2) | Thermofisher | Cat # 46-9186-82 RRID:AB_ AB_2734904 | 1:200 |
| Antibody | BV785 rat monoclonal anti-mouse Lag3 (C9B7W) | Biolegend | Cat # 125219 RRID:AB_256657 | 1:100 |
| Antibody | PE/Cyanine7 rat monoclonal anti-mouse CD127 (A7R34) | Biolegend | Cat #135014 RRID:AB_1937265 | 1:100 |
| Antibody | Brilliant Blue mouse monoclonal anti-mouse 700 Tim3 (5D12) | BD Biosciences | Cat #747619 RRID:AB_2744185 | 1:100 |
| Antibody | Spark NIR 685 Armenian hamster monoclonal anti-mouse CD69 (H1.2F3) | Biolegend | Cat #104557 RRID:AB_2860607 | 1:100 |
| Antibody | BUV395 rat monoclonal anti-mouse CD44 (IM7) | BD Biosciences | Cat #740215 RRID: AB_2739963 | 1:500 |
| Antibody | BV711 rat monoclonal anti-mouse PSGL1 (2PH1) | BD Biosciences | Cat #740746 RRID: AB_2740414 | 1:100 |
| Antibody | BV650 rat monoclonal anti-mouse CD83 (Michel-19) | BD Biosciences | Cat #740619 RRID: AB_2740317 | 1:100 |
| Antibody | BV605 rat monoclonal anti-mouse PD-1 (29 F.1A12) | Biolegend | Cat #135220 RRID: AB_2562616 | 1:200 |
| Antibody | BV510 mouse monoclonal anti-mouse Ly108 (13G3) | BD Biosciences | Cat #745073 RRID: AB_2742691 | 1:200 |
| Antibody | Percp cy5.5 mouse monoclonal anti-mouse CX3CR1 (SA011F11) | Biolegend | Cat #149010 RRID: AB_2564494 | 1:100 |
| Antibody | PerCP rat monoclonal anti-mouse Ly-6c (HK1.4) | Biolegend | Cat #128028 RRID: AB_10897805 | 1:100 |
| Antibody | Pacific Blue rat anti-mouse Bst2 | Biolegend | Cat #127108 RRID: AB_2028455 | 1:100 |
| Antibody | BV421 rat monoclonal anti-mouse Slamf7 (129C1) | BD Biosciences | Cat #747997 RRID: AB_2872458 | 1:100 |
| Antibody | Goat polyclonal Anti-mouse IL1R2 | Thermofisher | Cat # PA5-47759 RRID:AB_11152697 | 1:400 |
| Antibody | Pe/Cyanine5 syrian hamster monoclonal anti-mouse ICOS (15F9) | Biolegend | Cat # 107708 RRID: AB_313337 | 1:100 |
| Antibody | APC-Fire750 rat monoclonal anti-mouse OX40 (OX-86) | Biolegend | Cat #119423 RRID: AB_2715993 | 1:100 |
| Other | PE LCMV I-A(b) GP66-77 tetramer | NIH Tetramer Core Facility | https://tetramer.yerkes.emory.edu | 1:500 |
| Commercial assay or kit | Chromium Single Cell 3’ Library & Gel Bead Kit v2 | 10× Genomics | Cat#PN-120267 | |
| Commercial assay or kit | Chromium Single Cell A Chip Kit | 10× Genomics | Cat#PN-1000009 | |
| Commercial assay or kit | Chromium i7 Multiplex Kit | 10× Genomics | Cat# PN-120262 | |
| Commercial assay or kit | Dynabeads MyOne Silane | Thermofisher | Cat#37002D | |
| Commercial assay or kit | SPRIselect Reagent Kit | Beckman Coulter | Cat#B23318 | |
| Commercial assay or kit | Kappa NGS quantification kit | KAPABiosystems | Cat#KK4824 | |
| Commercial assay or kit | NextSeq 500/550 High Output Kit v2.5 (150 cycles) | Illumina | Cat#20024907 | |
| Software and algorithm | Cell Ranger | 10× Genomics | https://support.10xgenomics.com/single-cell-gene-expression/software/pipelines/latest/installation | |
| Software and algorithm | Seurat | Satija et al., 2015 | https://satijalab.org/seurat/ | |
| Software and algorithm | Monocle-2 | Qiu et al., 2017; Trapnell et al., 2014 | http://cole-trapnell-lab.github.io/monocle-release/docs/ | |
| Software and algorithm | Flowjo Version 10.5.3 | Tree Star | N/A | |
| Software and algorithm | Prism 8 | Graphpad Software | N/A |
Additional files
-
MDAR checklist
- https://cdn.elifesciences.org/articles/80079/elife-80079-mdarchecklist1-v2.docx
-
Supplementary file 1
Clonal Distribution and cellular fate of GP66-specific CD4 T cell clones (with 4 or more cells per clone) during LCMV Cl13 infection.
- https://cdn.elifesciences.org/articles/80079/elife-80079-supp1-v2.xls
Download links
A two-part list of links to download the article, or parts of the article, in various formats.
Downloads (link to download the article as PDF)
Open citations (links to open the citations from this article in various online reference manager services)
Cite this article (links to download the citations from this article in formats compatible with various reference manager tools)
Delineating the transcriptional landscape and clonal diversity of virus-specific CD4+ T cells during chronic viral infection
eLife 11:e80079.
https://doi.org/10.7554/eLife.80079


