New hypotheses of cell type diversity and novelty from orthology-driven comparative single cell and nuclei transcriptomics in echinoderms
- Department of Biological Sciences, Carnegie Mellon University, United States
Figures
Figure 1
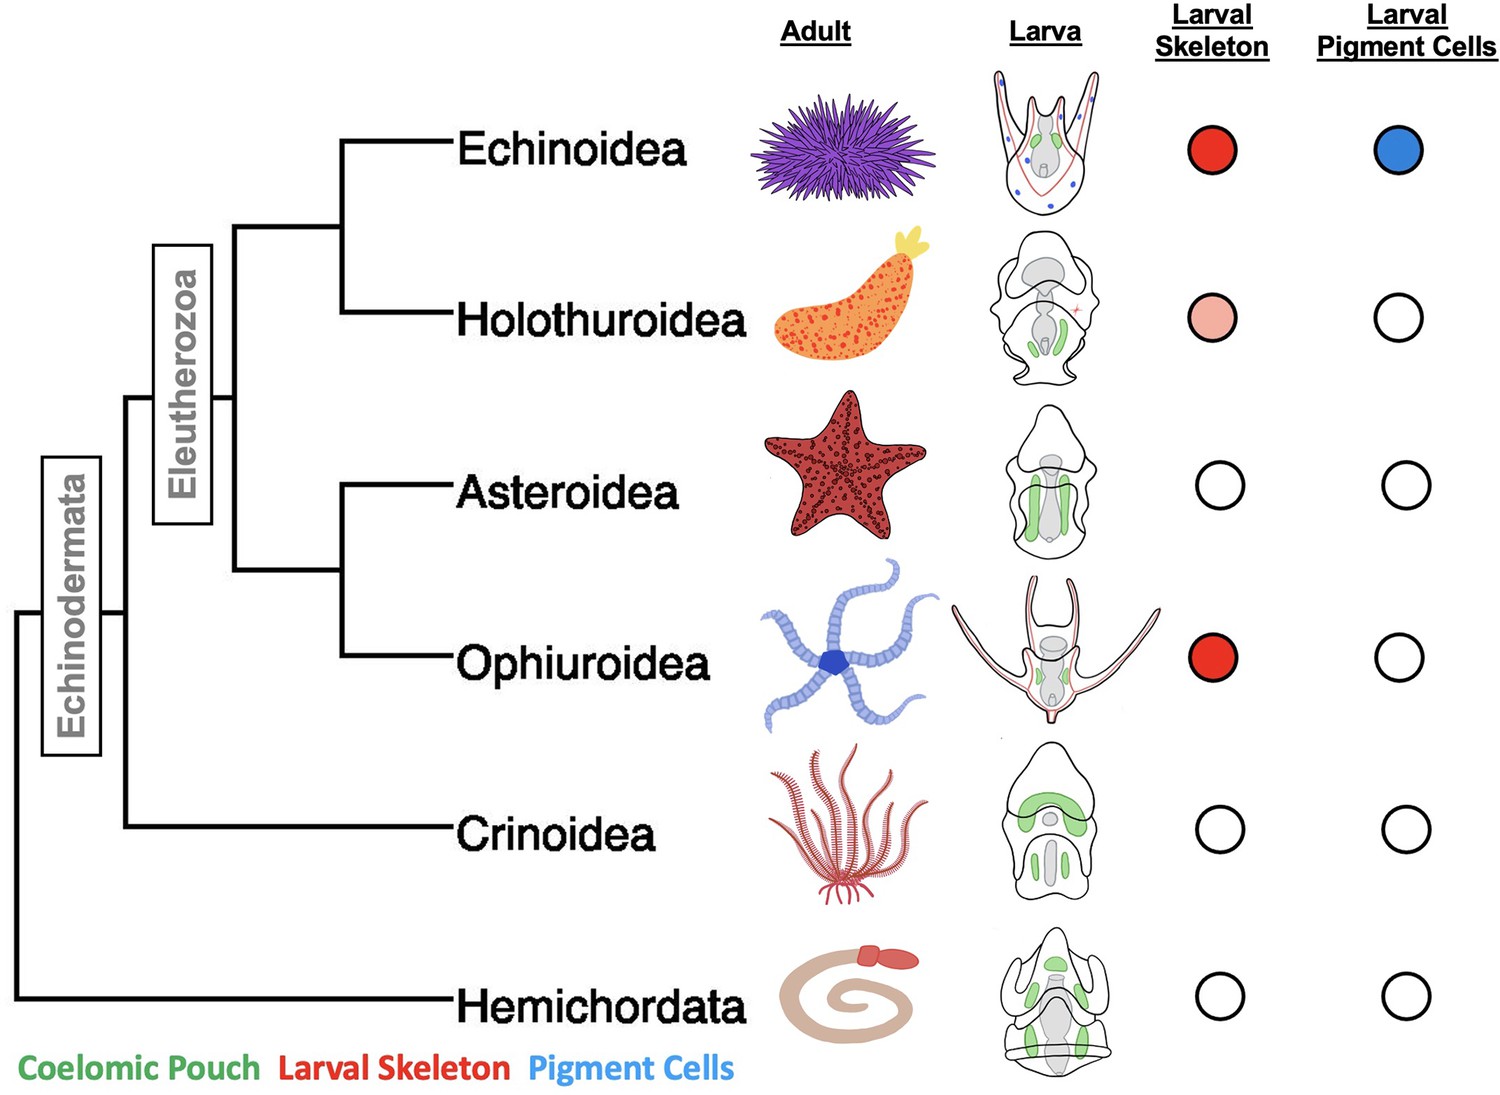
A phylogeny of the major classes of Echinodermata, and Hemichordata outgroup and diagrams of adult and larval phenotypes.
Larval schematics show biomineralized larval skeletons colored in red, coelomic pouches colored green, and pigment cells colored in blue. Presence/absence is also indicated using colored circles to the left of the embryos. The pink shading indicates the secretion of biomineralized spicules, but not the formation of an extensive skeleton.
Figure 2 with 1 supplement
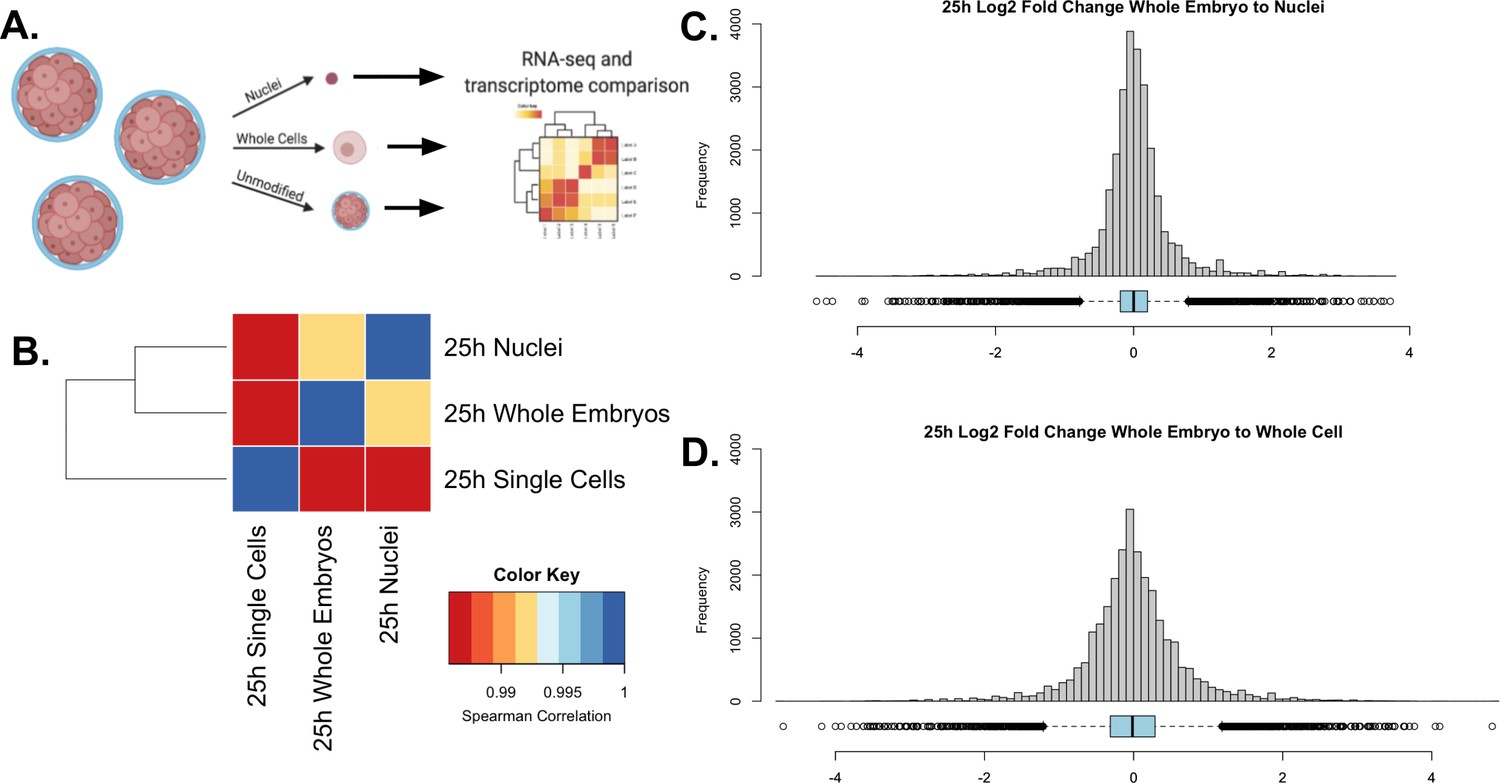
Validation of single nuclear RNA-seq protocol.
(A) A schematic representation of the experimental design. A single culture of 25 hpf P. miniata embryos was partitioned into three aliquots: 1. Whole embryos, 2. Nuclei, and 3. Single cells. RNA was extracted and sequenced and transcriptomes were compared across samples. (B) Spearman correlation was conducted on quantile-normalized gene counts from the RNA-seq dataset. Nuclear isolation had the highest correlation with the whole embryo RNA-seq dataset with τ=0.991. The whole-embryo to the whole-cell Spearman correlation coefficient of τ=0.986. Single cells to nuclei has a coefficient of τ=0.987. (C & D) Histograms and dot plots display the frequency distribution of log2 fold changes in gene expression levels between the whole embryo and nuclear or whole-cell data sets. (C) The nuclear RNA-seq datasets resulted in a distribution where 5=0.013, 5=0.558, and M=0.000.(D) The single-cell to whole embryo comparison resulted in a distribution where 5=−0.003, 5=0.683, and M=−0.013.
Figure 2—figure supplement 1

Single nucleus atlas of early development in S. purpuratus.
(A) A UMAP reduction of the combined S. purpuratus single nucleus datasets results in 15 clusters. (B) An example of a nuclear isolate. DNA is stained with Hoescht dye. The scale bar represents 250 μm. (C) A dot plot highlighting genes used to annotate clusters. Along the X-axis are the cluster names. Along the Y-axis are the genes. The size of a dot is proportional to the percentage of nuclei in that cluster expressing a given gene, while the shade of the dot correlates with the expression level. Genes that were also used as markers in Foster et al., 2020 are indicated with an asterisk.
Figure 3 with 1 supplement
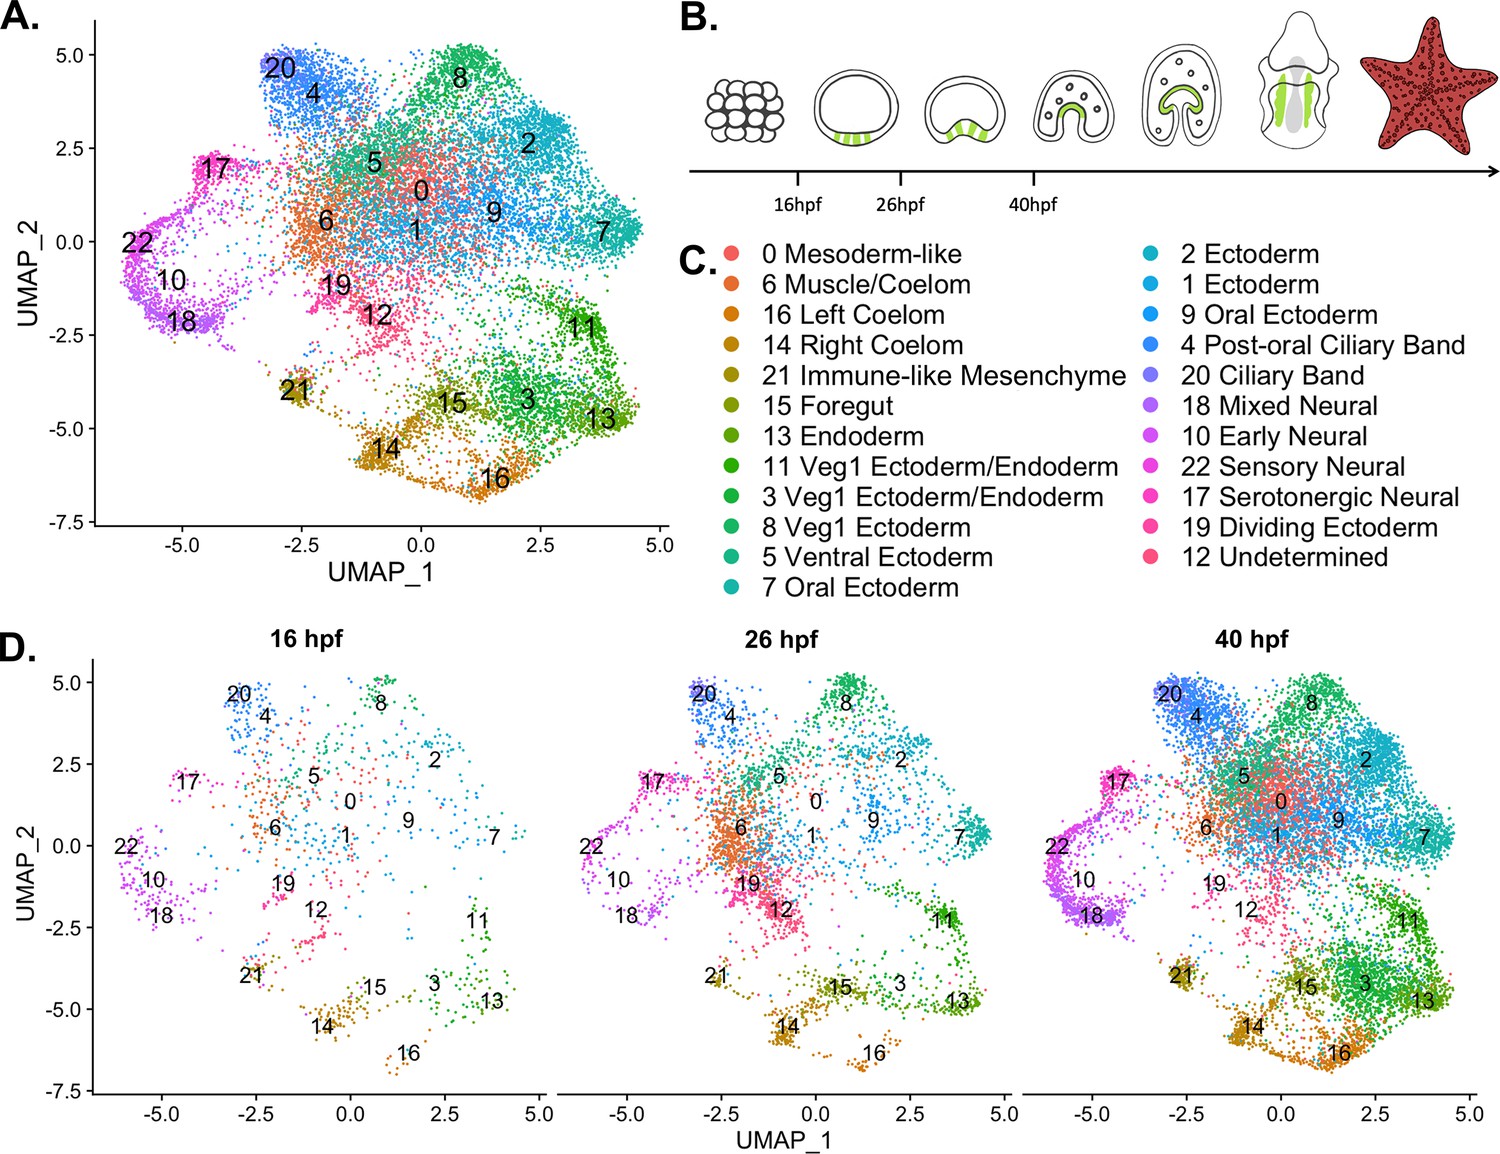
A nuclear atlas for early P. miniata development.
(A) The UMAP projection of the P. miniata atlas developed from snRNA-seq of three developmental time points. 17,118 nuclei were considered in total. (B) The schematic shows cartoons of stages for which time points were sampled. The green color indicates the coelomic pouches. (C) A key displaying the cluster names corresponding to UMAP projections in A and D. (D) The UMAP projection of the P. miniata nuclear atlas, separated by the three-time points of sampling, 16 hpf has 1076 nuclei, 26 hpf has 3888 nuclei, and 40 hpf has 12,203 nuclei.
Figure 3—figure supplement 1

Contribution from each time point to the P. miniata developmental atlas clusters.
A stacked bar graph displaying the breakdown of each cluster in the P. miniata developmental atlas by time point of sampling, normalized by sample size.
Figure 4
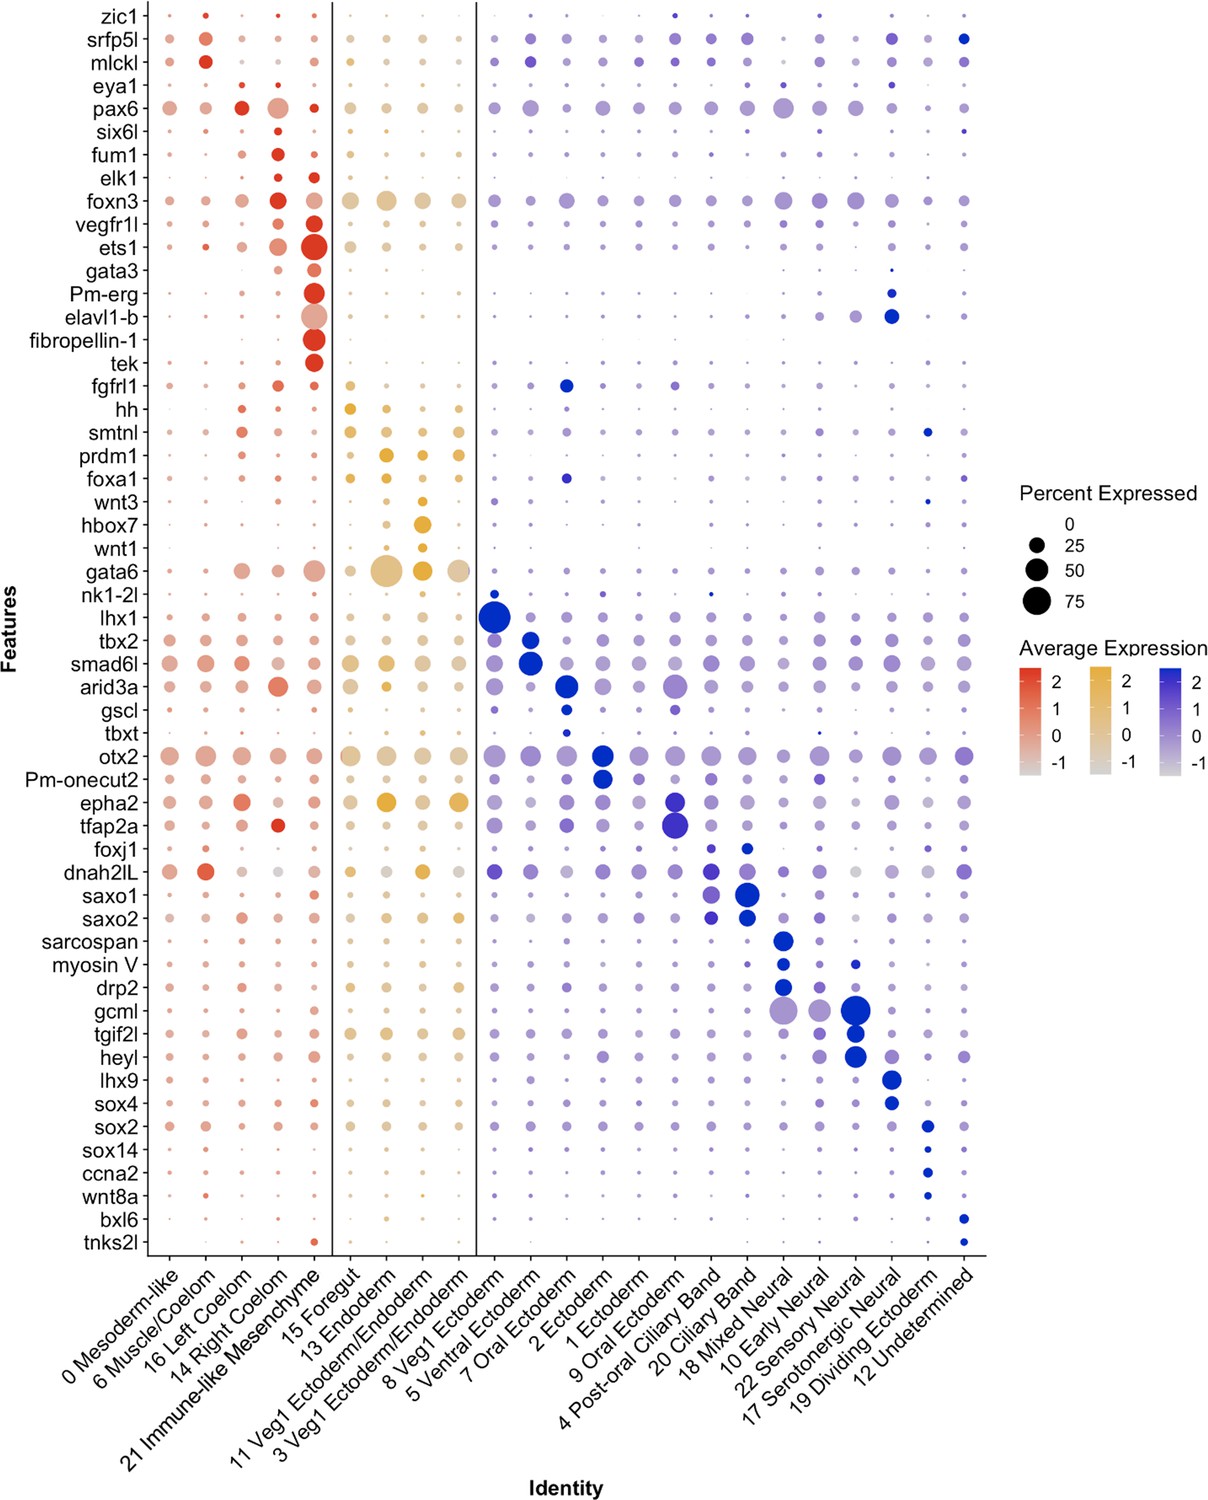
Differential expression of P. miniata marker genes was used to annotate cluster identity.
A dot plot highlighting marker genes used to determine cluster identity. The X-axis lists the cluster names, while the Y-axis lists gene names. Mesodermal clusters are colored in red, endoderm in yellow, and ectoderm/undetermined in blue. Circle size corresponds to the number of cells in the cluster expressing the gene of interest, while shade correlates with the level of expression.
Figure 5
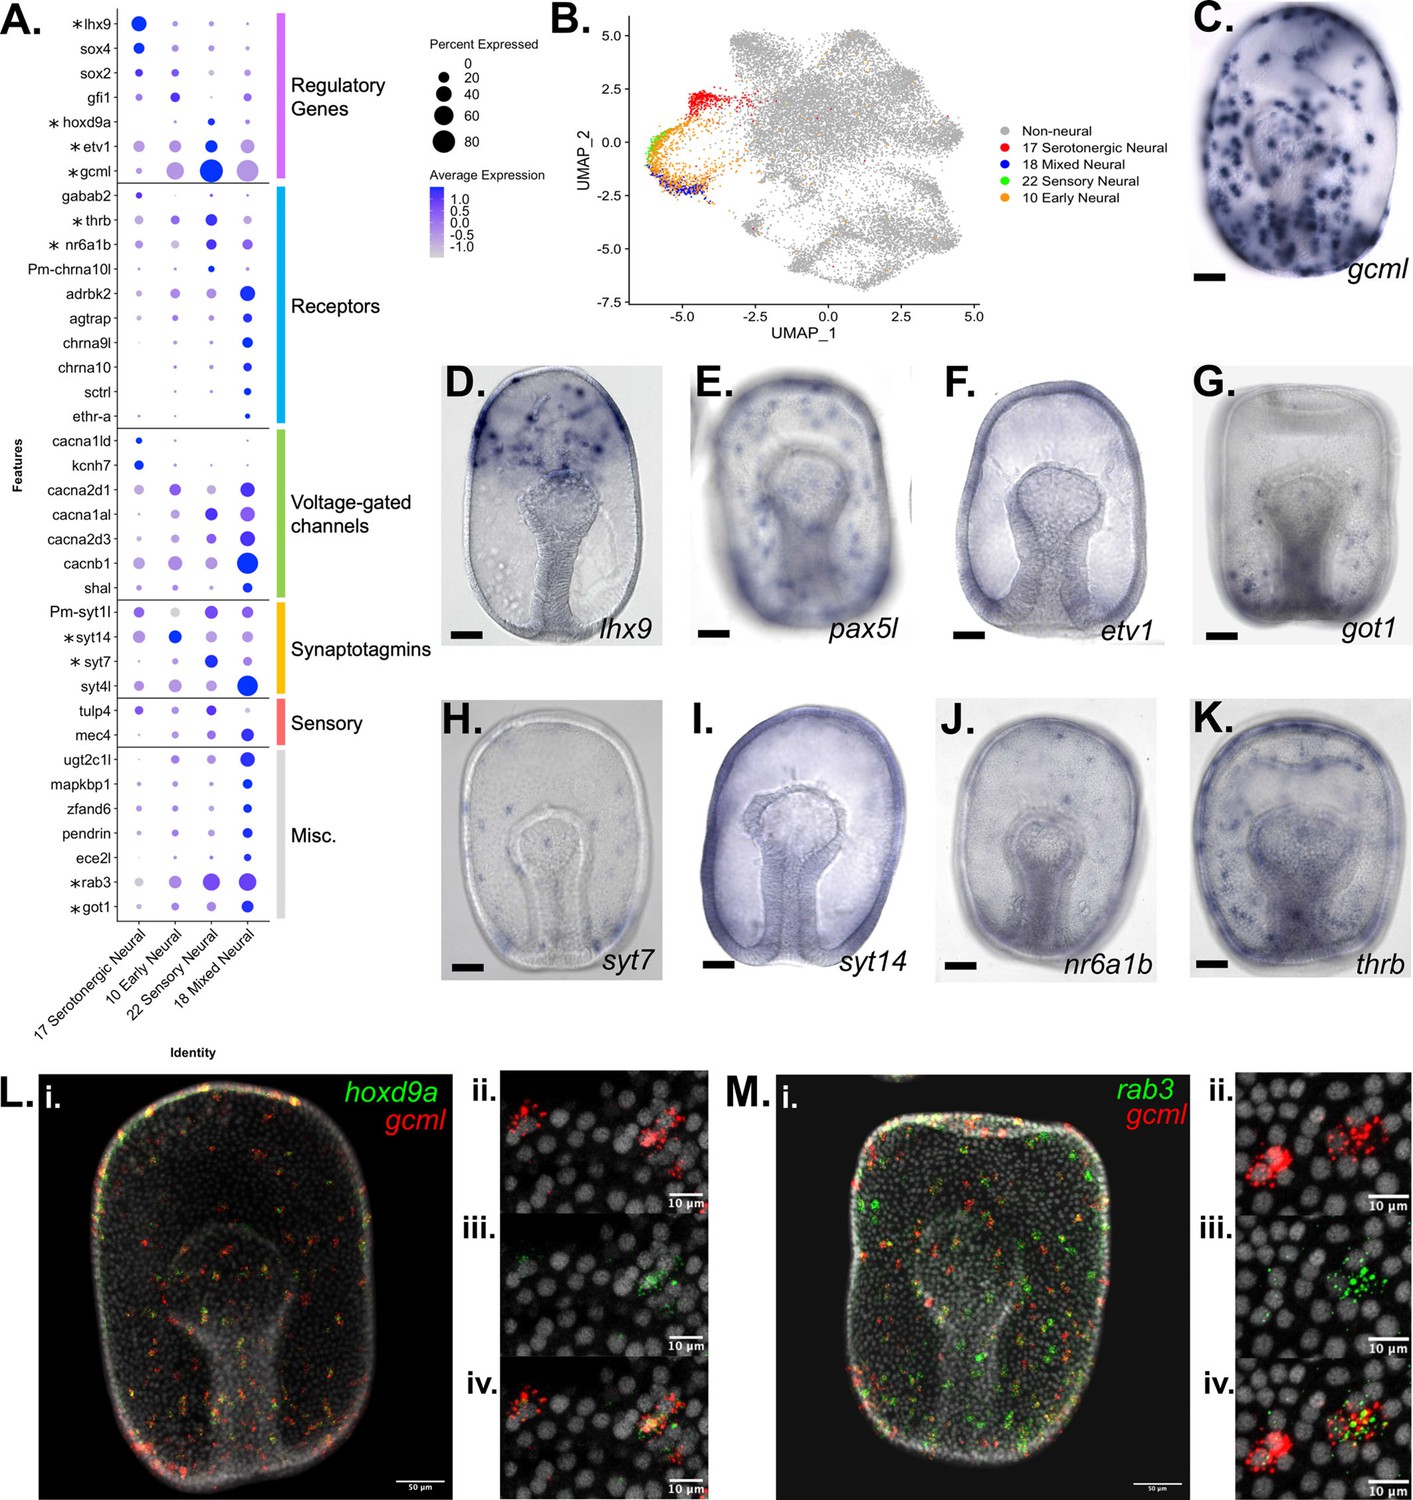
Characterization of neuronal populations in the P. miniata developmental atlas.
(A) A dot plot of the four neural clusters and a selection of genes used to annotate the clusters. The genes are divided into six categories: genes encoding: regulatory proteins, receptors, voltage-gated channels, synaptotagmins, sensory, and miscellaneous. Genes with in situs are marked with an asterisk. (B) A UMAP projection highlights the four neural clusters shown color coded. (C–K) Representative images of WMISH for validation of marker gene expression at the gastrula stage embryo (48 hpf). (D) gcml is expressed in cells throughout the ectoderm, with an exclusion zone on the oral, non-neurogenic region of the gastrula. (D) lhx9 is expressed in serotonergic neuronal precursors near the animal pole. (E) pax5L is expressed in cells embedded throughout the ectoderm, with an exclusion zone on the non-neurogenic oral surface (observed 46/46 gastrula). (F) etv1 is expressed in cells embedded throughout the ectoderm (observed in 19/19 gastrula). (G) got1 expression is observed in cells dispersed throughout the ectoderm (observed in 31/31 gastrula). (H) syt7 is expressed in cells embedded in the ectoderm, with the greatest abundance in the central and vegetal ectoderm (observed in 14/15 gastrula). (I) syt14 has broad expression across ectodermal cells (observed in 15/18 gastrula). (J) nr6a1b is expressed in cells embedded in the ectoderm (observed 38/38 gastrula). (K) thrb is expressed in cells embedded throughout the ectoderm (observed 32/33 gastrula). (L–M) Double FISH examination of additional marker genes (rab3 and hoxd9a) together with gcml. (L.i) gcml is colored red and hoxd9a, in green, are expressed in cells scattered throughout the ectoderm (WMISH validates this pattern of hoxd9a expression, with ectodermal embedding observed in 20/20 gastrula). Higher magnification microscopy shows that gcml and hoxd9a are co-expressed in some cells, while others express only gcml. (M) (M.i) gcml marked in red and rab3, in green, are expressed in cells embedded throughout the ectoderm (WMISH validates this pattern of rab3 expression, with ectodermal embedding observed in 22/23 gastrula). Higher resolution microscopy (M.ii-iv) shows that rab3 is expressed in a subset of gcml-expressing cells. Scale bars on images C-K are 50 µm.
Figure 6
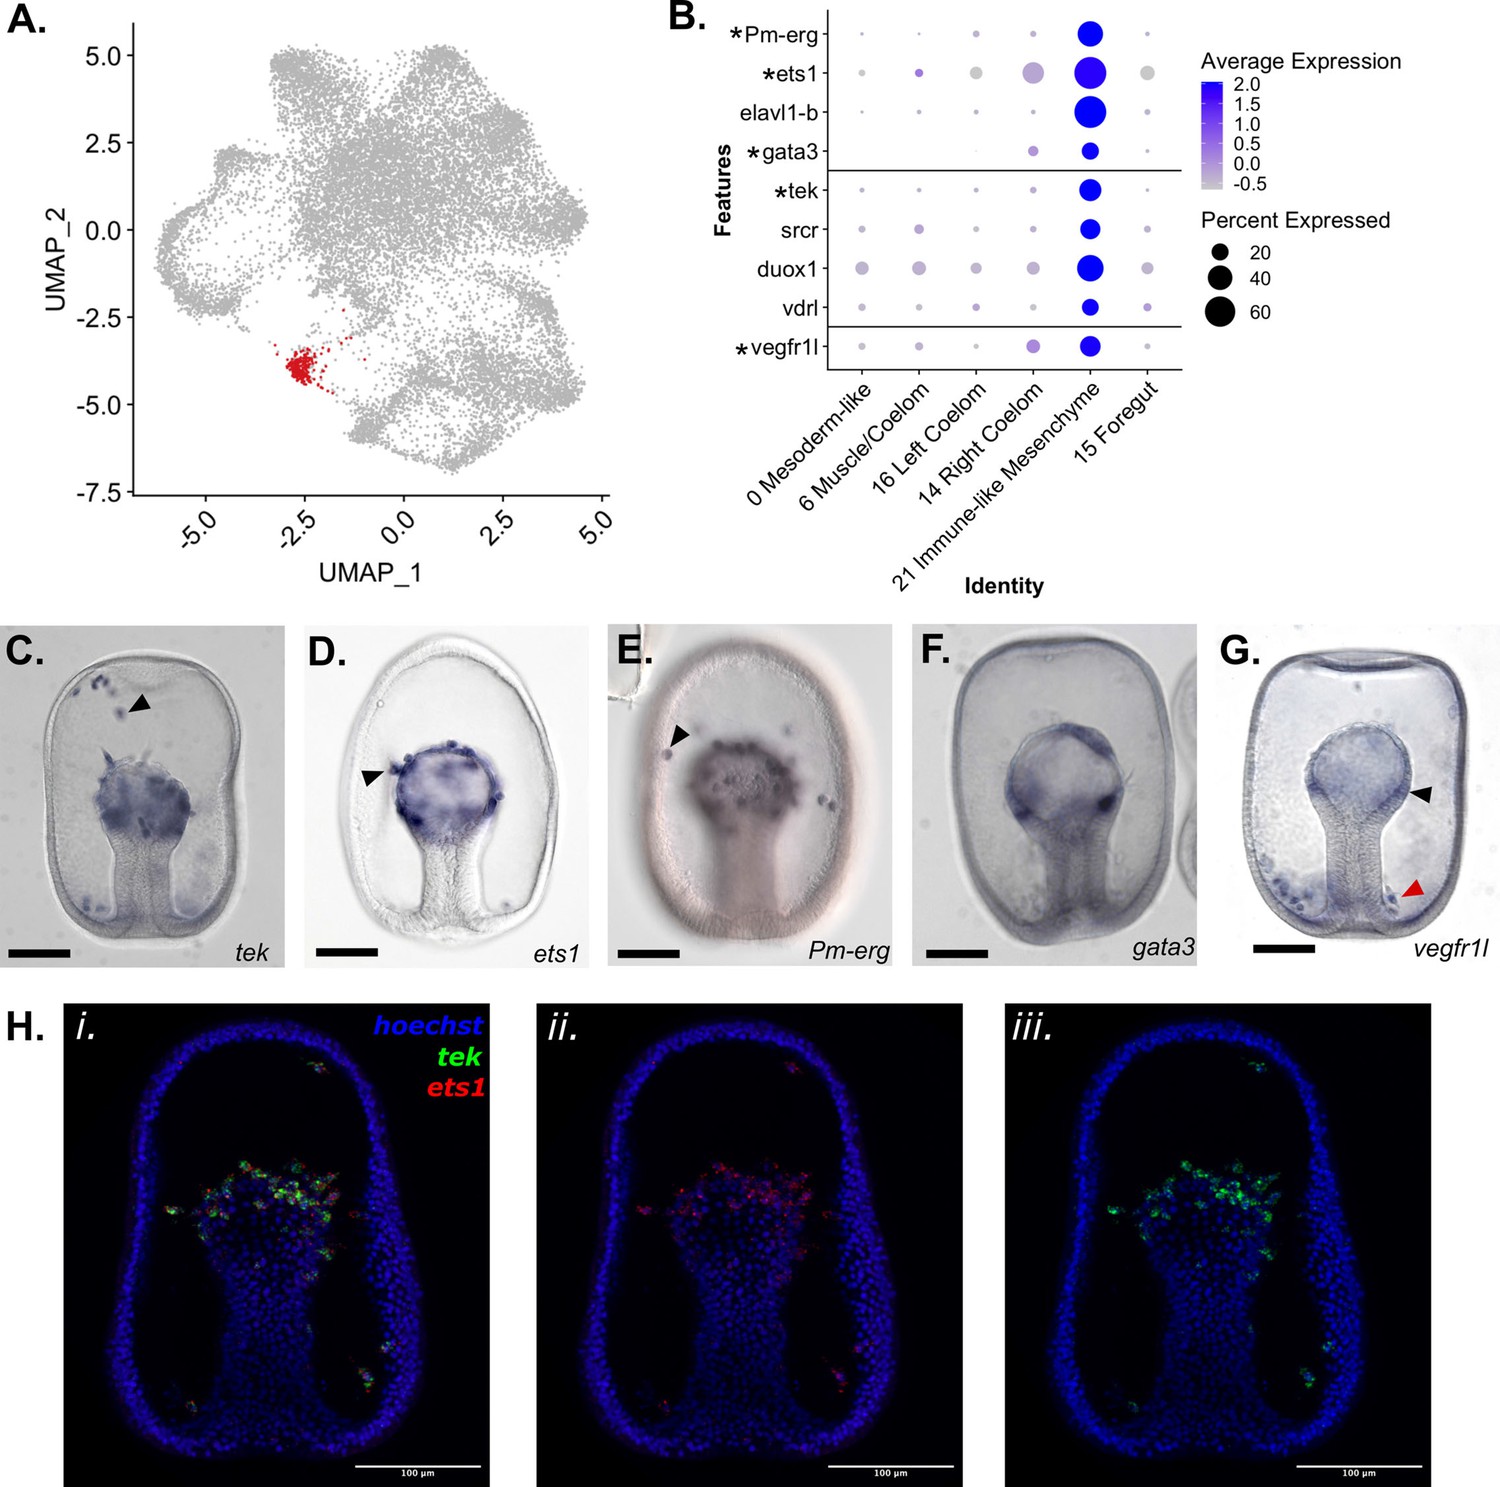
Identification of an Immune-like Mesenchyme cell type in P. miniata.
(A) A UMAP projection highlights in red the cluster annotated as Immune-like Mesenchyme. (B) A dot plot of mesodermal clusters and the genes used to identify the Immune-like Mesenchyme cluster identity. Genes with in situs are indicated with an asterisk. (C–G) Representative images of WMISH for validation of marker gene expression at the gastrula stage embryo (48 hpf). (C) tek is expressed in the mesenchyme (indicated with an arrow) and mesodermal bulb (observed in 33/34 embryos). (D) Ets1 is expressed in mesodermal cells undergoing the epithelial to mesenchyme transition (indicated with an arrow). (E) Pm-erg is expressed in mesenchymal cells (indicated with an arrow) as well as in the mesodermal bulb. (F) Gata3 is expressed in patches of the mesodermal bulb (observed 27/30 embryos). vegfr1l is expressed in the mesenchyme (indicated with a red arrow) and mesodermal bulb (indicated with a black arrow) (observed 51/55 embryos). This mesenchyme clusters in a ring around the base of the archenteron (localization observed in 28/36 embryos). (H) Double FISH shows coexpression of ets1 (ii.) and tek (iii.) in the mesenchyme gastrula. Hoechst is used to label the nuclei. Scale bars on images C-G are 100 µm.
Figure 7
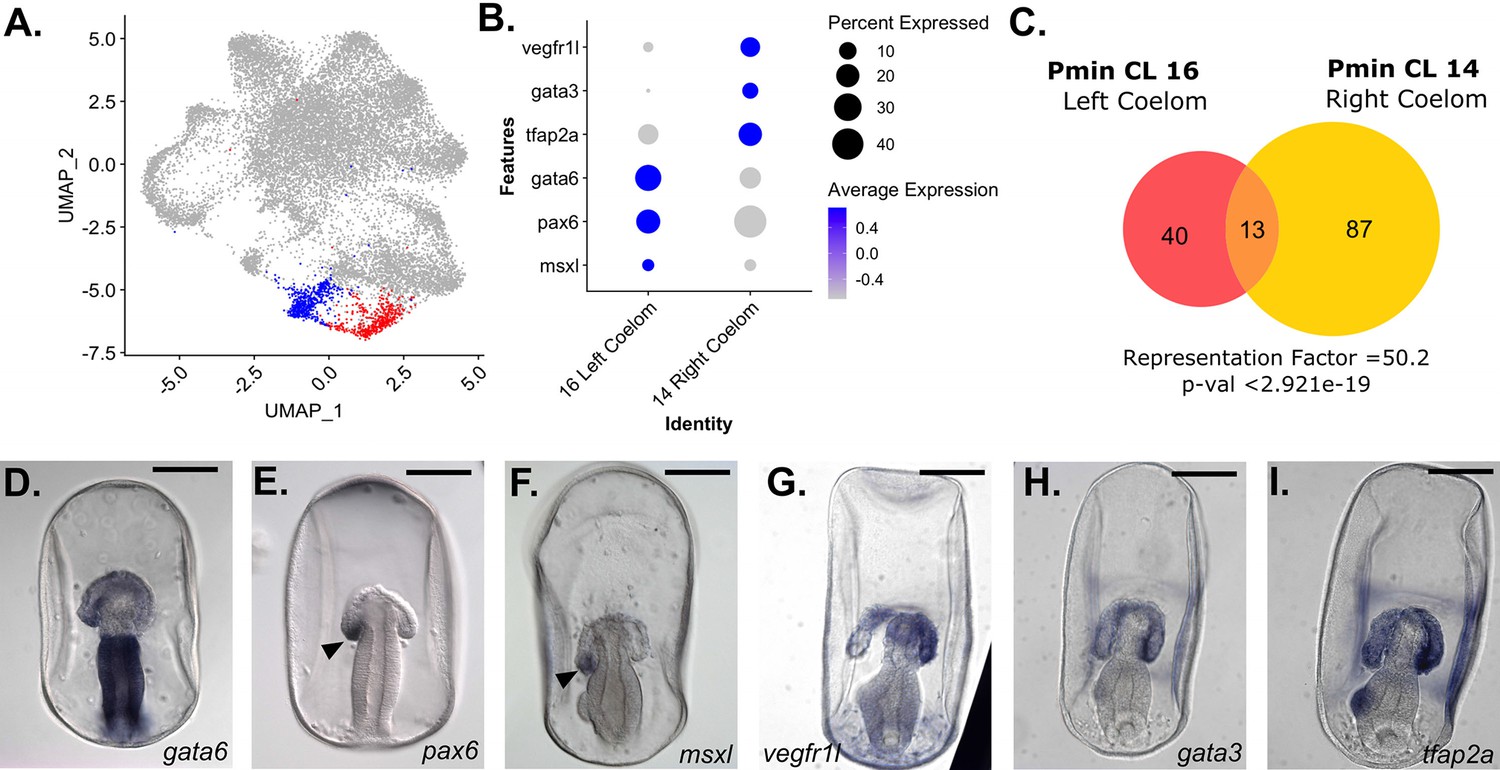
snRNA-seq detects left/right asymmetry in P. miniata coelom development.
(A) A UMAP projection of the P. miniata atlas where blue highlights the cluster for the right coelomic pouch and red highlights the cluster for the left coelomic pouch. (B) A dot plot of two coelom clusters and the genes identified as differentially expressed between the two clusters. (C) A Venn diagram shows the overlap in marker genes shared between the two coelomic cells. Thirteen genes are shared in total, with the overlap yielding a representation factor of 50.2 with a p-value <29.21e-19. Representative images of WMISH validation of genes marking the left (D–F) and right (G–I) in late gastrula stage embryos (72 hpf). gata6, pax6, and msxl are expressed in the left coelomic pouch (indicated with an arrow in E and F) and absent in the right pouch. vegfr1l, gata3, and tfap2a are expressed in both pouches but are more highly expressed in the right coelomic pouch compared to the left. Scale bars on images D-I are 100 µm.
Figure 8 with 1 supplement
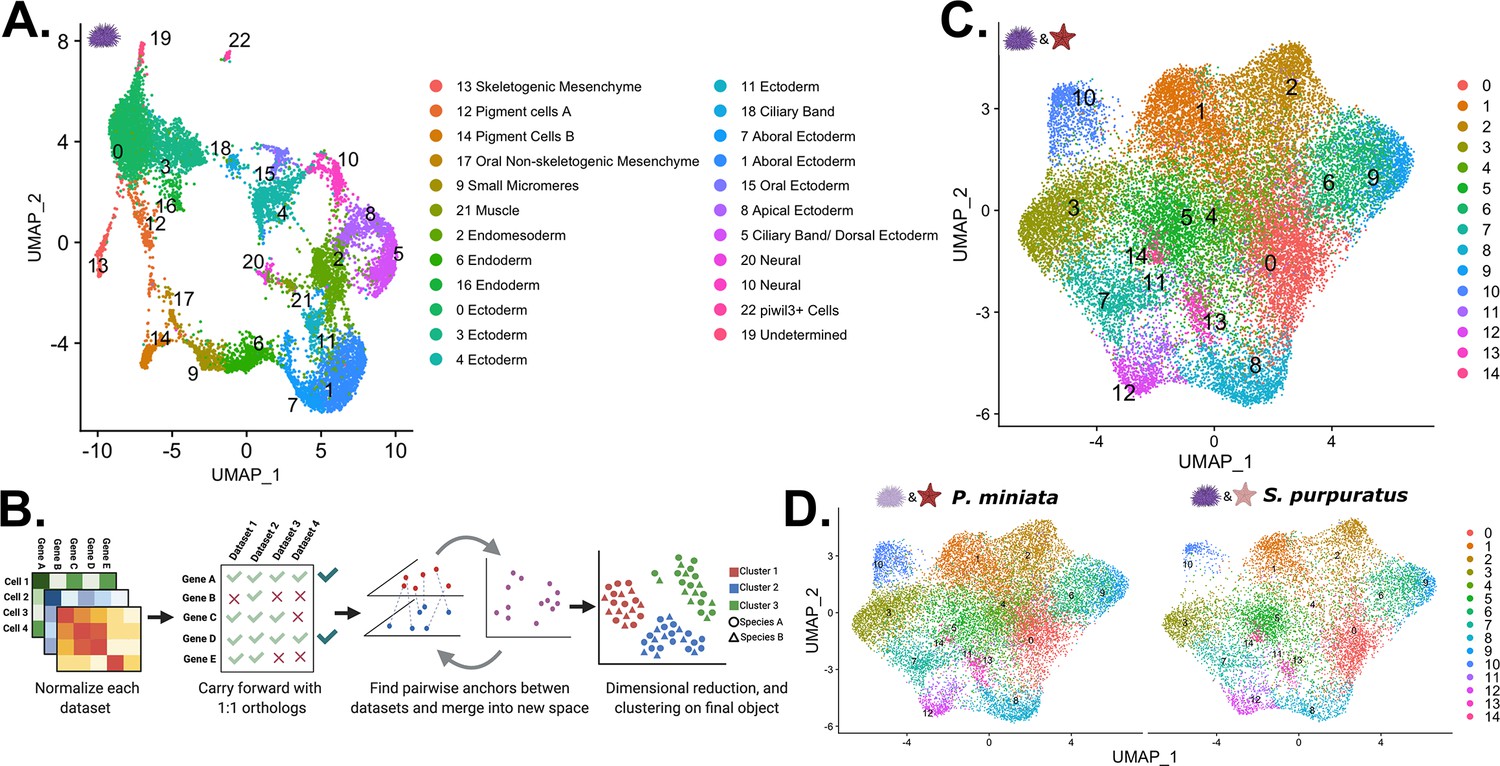
Creation of a developmental atlas in S. purpuratus and integration into a multi-species atlas.
(A) UMAP projection of the 23 clusters identified and annotated in our S. purpuratus dataset used in later analysis. (B) Our pipeline for creating a multi-species atlas that uses only 1:1 orthologs to integrate the datasets into one common space using CCA. (C) The UMAP reduction of our multi-species atlas with 15 identified clusters. (D) Views of only the P. miniata (left) and S. purpuratus (right) data points in the multi-species atlas.
Figure 8—figure supplement 1

Differential expression of marker genes used to annotate S. purpuratus atlas.
A dot plot highlighting marker genes used to determine cluster identity. The X-axis lists the cluster names, while the Y lists gene names. An asterisk indicates it was also defined as a marker in Foster et al., 2020. Circle size corresponds to the number of cells in the cluster expressing the gene of interest, while shade correlates with the level of expression.
Figure 9
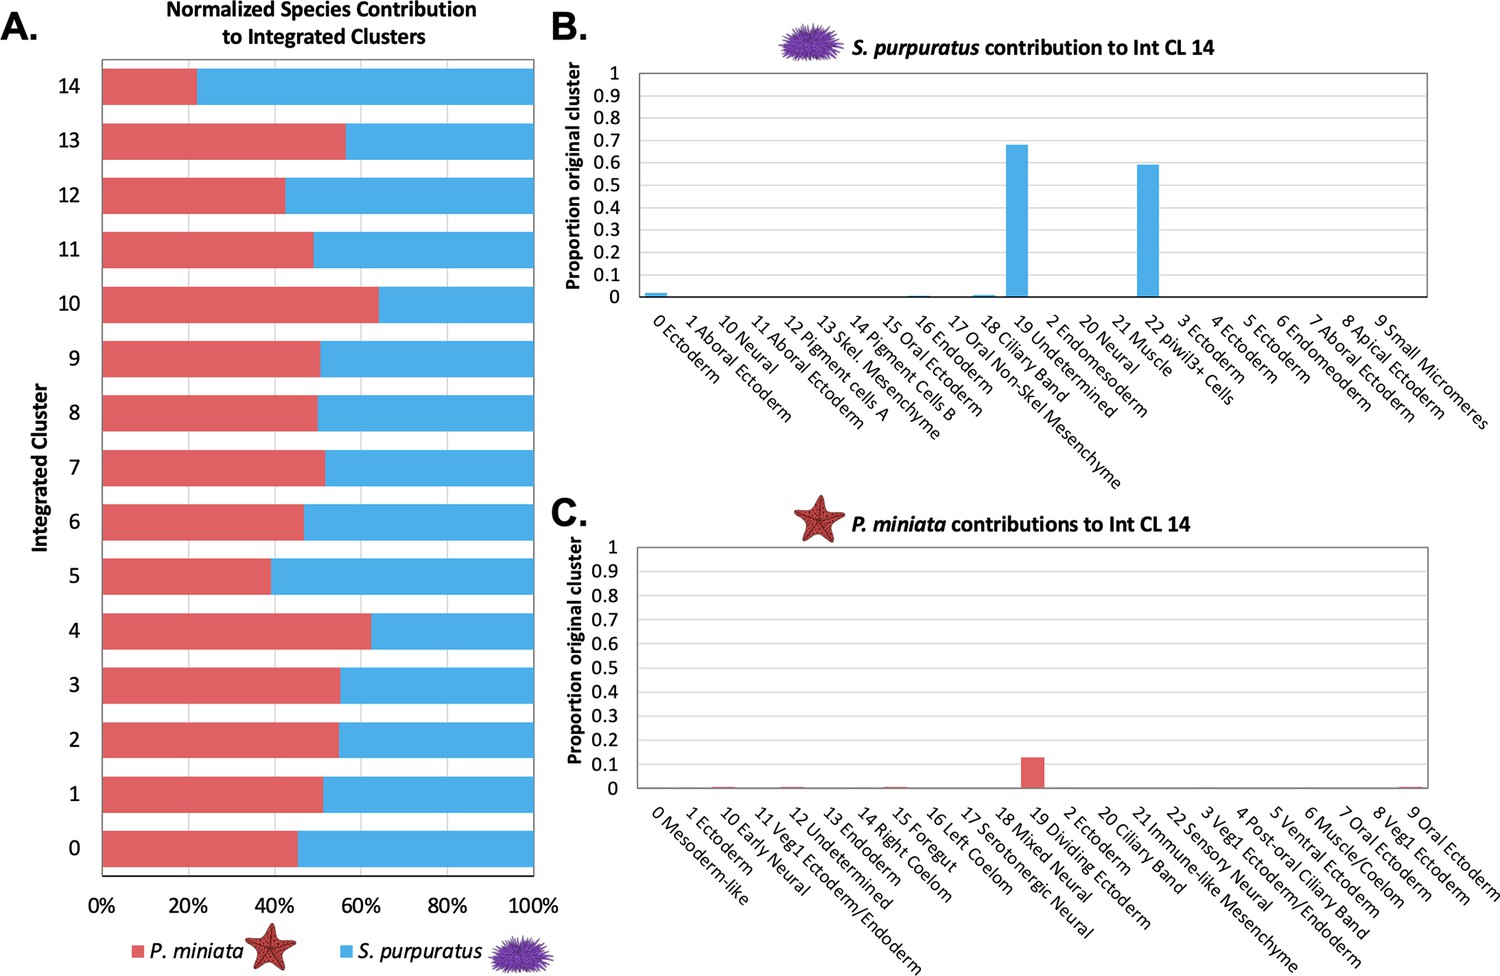
Quantification of species’ contribution to integrated clusters and the identification of a cluster enriched for S. purpuratus cells.
(A) Bar graph shows the percentage of nuclei/cells of each species in each integrated cluster, normalized to account for differences in sample sizes. Species contribution is balanced in all but Int CL 14. (B) A bar graph showing the percentage of each Spur CL # that contribute to Int CL 14. (C) A bar graph showing the percentage of each Pmin CL # that contributes to Int CL 14.
Figure 10
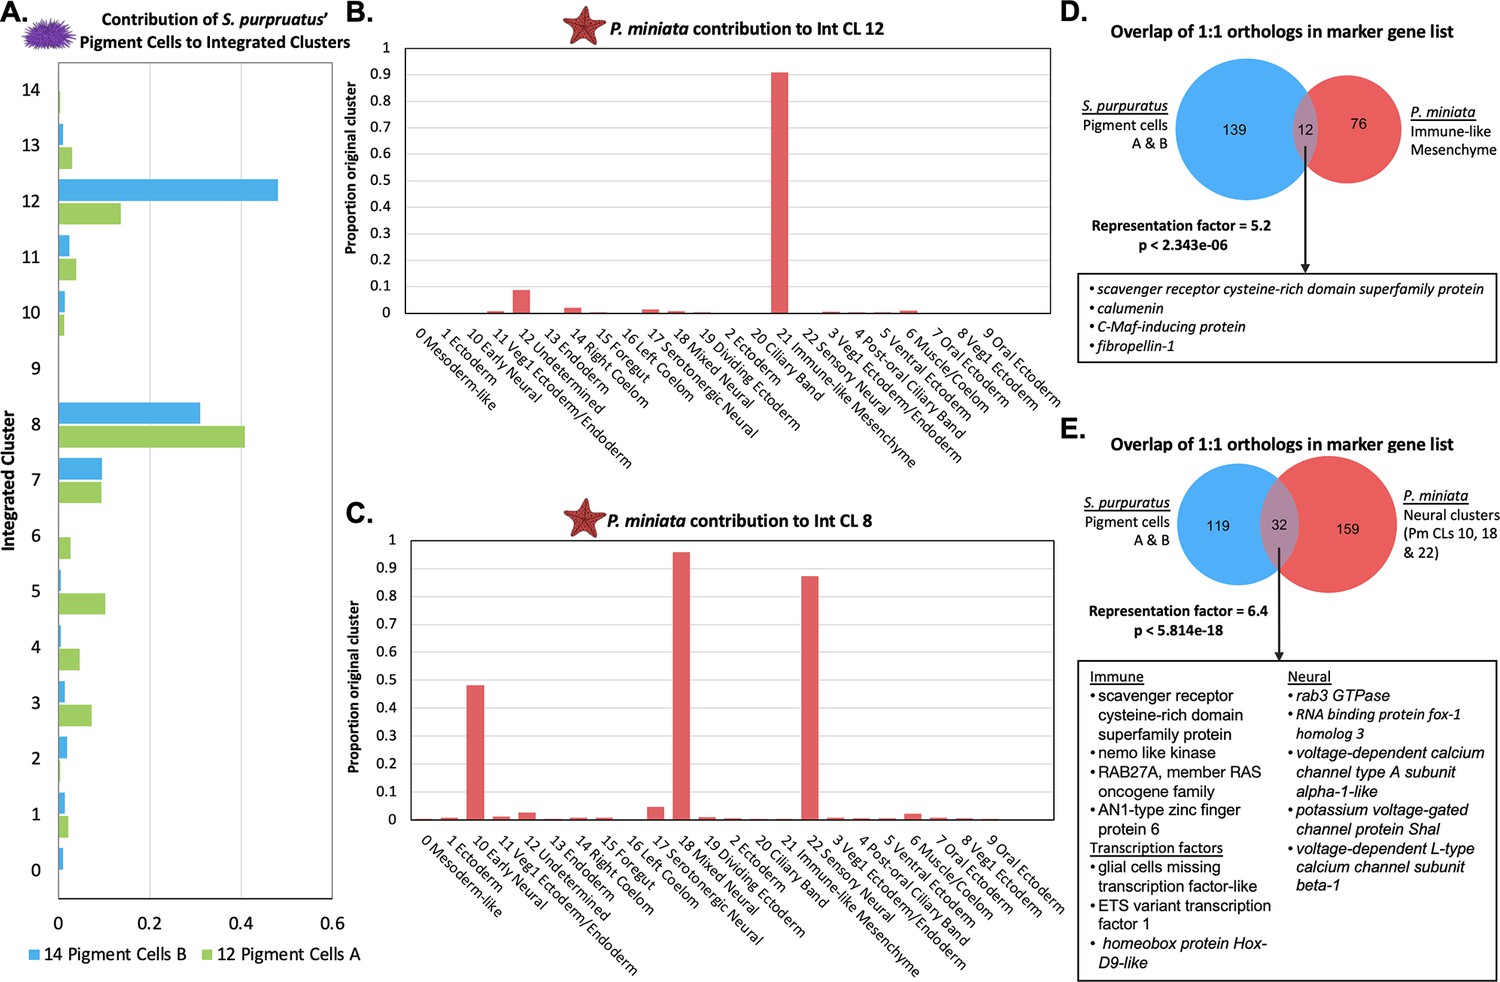
Pigment cells share transcriptomic similarities with P. miniata immune-like cells and neurons.
(A) The proportion of total pigment cells from the S. purpuratus atlas (Spur CL 14 Pigment Cells B and Spur CL 12 Pigment Cells A) that contribute to each Int CL. The pigment cells chiefly contribute to Int CL 8 and Int CL 12. (B) A bar graph showing the percentage of each Pmin CL # that contribute to Int CL 12. P. miniata cells in Int CL 12 primarily originate from Pmin CL 21 Immune-like Mesenchyme. (C) A bar graph showing the percentage of each Pmin CLs that contribute to Int CL 8. The P. miniata cells in Int CL 8 primarily originate from three neural clusters: Pmin CL 10 Early Neural, Pmin CL 18 Mixed Neural, and Pmin CL 22 Sensory Neural. (D) A Venn diagram highlights marker genes that are shared between the Spur CL Pigment Cell clusters and Pmin CL Immune-like Mesenchyme. The overlap is higher than expected by chance, with a representation factor of 5.2 and p-value <2.343e-06. Highlighted in the box are shared genes with known immune function. (E) A Venn diagram shows the overlap of marker genes shared between Spur CL Pigment Cells and the pooled marker genes of Pmin CL 10 Early Neural, Pmin CL 18 Mixed Neural, and Pmin CL 22 Sensory Neural. The representation factor of this overlap is 6.4 and p-value <4.814e-18. Highlighted in the box are shared marker genes, divided into three categories: genes known to be involved in neural function, genes known to be involved in immune function, and transcription factors.
Figure 11
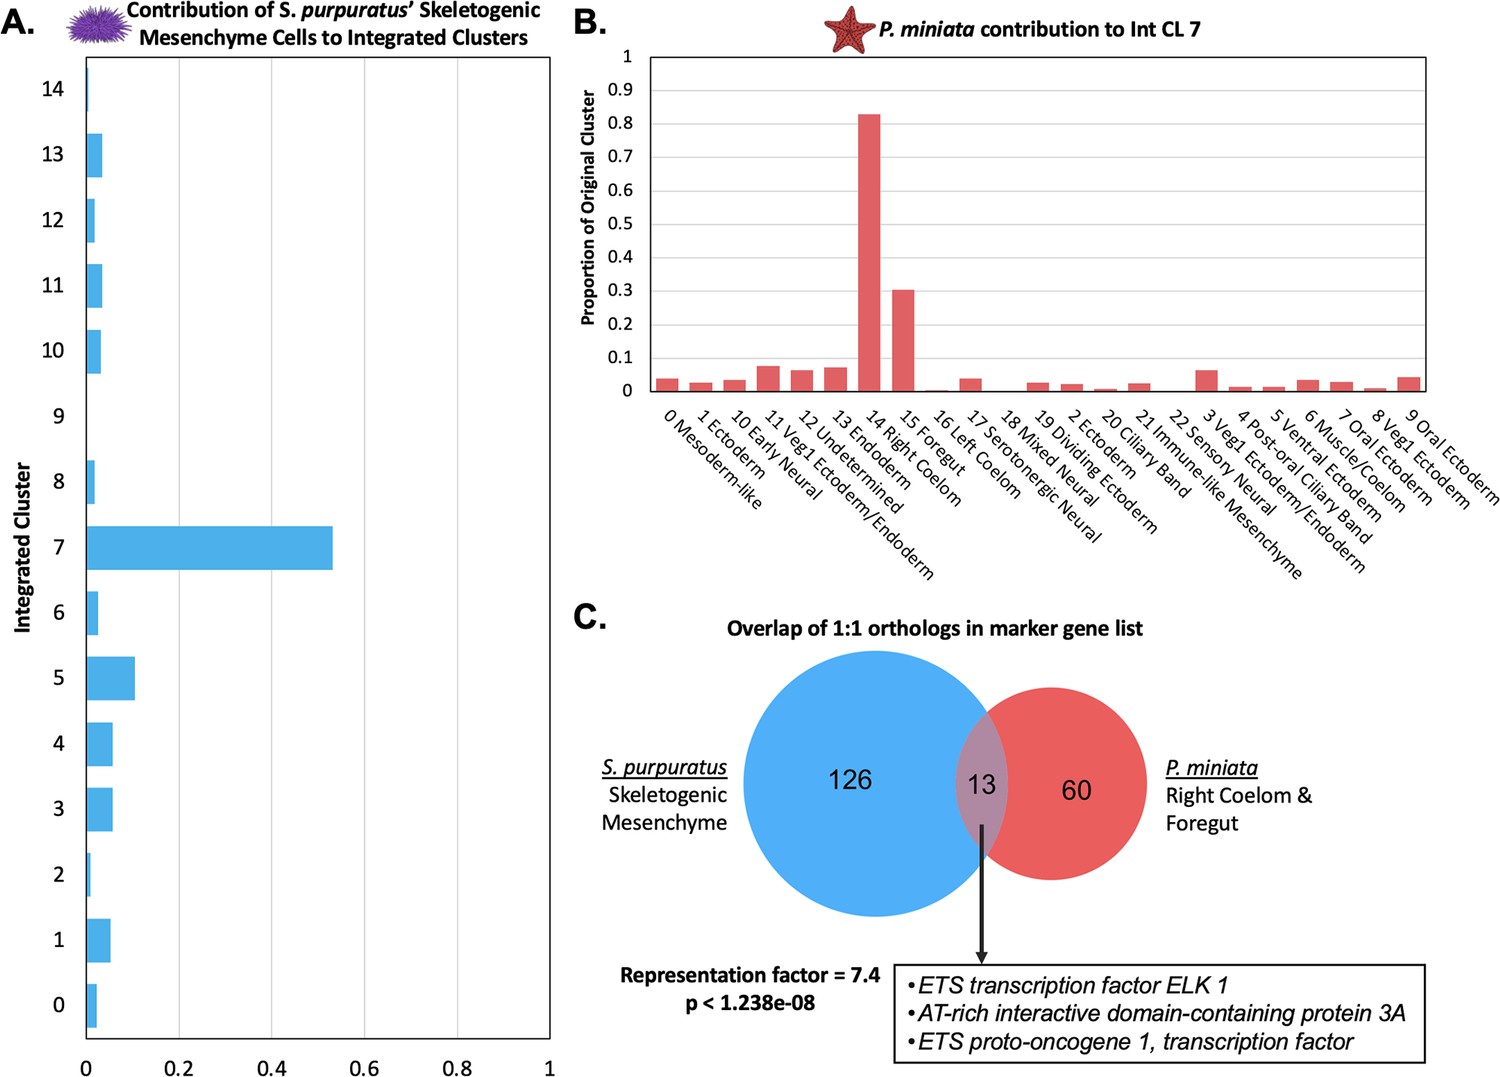
Skeletogenic Mesenchyme share transcriptomic features with P. miniata’s Right Coelom and Foregut.
(A) The proportion of all cells annotated as skeletogenic mesenchyme from the S. purpuratus atlas that contribute to each Int CL. 53.1% of all skeletogenic mesenchyme cells segregate into Int CL 7. (B) A bar graph showing the percentage of each Pmin CL # that contributed to Int CL 7. The top contributors are nuclei from Pmin CL 14 Right Coelom and Pmin CL 15 Foregut. (C) Venn diagram highlights the overlap of marker genes that are 1:1 orthologs that are shared between S. purpuratus’ Skeletogenic Mesenchyme and P. miniata’s Right Coelom and/or Foregut. The representation factor is 7.4 with p-value <1.238e-08. Highlighted in the box are transcription factors shared by both groupings.
Figure 12
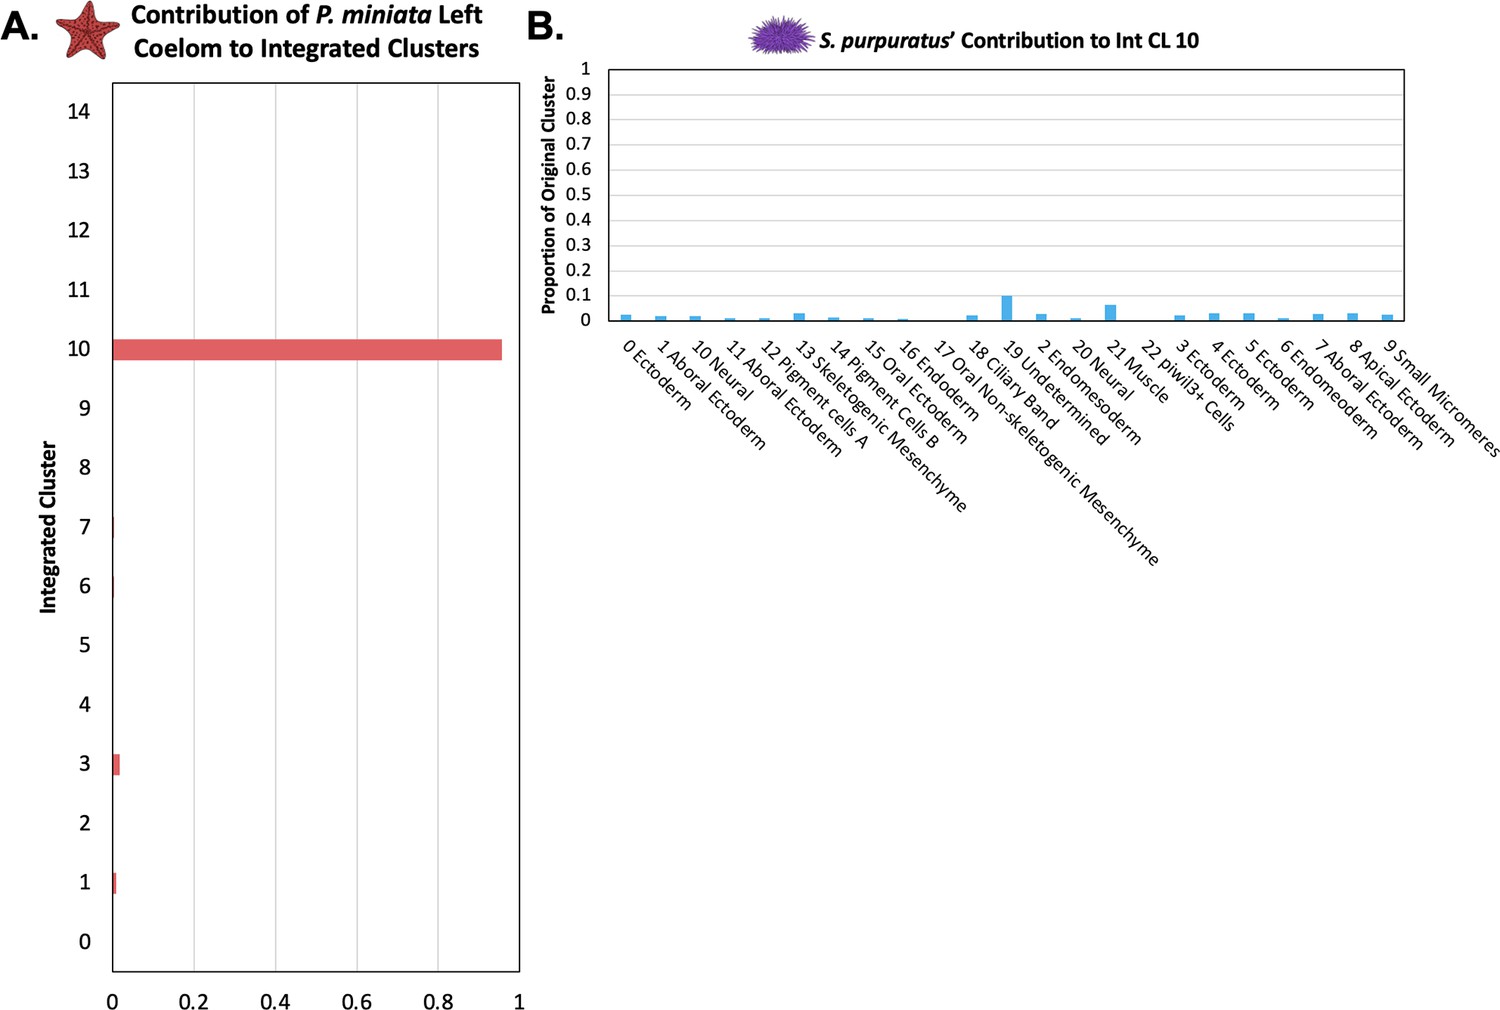
The P. miniata Left Coelom does not have a corresponding population in S. purpuratus.
(A) The proportion of total nuclei originating from Pmin CL 16 Left Coelom across all integrated clusters. Most of the nuclei are located in Int CL 10. (B) A bar graph showing the percentage of each Spur CL # that contributed to Int CL 10. The cells in Int CL 10 originate from many different Spur CL # and no single cluster contributes more than 10.2% of a cluster’s original total cells.
Additional files
-
Supplementary file 1
Table of LOCIDs, gene names, and gene symbols referenced in this article.
- https://cdn.elifesciences.org/articles/80090/elife-80090-supp1-v2.xlsx
-
Supplementary file 2
Table of quality control parameters used to filter the scRNA-seq and snRNA-seq datasets.
- https://cdn.elifesciences.org/articles/80090/elife-80090-supp2-v2.xlsx
-
Supplementary file 3
Table of the membership of integrated clusters.
Contains the breakdown of cluster composition based on the original cell type analysis used in the single species atlases.
- https://cdn.elifesciences.org/articles/80090/elife-80090-supp3-v2.xlsx
-
Supplementary file 4
Primer sequences used to synthesize probes for WMISH.
- https://cdn.elifesciences.org/articles/80090/elife-80090-supp4-v2.xlsx
-
Supplementary file 5
In-depth annotations of cluster identity in the S. purpuatus snRNA-seq analysis.
- https://cdn.elifesciences.org/articles/80090/elife-80090-supp5-v2.pdf
-
Supplementary file 6
In-depth annotations of cluster identity in P. miniata for clusters not discussed in the body of the paper.
- https://cdn.elifesciences.org/articles/80090/elife-80090-supp6-v2.pdf
-
MDAR checklist
- https://cdn.elifesciences.org/articles/80090/elife-80090-mdarchecklist1-v2.pdf
-
Source code 1
An RMarkdown file containing sample code from the pipeline what was used to create the species atlases and the integrated atlases.
- https://cdn.elifesciences.org/articles/80090/elife-80090-code1-v2.zip
Download links
A two-part list of links to download the article, or parts of the article, in various formats.
Downloads (link to download the article as PDF)
Open citations (links to open the citations from this article in various online reference manager services)
Cite this article (links to download the citations from this article in formats compatible with various reference manager tools)
New hypotheses of cell type diversity and novelty from orthology-driven comparative single cell and nuclei transcriptomics in echinoderms
eLife 12:e80090.
https://doi.org/10.7554/eLife.80090


