Distinct regions of H. pylori’s bactofilin CcmA regulate protein–protein interactions to control helical cell shape
- Division of Human Biology, Fred Hutchinson Cancer Center, United States
- Molecular Medicine and Mechanisms of Disease Graduate Program, University of Washington, United States
- Department of Pathology, Microbiology and Immunology, Vanderbilt University Medical Center, United States
- Vanderbilt Institute for Infection, Immunology and Inflammation, United States
Figures
Figure 1
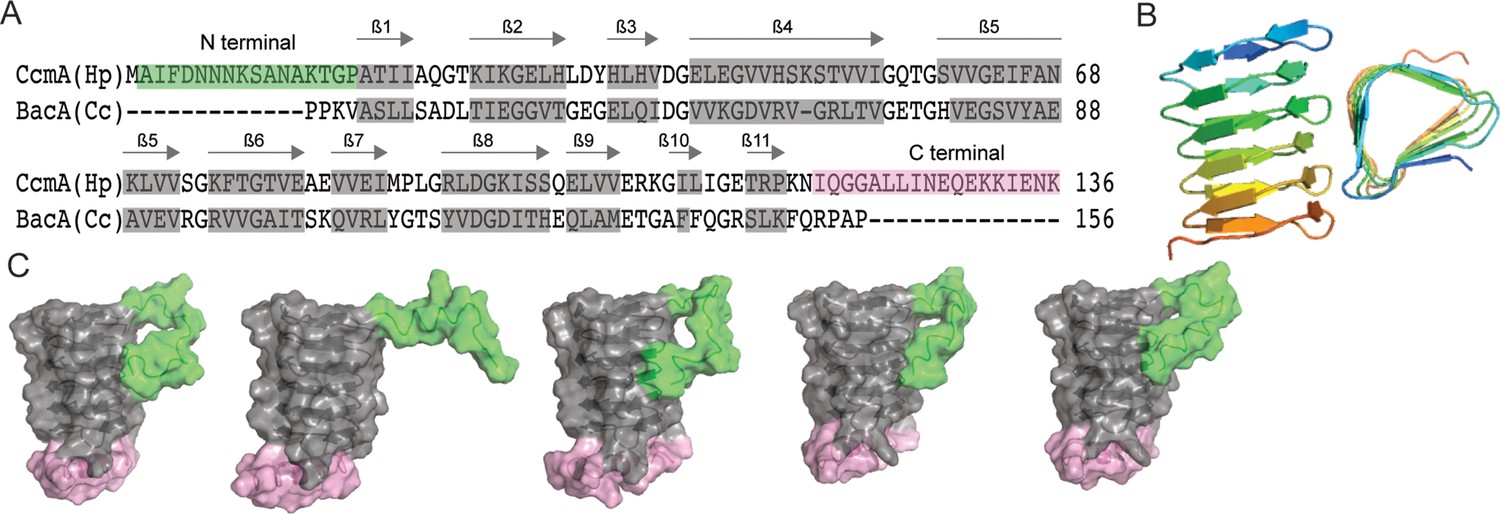
Predicted structure of CcmA.
(A) Sequence alignment between BacA from C. crescentus and CcmA from H. pylori generated with SWISS-MODEL; gray boxes indicate β-strands formed in the bactofilin domain, the green box indicates the N-terminal region of CcmA, and the pink box indicates the C-terminal region of CcmA. (B) Model of the bactofilin domain of CcmA generated by RoseTTAFold, which forms a right-handed, three-sided, triangular β-helix. (C) Five models of CcmA generated in RoseTTAFold displaying the bactofilin domain (gray), N-terminal region (green), and C-terminal region (pink).
Figure 2 with 2 supplements
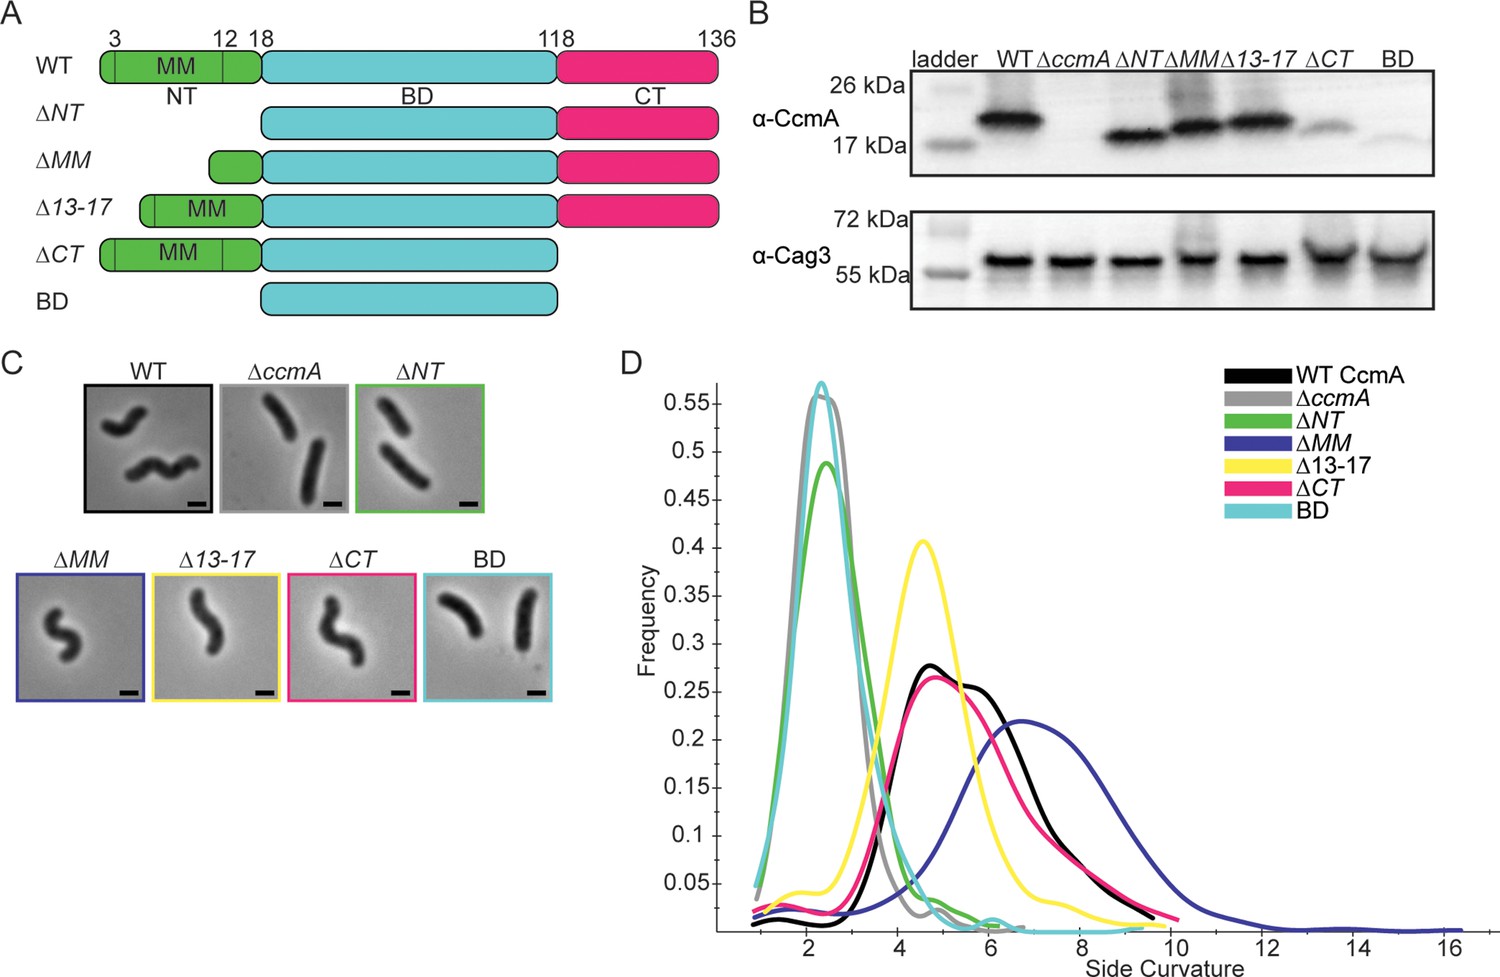
H. pylori cells expressing CcmA truncation mutants have different cell shapes.
(A) Schematic of CcmA and truncation mutants. The N-terminal region (NT, green), bactofilin domain (BD, cyan), and C-terminal region (CT, pink) are indicated, as well as the putative membrane binding motif (MM). (B) Western blot to detect CcmA in whole-cell lysates of H. pylori strains expressing truncated versions of CcmA probed with ɑ-CcmA polyclonal antibody, and ɑ-Cag3 polyclonal antibody as a loading control. (C) Phase-contrast images of H. pylori strains expressing truncated versions of CcmA diagramed in panel (A), scale bars = 1 µm. (D) Histogram displaying the side curvature of H. pylori strains expressing truncated versions of CcmA (WT n = 476 cells, ∆ccmA n = 397 cells, ∆N n = 275 cells, ∆MM n = 391 cells, ∆13–17 n = 361 cells, ∆CT n = 263 cells, BD n = 315 cells). Data are representative of two independent biological replicates. Strains used: SSH51A, SSH53A, SSH55A, SSH54A, SSH67A, SSH56B, and SSH57A.
-
Figure 2—source data 1
Raw, unedited Western blots probed with ɑ-Cag3 and ɑ-CcmA antibodies in whole-cell lysates of H. pylori strains expressing truncated versions of CcmA.
- https://cdn.elifesciences.org/articles/80111/elife-80111-fig2-data1-v2.zip
Figure 2—figure supplement 1
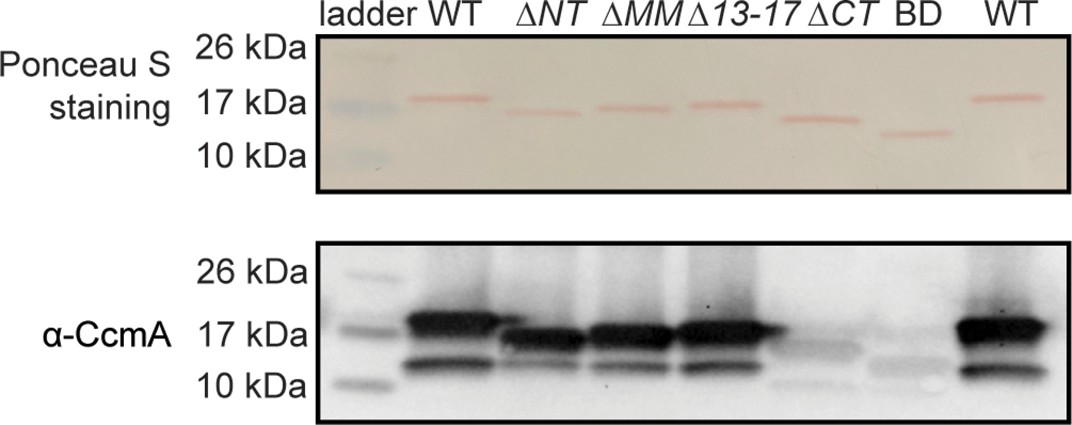
Robust CcmA detection with ɑ-CcmA polyclonal antibody requires the C-terminus.
0.1 µg of purified protein was loaded into each lane. Top row: Ponceau S staining of purified 6-his-CcmA. Bottom row: Western blot probed with polyclonal ɑ-CcmA antibody, both images are of the same membrane.
-
Figure 2—figure supplement 1—source data 1
Raw, unedited Western blots probed with the ɑ-CcmA antibody in purified CcmA.
- https://cdn.elifesciences.org/articles/80111/elife-80111-fig2-figsupp1-data1-v2.zip
Figure 2—figure supplement 2
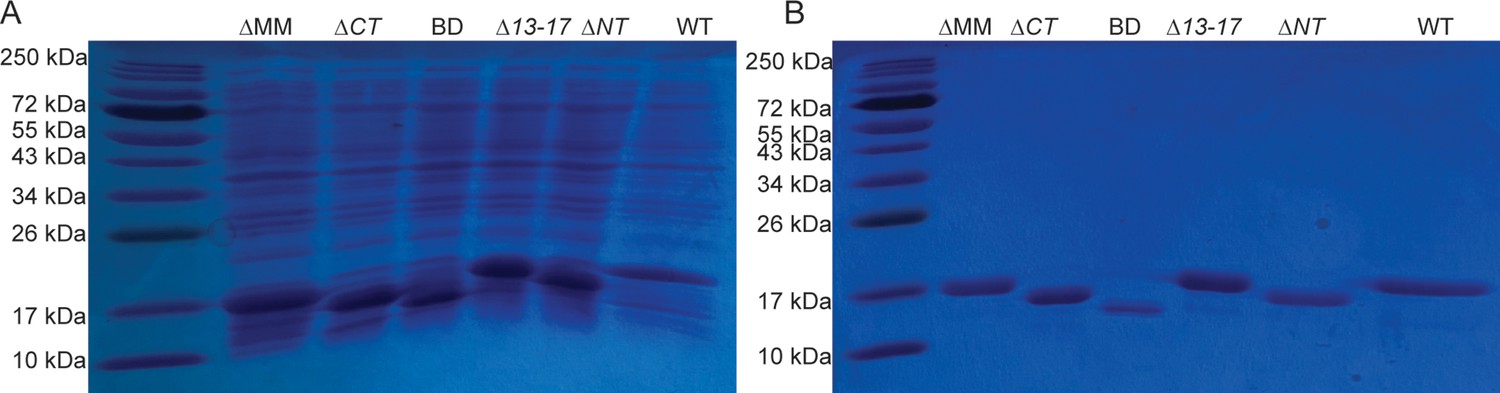
Purification of WT and mutant 6-his CcmA.
(A) Coomassie-stained gel of induced, whole-cell lysates of E. coli. (B) Coomassie-stained gel of the first elution after purification of 6-his CcmA with cobalt affinity resin.
Figure 3
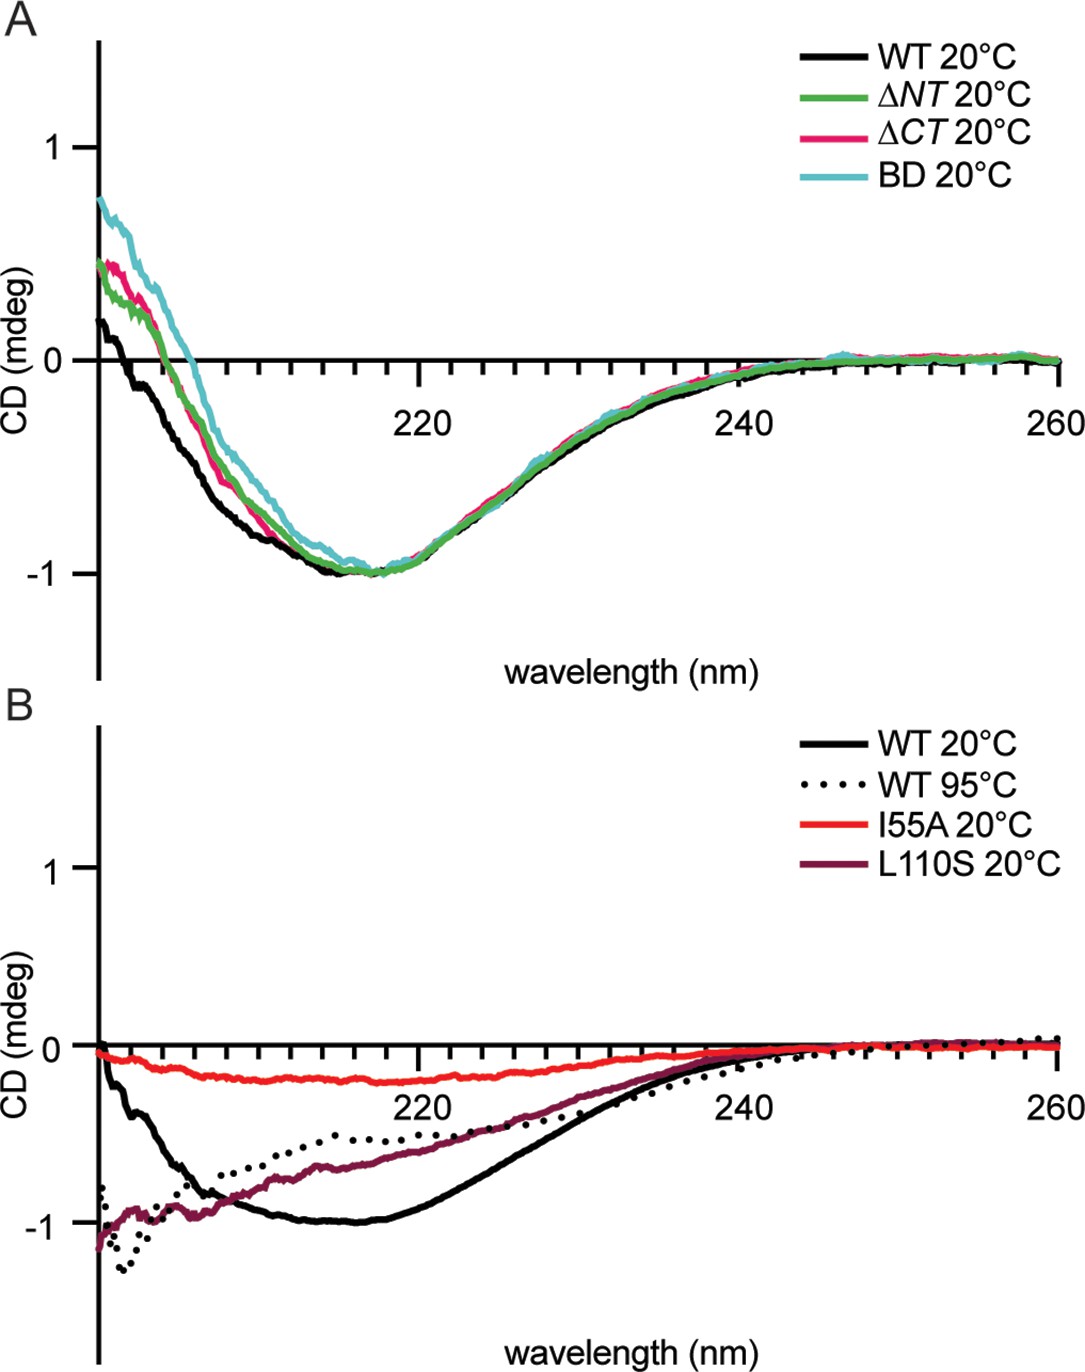
Circular dichroism spectra of purified 6-his CcmA suggests CcmA is composed of predominantly β-sheets.
(A) Circular dichroism spectra of WT and truncated versions of CcmA at room temperature (20°C), WT (black), ∆NT (green), ∆CT (pink), and BD (cyan). (B) Circular dichroism spectra of WT CcmA at room temperature (20°C, black), melted (95°C, dotted line), and two point mutants (I55A, red, and L110S, burgundy).
Figure 4
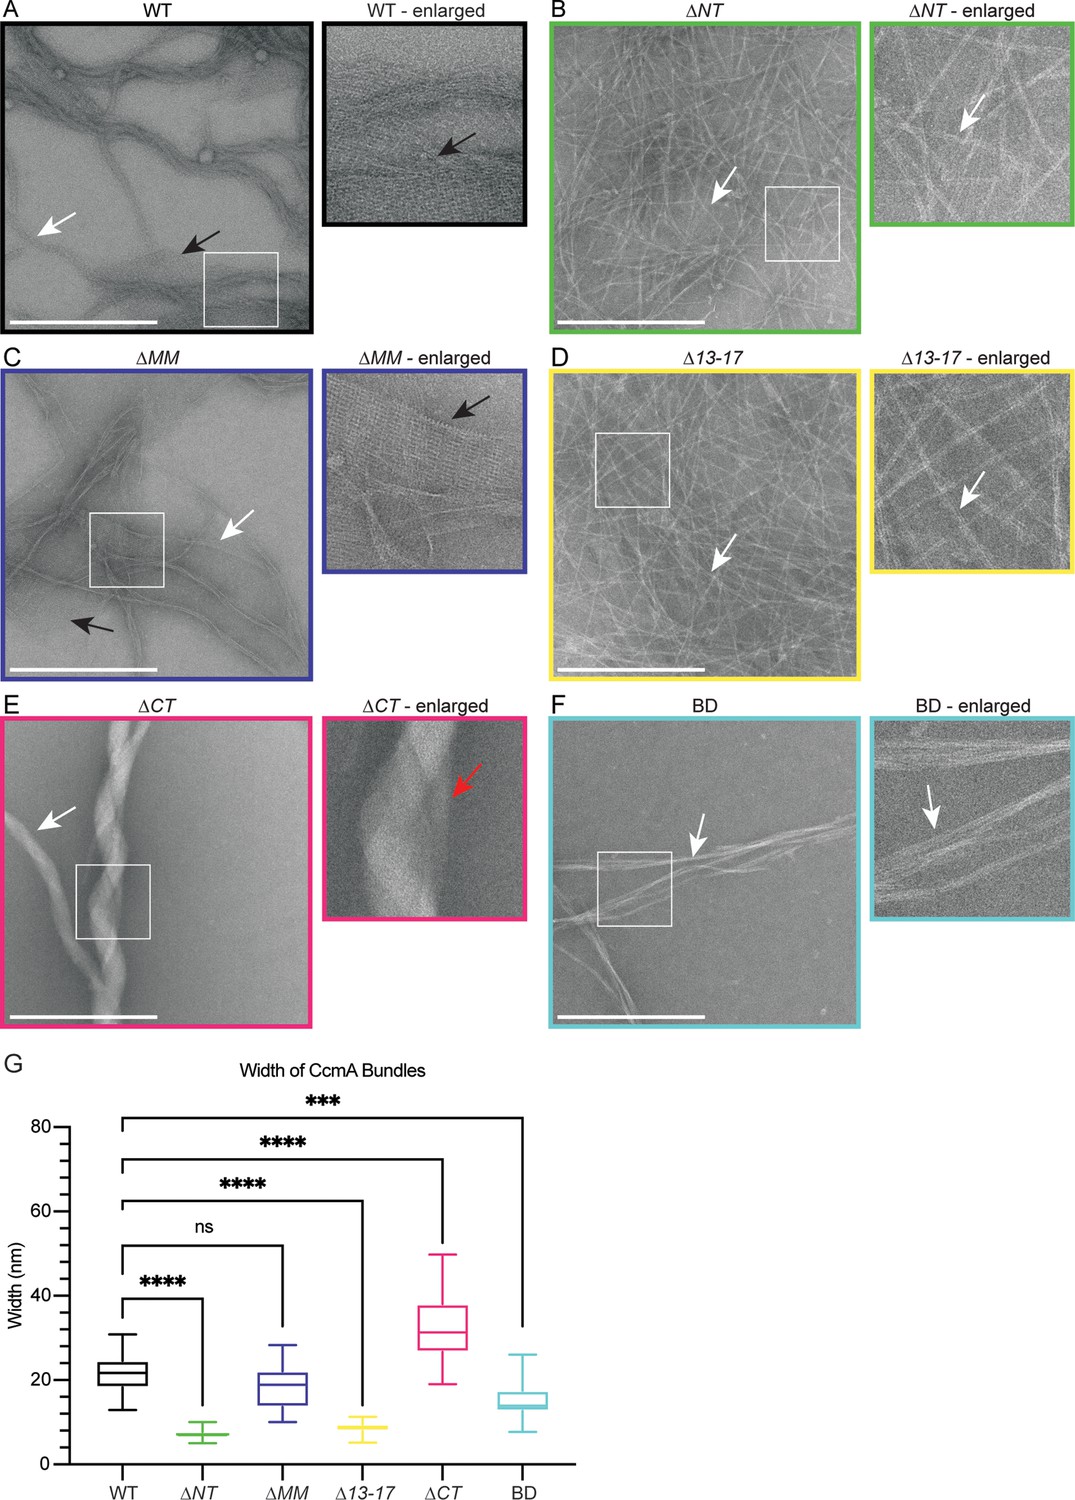
The bactofilin domain of CcmA is sufficient for in vitro polymerization while the terminal regions promote lateral polymer interactions.
(A–F) Transmission electron microscopy (TEM) of negative stained, purified CcmA, scale bars = 500 nm. White boxes indicate region of micrograph that is enlarged in panel to the right of original. White arrows indicate bundles of CcmA, black arrows indicate lattice structures, and red arrow indicates two bundles wrapping around each other. Data are representative of two independent biological replicates. (G) Box and whiskers plot displaying width of purified CcmA bundles and filaments. Median, min, max, 25th percentile, and 75th percentile are displayed. One-way ANOVA, Dunnett’s multiple-comparison test. ns p>0.5, ***p≤0.001, ****p≤0.0001. WT n = 24, ∆NT n = 29, ∆MM n = 25, ∆13–17 n = 31, ∆CT n = 24, BD n = 32.
Figure 5 with 1 supplement
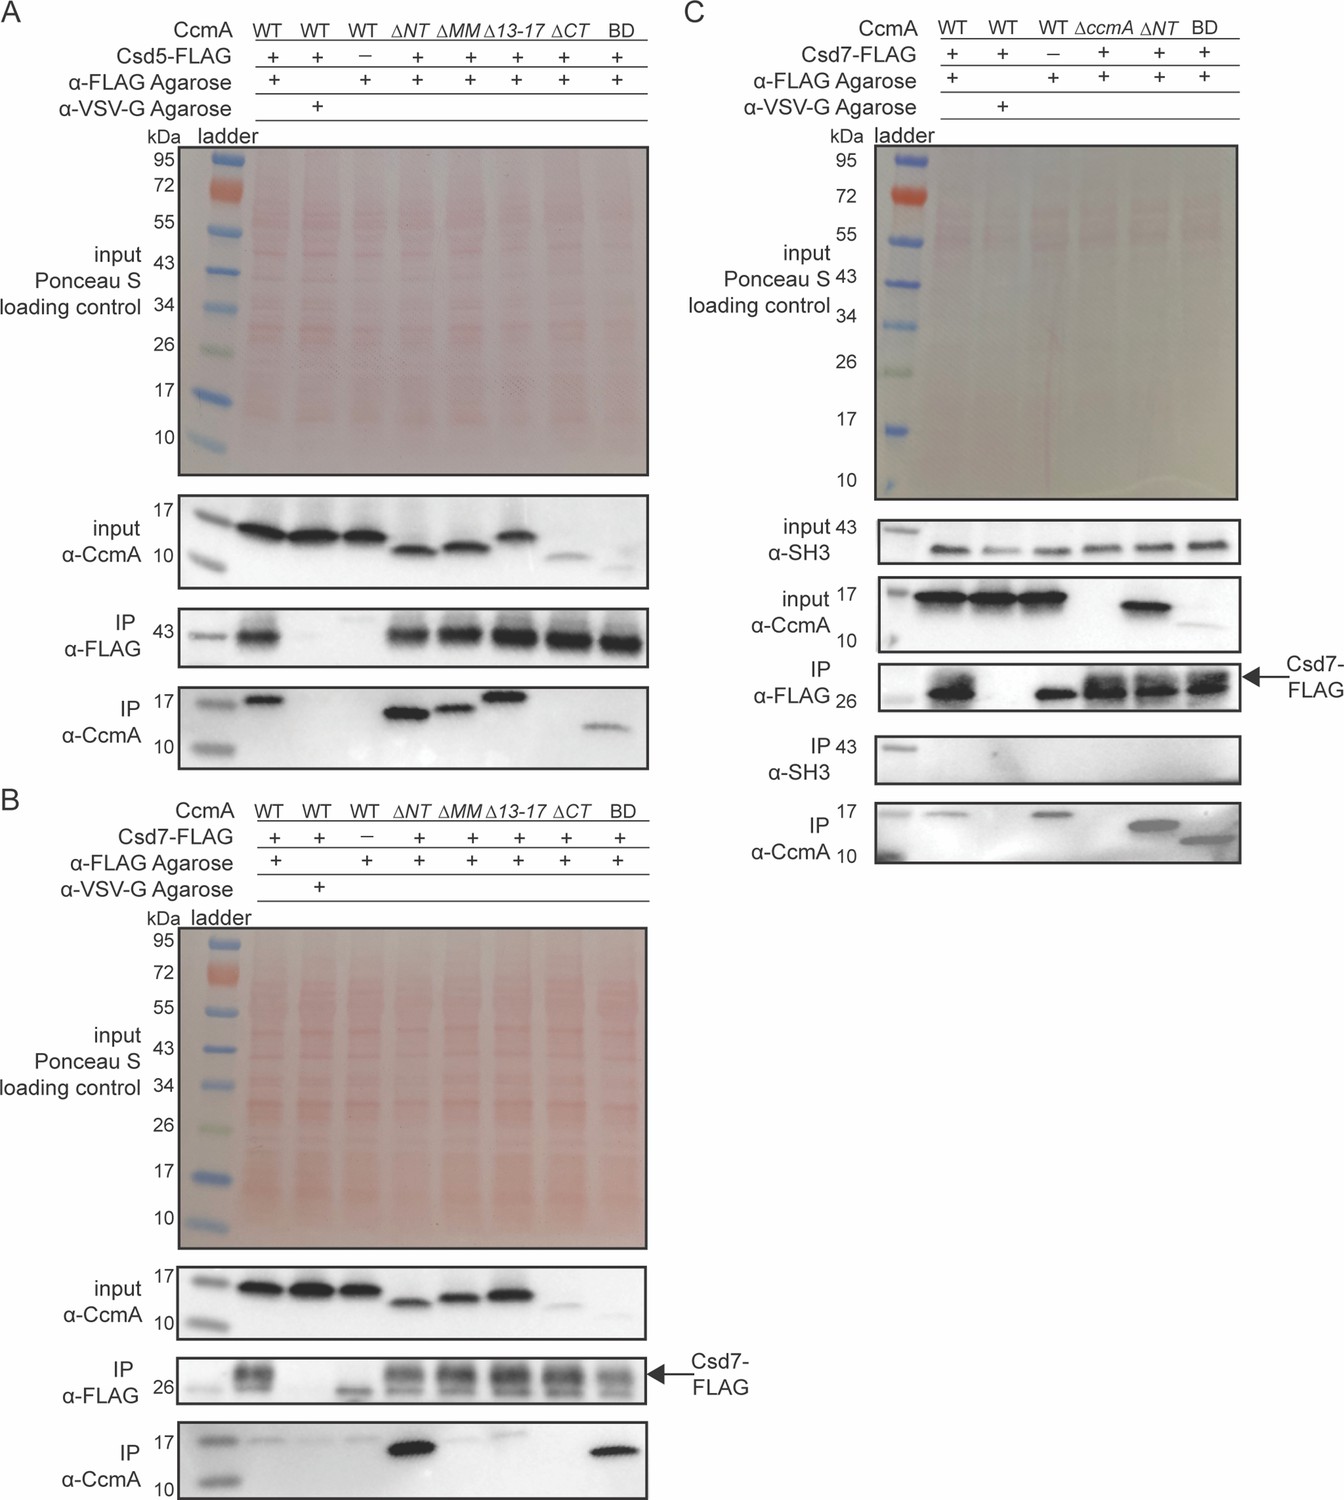
The bactofilin domain interacts with Csd5 and Csd7, and the N-terminal region inhibits Csd7 binding to CcmA.
(A, B) Co-immunoprecipitation (co-IP) experiments to probe Csd5-2x-FLAG-CcmA interactions (A) and Csd7-3x-FLAG-CcmA interactions (B) in H. pylori cells are shown. Top row: Ponceau S staining of input fractions. Second row: Western blot probed with ɑ-CcmA polyclonal antibody of input fractions. Third row: Western blot probed with ɑ-FLAG monoclonal antibody of IP fractions. Bottom row: Western blot probed with ɑ-CcmA polyclonal antibody of IP fractions. (C) Co-IP experiments to probe Csd7-3x-FLAG interactions with CcmA and Csd5 in H. pylori strains with and without CcmA. Top row: Ponceau S staining of input fractions. Second row: Western blot probed with ɑ-SH3 polyclonal antibody of input fractions to detect the SH3 domain of Csd5. Third row: Western blot probed with ɑ-CcmA polyclonal antibody of input fractions. Fourth row: Western blot probed with ɑ-FLAG monoclonal antibody of IP fractions to detect Csd7-3x-FLAG. Fifth row: Western blot probed with ɑ-SH3 polyclonal antibody to detect the SH3 domain of Csd5 in IP fractions. Bottom row: Western blot probed with ɑ-CcmA polyclonal antibody of IP fractions. Data shown are representative of data from three independent biological replicates. Strains used: KHB157, LSH100, SSH59A, SSH58A, SSH68A, SSH60A, SSH65A, DCY71, DCY77, SSH79A, SSH78A, SSH82, SSH80A, and SSH81B.
-
Figure 5—source data 1
Raw, unedited Western blots probed with ɑ-CcmA and ɑ-FLAG antibodies to detect CcmA and Csd5-FLAG or Csd7-FLAG in co-immunoprecipitation experiments.
- https://cdn.elifesciences.org/articles/80111/elife-80111-fig5-data1-v2.zip
Figure 5—figure supplement 1
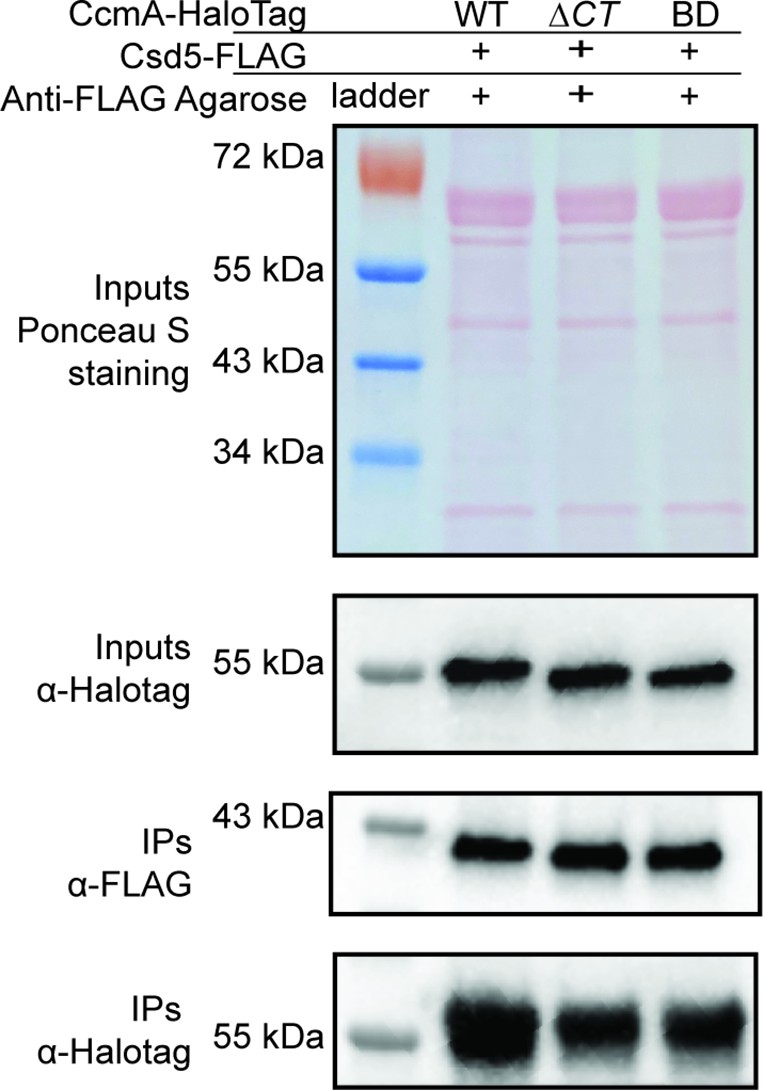
The C-terminus of CcmA-HaloTag is not required for interactions with Csd5.
ɑ-FLAG immunoprecipitation of strains expressing Csd5-FLAG and WT CcmA-HaloTag, CcmA ∆CT-HaloTag, or CcmA BD only –HaloTag. Top row: Ponceau S staining of input fractions. Second row: Western blot of inputs probed with ɑ-HaloTag monoclonal antibody to detect CcmA-HaloTag, both top and second row are images of the same membrane. Third row: Western blot of IP fractions probed with ɑ-FLAG monoclonal antibody to detect Csd5-FLAG. Bottom row: Western blot of IP fractions probed with ɑ-HaloTag monoclonal antibody to detect CcmA-HaloTag. Strains used: SSH87A, SSH89A, and SSH97A.
-
Figure 5—figure supplement 1—source data 1
Raw, unedited Western blots probed with ɑ-HaloTag and ɑ-FLAG antibodies to detect CcmA-HaloTag and Csd5-FLAG in co-immunoprecipitation experiments.
- https://cdn.elifesciences.org/articles/80111/elife-80111-fig5-figsupp1-data1-v2.zip
Figure 6
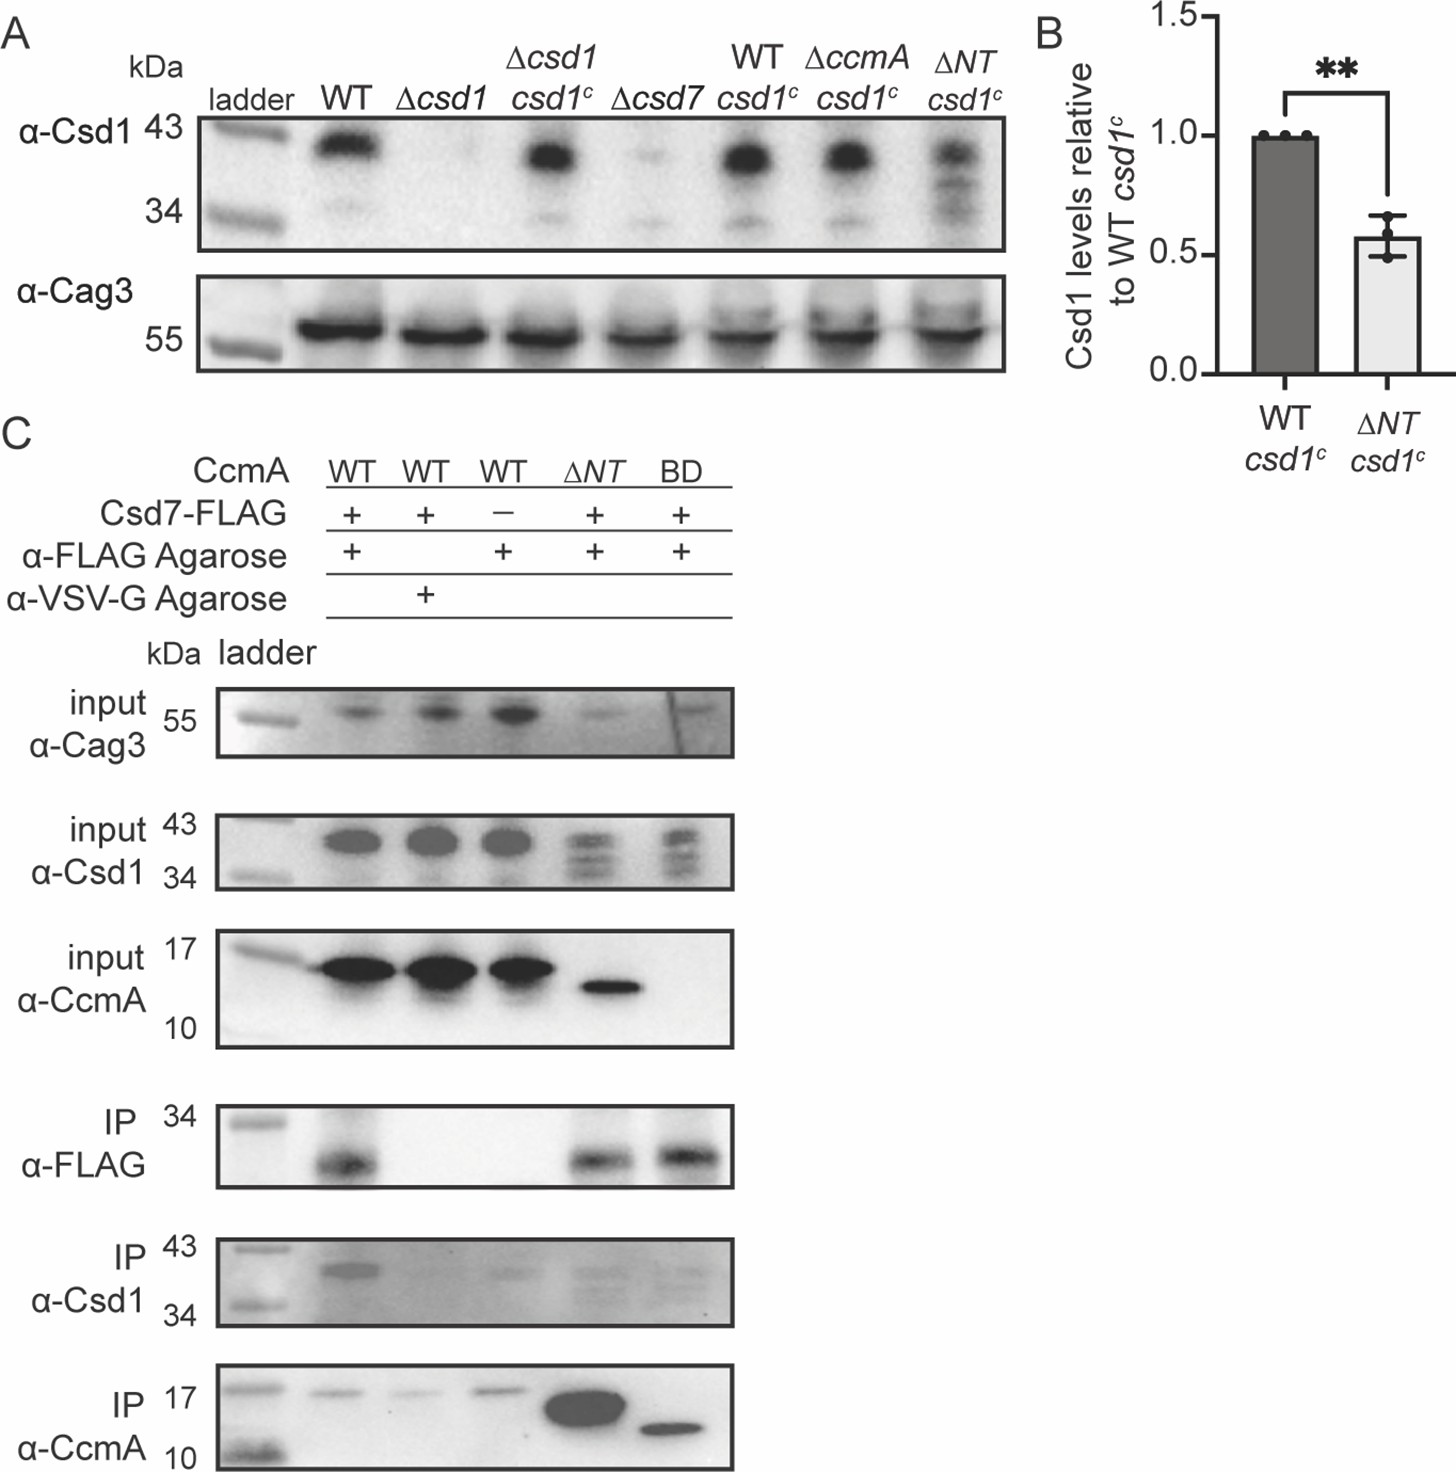
Csd1 expression is diminished when the N-terminal region of CcmA is deleted due to increased Csd7-CcmA interactions that preclude Csd7-Csd1 interactions.
(A) Western blot of whole-cell extracts probed with ɑ-Csd1 polyclonal antibody showing levels of Csd1; ɑ-Cag3 polyclonal antibody was used as a loading control. Strains with ‘csd1c’ indicate an extra copy of csd1 was added at the rdxA locus. Data shown are representative of data from three independent biological replicates. (B) Quantification of Csd1 levels in the ccmA ∆NT csd1c strain relative to the WT csd1c. Relative signal was calculated by dividing Csd1 signal by Cag3 signal for each replicate, then the data was normalized by dividing it by the value from the WT csd1c strain from the same experiment. Data are pooled from three independent biological replicates. Unpaired t-test, **p≤0.001. (C) Co-immunoprecipitation (co-IP) experiments to probe Csd1 levels in relation to Csd7-3x-FLAG-CcmA interactions in H. pylori cells are shown. Top row: Western blot of input fractions probed with ɑ-Cag3 polyclonal antibody as loading control. Second row: Western blot of input fractions probed with ɑ-Csd1 polyclonal antibody. Third row: Western blot of input fractions probed with ɑ-CcmA polyclonal antibody. Fourth row: Western blot probed with ɑ-FLAG monoclonal antibody of IP fractions to detect Csd7-FLAG. Fifth row: Western blot probed with ɑ-Csd1 polyclonal antibody of IP fractions. Bottom row: Western blot probed with ɑ-CcmA polyclonal antibody of IP fractions. Data shown are representative of data from two independent biological replicates. Strains used: LSH100, LSH113, LSH121, DCY26, SSH51A, SSH53A, SSH55A, DCY71, SSH79A, and SSH81B.
-
Figure 6—source data 1
Raw, unedited Western blots probed with ɑ-Cag3 and ɑ-Csd1 antibodies in whole-cell lysates of H. pylori strains expressing truncated versions of CcmA.
In addition, raw, unedited Western blots probed with ɑ-CcmA and ɑ-FLAG, ɑ-Cag3 and ɑ-Csd1 antibodies to detect CcmA, Csd1, and Csd7-FLAG in co-immunoprecipitation experiments.
- https://cdn.elifesciences.org/articles/80111/elife-80111-fig6-data1-v2.zip
Figure 7 with 2 supplements

Csd5 is required for CcmA-HaloTag to localize to the cell envelope at the major helical axis.
(A) Maximum intensity projections (MIPs) and frames from Z-stacks of H. pylori cells labeled with wheat germ agglutinin (WGA) to label the cell wall (magenta) and JF549 ligand to label CcmA-HaloTag (green), pixels are white where the two signals colocalize. Green arrows indicate cytoplasmic CcmA-HaloTag. White arrows indicate CcmA-HaloTag signal that colocalizes with the cell envelope. Scale bars = 1 µm. (B) Representative plots displaying the relative concentration of CcmA-HaloTag and WGA signal from one WT and one ∆csd5 cell at the cell surface (offset from surface = 0) and at computationally generated cell surfaces that are inside (offset from surface < 0) and outside (offset from surface > 0) of the cell surface. (C) Representative H. pylori cells from each population with Gaussian curvature values mapped on the cell surface. (D, E) Top: histogram of Gaussian curvature of cell surfaces of each population. Bottom: surface Gaussian curvature enrichment of relative concentration of CcmA signal in each population where 1 = uniform concentration of CcmA, shaded regions indicate SEM. In panels (C–F), WT n = 292, ∆csd6 n = 264 cells, ∆csd7 n = 355, ∆csd5 n = 326, ∆csd5/7 n = 523. Strains used: SSH39B, SSH49A, SSH50A, JS09, SSH70A, and LSH117.
Figure 7—figure supplement 1
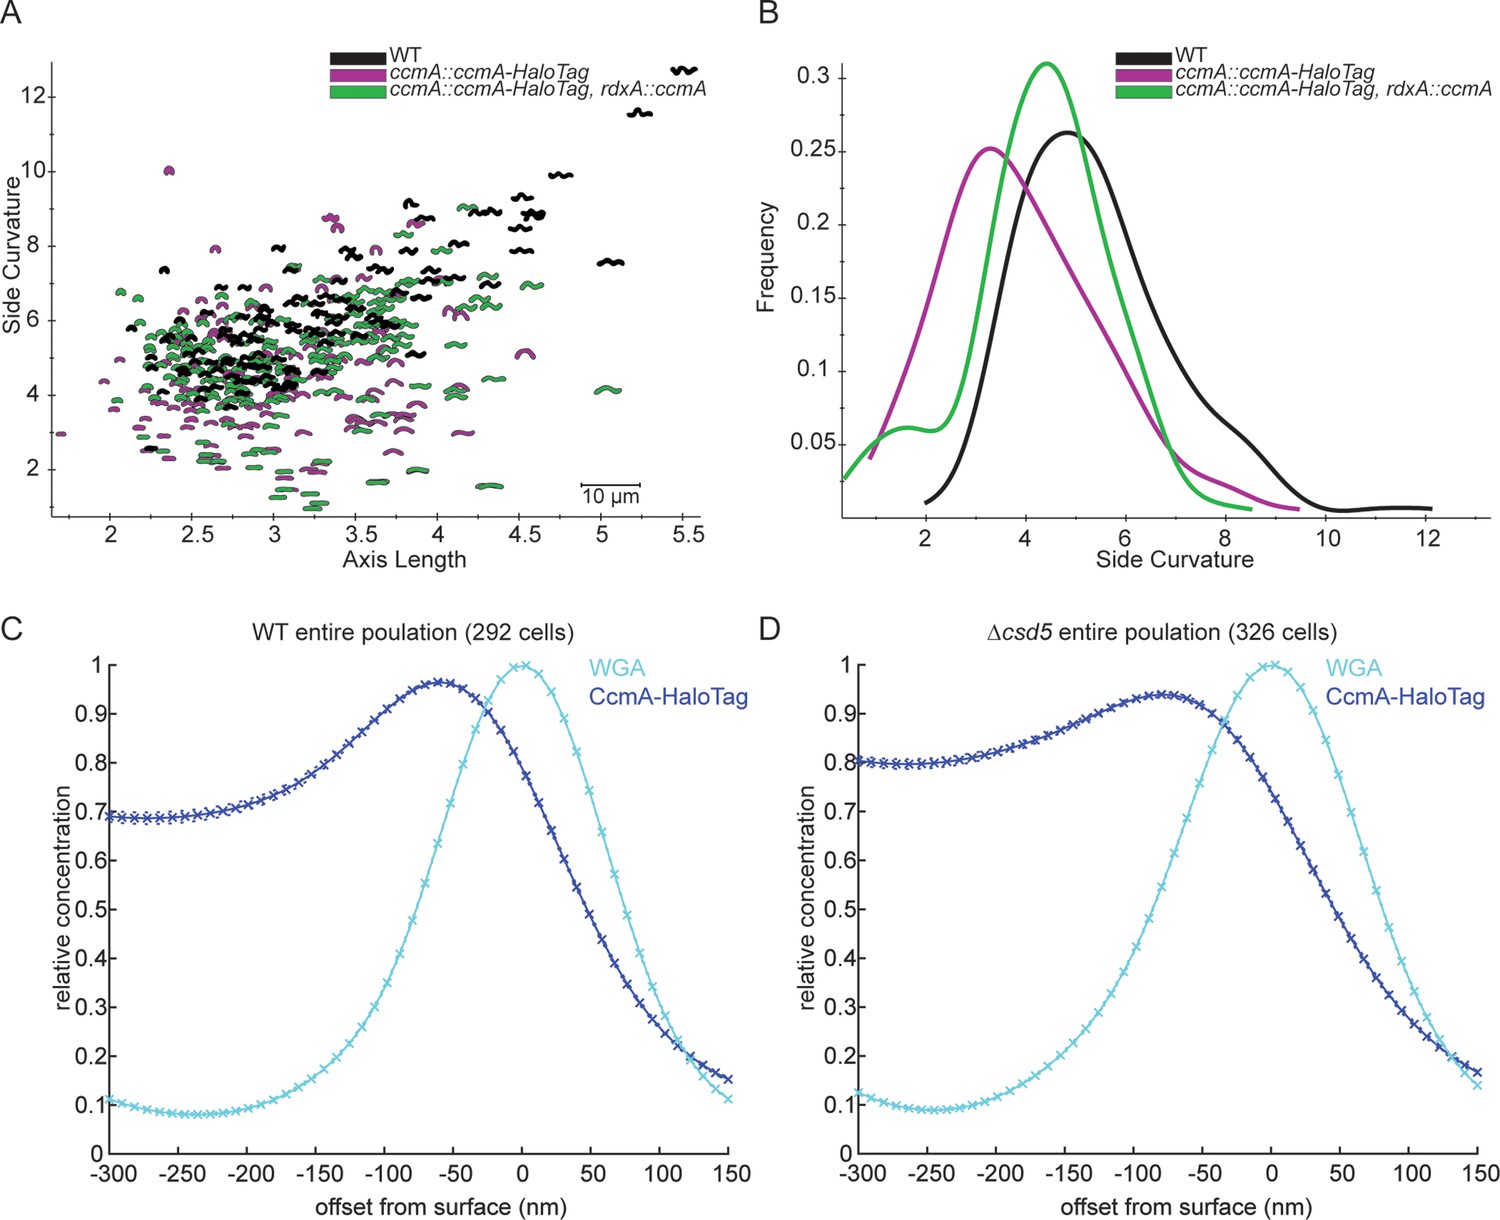
Cell shape of CcmA-HaloTag strains and analysis of CcmA-HaloTag surface signal in populations.
(A) Scatterplot of outlines of H. pylori cells derived from phase-contrast images. (B) Histogram displaying side curvature of each population. WT (LSH100) n = 116 cells, ccmA::ccmA-Halotag (SSH38A) n = 133 cells, ccmA::ccmA-HaloTag, rdxA::ccmA (SSH39B) n = 190 cells. (C, D) Plots displaying the relative concentration of CcmA-HaloTag and WGA signal at the cell surface (offset from surface = 0 nm) and at computationally generated cell surfaces that are inside (offset from surface < 0 nm) and outside (offset from surface > 0 nm) of the cell surface. Crosses indicate SEM. Populations of WT (C) and ∆csd5 (D) cells from three independent experiments were pooled.
Figure 7—figure supplement 2
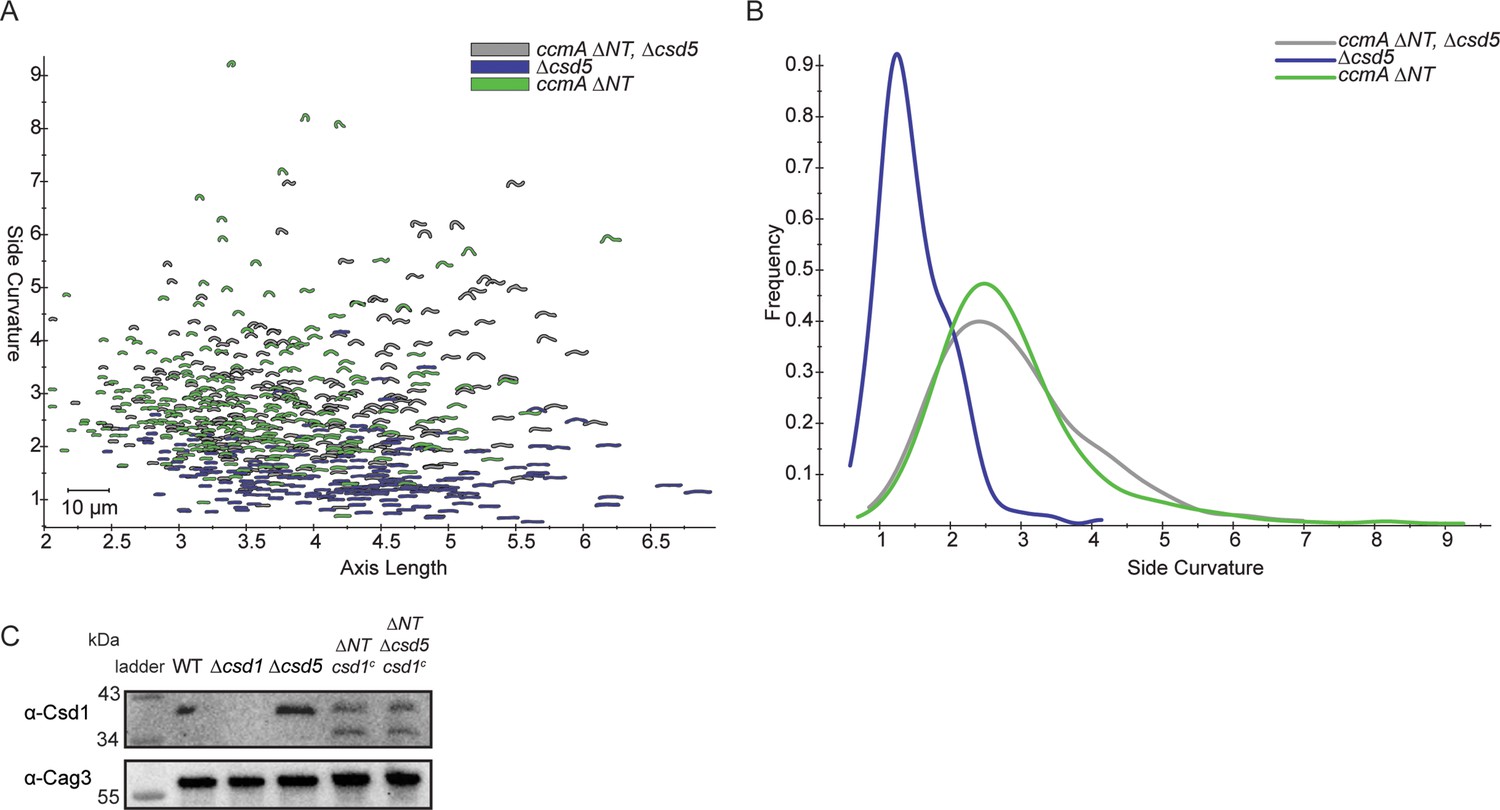
Cell shape and Csd1 levels of ccmA ∆NT ∆csd5 mutants.
(A) Scatterplot of outlines of H. pylori cells derived from phase-contrast images. (B) Histogram displaying side curvature of each population. ccmA ∆NT ∆csd5 (SSH109A) n = 246 cells, ccmA ∆NT (SSH55A) n = 250 cells, ∆csd5 (LSH123) n = 215 cells. (C) Western blot of whole-cell extracts probed with ɑ-Csd1 polyclonal antibody showing levels of Csd1; ɑ-Cag3 polyclonal antibody was used as a loading control. Strains used: LSH100, LSH113, LSH123, SSH55A, and SSH109A.
-
Figure 7—figure supplement 2—source data 1
Raw, unedited Western blots probed with ɑ-Cag3 and ɑ-Csd1 antibodies in whole-cell lysates of H. pylori strains.
- https://cdn.elifesciences.org/articles/80111/elife-80111-fig7-figsupp2-data1-v2.zip
Figure 8
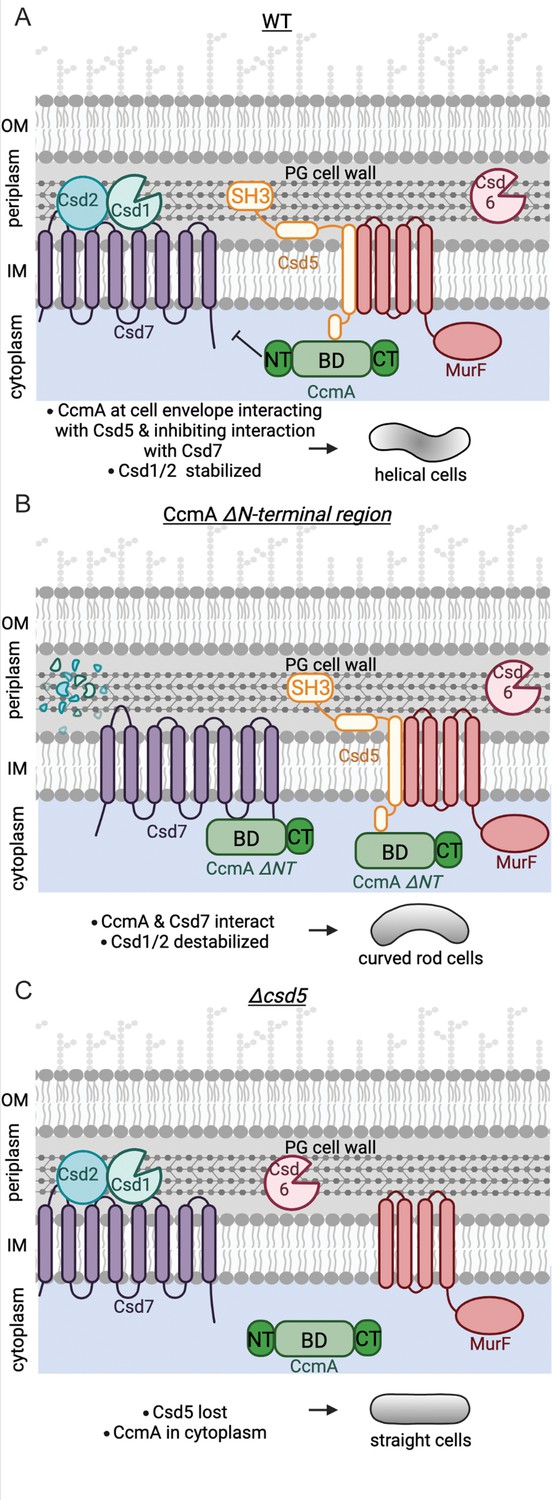
Schematic depicting CcmA’s role in the helical cell shape complexes.
There are two protein complexes, one containing Csd5, MurF, and CcmA, and another containing Csd7, Csd1, and Csd2. (A) In WT cells, Csd5 recruits WT CcmA to the cell envelope via CcmA’s bactofilin domain. The N-terminal region of CcmA inhibits interaction with Csd7, allowing Csd1 to function and excluding Csd1 from the CcmA-Csd5-MurF complex. (B) In cells expressing CcmA ∆NT, Csd5 recruits ∆NT CcmA to the cell envelope via CcmA’s bactofilin domain. The bactofilin domain of CcmA now also binds to Csd7 in a separate complex, inhibiting Csd7 from stabilizing Csd1. (C) When Csd5 is absent, CcmA cannot localize to the cell envelope, MurF is not directed to a particular location. OM, outer membrane; IM, inner membrane. This figure was created using Biorender.com.
Tables
Key resources table
| Reagent type (species) or resource | Designation | Source or reference | Identifiers | Additional information |
|---|---|---|---|---|
| Antibody | Monoclonal ɑ-FLAG M2 antibody produced in mouse | Sigma | Cat# F1804; RRID:AB_262044 | Used at 1:5000 for Western blot |
| Antibody | Polyclonal rabbit ɑ-CcmA | Blair et al., 2018 | Used at 1:10,000 for Western blot | |
| Antibody | Polyclonal rabbit ɑ-SH3 | Blair et al., 2018 | Used at 1:5000 for Western blot | |
| Antibody | Monoclonal mouse ɑ-HaloTag | Promega | Cat# G9211; RRID:AB_2688011 | Used at 1:10,000 for Western blot |
| Antibody | Polyclonal rabbit ɑ-Csd1 | Yang et al., 2019 | Used at 1:10,000 for Western blot | |
| Antibody | Polyclonal rabbit ɑ-Cag3 | Pinto-Santini and Salama, 2009 | Used at 1:20,000 for Western blot | |
| Chemical compound, drug | ɑ-FLAG M2 Affinity Gel | MilliporeSigma | Cat# A2220 | |
| Chemical compound, drug | Janelia Fluor HaloTag ligand 549 (JF-549) | Promega | Cat# GA1110 | |
| Chemical compound, drug | Wheat germ agglutinin, Alexa Fluor 488 Conjugate | Invitrogen | Cat# W11261 | |
| Other | ProLong Diamond Antifade Mountant | Invitrogen | Cat# P36961 | Mountant used for fluorescent microscopy |
| Commercial assay or kit | In-Fusion HD cloning kit | Takara | Cat# 638920 | |
| Commercial assay or kit | Zero Blunt TOPO PCR Cloning Kit, with One Shot Top10 Chemically Competent E. coli cells | Thermo Fisher Scientific | Cat# K280020 |
Table 1
H. pylori strains used in this work.
| Strain | Relevant genotype or description | Reference or source |
|---|---|---|
| DCY26 | csd7::catsacB | Yang et al., 2019 |
| DCY28 | csd7::cat | Yang et al., 2019 |
| DCY71 | csd7-3X-FLAG | Yang et al., 2019 |
| DCY77 | csd7-3x-FLAG, ccmA::cat | Yang et al., 2019 |
| JS02 | ccmA::ccmA-40 aa linker-HaloTag, rdxA::ccmA, csd5::cat2kan | This work |
| JS09 | ccmA::ccmA-40 aa linker-HaloTag, rdxA::ccmA, csd5::cat2kan, csd7::cat | This work |
| JTH1 | csd5-2X-FLAG cat | Blair et al., 2018 |
| JTH3 | ccmA-2X-FLAG cat2kan | Blair et al., 2018 |
| KBH157 | csd5-2X-FLAG, murF-3X-VSV-G::cat | Blair et al., 2018 |
| LSH100 | Wild-type H. pylori, NSH57 with fliM repaired | Sycuro et al., 2010 |
| LSH108 | rdxA::kansacB | Sycuro et al., 2010 |
| LSH113 | csd1::cat | Sycuro et al., 2010 |
| LSH117 | ccmA::catsacB | Sycuro et al., 2010 |
| LSH121 | csd1::cat, rdxA::csd1 | Sycuro et al., 2010 |
| LSH123 | csd5::cat | Sycuro et al., 2012 |
| LSH148 | ccmA::catsacB, rdxA::ccmA | Sycuro et al., 2010 |
| SSH31C | ccmA::ccmA-12 aa linker-HaloTag | This work |
| SSH33 | ccmA::ccmA-40 aa linker-mNeonGreen | This work |
| SSH38A | ccmA::ccmA-40 aa linker-HaloTag | This work |
| SSH39B | ccmA::ccmA-40 aa linker-HaloTag, rdxA::ccmA | This work |
| SSH41A | ccmA::catsacB, csd7::csd7-3X-FLAG | This work |
| SSH49A | ccmA::ccmA-40 aa linker-HaloTag, rdxA::ccmA, csd5::cat | This work |
| SSH50A | ccmA::ccmA-40 aa linker-HaloTag, rdxA::ccmA, csd7::catsacB | This work |
| SSH51A | rdxA::csd1 | This work |
| SSH53A | ccmA::catsacB, rdxA::csd1 | This work |
| SSH54A | ccmA::ccmA ∆MM, rdxA::csd1 | This work |
| SSH55A | ccmA::ccmA ∆NT, rdxA::csd1 | This work |
| SSH56B | ccmA::ccmA ∆CT, rdxA::csd1 | This work |
| SSH57A | ccmA::ccmA BD, rdxA::csd1 | This work |
| SSH58A | ccmA::ccmA ∆MM, rdxA::csd1, csd5::csd5-2X-FLAG-cat | This work |
| SSH59A | ccmA::ccmA ∆NT, rdxA::csd1, csd5::csd5-2X-FLAG-cat | This work |
| SSH60A | ccmA::ccmA ∆CT, rdxA::csd1, csd5::csd5-2X-FLAG-cat | This work |
| SSH65A | ccmA::ccmA BD, rdxA::csd1, csd5::csd5-2X-FLAG-cat | This work |
| SSH67A | ccmA::ccmA ∆13–17, rdxA::csd1 | This work |
| SSH68A | ccmA::ccmA ∆13–17, rdxA::csd1, csd5::csd5-2X-FLAG-cat | This work |
| SSH70A | ccmA::ccmA-40 aa linker-HaloTag, rdxA::ccmA, csd6::cat | This work |
| SSH78B | ccmA::ccmA ∆MM, rdxA::csd1, csd7::csd7-3X-FLAG | This work |
| SSH79A | ccmA::ccmA ∆NT, rdxA::csd1, csd7::csd7-3X-FLAG | This work |
| SSH80A | ccmA::ccmA ∆CT, rdxA::csd1, csd7::csd7-3X-FLAG | This work |
| SSH81B | ccmA::ccmA BD, rdxA::csd1, csd7::csd7-3X-FLAG | This work |
| SSH82 | ccmA::ccmA ∆13–17, rdxA::csd1, csd7::csd7-3X-FLAG | This work |
| SSH87A | ccmA::ccmA-40 aa linker-HaloTag, csd5::csd5-2X-FLAG-cat | This work |
| SSH89A | ccmA::ccmA ∆CT-40 aa linker-HaloTag, rdxA::csd1,csd5::csd5-2X-FLAG-cat | This work |
| SSH97A | ccmA::ccmA BD-40 aa linker-HaloTag, rdxA::csd1, csd5::csd5-2X-FLAG-cat | This work |
| SSH109A | ccmA::ccmA ∆NT, rdxA::csd1, csd5::cat | This work |
| TSH17 | csd6::cat | Sycuro et al., 2013 |
Table 2
E. coli strains used in this work.
| Strain | Relevant genotype or description | Reference or source |
|---|---|---|
| BL21 (DE3) | Protein expression E. coli strain | New England Biolabs |
| Stellar | Cloning strain of E. coli | Takara |
Table 3
Plasmids used in this work.
| Plasmid | Genotype or description | Marker | Reference or source |
|---|---|---|---|
| pET15b | Modified pET15 vector (6-His expression vector) | Ampicillin | Barry Stoddard Lab, Fred Hutchinson Cancer Center |
| pKB62A | 6-His ccmA in pET15b | Ampicillin | Taylor et al., 2020 |
| pLC292 | pRdxA | Ampicillin | Terry et al., 2005 |
| pLKS31 | csd1 in pLC292 | Ampicillin | Sycuro et al., 2010 |
| pSS15A | 6-His ccmA ∆MM in pET15b | Ampicillin | This work |
| pSS16A | 6-His ccmA ∆CT in pET15b | Ampicillin | This work |
| pSS17A | 6-His ccmA BD in pET15b | Ampicillin | This work |
| pSS18B | 6-His ccmA ∆13–17 in pET15b | Ampicillin | This work |
| pSS19A | 6-His ccmA ∆NT in pET15b | Ampicillin | This work |
| pCR Blunt II-TOPO vector | TOPO cloning vector | Kanamycin | Invitrogen |
| pKB69H | 6-His ccmA I55A in pET15b | Ampicillin | Taylor et al., 2020 |
| pKB72D | 6-His ccmA L110S in pET15b | Ampicillin | Taylor et al., 2020 |
| pFC30K | His6HaloTag T7 Flexi Vector | Kanamycin | Promega |
| pSS6-4 | ccmA-12 aa linker-HaloTag in pCR Blunt II-TOPO | Kanamycin | This work |
| pSS8E | ccmA-40 aa linker-mNeonGreen in pCR Blunt II-TOPO | Kanamycin | This work |
| pSS10-1 | ccmA-40 aa linker-HaloTag in pCR Blunt II-TOPO | Kanamycin | This work |
Table 4
Primers used in this work.
| Name | Sequence 5′ to 3′ | |
|---|---|---|
| Construction of H. pylori strains | ||
| Csd1 F | GAGTCGTTACATTAATGTGCATATCT | |
| CcmA SDM dn R | GCTCATTTGAGTGGTGGGAT | |
| Remove aa 2–17 F | CAATAAAGAAAGGAGCATCAGATGGCGACTATCATCGCTC | |
| Remove aa 2–17 R | GAGCGATGATAGTCGCCATCTGATGCTCCTTTCTTTATTG | |
| Remove aa 3–12 F | AATAAAGAAAGGAGCATCAGATGGCAGCAAAAACAGG | |
| Remove aa 3–12 R | CCTGTTTTTGCTGCCATCTGATGCTCCTTTCTTTATT | |
| Remove aa 119–136 F | GGGAAACTCGCCCTAAGAATTAGGGAATGATCCAATCTAG | |
| Remove aa 119–136 R | CTAGATTGGATCATTCCCTAATTCTTAGGGCGAGTTTCCC | |
| Remove aa 13–17 2 F | ATAACAATAATAAATCGGCTAATGCGACTATCATCGCTCA | |
| Remove aa 13–17 2 R | TGAGCGATGATAGTCGCATTAGCCGATTTATTATTGTTAT | |
| CcmA_40aa_linker_upstream_R | ACCTTGTCCGCTACCCTCAAGTTTATTTTCAATTTTCTTTTC | |
| CcmA_mNeonGreen_dnstrm_F | GATGGATGAATTATATAAATAATAGGGAATGATCCAATCTAGTCT | |
| CcmA_12_aa_link_Halo_R | AGTACCGATTTCACTACCACCACCACTACCACCACCACTACCACCACCTTTATTTTCAAT | |
| CcmA_Halo_dnstrm_R | AGACTAGATTGGATCATTCCCTAACCGGAAATCTCCAGA | |
| CcmA_12_aa_link_Halo_F | ATTGAAAATAAAGGTGGTGGTAGTGGTGGTGGTAGTGGTGGTGGTAGTGAAATCGGTACT | |
| 40 aa linker halotag R | TGGAAAGCCAGTACCGATTTCGCCTTGACCTGGGCCAGATCC | |
| 40 aa linker halotag F | GGATCTGGCCCAGGTCAAGGCGAAATCGGTACTGGCTTTCCA | |
| C1_828 | GATATAGATTGAAAAGTGGAT | |
| C1_829 | TTATCAGTGCGACAAACTGGG | |
| Cloning for protein purification | ||
| CcmA_pET15b_BamHI | GTTAGCAGCCGGATCCCTATTTATTTTCAATTTTCTTTTCTTGCTCATTGA | |
| pET15b_ccmA_delta_aa2to17_NdeI | CGCGCGGCAGCCATATGATGGCGACTATCATCGCTCAAG | |
| CcmA_pET15b_BamHI | GTTAGCAGCCGGATCCCTATTTATTTTCAATTTTCTTTTCTTGCTCATTGA | |
| pET15b_ccmA_delta_aa3to12_NdeI | CGCGCGGCAGCCATATGATGGCAGCAAAAACAGGACCAG | |
| CcmA_pET15b_NdeI | CGCGCGGCAGCCATATGATGGCAATCTTTGATAACAATAATAAATCGGCT | |
| pET15b_ccmA_delta_aa119to136_BamHI | GTTAGCAGCCGGATCCCTAATTCTTAGGGCGAGTTTCC | |
| pET15b_ccmA_delta_aa13to17_NdeI | CGCGCGGCAGCCATATGATGGCAATCTTTGATAACAATAATAAATCGGCT | |
| Sequencing primers | ||
| Target | Primer name | |
| rdxA | 1318 | GAAGCGGTTACAATCATCACGCCC |
| rdxA | 1319 | GCTTGAAAACACCCCTAAAAGAGCG |
| ccmA | 1432 | GATTACCATTTGCATGTAGATGGCG |
| ccmA | 1433 | CTAGAGATCTTACCATCAAGGCGC |
| csd5 | Csd5-c-term-seq | AAGCGTGAAGGTTTTAGAAATCCA |
| csd5 | 1194_R | CCACAAGCTCATCATCTTCCAAAA |
| pET15b | T7 F | CGAAATTAATACGACTCACTATAGG |
| pET15b | T7 R | CCTCAAGACCCGTTTAGAGGCC |
Additional files
Download links
A two-part list of links to download the article, or parts of the article, in various formats.
Downloads (link to download the article as PDF)
Open citations (links to open the citations from this article in various online reference manager services)
Cite this article (links to download the citations from this article in formats compatible with various reference manager tools)
Distinct regions of H. pylori’s bactofilin CcmA regulate protein–protein interactions to control helical cell shape
eLife 11:e80111.
https://doi.org/10.7554/eLife.80111


