Colour polymorphism associated with a gene duplication in male wood tiger moths
- Organismal and Evolutionary Biology Research Program, Faculty of Biological and Environmental Sciences, University of Helsinki, Finland
- Department of Zoology, University of Cambridge, United Kingdom
- Ecology and Genetics Research Unit, University of Oulu, Finland
- Department of Biological and Environmental Science, University of Jyväskylä, Finland
- Department of Chemistry, University of Jyväskylä, Finland
- Institute for Melanin Chemistry, Fujita Health University, Japan
Figures
Figure 1

The wood tiger moth, Arctia plantaginis.
(A) Sampling locations and frequencies of yellow and white males in Finland, Scotland, and Estonia. (B) Males of the white and yellow colour morphs (credit: Samuel Waldron).
Figure 2 with 5 supplements

A duplicated region in white morphs is associated with male hindwing colour.
(A) Quantitative trait locus (QTL) analysis of white and yellow F1 males (n = 172) reveals a 500 kb region significant on scaffold 206 of the yellow reference, part of linkage group 9. The dotted line indicates the significance threshold determined by permutation tests (p=0.05). (B) A genome-wide association study (GWAS) of wild samples (n = 46) showed SNPs associated with hindwing colour along the same scaffold. The dotted line shows the Bonferroni corrected significance threshold. (C) Alignment of the white and yellow reference genomes reveals an insertion in the white reference sequence that contains a copy of the yellow-e gene which we named valkea, in addition to the yellow-e present in both white and yellow morphs. (D) Mean read depth across the candidate region in all Finnish white (WW and Wy) and yellow (yy) samples.
Figure 2—figure supplement 1
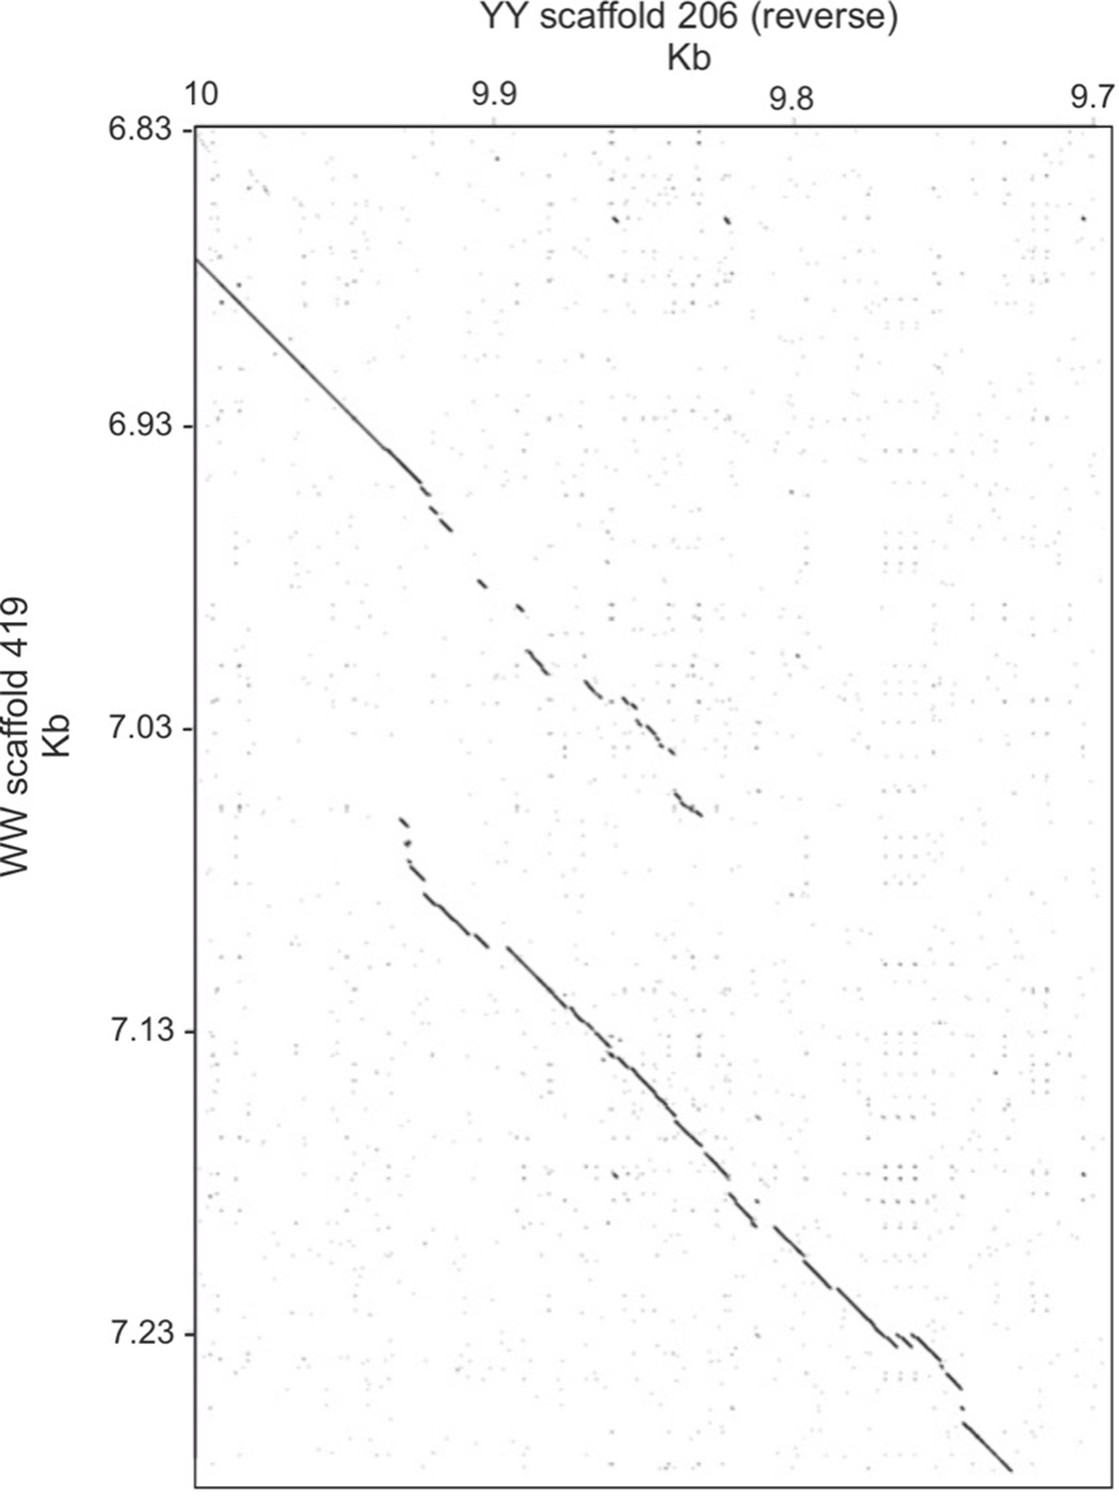
Dotplot of the alignment between a region of scaffold 419 from the white reference and scaffold 206 from the yellow reference.
Figure 2—figure supplement 2
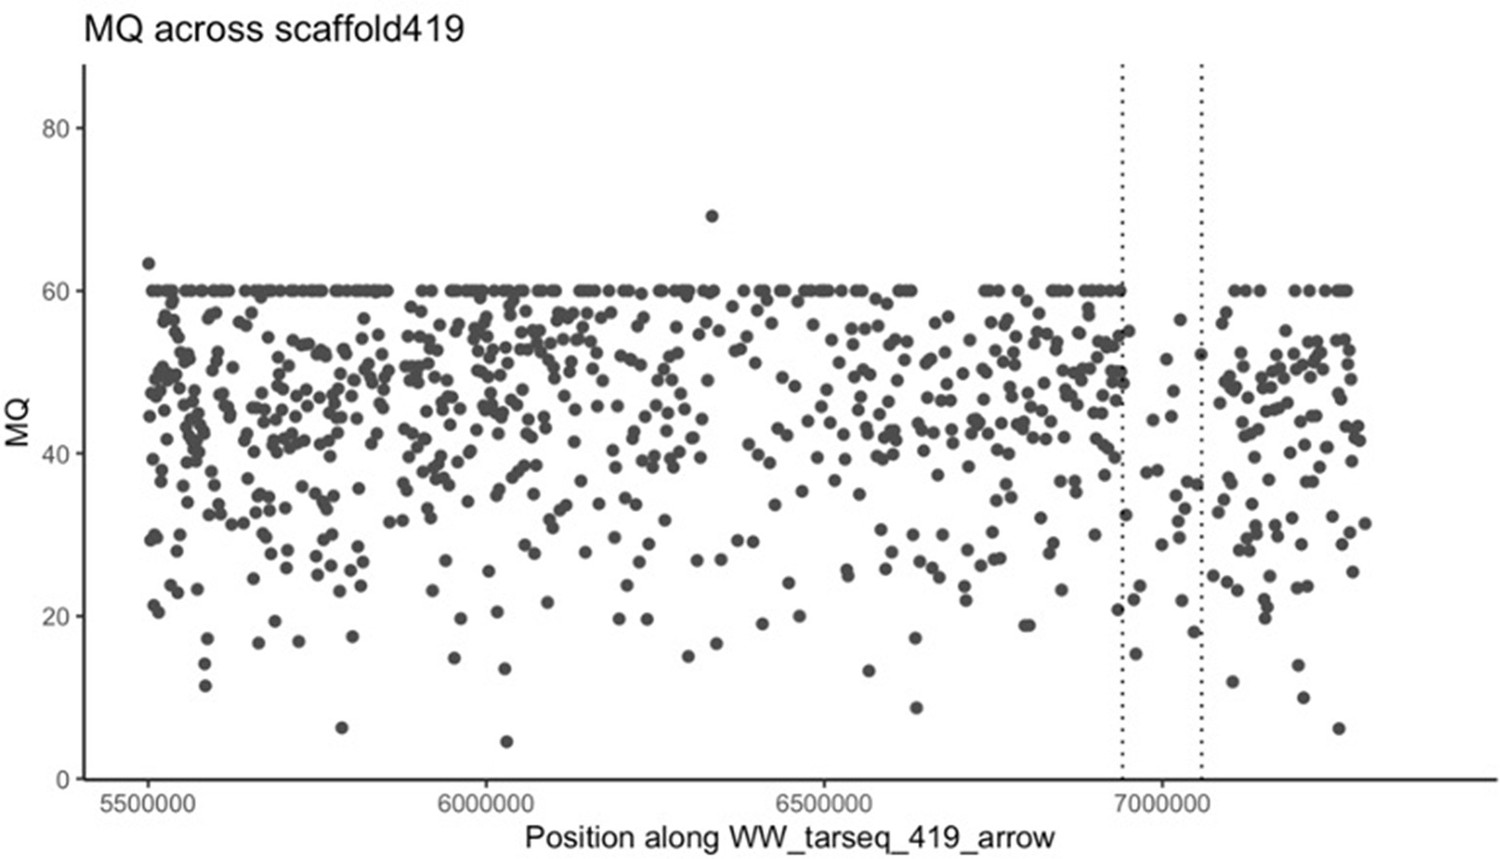
Mapping quality (MQ) across the latter half of scaffold WW_tarseq_419_arrow.
MQ is lower within the duplicated region (between the dotted lines): average MQ for the duplication including all samples is 36.52, whereas for the rest of the scaffold, not including the duplication, it is 44.16.
Figure 2—figure supplement 3
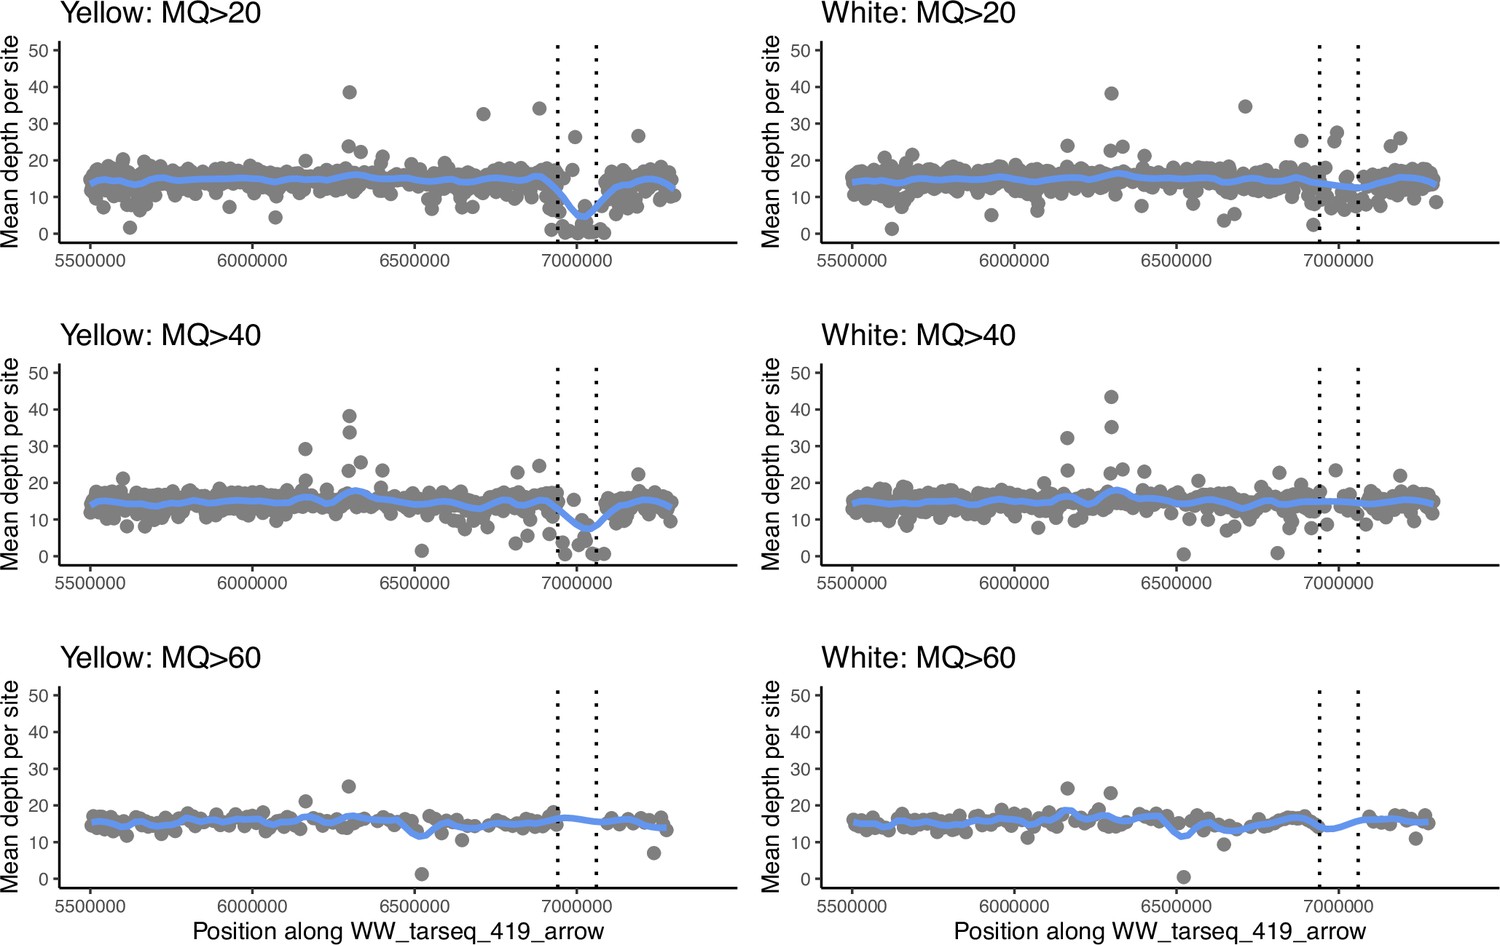
When filtering for increasing mapping quality, more reads are lost within the duplication in yellow samples compared to white samples, suggesting that reads in this region are more likely to be mismapped than in white samples.
Figure 2—figure supplement 4
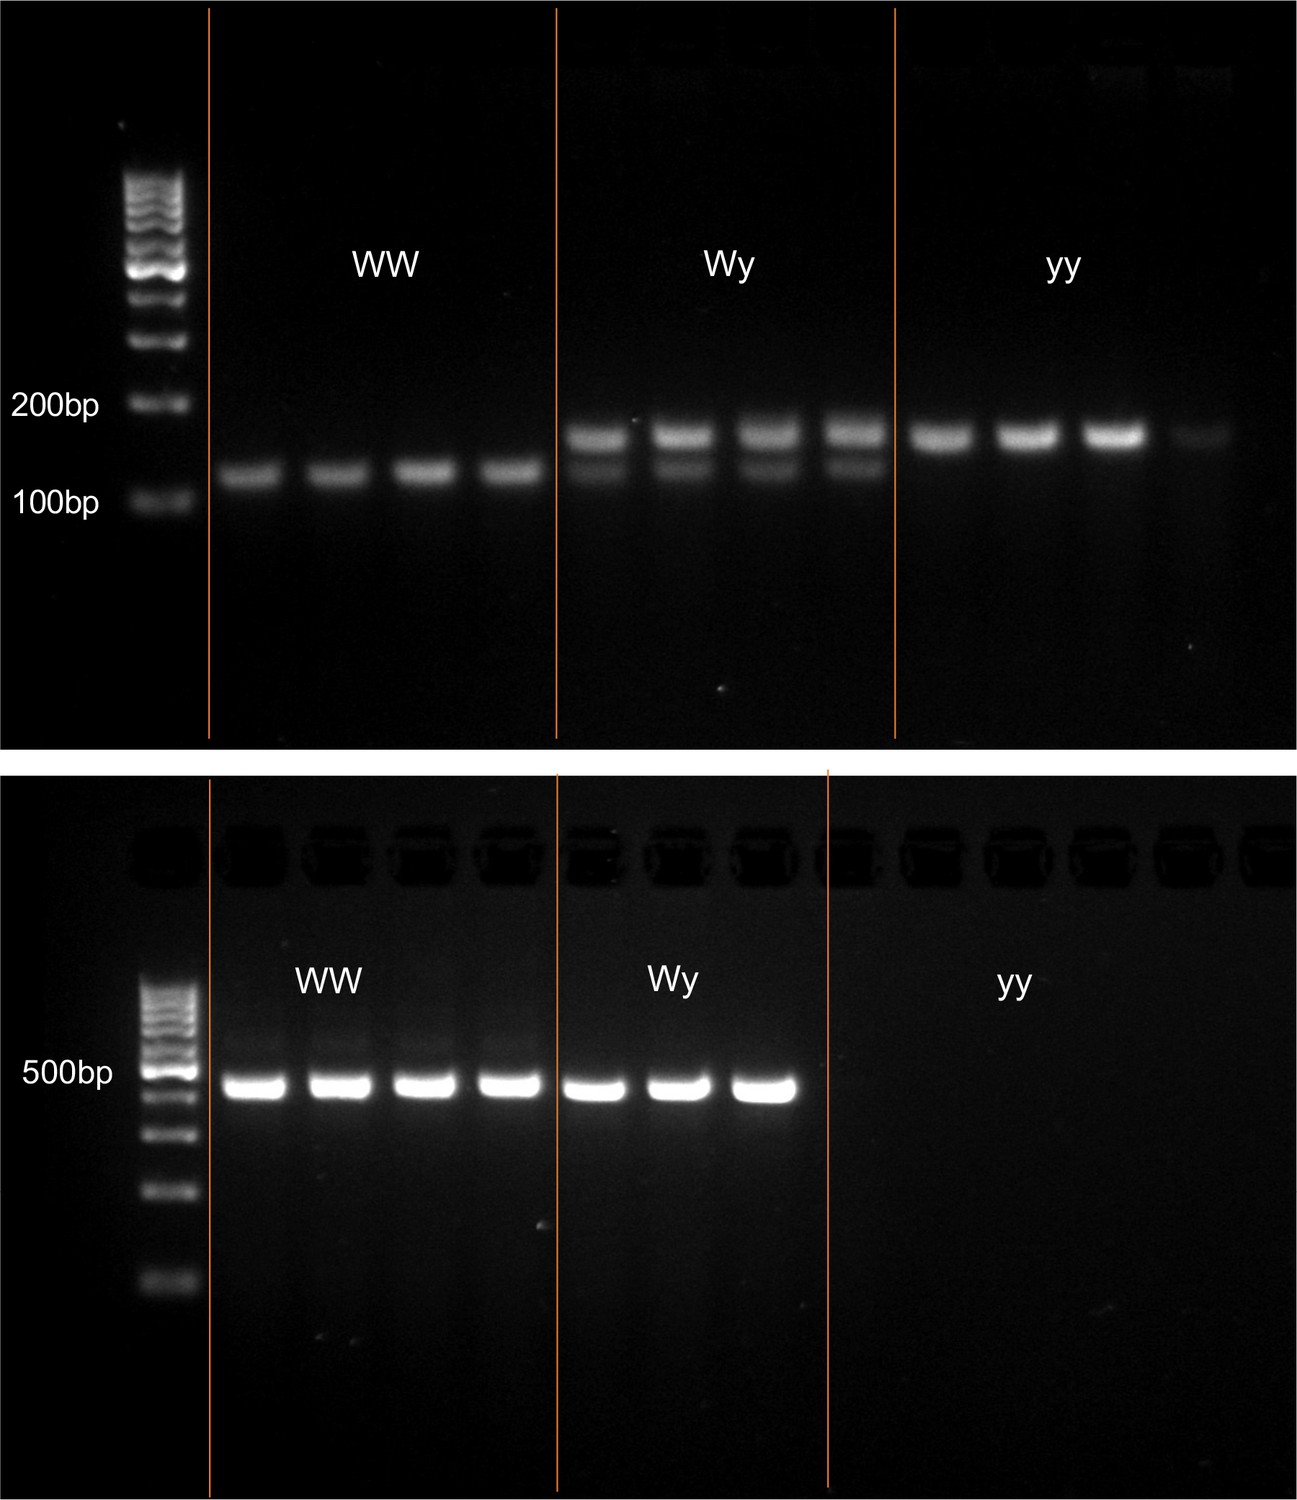
Example gel images for the genotyping primers.
Top: Yellow alleles have the larger 163 bp band, while white alleles have a 35 bp deletion producing the smaller ~128 bp band. Heterozygotes have a copy of each. Bottom: A 449 bp region within the duplication amplifies only in samples with one or two white alleles.
-
Figure 2—figure supplement 4—source data 1
Unedited gel image showing the genotyping primers.
- https://cdn.elifesciences.org/articles/80116/elife-80116-fig2-figsupp4-data1-v2.pdf
Figure 2—figure supplement 5
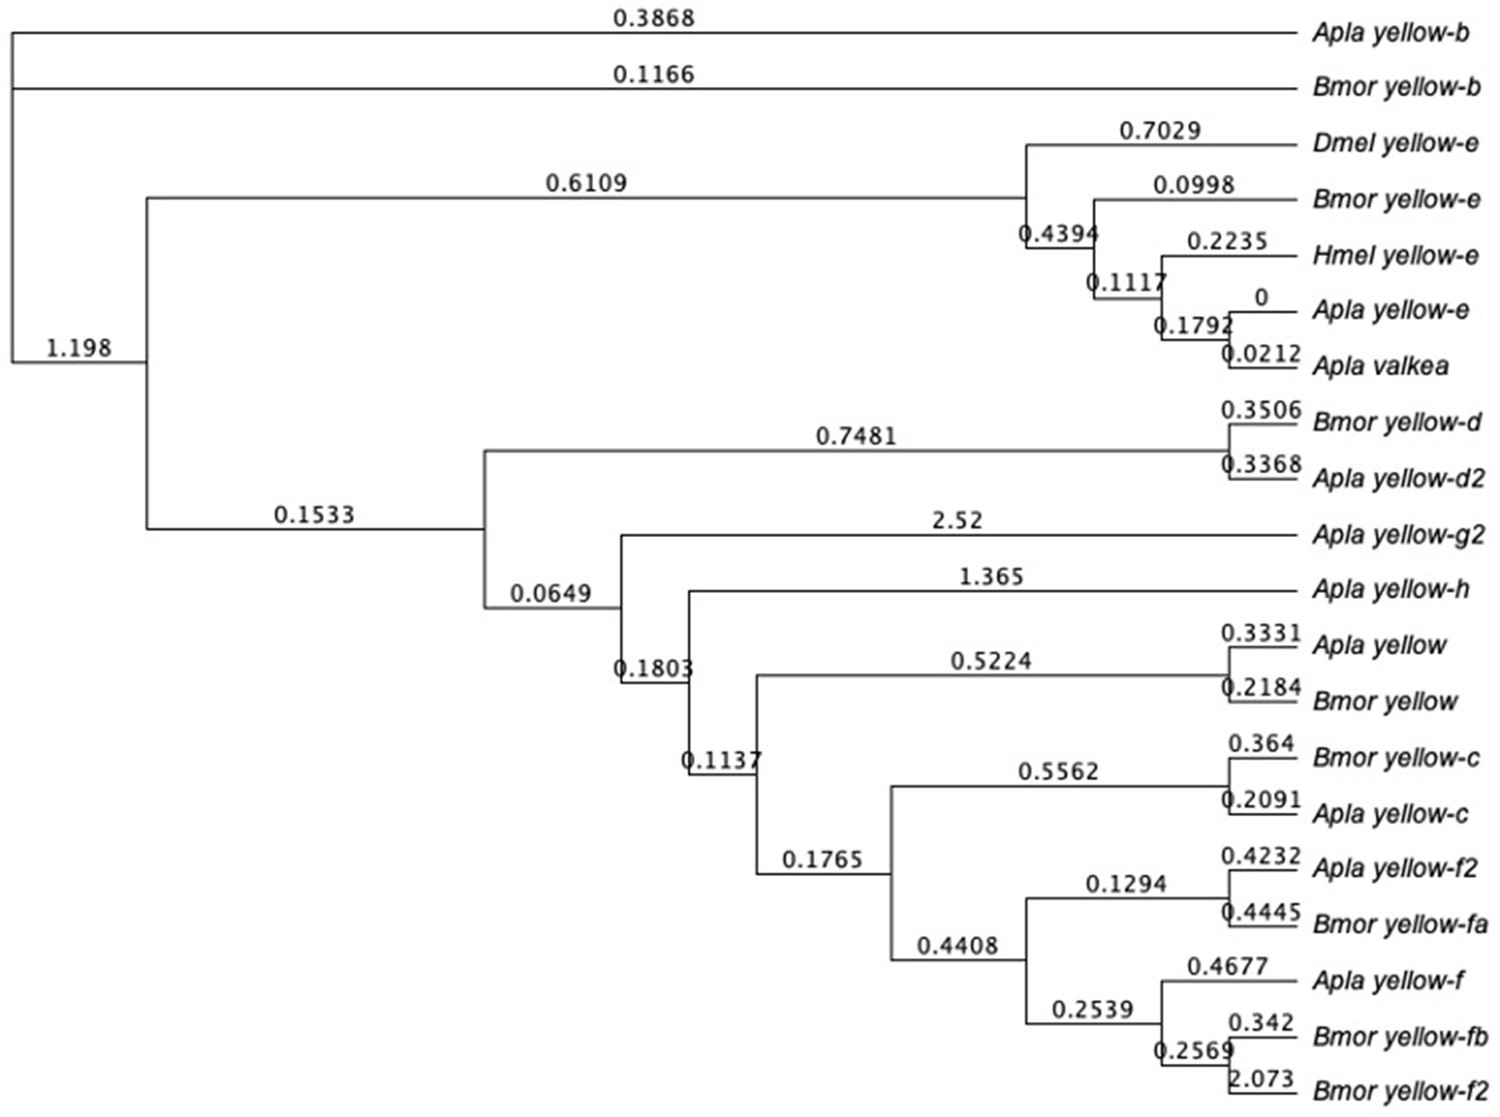
Tree of coding sequences for all yellow family genes found in A. plantaginis and B. mori.
Yellow-e sequences from D. melanogaster and H. melpomene are also included. Values are substitutions per site.
Figure 3 with 2 supplements

Valkea is overexpressed in white males in the pre-melanin stage.
(A) In pink are genes that are significantly differentially expressed between yellow and white morphs at the pre-melanin stage. Valkea is the most differentially expressed (DE) gene (i.e. gene with the highest log fold change). (B) Expression of valkea across developmental timepoints shows that it has higher expression measured in Log2 CPM (counts per million) in white individuals compared to yellow ones. Expression of valkea in yellow morphs is around 0.
Figure 3—figure supplement 1

Genome-wide expression patterns are shaped by developmental stage.
Multidimensional scaling of gene expression shows that samples cluster by developmental stage rather than male colour morph. Developmental stage names have been abbreviated: 72h = 72 hours, 5d = 5 days, Premel = pre-melanin, and Mel = melanin.
Figure 3—figure supplement 2
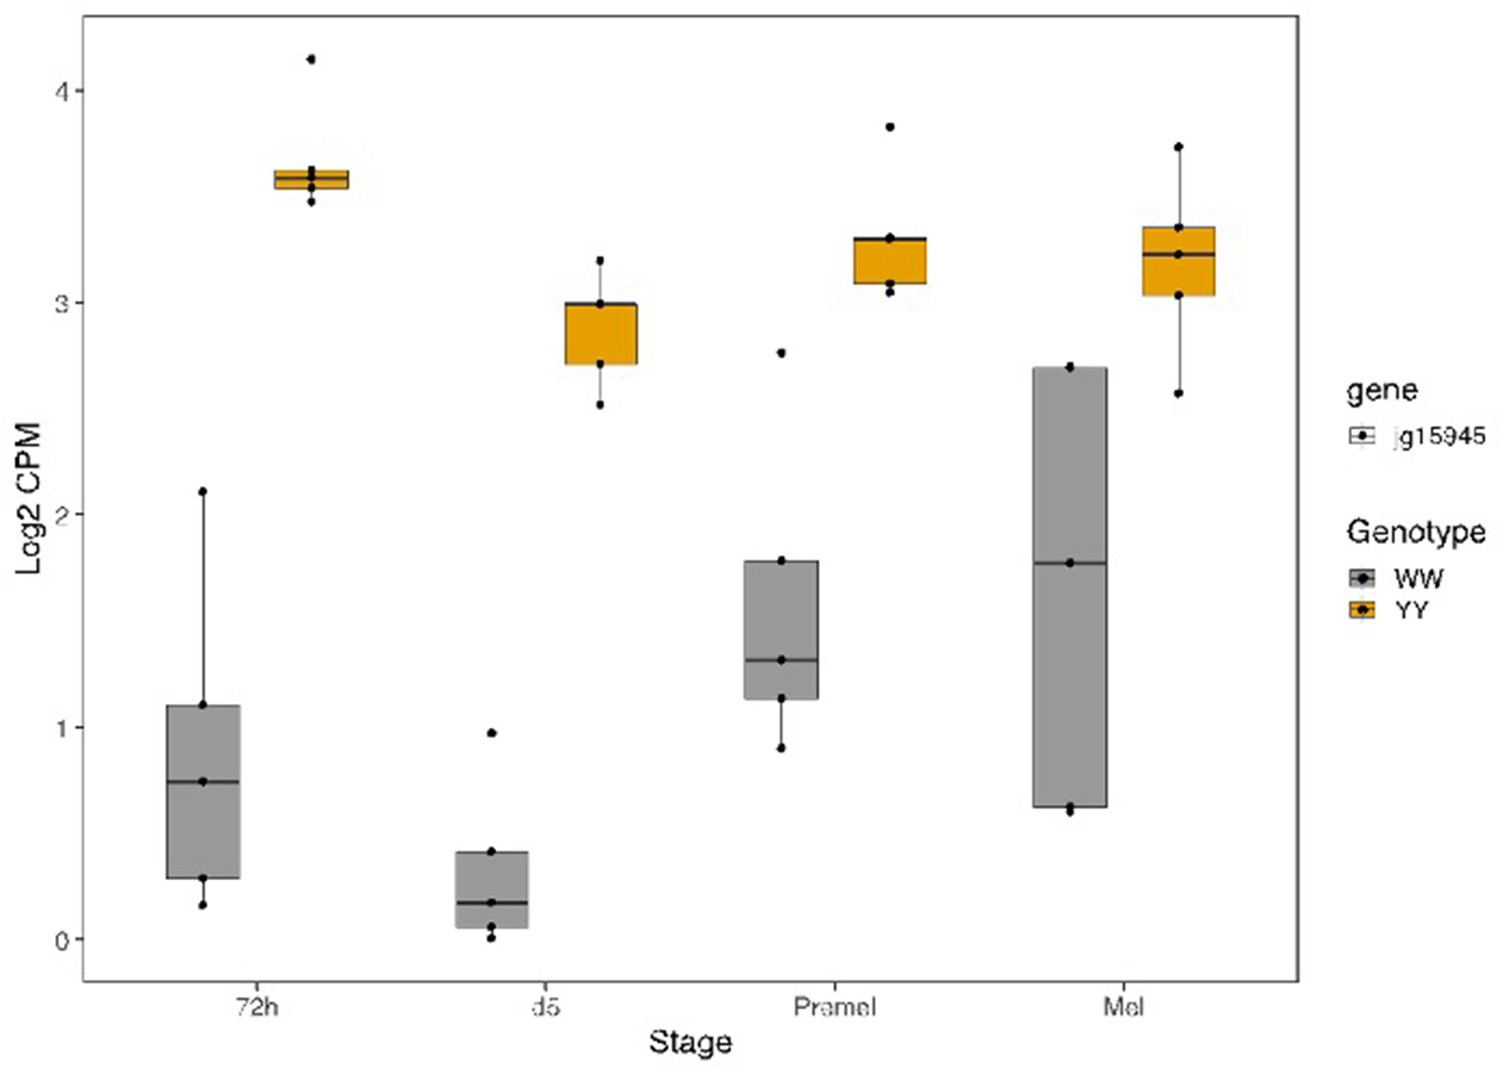
Expression of the gene ‘jg15945’ across the four developmental stages.
Figure 4 with 4 supplements
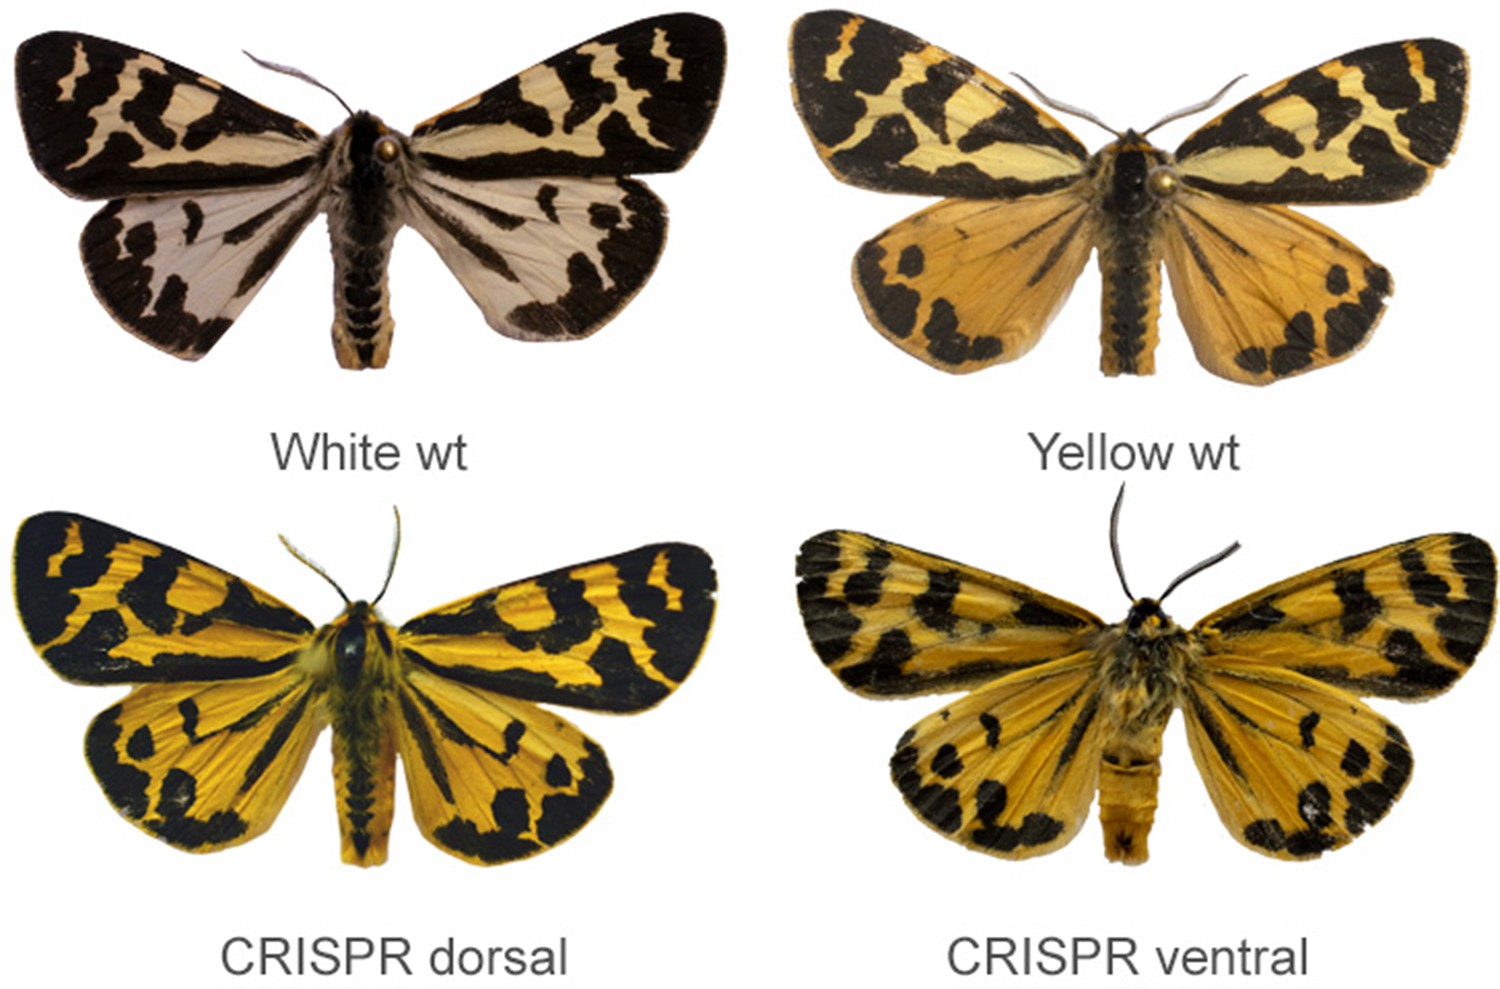
CRISPR/Cas9 knockouts of valkea transforms white scales into yellow scales across both hindwings and forewings.
Wildtype WW and yy morphs (top), and the dorsal and ventral sides of one of the CRISPR knockout males (bottom).
Figure 4—figure supplement 1
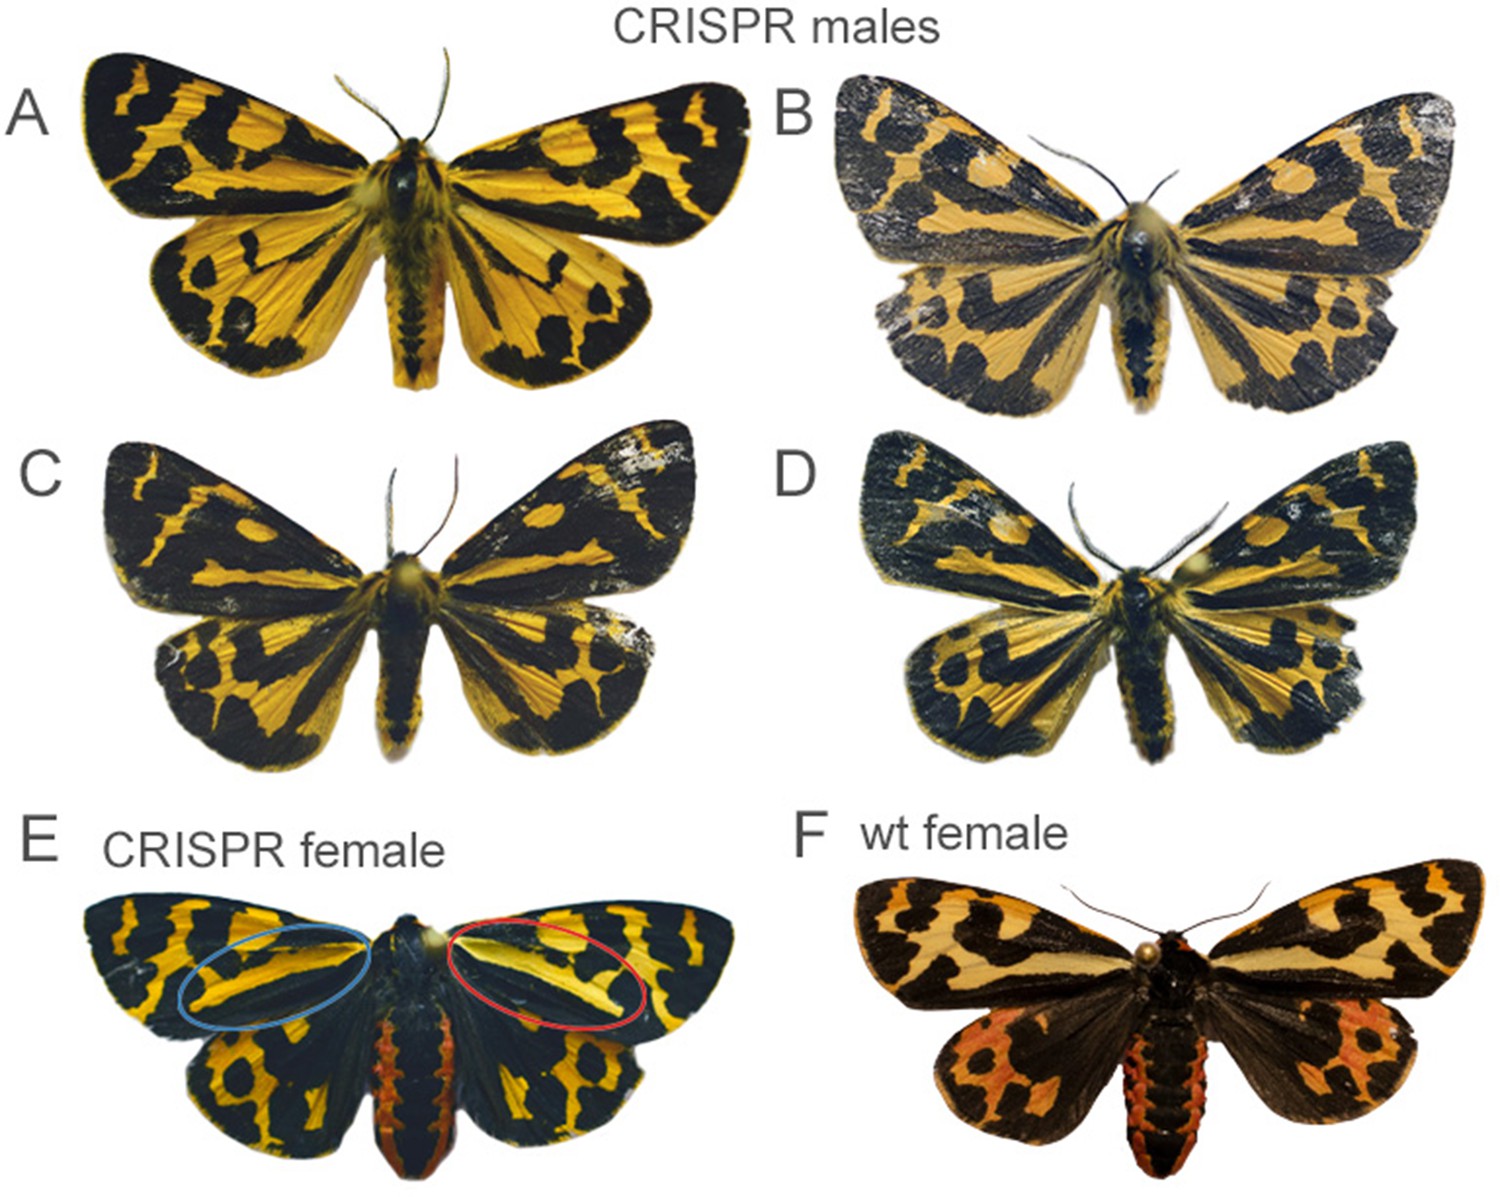
The four males showing the mutant phenotype.
Variation in melanin amount is likely due to the lineage, with (A) coming from the Estonian line, and (B–D) coming from the Finnish line. (E) Female showing a mosaic knockout phenotype with left forewing showing similar colour to the male mutants. (F) Wildtype female with the pale-yellow colour on both forewings. Hindwing colour in females varies continuously from yellow/orange to red.
Figure 4—figure supplement 2
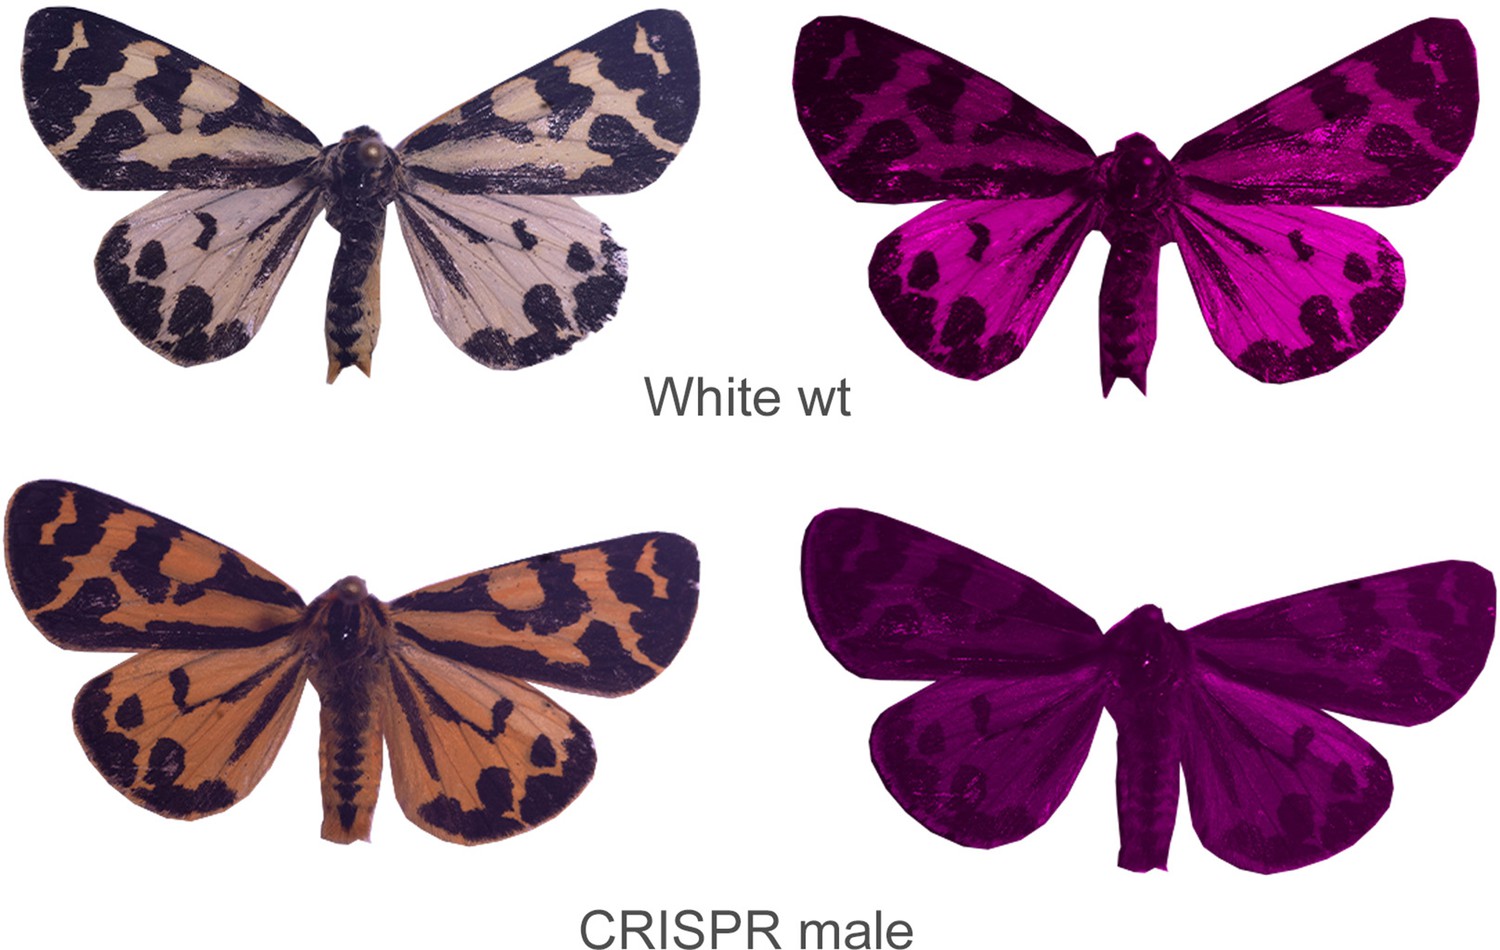
Wildtype WW morphs show UV reflectance on the dorsal sides of the wings.
The brighter pink colour in the UV photos (right) shows the areas with highest UV reflectance. UV reflectance is lost in the CRISPR knockout males.
Figure 4—figure supplement 3
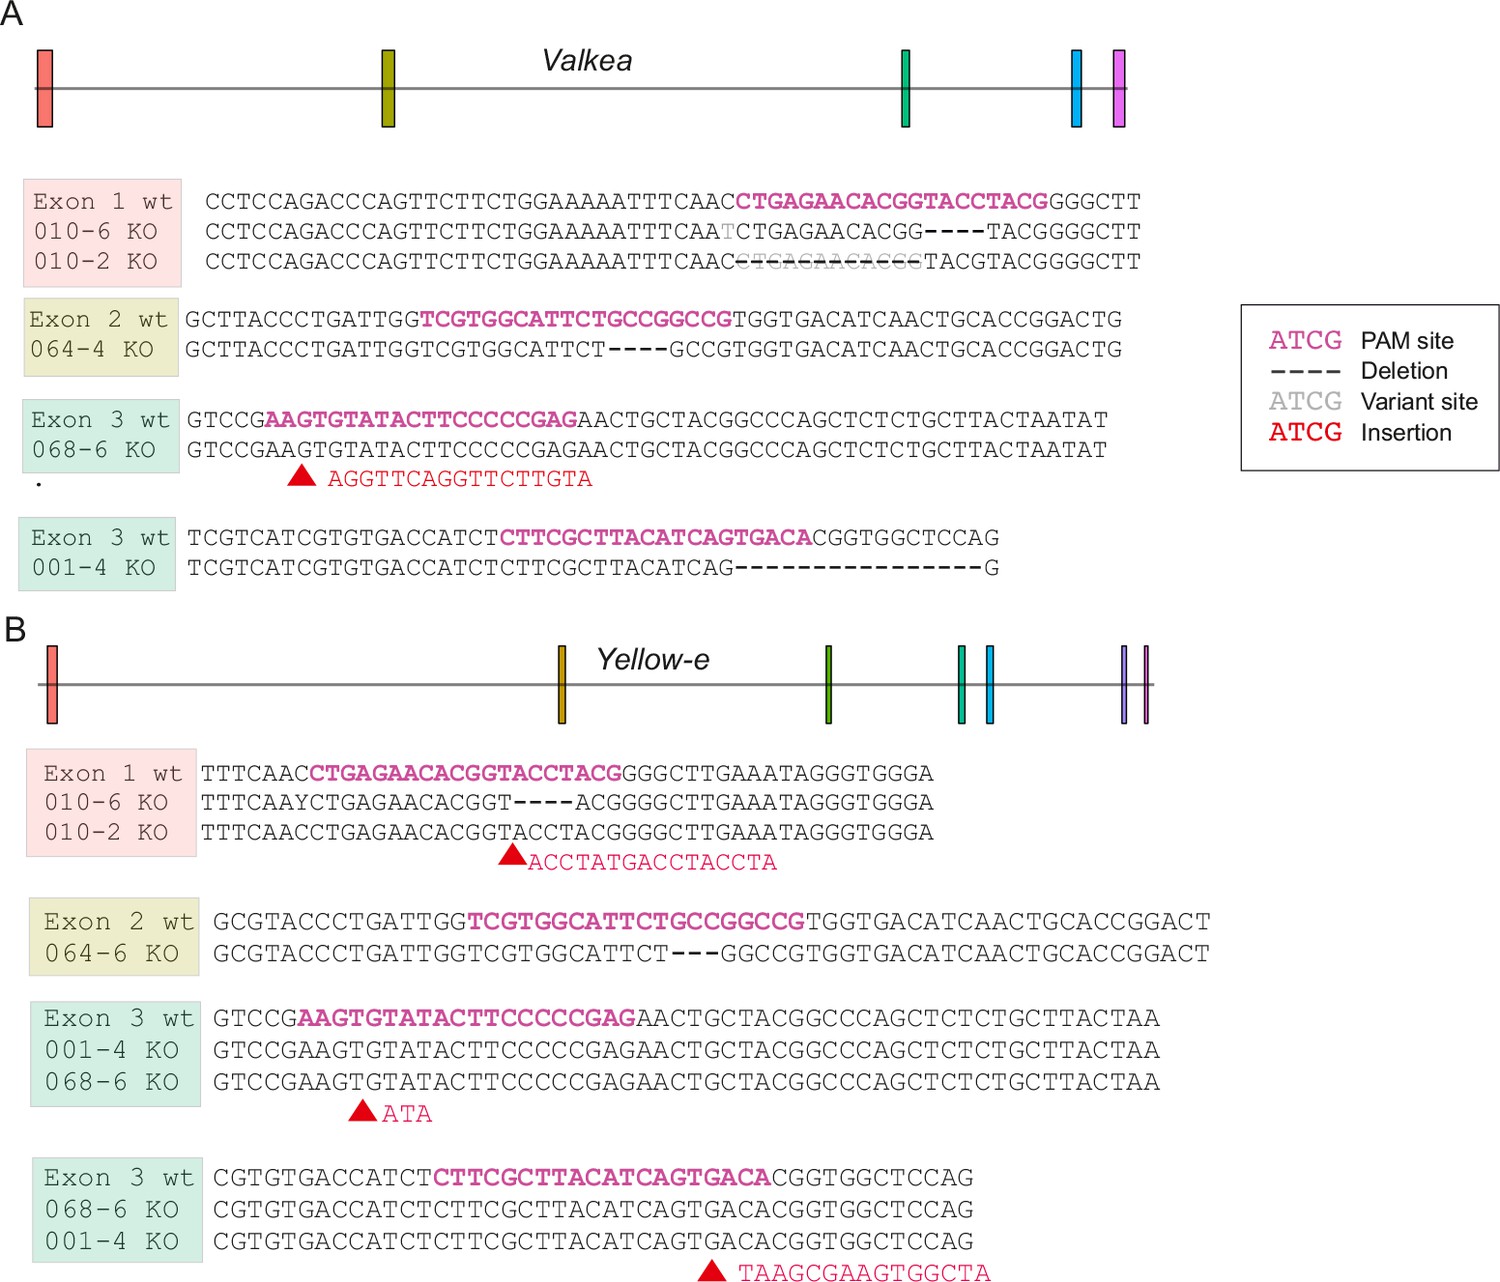
CRISPR knockouts confirmed using sequence data of the five individuals with visible changes in phenotype.
The top row of each block shows the reference sequence, and the rows underneath are the mutant individuals. Pink sequences denote the guide RNA sequence. Four different guides produced mutants (one in each of exons 1 and 2, and two in the third exon). Red arrows show insertions. (A) Three out of five samples show small deletions in valkea close to the target sites, and another showed a deletion in some reads. One sample had an insertion. (B) In the corresponding sites in yellow-e, two samples showed evidence of deletions and three had insertions. 064-4 is ID of the female mutant.
Figure 4—figure supplement 4
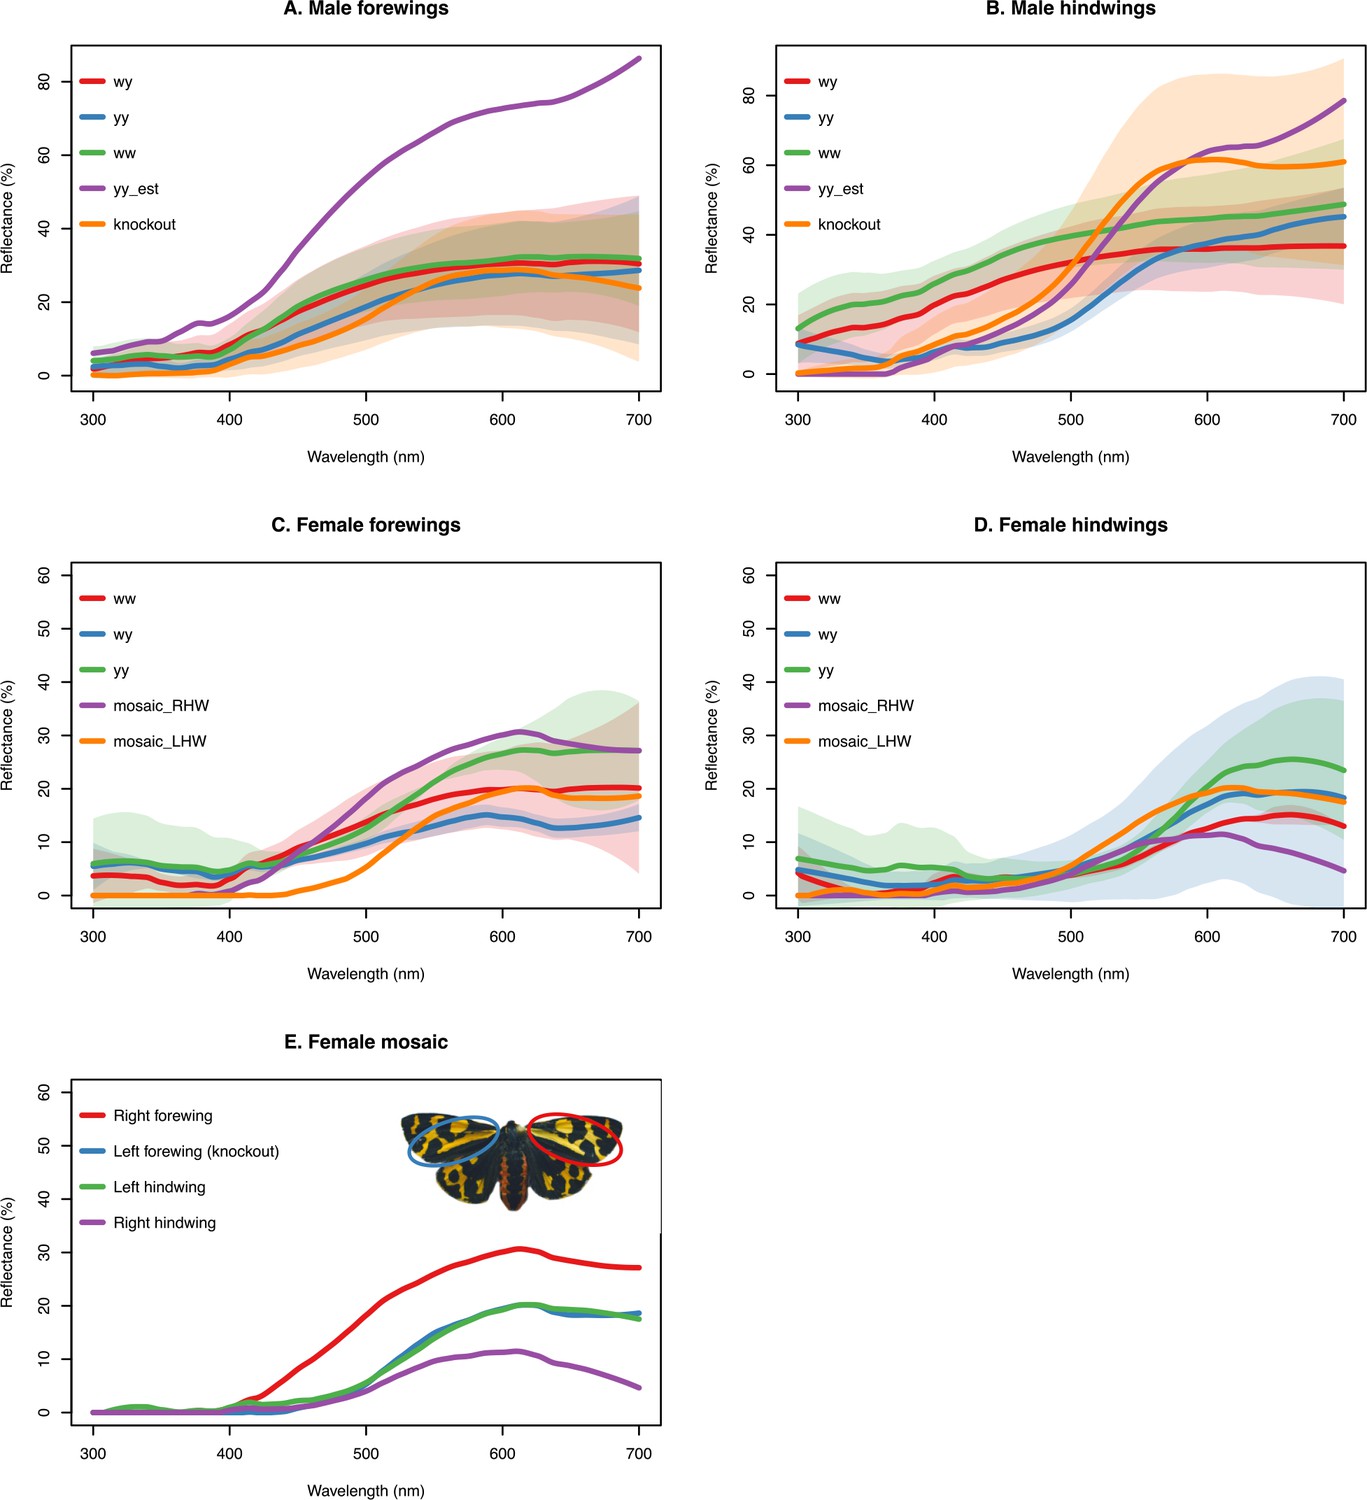
Reflectance spectra of the wings for wildtype Finnish genotypes (ww, wy and yy) and a yy Estonian.
The coloured section of the wings were measured on male forewings (A), male hindwings (B), female forewings (C), and female hindwings (D). (E) shows measurements for each wing of the one CRISPR female mutant.
Figure 5 with 3 supplements
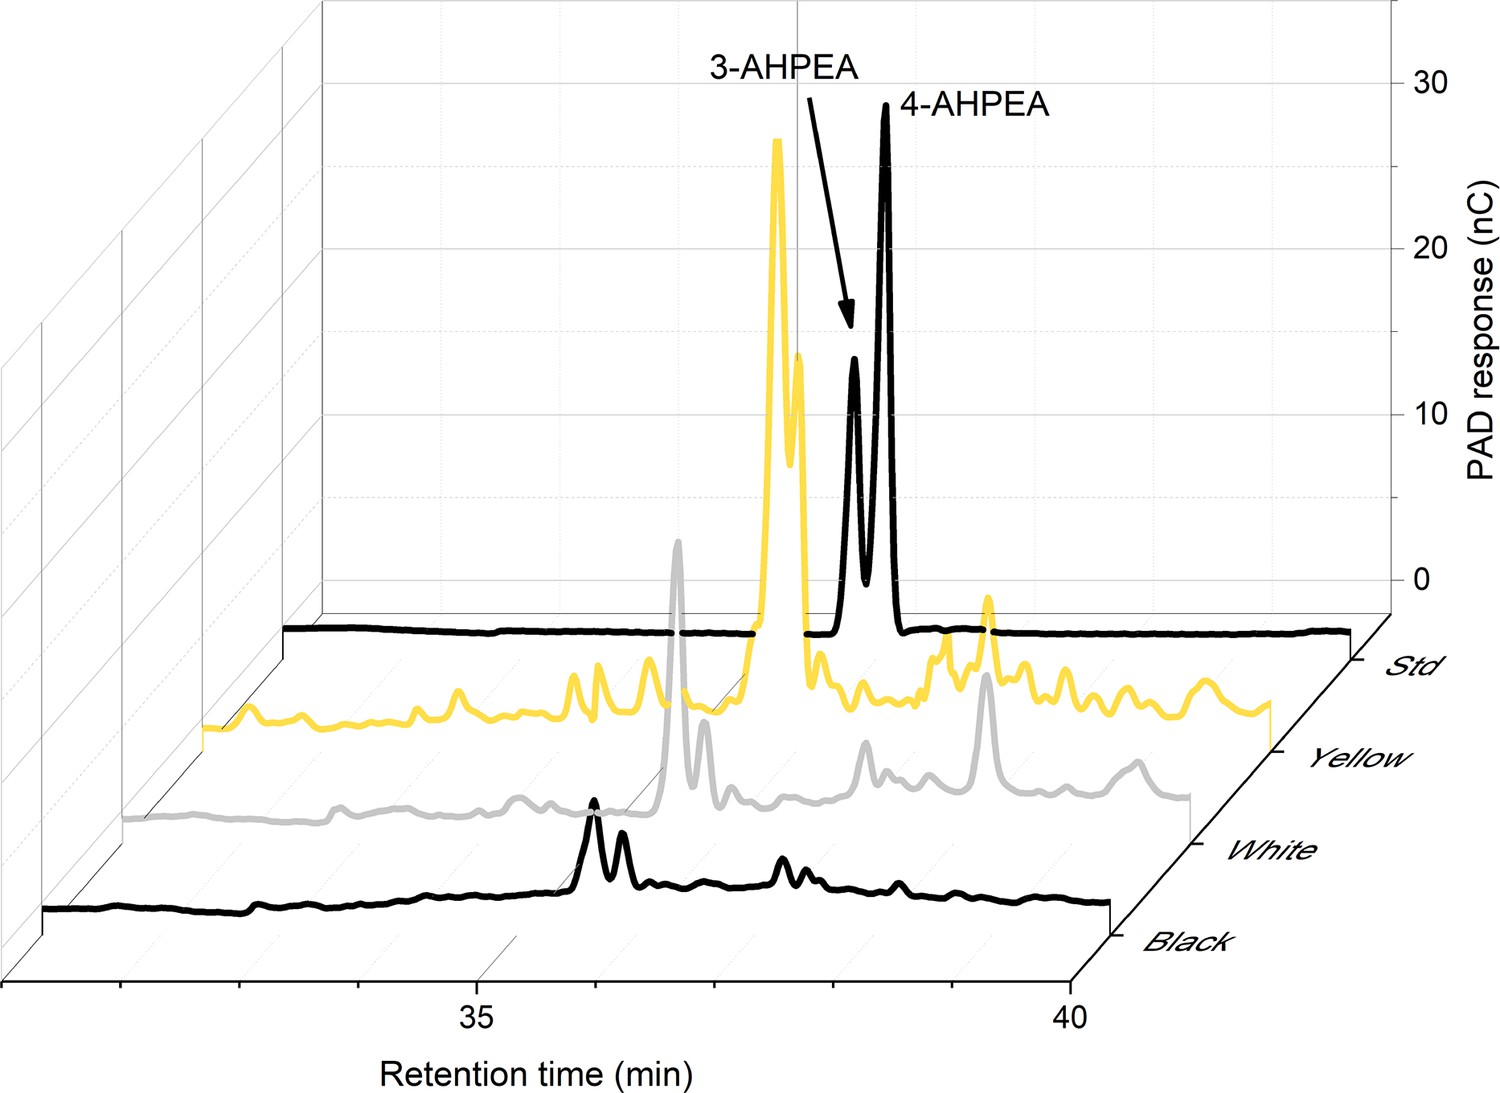
High-performance liquid chromatography (HPLC) analysis shows that the highest levels of 4-AHPEA, a breakdown product of pheomelanin, are seen in the yellow wings.
Measurements for yellow, white, and black portions of the hindwing, plus the standard (Std) are shown.
Figure 5—figure supplement 1
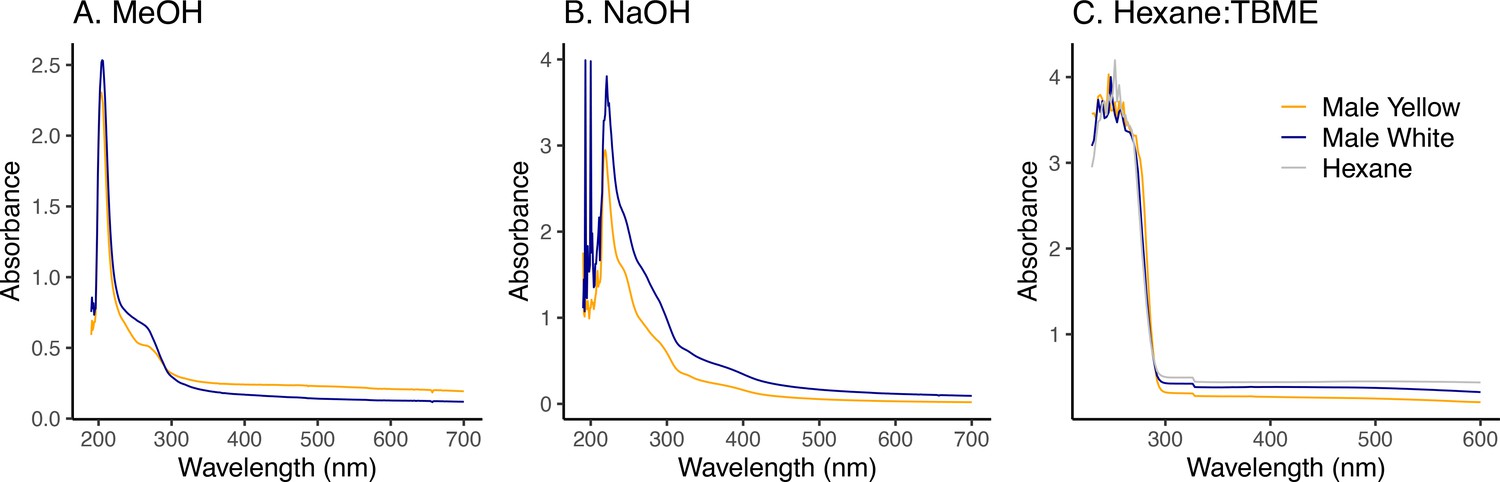
Absorbance curves for yellow and white male wings and female wings left in (A) methanol, which absorbs at 205 nm, (B) sodium hydroxide, which absorbs in the UV range, and (C) hexane:tert-butyl methyl ether which absorbs between 195 and 210 nm, as shown in the control measurement. Peaks outside of these values would suggest the presence of pigment compounds in the solvent, but these are not seen.
Figure 5—figure supplement 2
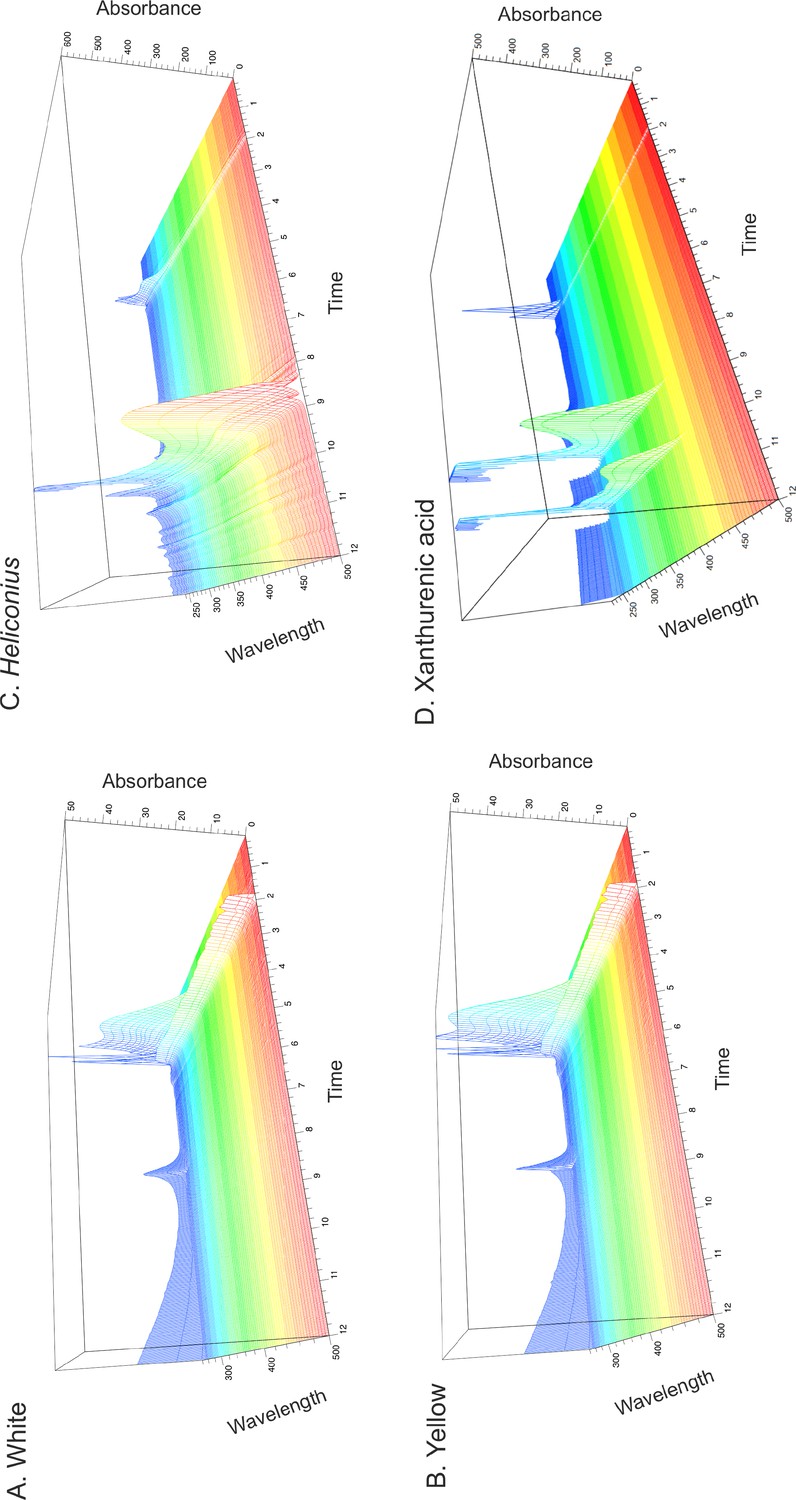
Spectral and chromatogram data obtained using high-performance liquid chromatography (HPLC) to test for the presence of ommochrome pigments.
White (A) and yellow (B) A. plantaginis morphs are compared to ommochrome-containing Heliconius wings (C) and a Xanthurenic acid standard (D).
Figure 5—figure supplement 3
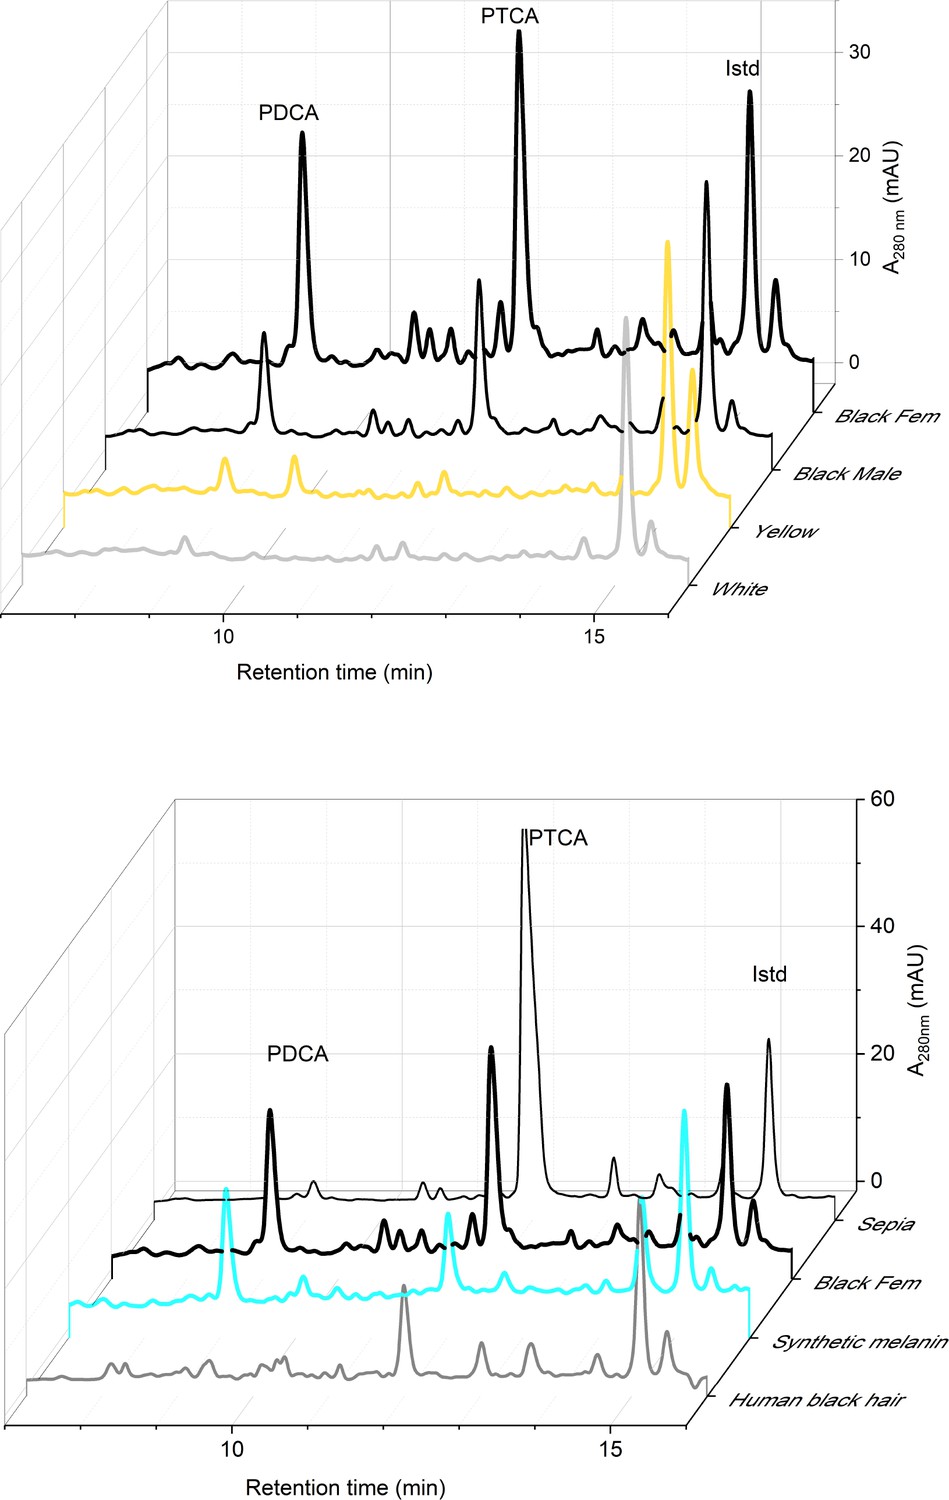
High-performance liquid chromatography (HPLC) result for eumelanin analysis.
The black portions of the wings show the presence of dopamine-derived eumelanin components pyrrole-2,3-dicarboxylic acid (PDCA) and pyrrole-2,3,5-tricarboxylic acid (PTCA). Phthalic acid is the internal standard (Istd). Below are results of eumelanin-containing samples for comparison – sepia, synthetic material, and human hair.
Additional files
-
Supplementary file 1
Supplementary tables.
(A) 21 genes are within in the QTL interval. Start and end positions shown are on scaffold 206 in the yellow A. plantaginis reference genome. Gene sequences were blasted against Heliconius melpomene and searched for in FlyBase. Apla gene names from annotations produced by Yen et al., 2020. (B) Primers used for genotyping. Tested using GoTaq Flexi buffer and GoTaq DNA polymerase, with annealing temperature of 57°C for 35 cycles. ‘Ye12’ primers surround a small deletion in white alleles, producing a 163 bp product from Y alleles and 128 bp product from W alleles. ‘Dup5’ primers amplify a 449 bp sequence within the duplicated sequence only in moths with at least one W allele. See Figure 2—figure supplement 4 for gel images. (C) List of differentially expressed genes found in the linkage group containing scaffold 419 (WW reference). (D) Details of the number of eggs injected with each sgRNA and those which produced adult moths. (E) Sample list of all lab cross individuals used in linkage mapping. (F) Sample list of all wild samples used. (G) CRISPR sgRNAs sequences. (H) Elution gradient used in pheomelanin HPLC analysis. (I). Waveform of disposable working electrode in pheomelanin analysis.
- https://cdn.elifesciences.org/articles/80116/elife-80116-supp1-v2.docx
-
MDAR checklist
- https://cdn.elifesciences.org/articles/80116/elife-80116-mdarchecklist1-v2.docx
Download links
A two-part list of links to download the article, or parts of the article, in various formats.
Downloads (link to download the article as PDF)
Open citations (links to open the citations from this article in various online reference manager services)
Cite this article (links to download the citations from this article in formats compatible with various reference manager tools)
Colour polymorphism associated with a gene duplication in male wood tiger moths
eLife 12:e80116.
https://doi.org/10.7554/eLife.80116


