Peroxiredoxin 5 regulates osteogenic differentiation through interaction with hnRNPK during bone regeneration
- Department of Oral Biochemistry, Korea Mouse Phenotype Center (KMPC), Dental Science Research Institute, School of Dentistry, Chonnam National University, Republic of Korea
- Department of Biochemistry and Cell Biology, BK21 Plus KNU Biomedical Convergence Program, Skeletal Diseases Analysis Center, Korea Mouse Phenotyping Center (KMPC), School of Medicine, Kyungpook National University, Republic of Korea
- Department of Basic Veterinary Sciences, College of Veterinary Medicine, University of the Philippines Los Baños, Philippines
- School of Biological Sciences and Technology, Chonnam National University, Republic of Korea
- Proteomics Core Facility, Biomedical Research Institute, Seoul National University Hospital, Republic of Korea
- Department of Microbiology, Department of Molecular Medicine (BK21plus), Chonnam National University Medical School, Republic of Korea
- Therapeutic & Biotechnology Division, Drug Discovery Platform Research Center, Research Institute of Chemical Technology (KRICT), Republic of Korea
- Research Center for Bioconvergence Analysis, Korea Basic Science Institute, Republic of Korea
- Preclinical Research Center, Daegu-Gyeongbuk Medical Innovation Foundation, Republic of Korea
- Department of Veterinary Anatomy and Animal Behavior, College of Veterinary Medicine and BK21 FOUR Program, Chonnam National University, Republic of Korea
Figures
Figure 1
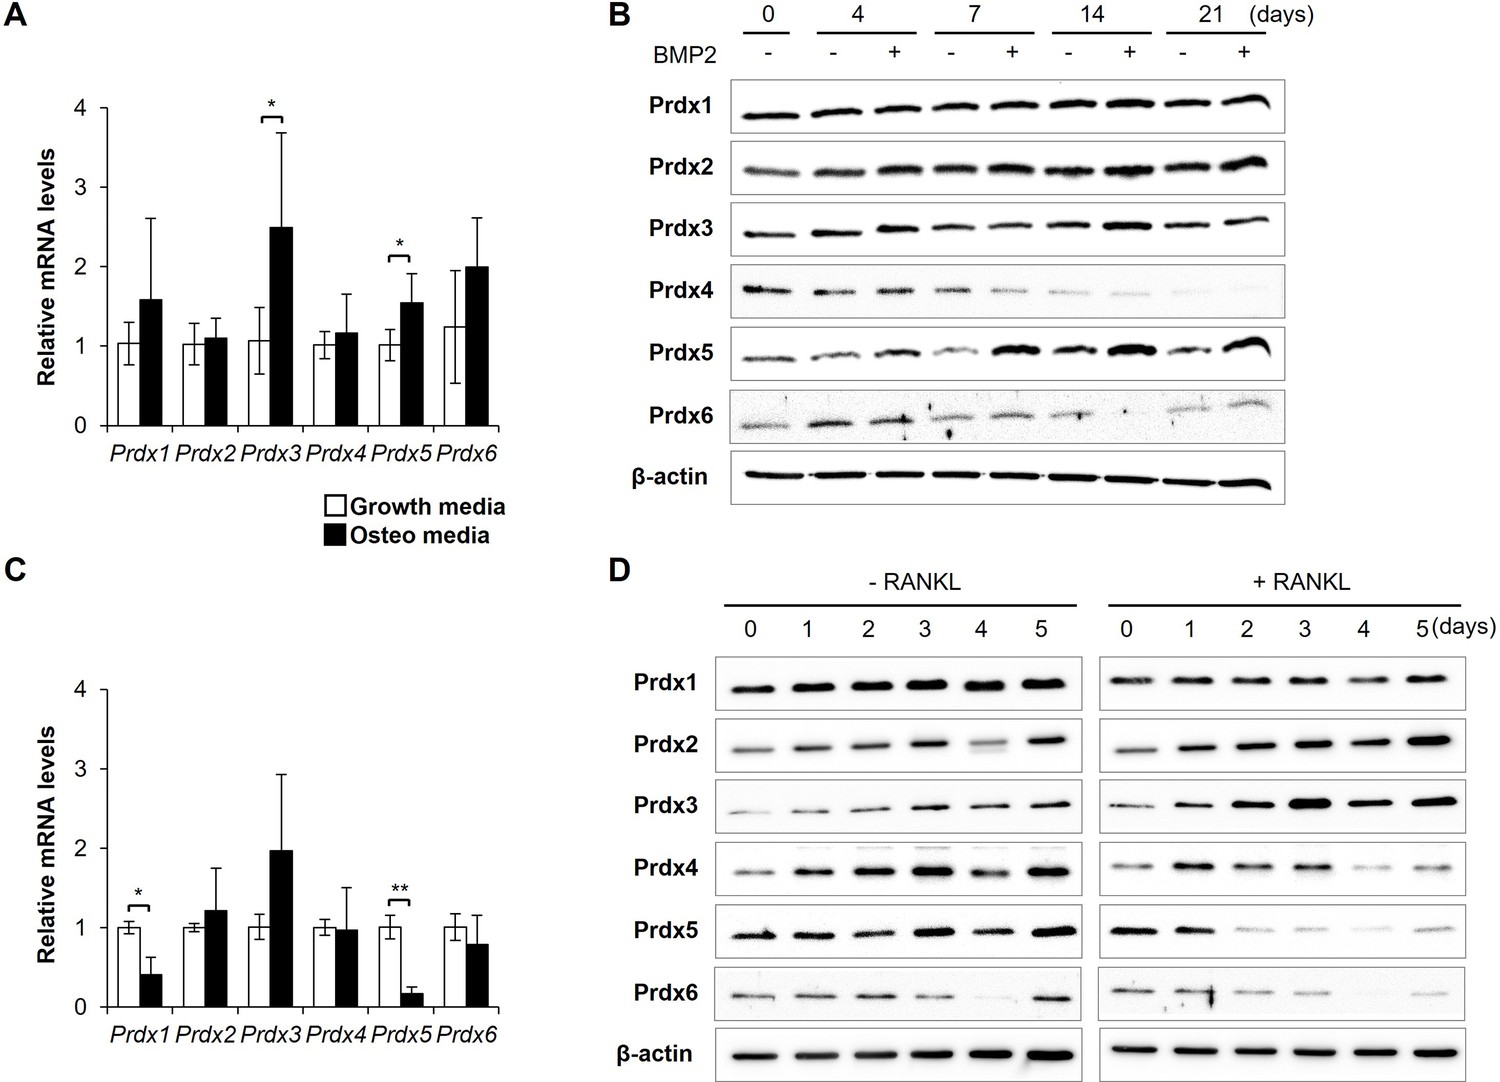
Peroxiredoxin 5 (Prdx5) expression is controlled during bone cell differentiation.
(A) mRNA expression of Prdxs was determined in osteoblasts, using quantitative reverse transcription-PCR (qRT-PCR), on day 7 after bone morphogenic protein 2 (BMP2) stimulation. (B) Protein levels of Prdxs in osteoblasts were determined via western blotting. (C) mRNA levels of Prdxs were determined in osteoclasts on day 3 after receptor activator of nuclear factor kappa-B ligand (RANKL) stimulation. (D) Protein levels of Prdxs in osteoclasts were determined using western blotting. Growth media comprised only serum. Osteo-media comprised either BMP2 (A, B) or RANKL (C, D) for osteoclasts and osteoblasts, respectively. Graph depicts mean ± SD. *p<0.05, **p<0.01 via an unpaired two-tailed Student’s t-test between growth media vs. osteo-media samples (n=3).
-
Figure 1—source data 1
Full blots for Figure 1B and D.
- https://cdn.elifesciences.org/articles/80122/elife-80122-fig1-data1-v1.docx
-
Figure 1—source data 2
Original blots for Figure 1B and D.
- https://cdn.elifesciences.org/articles/80122/elife-80122-fig1-data2-v1.zip
Figure 2 with 3 supplements
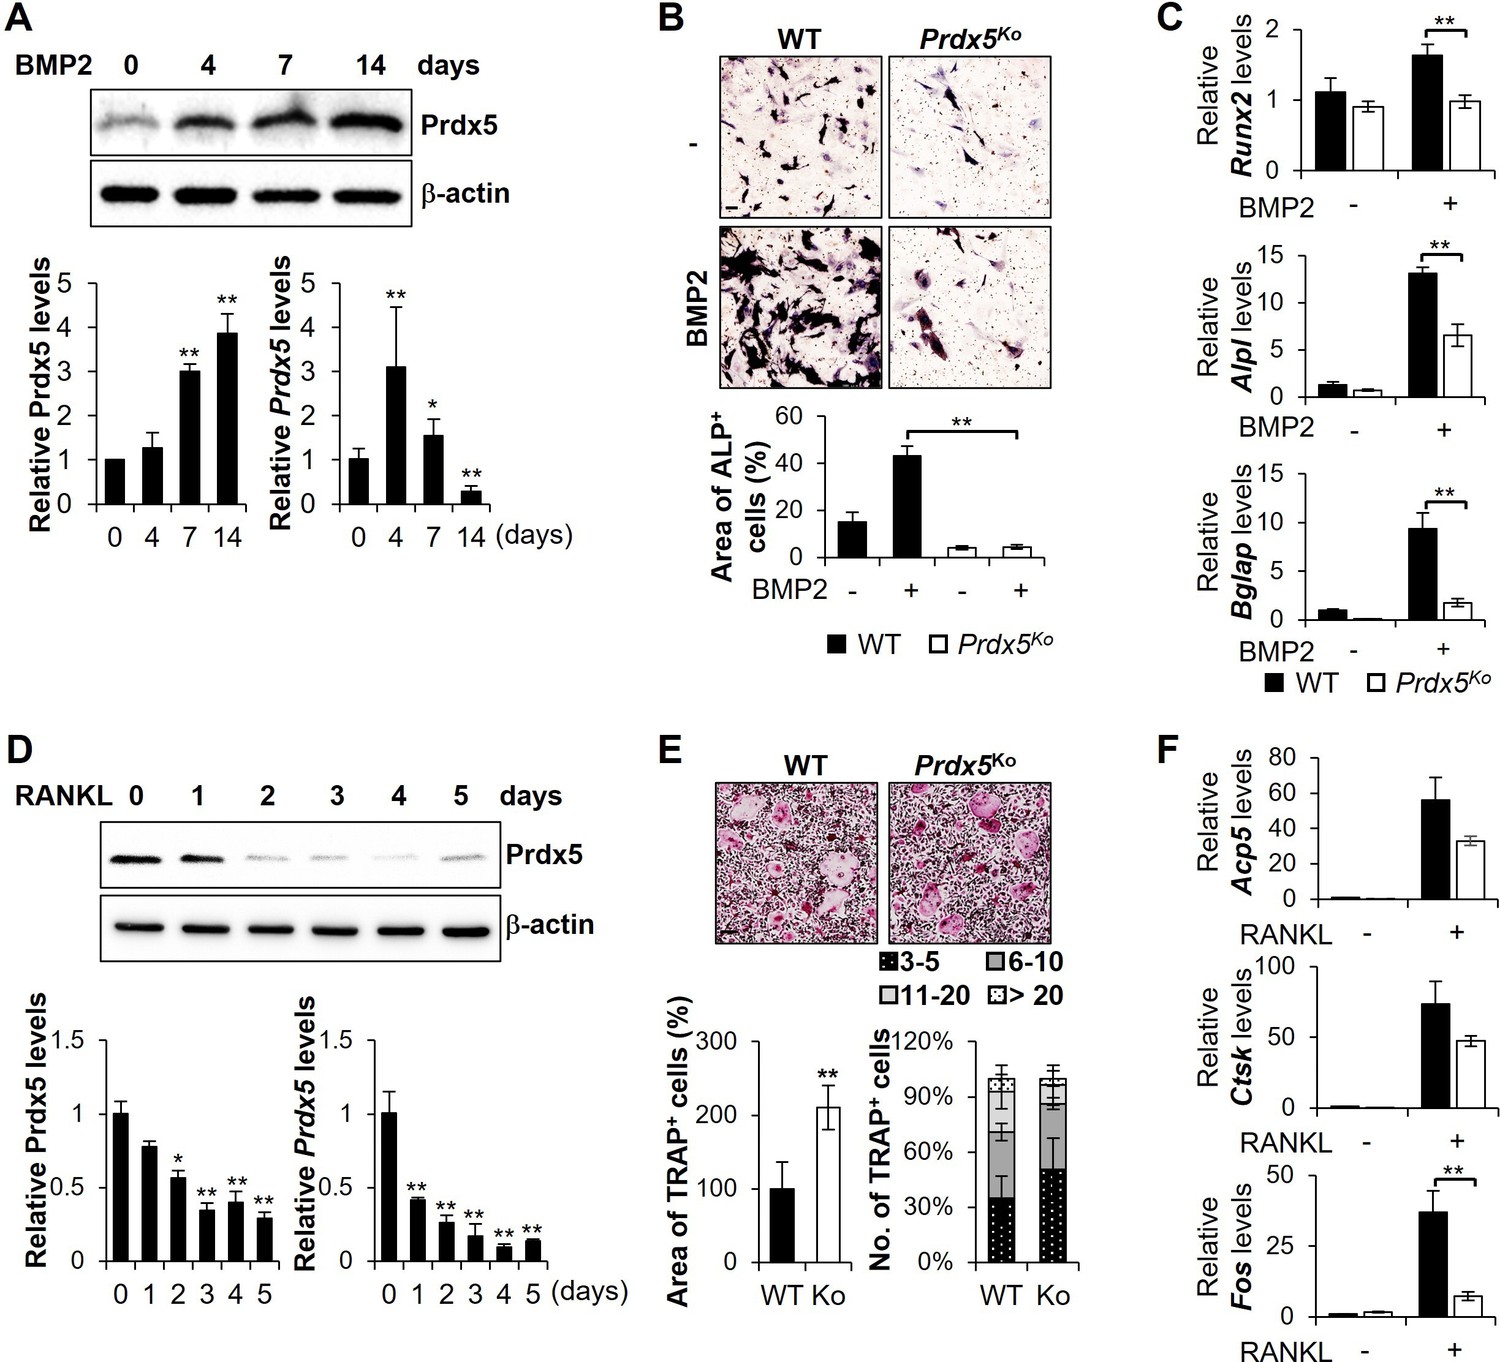
Abnormal expression of peroxiredoxin 5 (Prdx5) modulates osteoblastogenesis and osteoclastogenesis in vitro.
(A, B, C) Mouse calvaria-derived pre-osteoblasts were differentiated into osteoblasts through bone morphogenic protein 2 (BMP2) stimulation for indicated time periods. (A) Western blotting (upper and left bottom) and quantitative reverse transcription-PCR (qRT-PCR) (right bottom) were performed to determine Prdx5 expression during osteoblastogenesis. (B) Pre-osteoblasts were isolated from wild-type (WT) and Prdx5Ko mice and then differentiated into osteoblasts for 7 days. Alkaline phosphatase (ALP) staining was performed to determine the osteoblasts, and the area of ALP-positive cells was measured using the ImageJ software. (C) qRT-PCR was performed to determine osteogenic gene expression on day 7. (D, E, F) Bone marrow-derived macrophages (BMMs) were differentiated into osteoclasts through macrophage colony-stimulating factor (M-CSF) and receptor activator of nuclear factor kappa-B ligand (RANKL) stimulation for indicated time periods. (D) Western blotting (upper and left bottom) and qRT-PCR (right bottom) were performed to determine Prdx5 expression during osteoclastogenesis. (E) BMMs were isolated from WT and Prdx5Ko mice and then differentiated into osteoclasts for 4 days. Tartrate-resistant acid phosphatase (TRAP) staining was performed to determine the osteoclasts. The area of TRAP-positive cells was measured, and the number of multinucleated cells harboring the indicated nuclei was counted. (F) qRT-PCR was performed to determine the expression of osteoclast-related genes. Graph depicts mean ± SEM. *p<0.05, **p <0.01 via an unpaired two-tailed Student’s t-test compared to control (0) or WT.
-
Figure 2—source data 1
Full blots for Figure 2A and D.
- https://cdn.elifesciences.org/articles/80122/elife-80122-fig2-data1-v1.docx
-
Figure 2—source data 2
Original blots for Figure 2A and D.
- https://cdn.elifesciences.org/articles/80122/elife-80122-fig2-data2-v1.zip
Figure 2—figure supplement 1
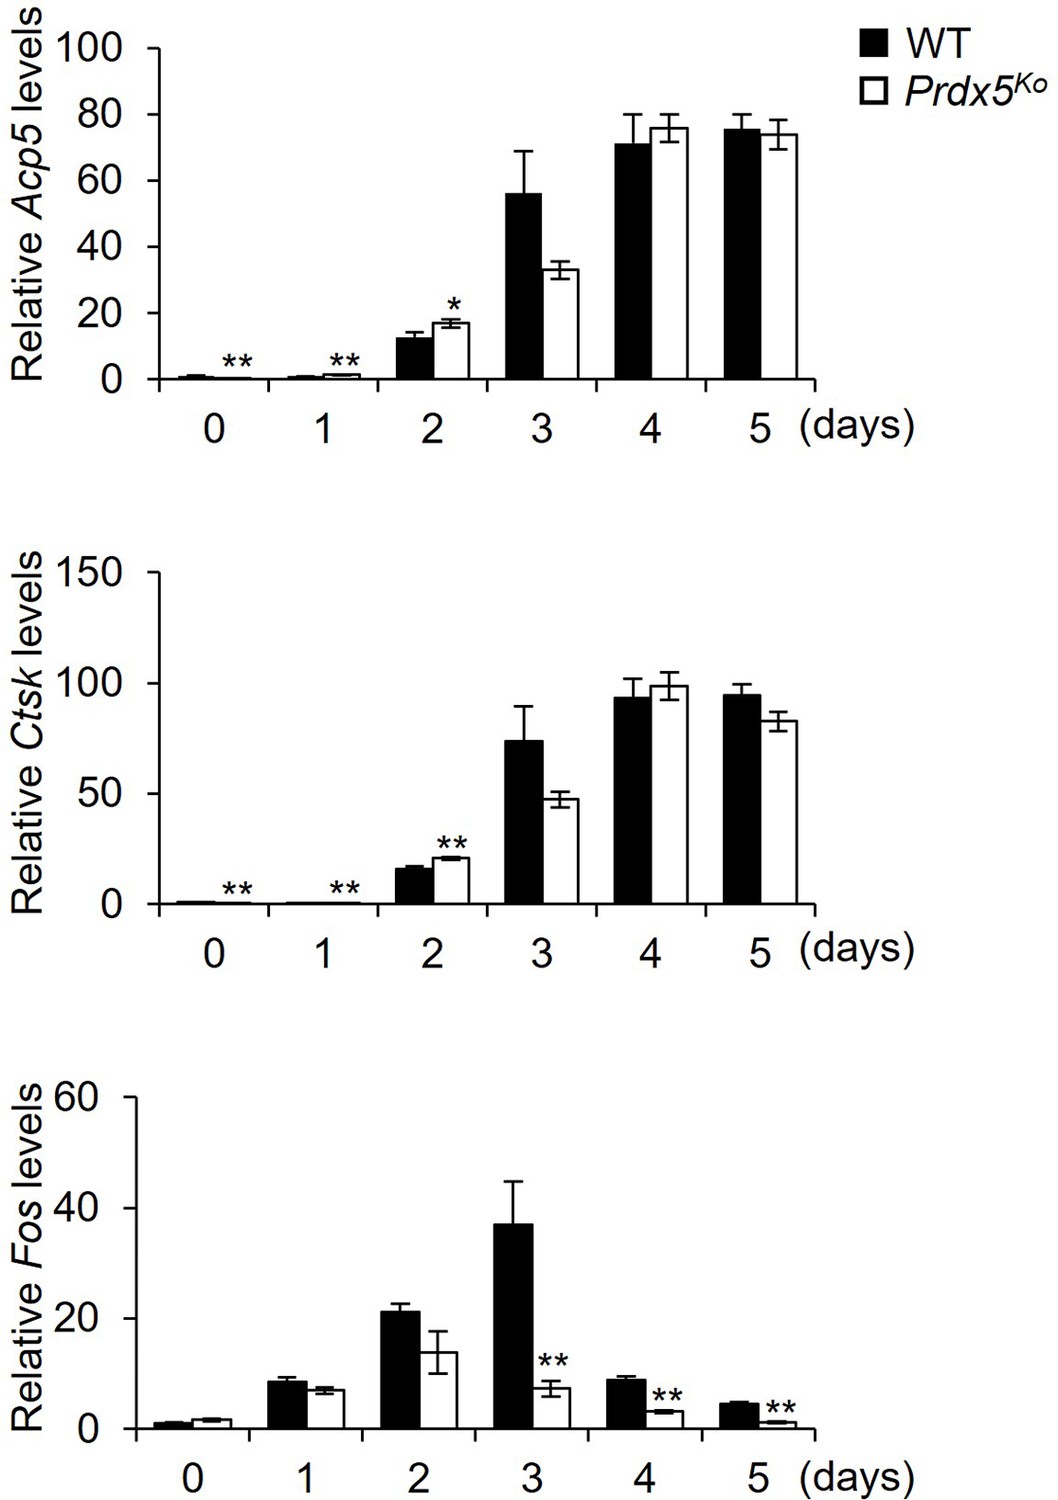
Quantitative reverse transcription-PCR (qRT-PCR) was performed to determine the expression of osteoclast-related genes during osteoclastogenesis.
Graph depicts mean ± SEM. *p<0.05, **p <0.01 via an unpaired two-tailed Student’s t-test compared to control (0).
Figure 2—figure supplement 2
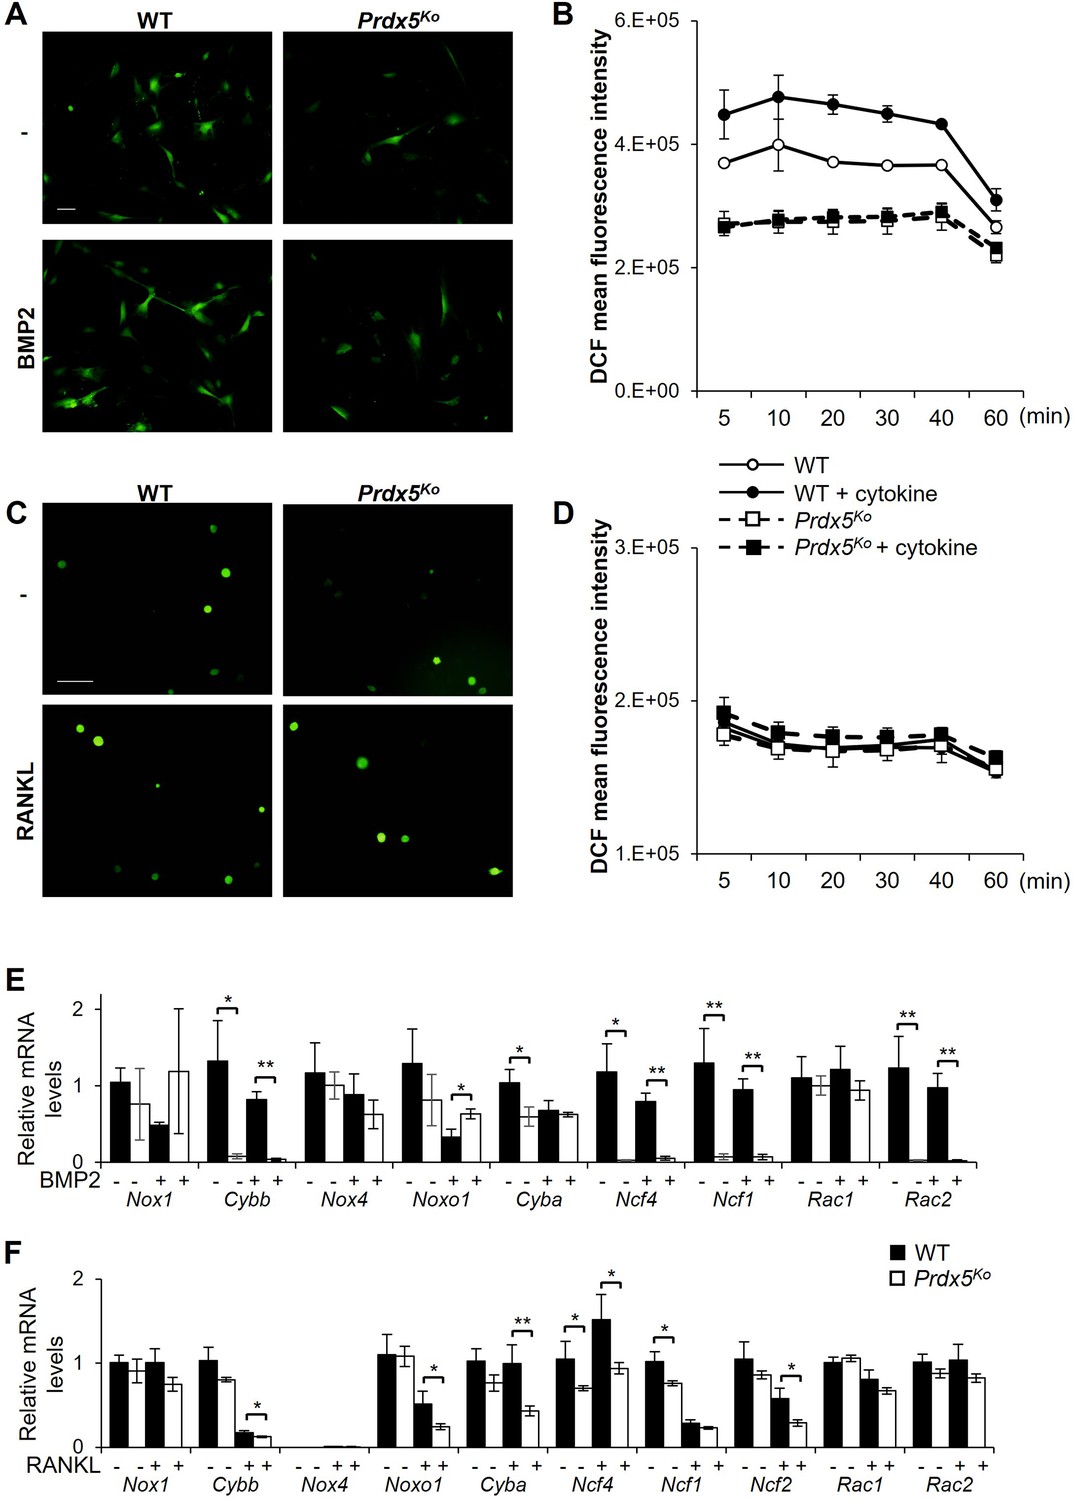
Reactive oxygen species (ROS) levels are not altered in peroxiredoxin 5 (Prdx5)-deficient osteoblasts.
(A) Cellular ROS levels were measured via DCF (2’, 7’-Dichlorofluorescein diacetate) fluorescence. The images were captured after 20 min of bone morphogenic protein 2 (BMP2) stimulation of osteoblasts. Scale bar, 100 µm. (B) ROS levels were measured at indicated time periods after BMP2 stimulation. (C) Cellular ROS levels were measured after receptor activator of nuclear factor kappa-B ligand (RANKL) stimulation in osteoclasts. Scale bar, 100 µm. (D) ROS levels were measured at indicated times after RANKL stimulation. (E) Noxs and their subunits’ mRNA levels were determined in wild-type (WT) and Prdx5Ko osteoblasts by BMP2 stimulation for 7 days. (F) Noxs and their subunit’s mRNA levels were determined in WT and Prdx5Ko osteoclasts by RANKL stimulation for 3 days (n=3). Graph depicts mean ± SEM. *p<0.05, **p <0.01 via an unpaired two-tailed Student’s t-test compared to WT.
Figure 2—figure supplement 3
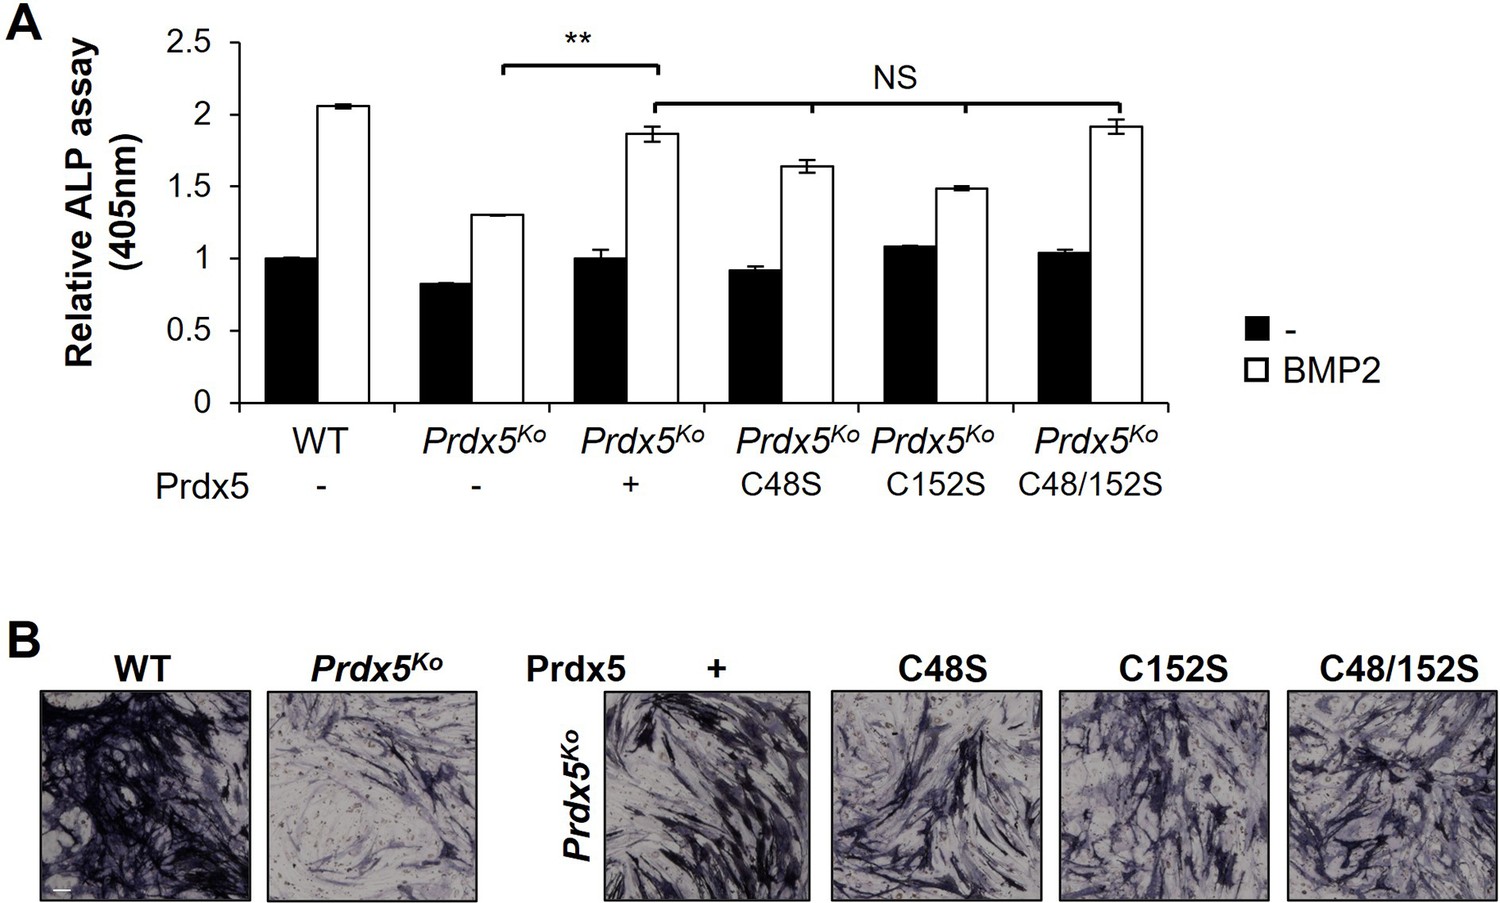
Osteoblast differentiation is not altered by peroxiredoxin 5 (Prdx5) cysteine mutants.
Prdx5-wild-type (WT) or Prdx5-cysteine mutants (C48S, C152S, or C48/152S) were transfected into the osteoblast precursors from Prdx5Ko mice, and then differentiated into osteoblasts by bone morphogenic protein 2 (BMP2) stimulation. After 7 days, differentiation was measured by alkaline phosphatase (ALP) assays (A) and ALP staining (B). ALP staining represents BMP2-induced osteoblasts (n=3, scale bar, 100 µm). Graph depicts mean ± SD. **p <0.01 via an unpaired two-tailed Student’s t-test.
Figure 3 with 2 supplements

Prdx5Ko male mice show enhanced osteoporotic phenotypes.
(A) Micro-CT images of femurs from 12-week-old wild-type (WT) and Prdx5Ko male mice. (B) Micro-CT data were quantified (n=15–19). BMD, bone mineral density; BV/TV, bone volume relative to total tissue volume; Tb. V, trabecular volume; Tb. Th, trabecular bone thickness; Tb. N, trabecular bone number; Tb. Sp, trabecular bone space. (C) Quantitative analysis of the levels of receptor activator of nuclear factor kappa-B ligand (RANKL), osteoprotegerin (OPG), and bone morphogenic protein 2 (BMP2) in the sera from WT and Prdx5Ko male mice at 12 weeks (n=4–8). (D) Representative tartrate-resistant acid phosphatase (TRAP) and alkaline phosphatase (ALP) staining images of the mouse femora. TRAP- or ALP-positive cells were stained as purple, and the bone was counterstained with Fast Green as blue. Scale bar, 100 µm. (E) Quantification of the TRAP- or ALP-positive cells shown in (D) (n=6–10). Graph depicts mean ± SEM. *p<0.05, **p <0.01 via an unpaired two-tailed Student’s t-test compared to WT.
Figure 3—figure supplement 1
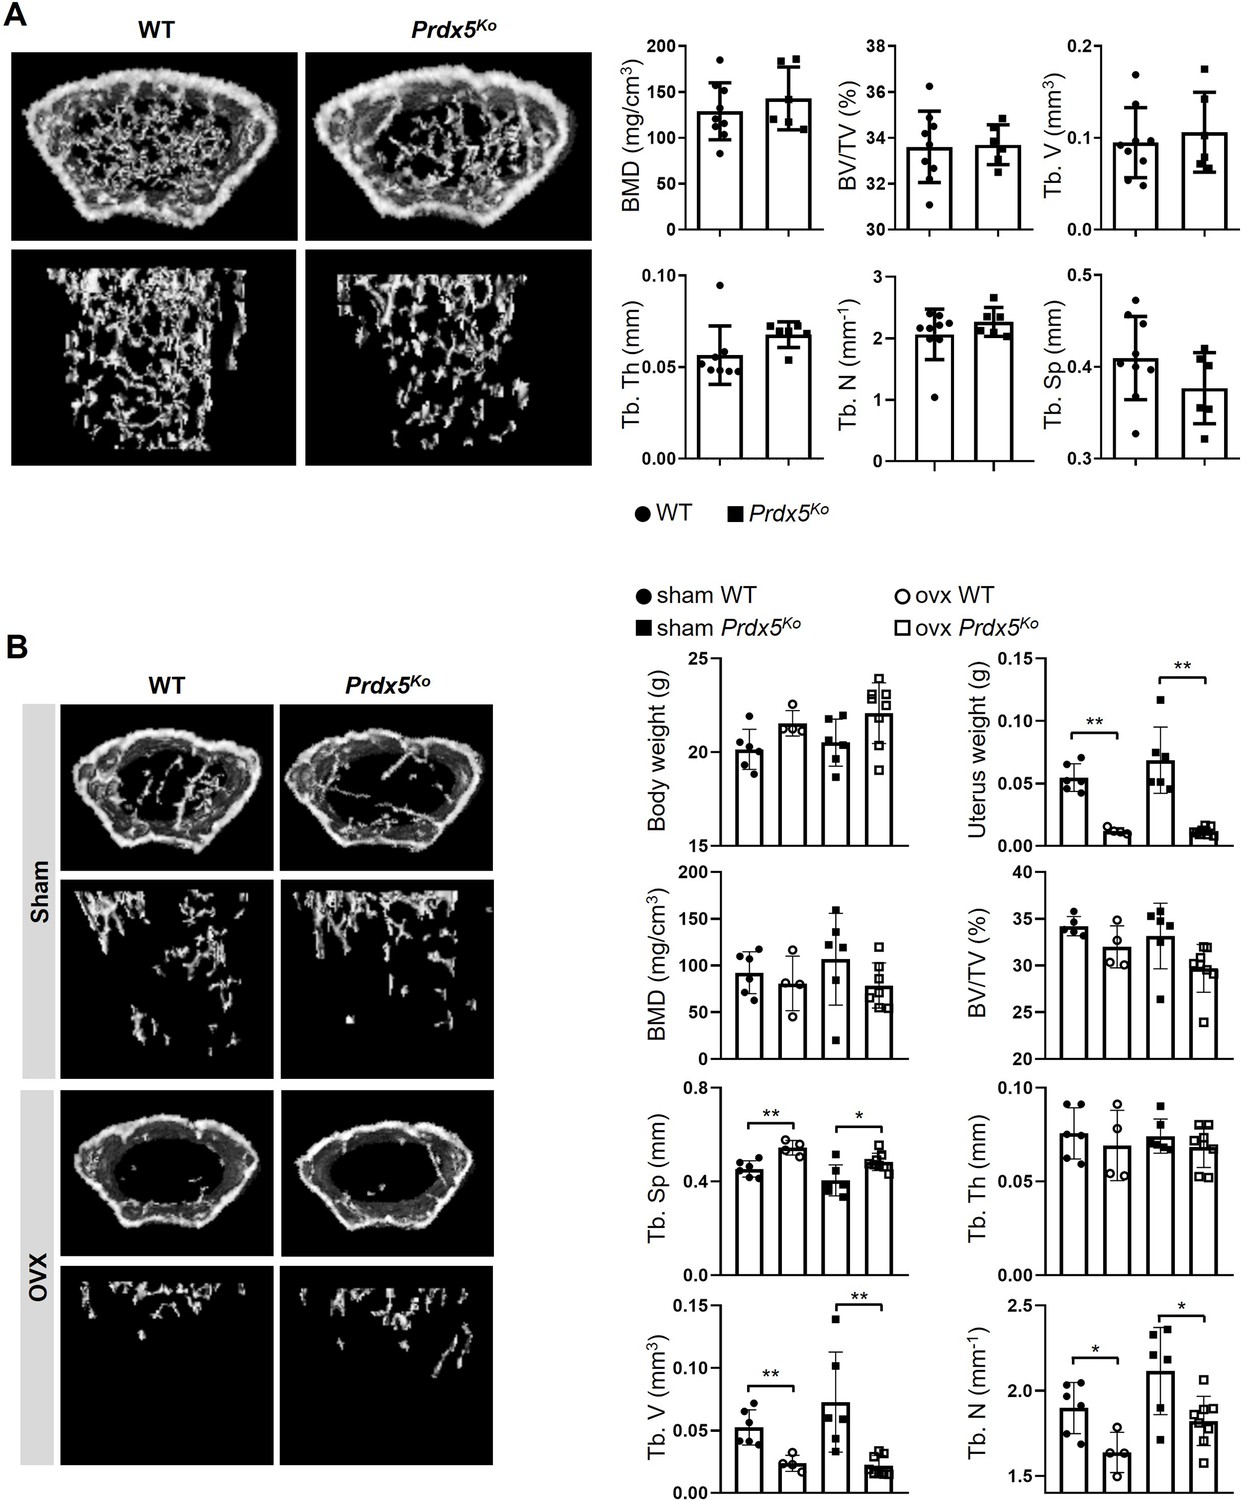
Female mice show normal phenotypes.
(A) Micro-CT images of femurs from wild-type (WT) and Prdx5Ko mice at 12 weeks. Micro-CT data were quantified (n=6–9). BMD, bone mineral density; BV/TV, bone volume relative to total tissue volume; Tb. V, trabecular volume; Tb. Th, trabecular bone thickness; Tb. N, trabecular bone number; Tb. Sp, trabecular bone space. (B) Ovariectomy-induced osteoporosis mouse model (OVX) or sham surgery was performed on 10-week-old females that were sacrificed after 4 weeks for micro-CT analysis (n=4–8). Graph depicts mean ± SEM. *p<0.05, **p <0.01 via an unpaired two-tailed Student’s t-test.
Figure 3—figure supplement 2
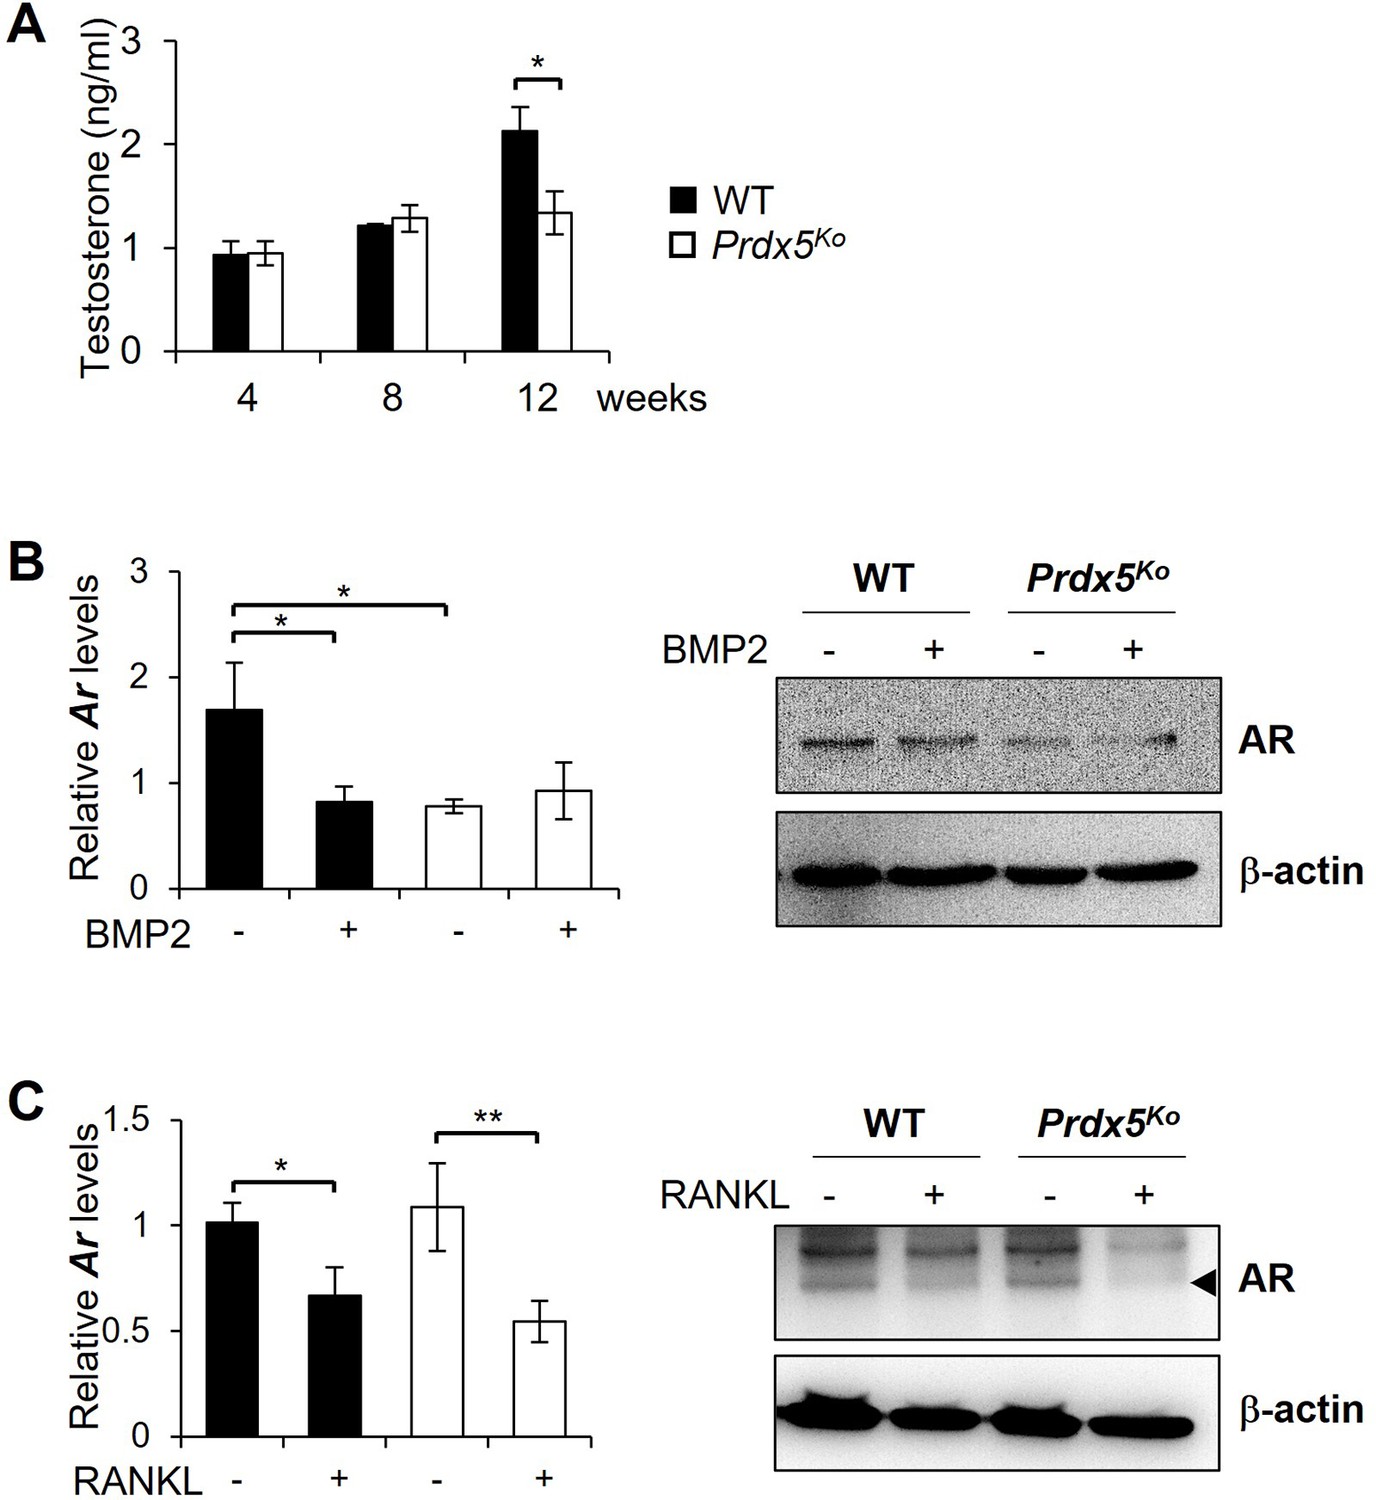
Testosterone and androgen receptor (AR) expression levels are suppressed in Prdx5Ko male mice.
(A) Quantitative analysis of the levels of testosterone in the sera from 4-, 8-, and 12-week-old male mice (n=3–10). mRNA (left graphs) and protein levels (right figures) of AR were determined in osteoblasts stimulated with bone morphogenic protein 2 (BMP2) for 7 days (B), and osteoclasts stimulated with receptor activator of nuclear factor kappa-B ligand (RANKL) for 3 days (C). Graph depicts mean ± SEM. *p<0.05, **p <0.01 via an unpaired two-tailed Student’s t-test.
-
Figure 3—figure supplement 2—source data 1
Full blots for Figure 3—figure supplement 2B and C.
- https://cdn.elifesciences.org/articles/80122/elife-80122-fig3-figsupp2-data1-v1.docx
-
Figure 3—figure supplement 2—source data 2
Original blots for Figure 3—figure supplement 2B and C.
- https://cdn.elifesciences.org/articles/80122/elife-80122-fig3-figsupp2-data2-v1.zip
Figure 4 with 1 supplement
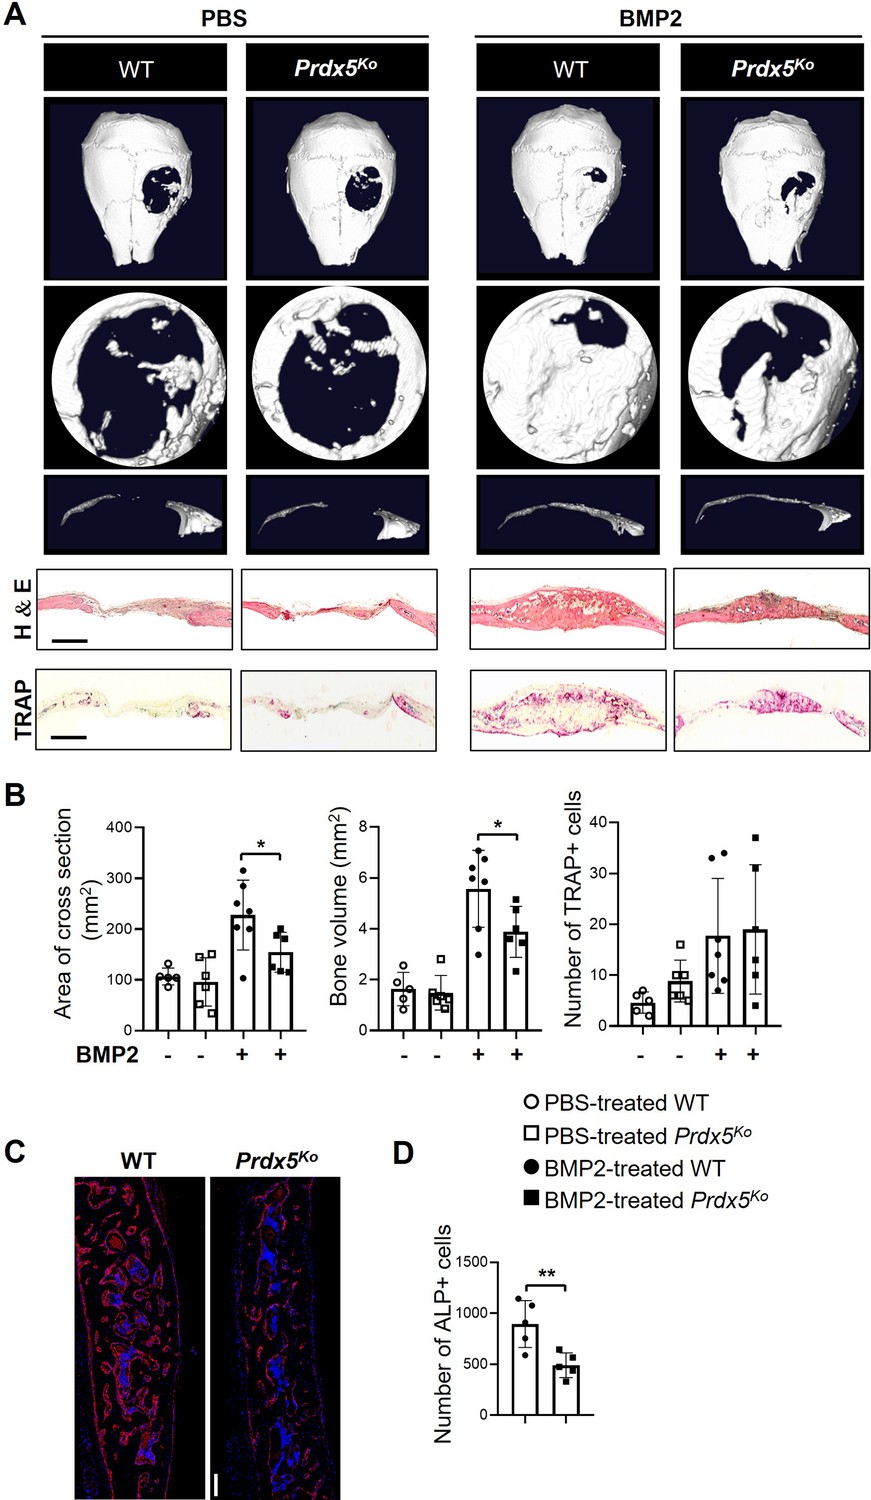
Prdx5Ko male mice show reduced bone healing after bone morphogenic protein 2 (BMP2) induction.
(A) Representative micro-CT images of the calvarial defect model after 3 weeks of implantation with phosphate-buffered saline (PBS)- or BMP2-containing sponges. The representative images show various shapes: whole (top), the hole from each image (middle), and the cross-section (bottom) from each hole. Representative hematoxylin–eosin and tartrate-resistant acid phosphatase (TRAP) staining images of the calvarial bone section from each group. Scale bar, 1000 μM. (B) Measurement of the cross-sectional area, new bone formation, and number of TRAP-positive cells at the calvarial defect site (n=5–7). (C) Representative images of alkaline phosphatase (ALP) staining (scale bar, 100 μM) and (D) quantification of the number of ALP-positive cells of C (n=5). ALP-positive cells were stained red, while DAPI-positive cells were counterstained blue. Graph depicts mean ± SEM. *p<0.05, **p <0.01 via an unpaired two-tailed Student’s t-test.
Figure 4—figure supplement 1
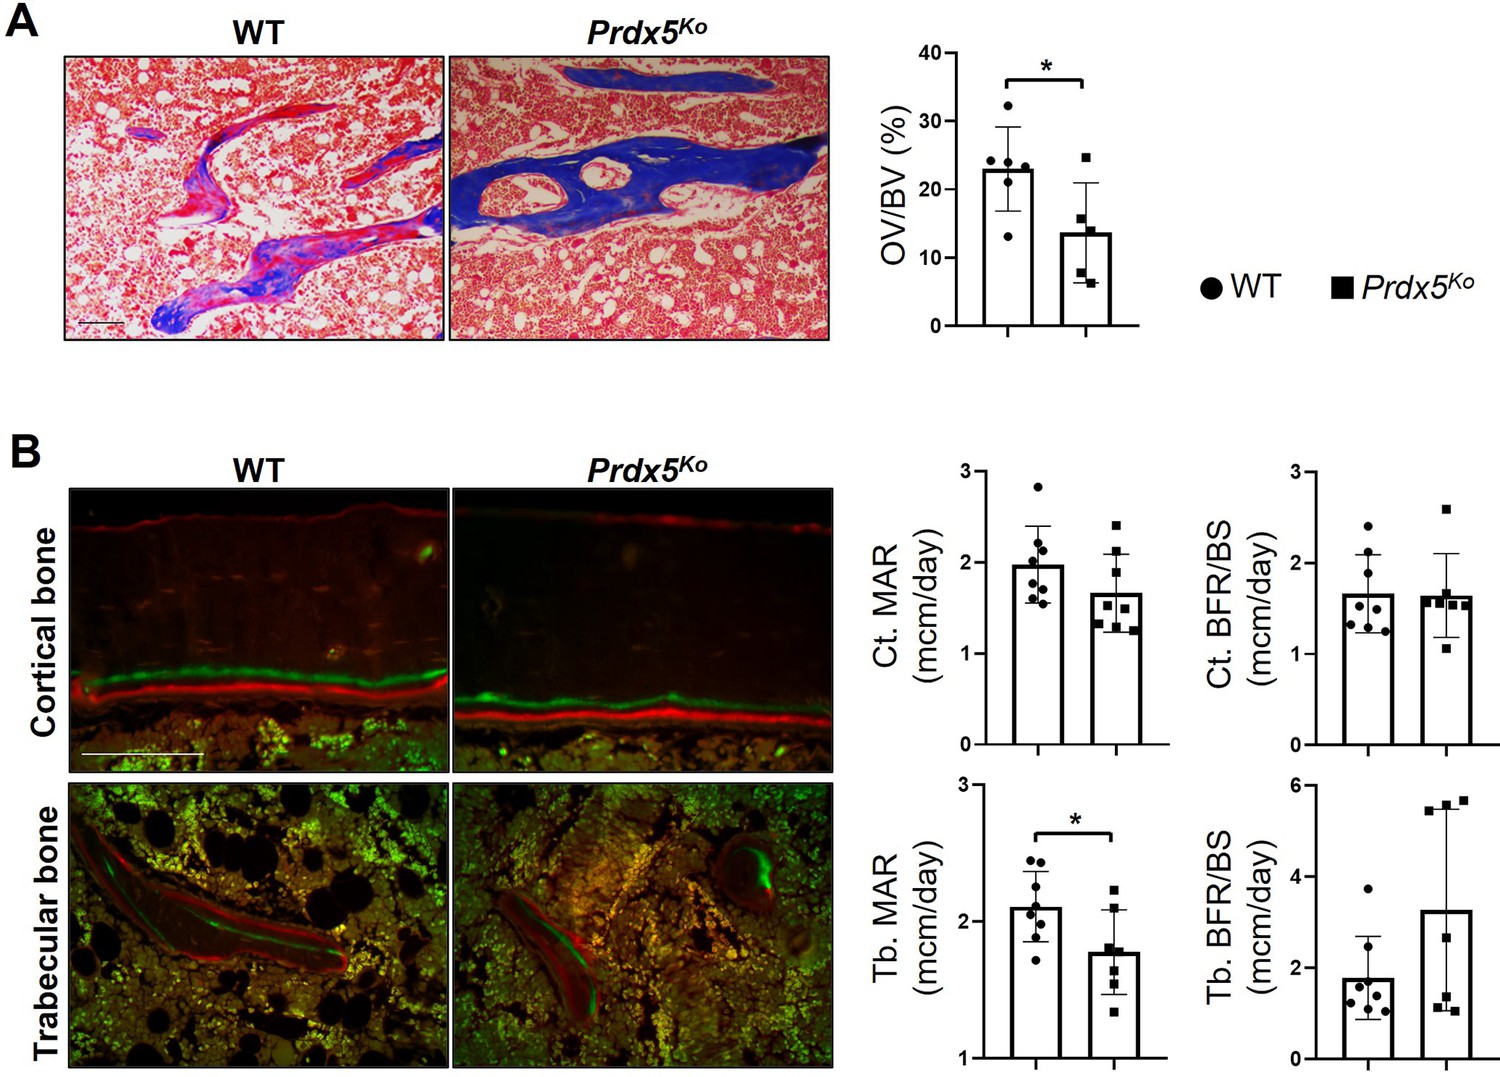
Prdx5Ko male mice show reduced bone turnover.
(A) Differential staining of the bone (blue) and osteoid (red in bone) was performed using Goldner’s trichrome method. The ratio of osteoid volume/bone volume (OV/BV) was measured using the Bioquant Osteo program. (B) Bone turnover parameters of the femurs from 8-week-old mice were measured via dynamic bone histomorphometry after serial injections of calcein and Alizarin Red S. . MAR: mineral apposition rate; BFR/BS: bone formation rate per bone surface (n=5–7). Data are presented as mean ± SEM. *p<0.05, **p <0.01 via an unpaired two-tailed Student’s t-test.
Figure 5 with 1 supplement
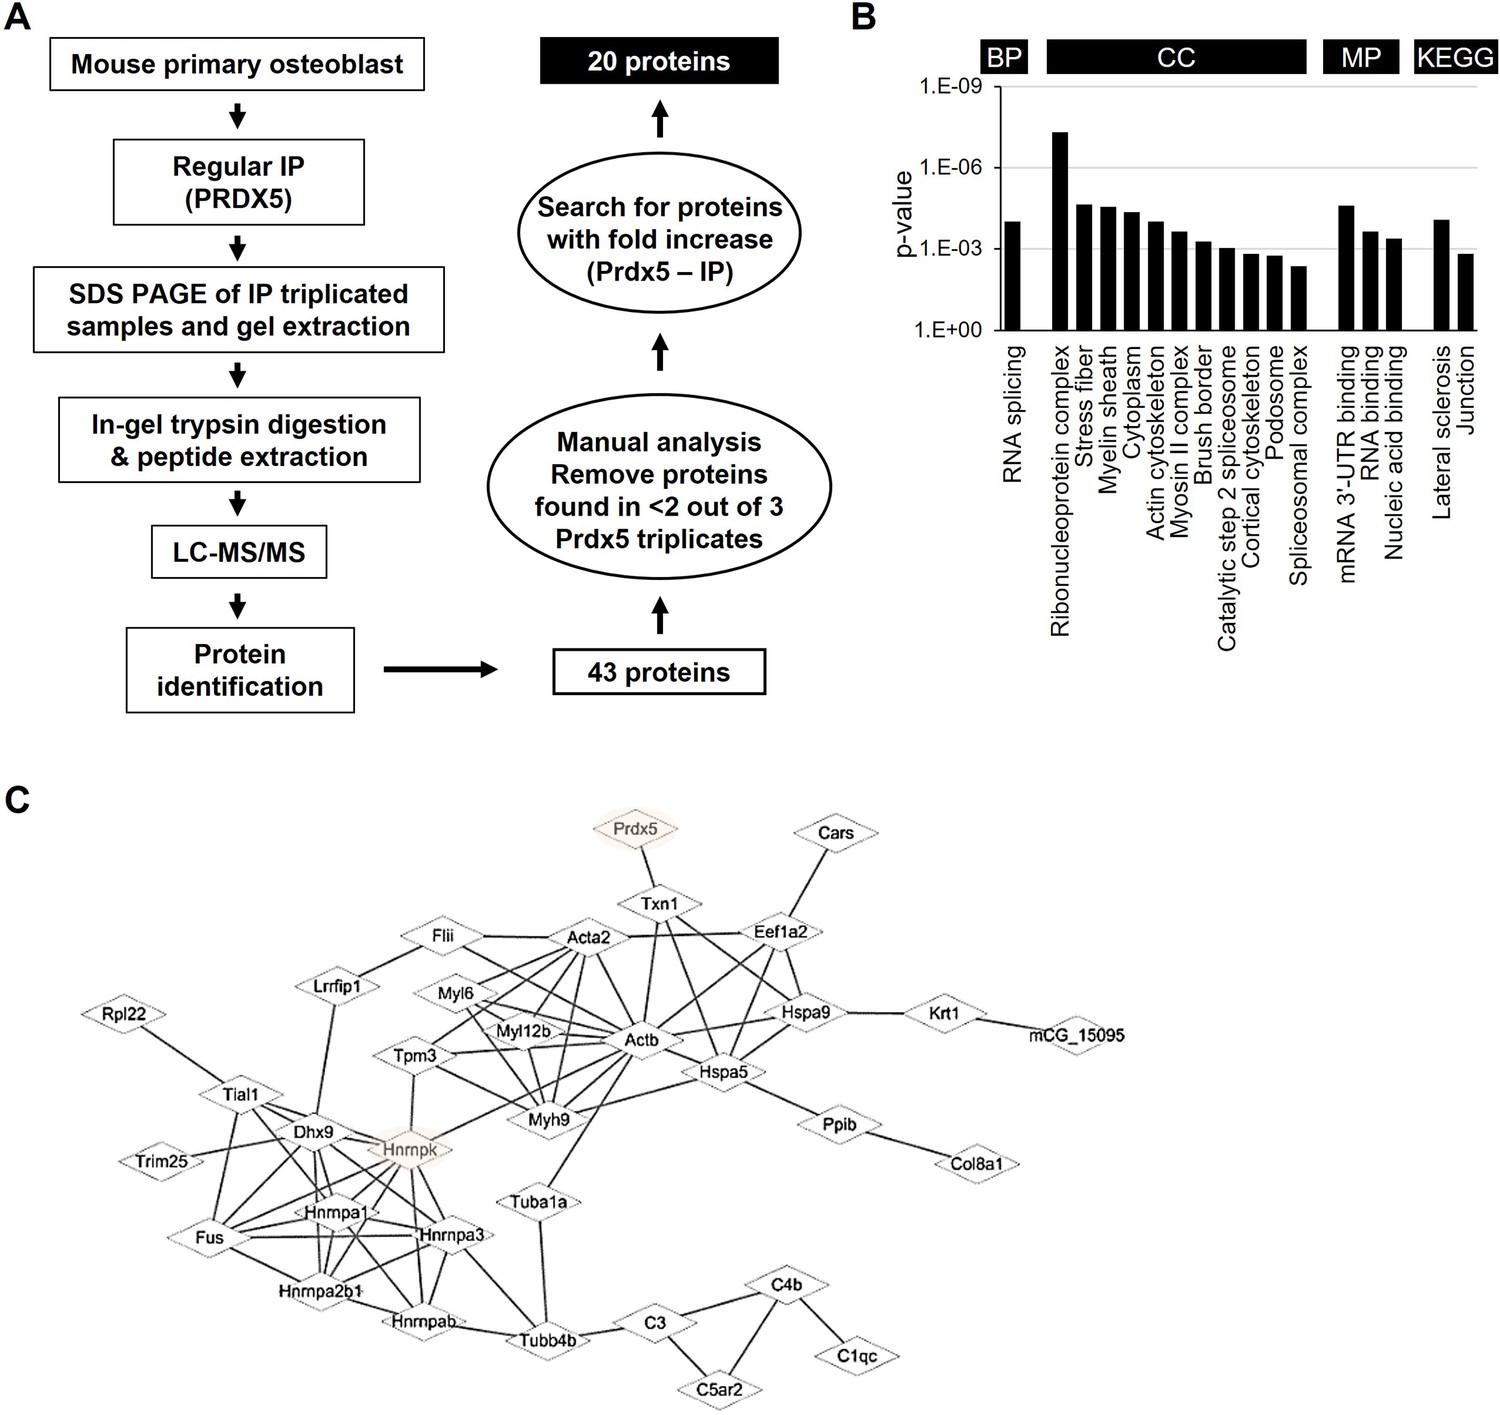
Identification of peroxiredoxin 5 (Prdx5)-interacting proteins during osteoblast differentiation.
(A) Schematic representation of the experimental design of immunoprecipitation (IP) and liquid chromatography combined with tandem mass spectrometry (LC–MS/MS). Total 20 proteins were identified as potential candidates binding to Prdx5 in osteoclasts. (B) Gene ontology (GO) analysis results with 43 proteins are shown by biological process (BP), cellular component (CC), molecular function (MF), and Kyoto encyclopedia of genes and genomes (KEGG). (C) The interaction of Prdx5 with the 43 proteins identified in the MS/MS analysis was constructed using the STRING database.
Figure 5—figure supplement 1
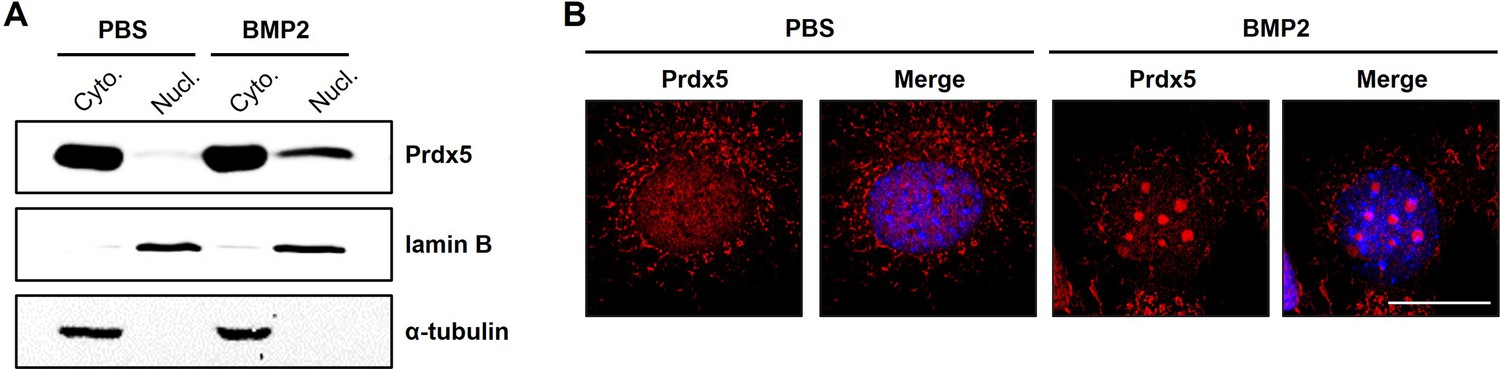
Bone morphogenic protein 2 (BMP2) induces nuclear translocation of peroxiredoxin 5 (Prdx5).
(A) Western blot analysis of Prdx5 in the cytoplasmic and nuclear fractions of osteoblasts treated with BMP2 for 4 days. (B) Fixed osteoblasts after 4 days of BMP2 treatment were stained with an anti-Prdx5 antibody (red) and imaged using confocal microscopy. The nucleus was counterstained in blue, scale bar, 20 μM.
-
Figure 5—figure supplement 1—source data 1
Full blots for Figure 5—figure supplement 1A.
- https://cdn.elifesciences.org/articles/80122/elife-80122-fig5-figsupp1-data1-v1.zip
-
Figure 5—figure supplement 1—source data 2
Original blots for Figure 5—figure supplement 1.
- https://cdn.elifesciences.org/articles/80122/elife-80122-fig5-figsupp1-data2-v1.zip
Figure 6 with 1 supplement
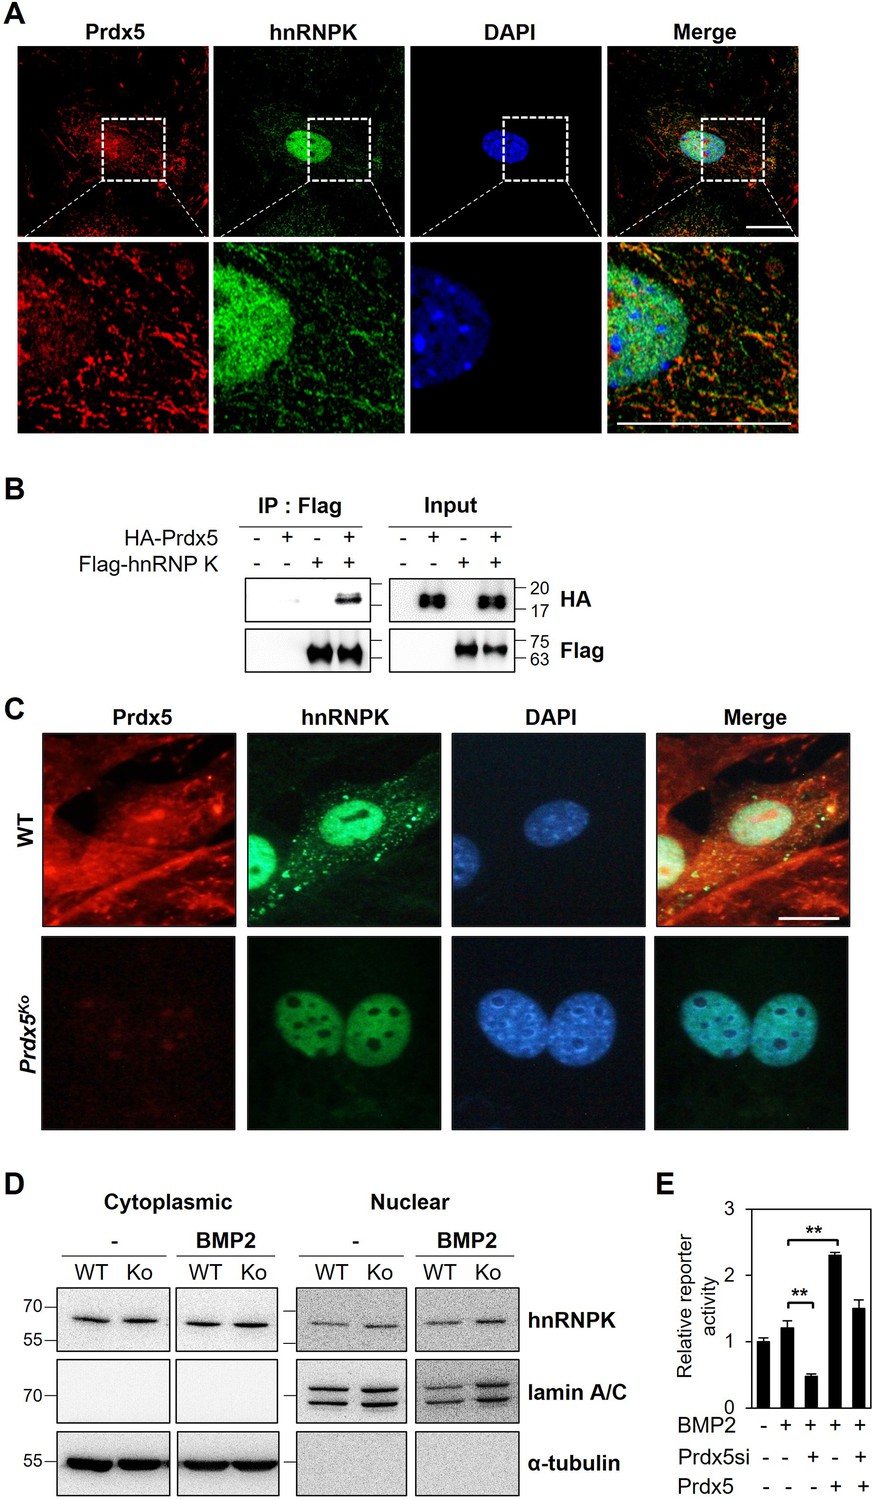
Heterogeneous nuclear ribonucleoprotein K (hnRNPK) interacts with peroxiredoxin 5 (Prdx5) in osteoblasts.
(A) To determine co-localization, osteoblasts were stained with antibodies against Prdx5 and hnRNPK, and images were acquired via confocal microscopy (scale bar, 20 μm). The upper images were magnified as depicted by the dotted box in the lower images. (B) Immunoprecipitation (IP) was performed using HEK293T cells expressing various combinations of HA-tagged Prdx5 and flag-tagged hnRNPK. (C) Osteoblasts were differentiated from the precursors derived from wild-type (WT) and Prdx5Ko mice via bone morphogenic protein 2 (BMP2) treatment for 7 days. hnRNPK localization was analyzed via confocal microscopy (scale bar, 20 µm). (D) hnRNPK levels were determined in the cytoplasmic and nuclear fractions of WT and Prdx5Ko cells. Osteoblasts were harvested on day 7 after BMP2 stimulation. (E) Osteocalcin luciferase assay was performed using MC3T3-E1 cells differentially expressing Prdx5 and BMP2 stimulation. Data are presented as mean ± SD. **p <0.01 via an unpaired two-tailed Student’s t-test.
-
Figure 6—source data 1
Full blots for Figure 6B and D.
- https://cdn.elifesciences.org/articles/80122/elife-80122-fig6-data1-v1.docx
-
Figure 6—source data 2
Original blots for Figure 6B and D.
- https://cdn.elifesciences.org/articles/80122/elife-80122-fig6-data2-v1.zip
Figure 6—figure supplement 1
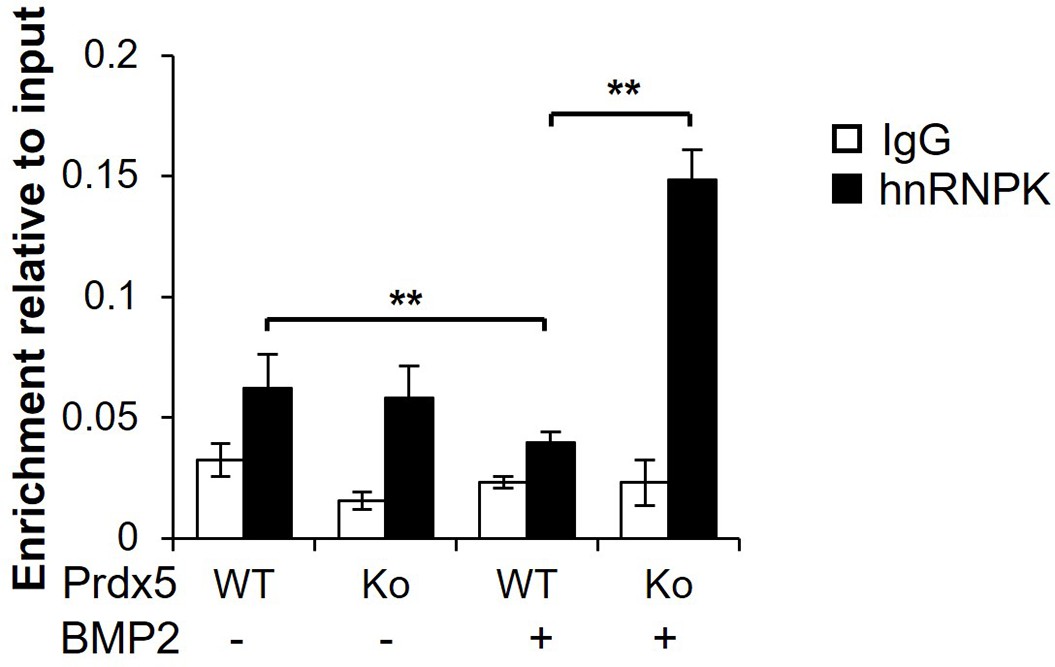
Heterogeneous nuclear ribonucleoprotein K (hnRNPK) accumulation is enhanced in Prdx5Ko osteoblasts.
Binding of hnRNPK to the Bglap promoter in osteoblasts and their precursors from wild-type (WT) and Prdx5Ko mice. Osteoblasts were differentiated by bone morphogenic protein 2 (BMP2) treatment for 7 days (n=3). Data are presented as mean ± SD. **p <0.01 via an unpaired two-tailed Student’s t-test.
Figure 7 with 1 supplement
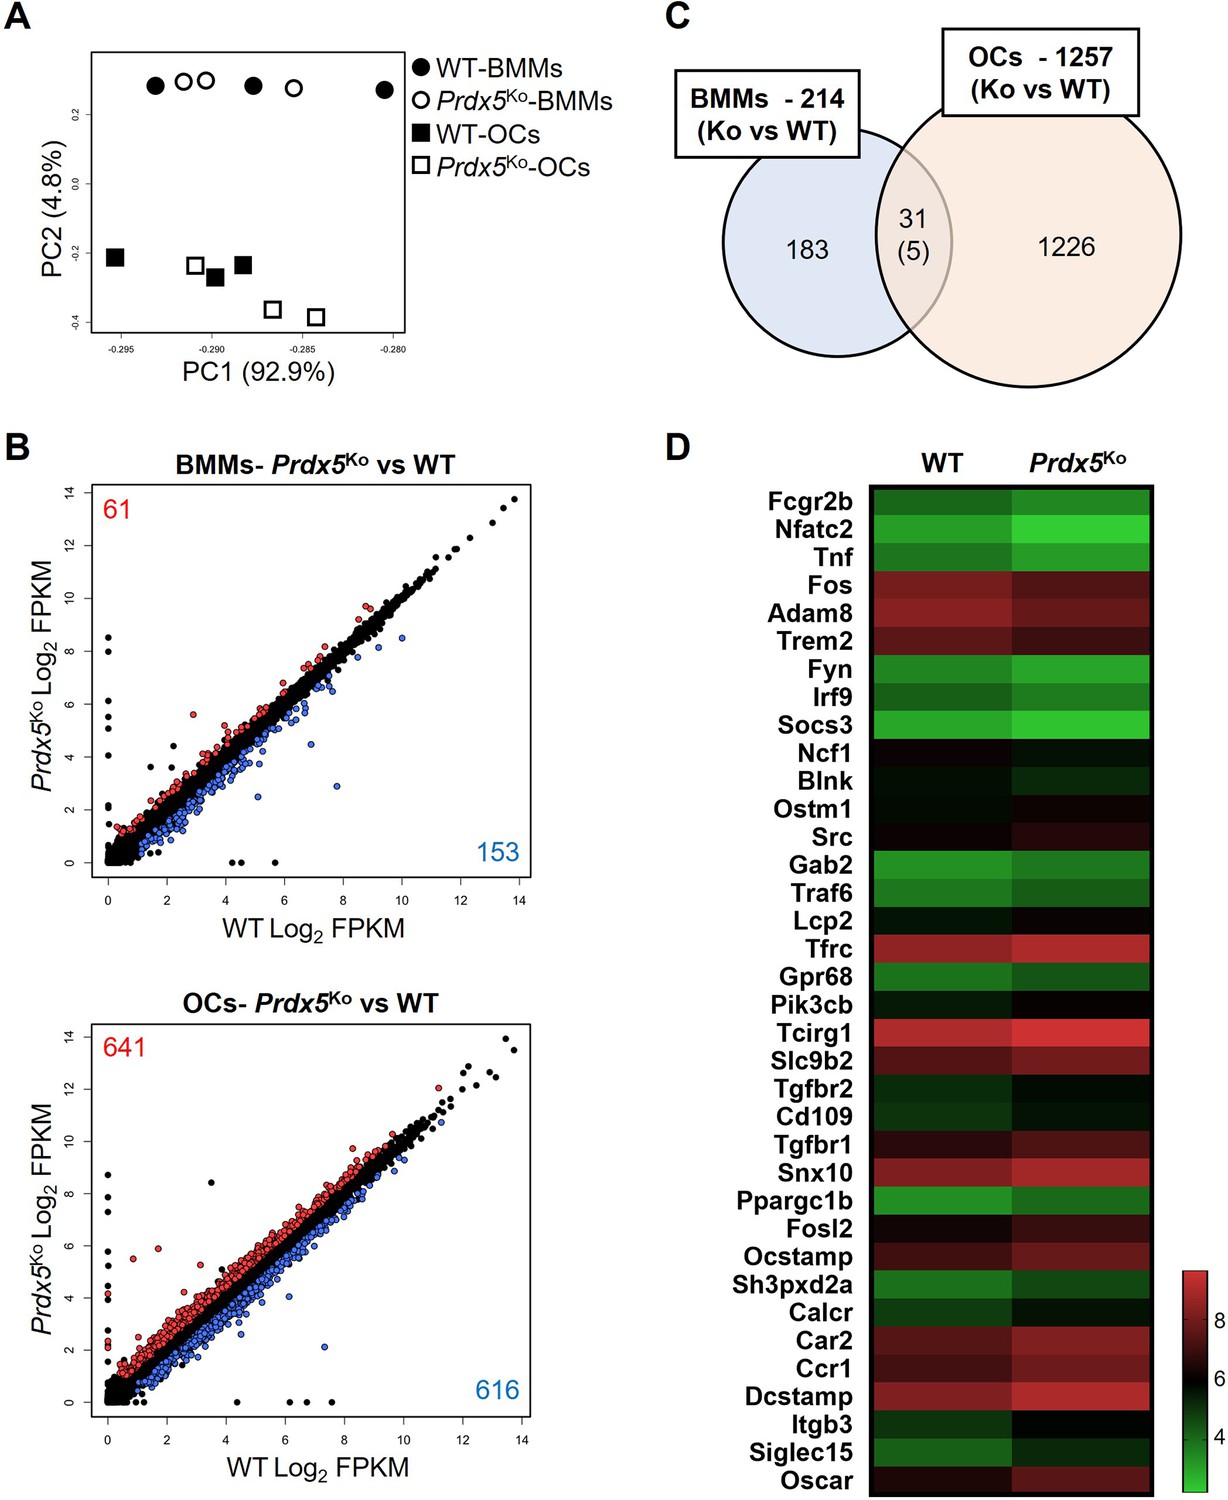
Osteoclast-related genes are highly expressed in peroxiredoxin 5 (Prdx5)-deficient osteoclasts.
(A) Principal component analysis (PCA) of bone marrow-derived macrophages (BMMs) and osteoclasts (OCs) from wild-type (WT) and Prdx5Ko cells. Each circle or square represents the expression profile of one sample (n=3). (B) Differentially expressed genes (DEGs) in BMMs and OCs by comparison of Prdx5Ko versus WT are displayed on a scatter plot. Each dot indicates a single gene. Significantly upregulated DEGs in Prdx5Ko are indicated in red, while downregulated DEGs are indicated in blue (fragment per kilobase of exon per million fragments mapped [FPKM] >1, q-value <0.05). (C) Venn diagram indicates DEGs in BMMs and OCs. A total of 31 DEGs are overlapped in BMMs and OCs, and only five genes show opposite patterns, which are downregulated in Prdx5Ko OCs but upregulated in Prdx5Ko BMMs. (D) Heatmap analysis shows osteoclast-related DEGs. The z-score represents log2 FPKM.
Figure 7—figure supplement 1
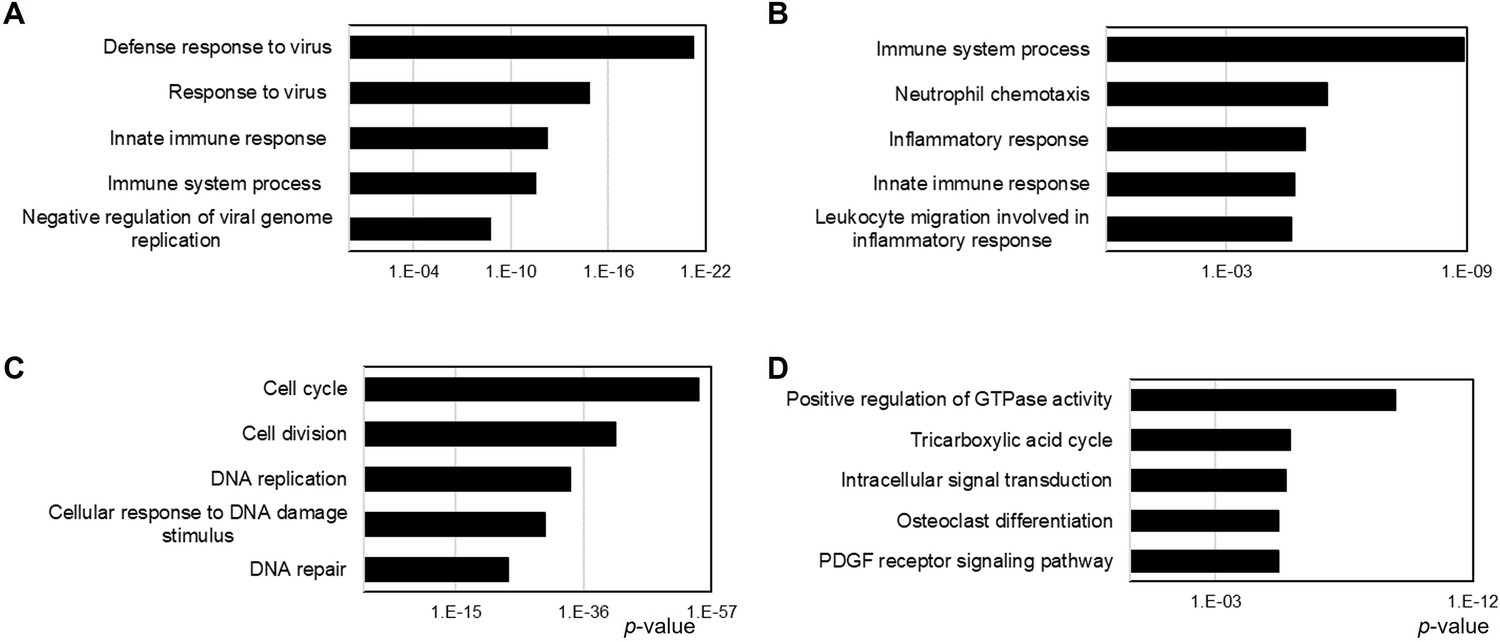
Gene ontology (GO) analysis of differentially expressed genes (DEGs) via RNA-sequencing (RNA-seq) analysis.
(A) Among 214 DEGs in bone marrow-derived macrophages (BMMs), 153 genes were downregulated and (B) 61 genes were upregulated in Prdx5Ko BMMs versus wild type (WT). (C) Among 1257 DEGs in osteoclasts (OCs), 616 genes were downregulated and (D) 641 genes were upregulated in Prdx5Ko OCs versus WT. Each DEG was analyzed by gene ontology (GO) analysis, and top five biological pathways are represented by the p-value (X-axis).
Figure 8
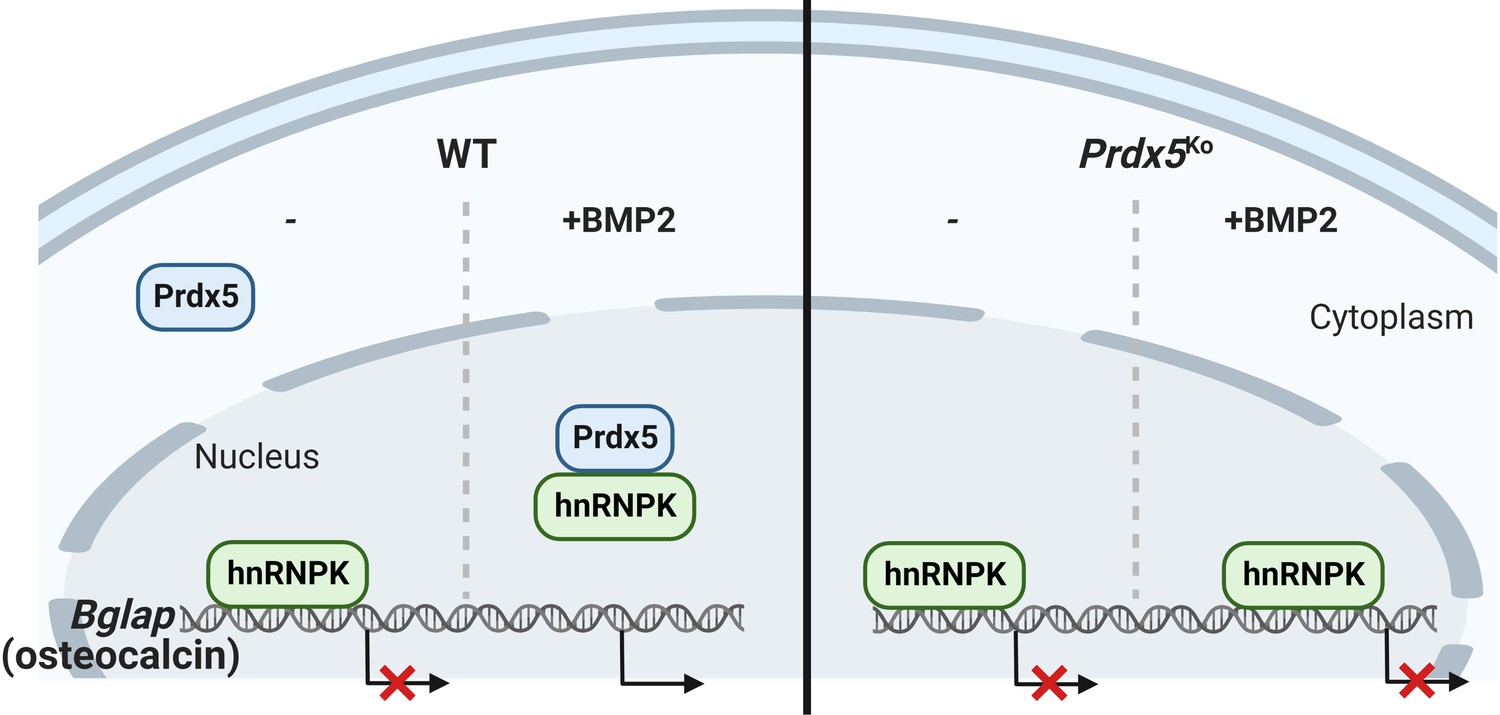
Heterogeneous nuclear ribonucleoprotein K (hnRNPK) accumulates on the Bglap promoter and inhibits its expression in the nucleus without bone morphogenic protein 2 (BMP2) stimulation.
When BMP2 induces peroxiredoxin 5 (Prdx5) translocation into the nucleus, Prdx5 removes hnRNPK from the Bglap promoter by interacting with the latter, followed by osteocalcin transcription.
Tables
Table 1
Forty-three peroxiredoxin 5 (Prdx5)-interacting proteins identified via liquid chromatography with tandem mass spectrometry (LC–MS/MS) analysis.
| Accessions | Description | Gene | Localization | Mol% | |||||
|---|---|---|---|---|---|---|---|---|---|
| CTRL_1 | CTRL_2 | CTRL_3 | BMP2_1 | BMP2_2 | BMP2_3 | ||||
| P99029 | Peroxiredoxin-5, mitochondrial | Prdx5 | Cytoplasm | 39.2 | 56.8 | 48.88 | 34.58 | 30.27 | 31.835 |
| Q6ZWQ9 | MCG5400 | Myl12b | Cytoplasm | 5.799 | 7.595 | ||||
| P62737 | Actin, aortic smooth muscle | Acta2 | Cytoplasm | 7.174 | 6.615 | ||||
| P10639 | Thioredoxin | Txn | Cytoplasm | 3.156 | 2.302 | 5.176 | 3.243 | 3.411 | |
| Q8VDD5 | Myosin-9 | Myh9 | Cytoplasm | 3.059 | 2.31 | 3.204 | |||
| A0A075B5L7 | Immunoglobulin κ variable 4–80 (Fragment) | Igkv4-80 | Other | 5.422 | 6.638 | 2.118 | 2.998 | 3.152 | |
| A0A0B4J1K5 | Immunoglobulin λ variable 3 (Fragment) | Iglv3 | Other | 2.222 | 2.72 | 1.984 | 1.961 | 1.229 | 2.946 |
| O88569 | Heterogeneous nuclear ribonucleoproteins A2/B1 | Hnrnpa2b1 | Nucleus | 0.979 | 2.604 | 2.739 | |||
| Q8CFQ9 | Fusion, derived from t(1216) malignant liposarcoma | Fus | Nucleus | 0.533 | 0.653 | 0.476 | 1.809 | ||
| P04104 | Keratin, type II cytoskeletal 1 | Krt1 | Cytoplasm | 3.556 | 2.938 | 2.143 | 1.647 | 1.327 | 1.395 |
| E9Q1Z0 | Keratin 90 | Krt90 | Cytoplasm | 2.133 | 2.46 | 1.523 | 1.24 | ||
| P67984 | 60S ribosomal protein L22 | Rpl22 | Cytoplasm | 1.804 | 1.189 | ||||
| A0A1W2P6G5 | Myosin light polypeptide 6 | Myl6 | Cytoplasm | 3.765 | 1.081 | 1.137 | |||
| Q9JJ28 | Protein flightless-1 homolog | Flii | Nucleus | 0.622 | 0.762 | 1.111 | 1.098 | 0.688 | 1.137 |
| P68369 | Tubulin α-1A chain | Tuba1a | Cytoplasm | 2.902 | 1.032 | 1.085 | |||
| P21107 | Tropomyosin α-3 chain | Tpm3 | Cytoplasm | 1.032 | 1.085 | ||||
| Q20BD0 | Heterogeneous nuclear ribonucleoprotein A/B | Hnrnpab | Nucleus | 0.8 | 2.607 | 0.714 | 0.934 | 0.982 | |
| Q5EBP8 | Heterogeneous nuclear ribonucleoprotein A1 | Hnrnpa1 | Nucleus | 0.885 | 0.93 | ||||
| P70318 | Nucleolysin TIAR | Tial1 | Nucleus | 0.711 | 0.871 | 1.179 | 0.827 | ||
| B2M1R6 | Heterogeneous nuclear ribonucleoprotein K | Hnrnpk | Nucleus | 1.081 | 0.724 | ||||
| P20029 | Endoplasmic reticulum chaperone BiP | Hspa5 | Cytoplasm | 0.444 | 0.714 | 0.688 | 0.724 | ||
| P38647 | Stress-70 protein, mitochondrial | Hspa9 | Cytoplasm | 2.133 | 0.714 | 0.442 | 0.724 | ||
| P68372 | Tubulin β-4B chain | Tubb4b | Cytoplasm | 1.098 | 0.724 | ||||
| Q9CPN9 | Complement C1q subcomponent subunit C | C1qc | Extracellular space | 1.156 | 1.415 | 1.032 | 0.639 | 0.672 | |
| Q02105 | RIKEN cDNA 2210010C04 gene | 2210010C04Rik | Extracellular space | 1.067 | 1.306 | 0.952 | 0.941 | 0.59 | 0.62 |
| A0A087WNU6 | Leucine-rich repeat flightless-interacting protein 1 (Fragment) | Lrrfip1 | Cytoplasm | 0.392 | 0.491 | 0.517 | |||
| Q8BG05-2 | Isoform 2 of heterogeneous nuclear ribonucleoprotein A3 | Hnrnpa3 | Nucleus | 0.934 | 0.465 | ||||
| A0A1D5RLD8 | Glyceraldehyde-3-phosphate dehydrogenase | GM10358 | Other | 0.442 | 0.465 | ||||
| P62631 | Elongation factor 1-α2 | Eef1a2 | Cytoplasm | 0.295 | 0.31 | ||||
| P01029 | Complement C4-B | C4a/C4b | Extracellular space | 0.267 | 0.326 | 0.397 | 0.235 | 0.147 | 0.258 |
| F7DBB3 | AHNAK nucleoprotein 2 (Fragment) | Ahnak2 | Cytoplasm | 0.178 | 0.435 | 0.476 | 0.393 | 0.207 | |
| Q00780 | Collagen α-1(VIII) chain | Col8a1 | Extracellular Space | 0.714 | 0.197 | 0.207 | |||
| Q61510 | E3 ubiquitin/ISG15 ligase TRIM25 | Trim25 | Cytoplasm | ||||||
| P01027 | Complement C3 | C3 | Extracellular Space | 0.622 | 0.544 | 0.397 | 0.098 | 0.207 | |
| P60710 | Actin, cytoplasmic 1 | Actb | Cytoplasm | 14.745 | 8.206 | ||||
| Q9Z1R9 | MCG124046 | Prss1 (includes others) | Extracellular Space | 2.311 | 2.063 | 1.278 | |||
| H3BJS5 | Melanoma inhibitory activity protein 2 (Fragment) | Mia2 | Cytoplasm | 0.863 | 0.541 | ||||
| O70133 | ATP-dependent RNA helicase A | Dhx9 | Nucleus | 0.157 | 0.197 | ||||
| P24369 | Peptidyl-prolyl cis-trans isomerase B | Ppib | Cytoplasm | 13.511 | 10.12 | 12.063 | |||
| F6T9C3 | Translation initiation factor eIF-2B subunit ε (Fragment) | Eif2b5 | Cytoplasm | 1.959 | 1.429 | ||||
| Q8QZT1 | Acetyl-CoA acetyltransferase, mitochondrial | Acat1 | Cytoplasm | 1.333 | 0.556 | ||||
| Q9ER72 | Cysteine-tRNA ligase, cytoplasmic | Cars | Cytoplasm | 0.267 | 0.238 | ||||
| P56480 | ATP synthase subunit β, mitochondrial | Atp5f1b | Cytoplasm | 1.067 | 1.306 | ||||
Table 2
Peroxiredoxin 5 (Prdx5)-interacting proteins detected only in the bone morphogenic protein 2 (BMP2)-treated group.
| Accession | Description | Gene | Localization | Avg of mol% |
|---|---|---|---|---|
| Q8VDD5 | Myosin-9 | Myh9 | Cytoplasm | 2.858 |
| A0A1W2P6G5 | Myosin light polypeptide 6 | Myl6 | Cytoplasm | 1.994 |
| P68369 | Tubulin α-1A chain | Tuba1a | Cytoplasm | 1.673 |
| A0A087WNU6 | Leucine-rich repeat flightless-interacting protein 1 (Fragment) | Lrrfip1 | Cytoplasm | 0.467 |
| P60710 | Actin, cytoplasmic 1 | Actb | Cytoplasm | 11.48 |
| P62737 | Actin, aortic smooth muscle | Acta2 | Cytoplasm | 6.895 |
| Q6ZWQ9 | MCG5400 | Myl12b | Cytoplasm | 6.879 |
| O88569 | Heterogeneous nuclear ribonucleoproteins A2/B1 | Hnrnpa2b1 | Nucleus | 2.672 |
| P67984 | 60S ribosomal protein L22 | Rpl22 | Cytoplasm | 1.496 |
| P21107 | Tropomyosin α-3 chain | Tpm3 | Cytoplasm | 1.059 |
| P68372 | Tubulin β-4B chain | Tubb4b | Cytoplasm | 0.911 |
| Q5EBP8 | Heterogeneous nuclear ribonucleoprotein A1 | Hnrnpa1 | Nucleus | 0.907 |
| B2M1R6 | Heterogeneous nuclear ribonucleoprotein K | Hnrnpk | Nucleus | 0.902 |
| H3BJS5 | Melanoma inhibitory activity protein 2 (Fragment) | Mia2 | Cytoplasm | 0.702 |
| Q8BG05-2 | Isoform 2 of heterogeneous nuclear ribonucleoprotein A3 | Hnrnpa3 | Nucleus | 0.699 |
| A0A1D5RLD8 | Glyceraldehyde-3-phosphate dehydrogenase | GM10358 | Other | 0.454 |
| P62631 | Elongation factor 1-α2 | Eef1a2 | Cytoplasm | 0.302 |
| Q00780 | Collagen α-1(VIII) chain | Col8a1 | Extracellular space | 0.202 |
| Q61510 | E3 ubiquitin/ISG15 ligase TRIM25 | Trim25 | Cytoplasm | 0.202 |
| O70133 | ATP-dependent RNA helicase A | Dhx9 | Nucleus | 0.177 |
Table 3
Statistics of RNA-sequencing (RNA-seq) analysis.
| Original | Number of reads (sum of pairs) | After trimmed reads | Alignment rate (%) |
|---|---|---|---|
| Wt_BMMs-1_Read_Count | 79,081,594 | 77,290,554 | 97.74% |
| Wt_BMMs-2_Read_Count | 73,952,744 | 72,383,444 | 97.88% |
| Wt_BMMs-3_Read_Count | 84,004,640 | 81,523,436 | 97.05% |
| Wt_OCs-1_Read_Count | 75,068,812 | 73,463,268 | 97.86% |
| Wt_OCs-2_Read_Count | 79,729,144 | 77,767,782 | 97.54% |
| Wt_OCs-3_Read_Count | 81,017,248 | 79,417,460 | 98.03% |
| KO_BMMs-1_Read_Count | 77,677,924 | 75,695,744 | 97.45% |
| KO_BMMs-2_Read_Count | 76,958,152 | 75,180,826 | 97.69% |
| KO_BMMs-3_Read_Count | 73,431,784 | 71,442,572 | 97.29% |
| KO_OCs-1_Read_Count | 86,717,526 | 84,541,376 | 97.49% |
| KO_OCs-2_Read_Count | 81,819,488 | 79,737,322 | 97.46% |
| KO_OCs-3_Read_Count | 72,748,470 | 70,913,232 | 97.48% |
Table 4
Primer sequences for quantitative reverse transcription-PCR (qRT-PCR).
| Gene | Primer sequence (5' to 3') | |
|---|---|---|
| Forward | Reverse | |
| Prdx1 | GCATTGAGCAGCCAGAAGAAA | ATCCATCCCCAGCCCTGTAG |
| Prdx2 | CAATGTGGATGACAGCAAGGA | TTCAGGCTCACCGATGTTTACC |
| Prdx3 | TGCTGTTGTCAATGGAGAGTTCA | CAAAGGGTAGAAGAAAAGCACCAA |
| Prdx4 | TTGGTTCAAGCCTTCCAGTACA | ATTATTGTTTCACTACCAGGTTTCCA |
| Prdx5 | ATTGGATGATTCTTTGGTGTCTCT | CTTCACTATGCCGTTGTCTATCAC |
| Prdx6 | CCTGATCAGAAAACCGTTGTCA | AGGAAGCATGCCTGTGCAAT |
| Runx2 | ACTATGGCGTCAAACAGCCT | GGTGCTCGGATCCCAAAAGA |
| Alpl | TGGCCTGGATCTCATCAGTATTT | AGTTCAGTGCGGTTCCAGACA |
| Bglap | AGAGAGGCAGGGAGGATCAAGT | GGACCTGTGCTGCCCTAAAG |
| Ctsk | AGGGAAGCAAGCACTGGATA | GCTGGCTGGAATCACATCTT |
| Acp5 | CAGCTGTCCTGGCTCAAAA | ACATAGCCCACACCGTTCTC |
| Fos | CGAAGGGAACGGAATAAGATG | GCTGCCAAAATAAACTCCAG |
| Ar | GACATGCGTTTGGACAGTACCA | TGACAGCCAGAAGCTTCATCTC |
| Nox1 | CTCCAGCCTATCTCATCCTGAG | AGTGGCAATCACTCCAGTAAGGC |
| Cybb | CACAATATTTGTACCAGACAGACTTGAG | AGCTATGAGGTGGTGATGTTAGTGG |
| Nox4 | CGGGATTTGCTACTGCCTCCAT | GTGACTCCTCAAATGGGCTTCC |
| Noxo1 | TCAGCAGGTAGCCTGGTTTCCA | CACGGATAGCTCATCAGAGCGA |
| Cyba | CCGTCTGCTTGGCCATTG | AACCTGTGGCCGCTCCTT |
| Ncf4 | AAGACACAGGCAAAACCATCAAG | CTGGAACTCACGCCTCATGA |
| Ncf1 | TGGTGGTTTTGCCAGATGAA | GCCTCGTCGGGACTGTCA |
| Ncf2 | tgctcaaggtgcattacaaatacac | CGAGAGCGCCAGCTTCTTAG |
| Rac1 | GGACACCATTGAGAAGCTGAAGG | GTCTTGAGTCCTCGCTGTGTGA |
| Rac2 | CCAGCCAAGTGAGGGTCTGA | GAGTGGACAGTCCCAAGAAGGA |
| 18S | CGCCGCTAGAGGTGAAATTCT | CGAAACTCCGACTTTCGTTCT |
Key resources table
| Reagent type (species) or resource | Designation | Source or reference | Identifiers | Additional information |
|---|---|---|---|---|
| Genetic Reagent (Mus musculus) | B6-Prdx5tm1/J (Prdx5Ko) | Kim et al., 2018 | ||
| Cell line (Mus musculus) | MC3T3-E1 | Cho et al., 2018 | Cell line was verified by KCLB and tested negative for mycoplasma. | |
| Cell line (Homo sapiens) | HEK293T | ATCC | CRL-3216 | Cell line was STR profiled by KCLB and tested negative for mycoplasma. |
| Transfected construct (Mus musculus) | Prdx5 siRNA | Genolution | 5’-GCGUUAAUGACGUCUUUGUUU-3’ 5’-ACAAAGACGUCAUUAACGCUU-3’ | |
| Recombinant DNA reagent | p3xFLAG-CMV-10 (plasmid) | Sigma-Aldrich | Cat#E7658 | Subcloned mouse hnRNPK (EcoR I-Kpn I) |
| Recombinant DNA reagent | pCMV-HA (plasmid) | Clontech Laboratories | Cat#635690 | Subcloned mouse Prdx5 (EcoR I-Bgl II) |
| Peptide, recombinant protein | BMP2 | Sino Biological | Cat#10426 | |
| Peptide, recombinant protein | Recombinant murine sRANKL | PeproTech | Cat#315–11 | |
| Peptide, recombinant protein | Recombinant murine M-CSF | PeproTech | Cat#315–02 | |
| Chemical compound, drug | Type I collagenase | Gibco | Cat#17018 | |
| Chemical compound, drug | Dispase | Roche | Cat#4942078001 | |
| Chemical compound, drug | BCIP/NBT alkaline phosphatase kit | Sigma-Aldrich | Cat#B1911 | |
| Chemical compound, drug | CM-H2DCFDA | Thermo Fisher Scientific | Cat#MP36103 | |
| Chemical compound, drug | Calcein | Sigma-Aldrich | Cat#C0875 | |
| Chemical compound, drug | Alizarin Red S | Sigma-Aldrich | Cat#A5533 | |
| Chemical compound, drug | Lipofectamine 3000 | Invitrogen | Cat#L3000001 | |
| Chemical compound, drug | Hematoxylin | Sigma-Aldrich | Cat#H9627 | |
| Chemical compound, drug | Bouin’s solution | Sigma-Aldrich | Cat#HT10132 | |
| Chemical compound, drug | Acid Fuchsin | Sigma-Aldrich | Cat#F-8129 | |
| Chemical compound, drug | Aniline blue | Junsei | Cat#11466 | |
| Chemical compound, drug | Phosphomolybdic acid hydrate | Junsei | Cat#84235 | |
| Chemical compound, drug | Phosphotungstic acid hydrate | Junsei | Cat#84220 | |
| Chemical compound, drug | Fast Green FCF | Sigma-Aldrich | Cat#7252 | |
| Chemical compound, drug | FuGENE HD | Promega | Cat#E2311 | |
| Chemical compound, drug | RIPA lysis buffer | Thermo Fisher Scientific | Cat#89900 | |
| Chemical compound, drug | TRIzol reagent | Thermo Fisher Scientific | Cat#15596026 | |
| Chemical compound, drug | Trypsin Gold | Promega | Cat#V5280 | |
| Commercial assay or kit | TRAP Staining Kit | Cosmo Bio Co. | Cat#PMC-AK04-COS | |
| Commercial assay or kit | TRACP & ALP assay kit | TaKaRa | Cat#MF301 | |
| Commercial assay or kit | SYBR Green Master mix | Thermo Fisher Scientific | Cat#A25778 | |
| Commercial assay or kit | Reverse transcription kit | Thermo Fisher Scientific | Cat#18064022 | |
| Commercial assay or kit | Mouse RANKL ELISA | Abcam | Cat#ag100749 | |
| Commercial assay or kit | Mouse OPG ELISA | R&D systems | Cat#MOP00 | |
| Commercial assay or kit | Mouse BMP2 ELISA | LSBio | Cat#LS-F36595 | |
| Commercial assay or kit | Nuclear and cytoplasmic extraction kit | Thermo Fisher Scientific | Cat#78833 | |
| Commercial assay or kit | Luciferase assay system | Promega | Cat#E1500 | |
| Commercial assay or kit | RNeasy mini kit | Qiagen | Cat#74004 | |
| Commercial assay or kit | Testosterone ELISA | R&D Systems | Cat#KGE010 | |
| Commercial assay or kit | ChIP assay | Cell Signaling Technology | Cat#9003 | |
| Antibody | Anti-Prdx5 (mouse monoclonal) | Invitrogen | Cat#LF-MA0002 | (1:1000) |
| Antibody | Anti-Prdx5 (rabbit polyclonal) | Ab Frontier | Cat#LF-PA0010 | (1:500) |
| Antibody | Anti-hnRNPK (rabbit polyclonal) | Cell Signaling Technology | Cat#9081 | (1:1000) |
| Antibody | Anti-beta actin (mouse monoclonal) | Sigma | Cat#A5441 | (1:1000) |
| Antibody | Anti-ALP (rabbit polyclonal) | Abcam | Cat#ab229126 | (1:200) |
| Antibody | Anti-HA-Tag (mouse monoclonal) | Santa Cruz | Cat#sc-7392 | (1:1000) |
| Antibody | Anti-Flag (OctA)-probe (mouse monoclonal) | Santa Cruz | Cat#sc-166355 | (1:1000) |
| Antibody | Anti-lamin A/C (rabbit polyclonal) | Cell Signaling Technology | Cat#2032 | (1:1000) |
| Antibody | Anti-lamin B (rabbit polyclonal) | Ab Frontier | Cat#LF-PA50043 | (1:1000) |
| Antibody | Anti-tubulin alpha (mouse monoclonal) | Novus | Cat#NB100 | (1:1000) |
| Antibody | Anti-rabbit Alexa Fluor 488 (goat polyclonal) | Thermo Fisher Scientific | Cat#A-32731 | (1:200) |
| Antibody | Anti-mouse Alexa Fluor 555 (rabbit polyclonal) | Thermo Fisher Scientific | Cat#A-21427 | (1:200) |
| Antibody | Anti-androgen receptor (mouse monoclonal) | Santa Cruz | Cat#sc-7305 | (1:1000) |
| Antibody | Anti-Prdx1 (rabbit polyclonal) | Invitrogen | Cat#PA3-750 | (1:1000) |
| Antibody | Anti-Prdx2 (rabbit polyclonal) | Ab Frontier | Cat#LF-PA0007 | (1:500) |
| Antibody | Anti-Prdx3 (rabbit polyclonal) | Ab Frontier | Cat#LF-MA0329 | (1:500) |
| Antibody | Anti-Prdx4 (rabbit polyclonal) | Abcam | Cat#ab184167 | (1:500) |
| Antibody | Anti-Prdx6 (rabbit polyclonal) | Invitrogen | Cat#PA5-30320 | (1:1000) |
| Software, algorithm | GraphPad Prism software 8 | https://graphpad.com | ||
| Software, algorithm | ImageJ software | https://imagej.nhi.gov/ij |
Additional files
Download links
A two-part list of links to download the article, or parts of the article, in various formats.
Downloads (link to download the article as PDF)
Open citations (links to open the citations from this article in various online reference manager services)
Cite this article (links to download the citations from this article in formats compatible with various reference manager tools)
Peroxiredoxin 5 regulates osteogenic differentiation through interaction with hnRNPK during bone regeneration
eLife 12:e80122.
https://doi.org/10.7554/eLife.80122


