Single-cell RNA sequencing analysis of shrimp immune cells identifies macrophage-like phagocytes
- Institute of Marine Sciences, Guangdong Provincial Key Laboratory of Marine Biotechnology, Shantou University, China
- Department of Biology, College of Science, Shantou University, China
- Guangzhou Genedenovo Biotechnology Company Limited, China
- Shantou University-Universiti Malaysia Terengganu Joint Shellfish Research Laboratory, Shantou University, China
- Southern Marine Science and Engineering Guangdong Laboratory, China
Figures
Figure 1 with 2 supplements
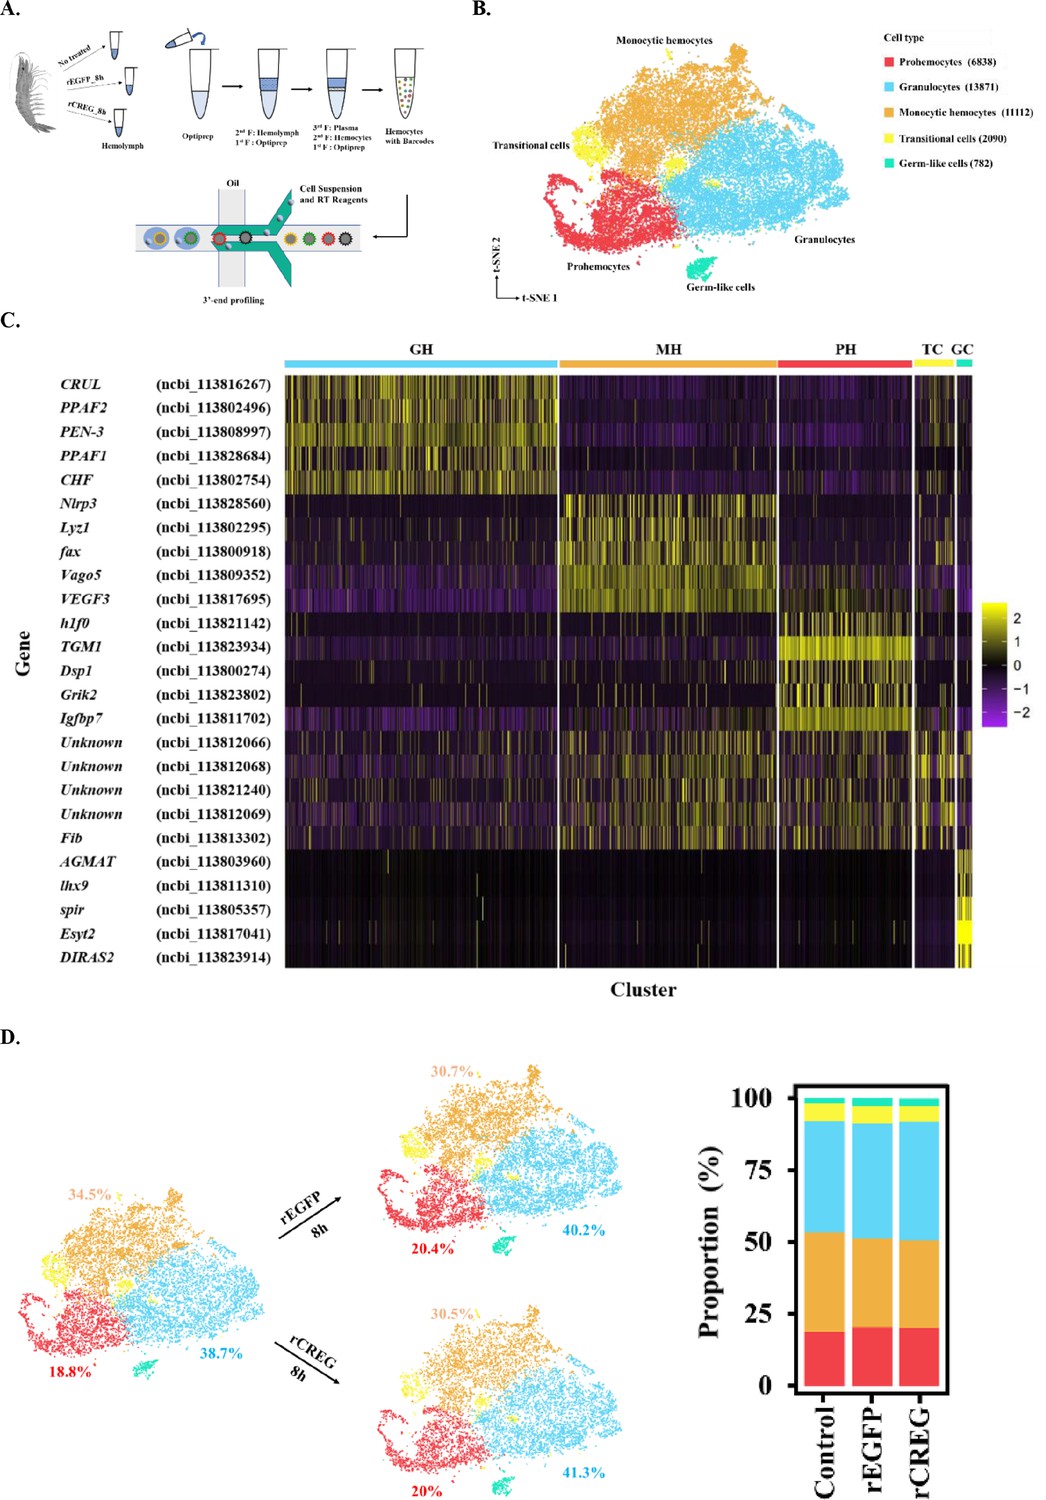
Major cell types identified in shrimp hemolymph.
(A) A schematic workflow of sample preparation. The hemocytes were collected from non-treated, rEGFP-treated, and rCREG-treated shrimps (n=15 for each treatment) and subjected to iodixanol gradient centrifugation and single-cell RNA sequencing (ScRNA-seq) using 10 X Genomics. (B) A t-SNE plot showing five major cell types identified in scRNA-seq dataset (n=34,693 in total; Control, 12544; rEGFP treated, 12640; rCREG treated, 9509 cells). The count of each cell type is indicated in parentheses. (C) A heatmap showing five representative marker genes for each major cluster. The gene name and its NCBI GeneID is listed (left) and its expression level in each cell is shown with different colors (right). (D) Two-dimensional projections, and proportions of the cell types for each treatment. Proportions of prohemocytes (red), monocytic hemocytes (brown), and granulocytes (blue) are indicated (left). Proportions of all five major cell types in each treatment are indicated (right).
Figure 1—figure supplement 1
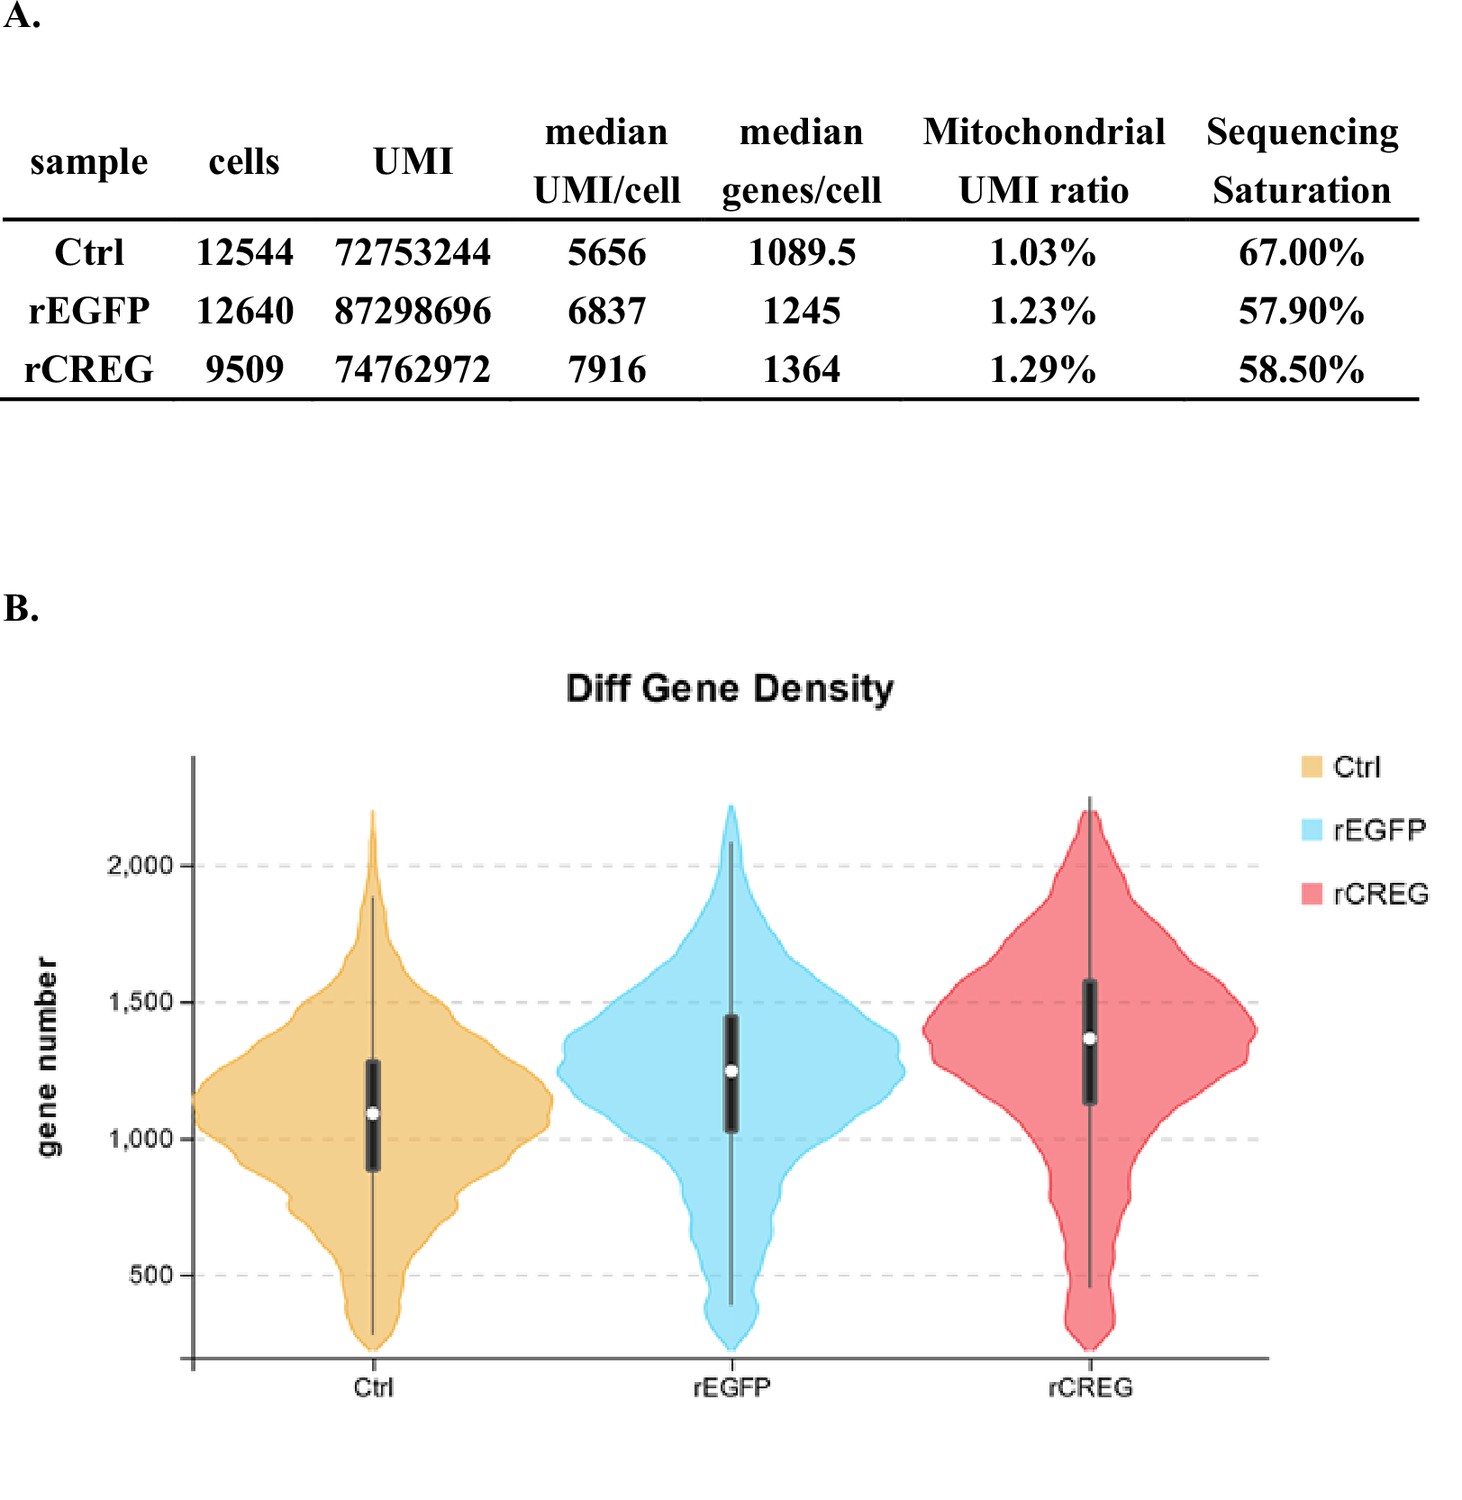
Overall quality of single-cell transcriptomic data.
Figure 1—figure supplement 2
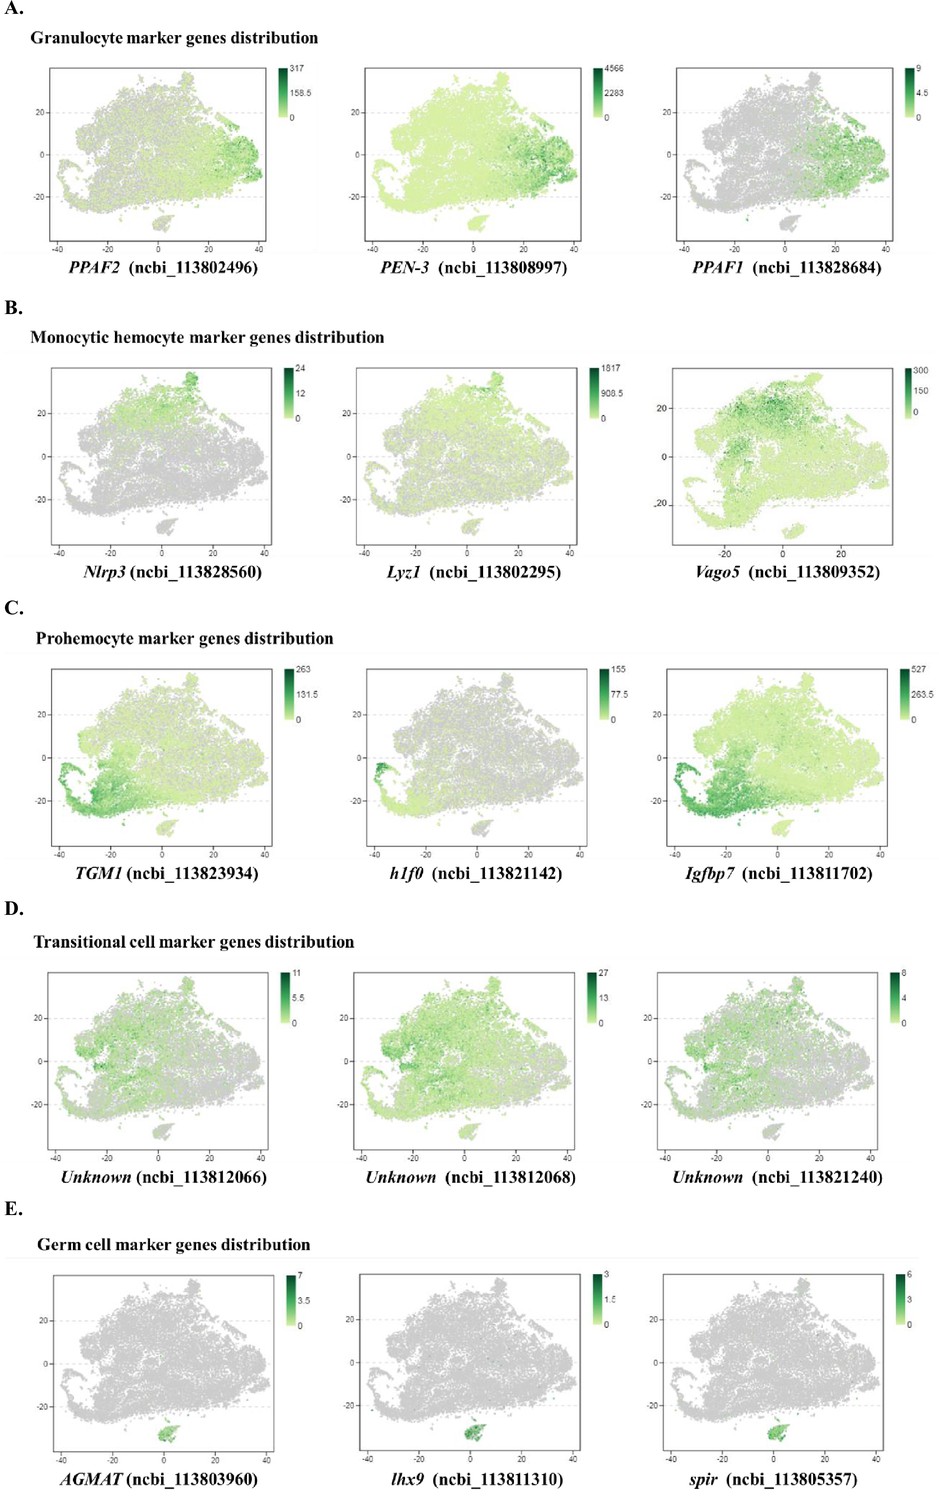
Distribution of the marker genes in major cell types.
Figure 2 with 1 supplement
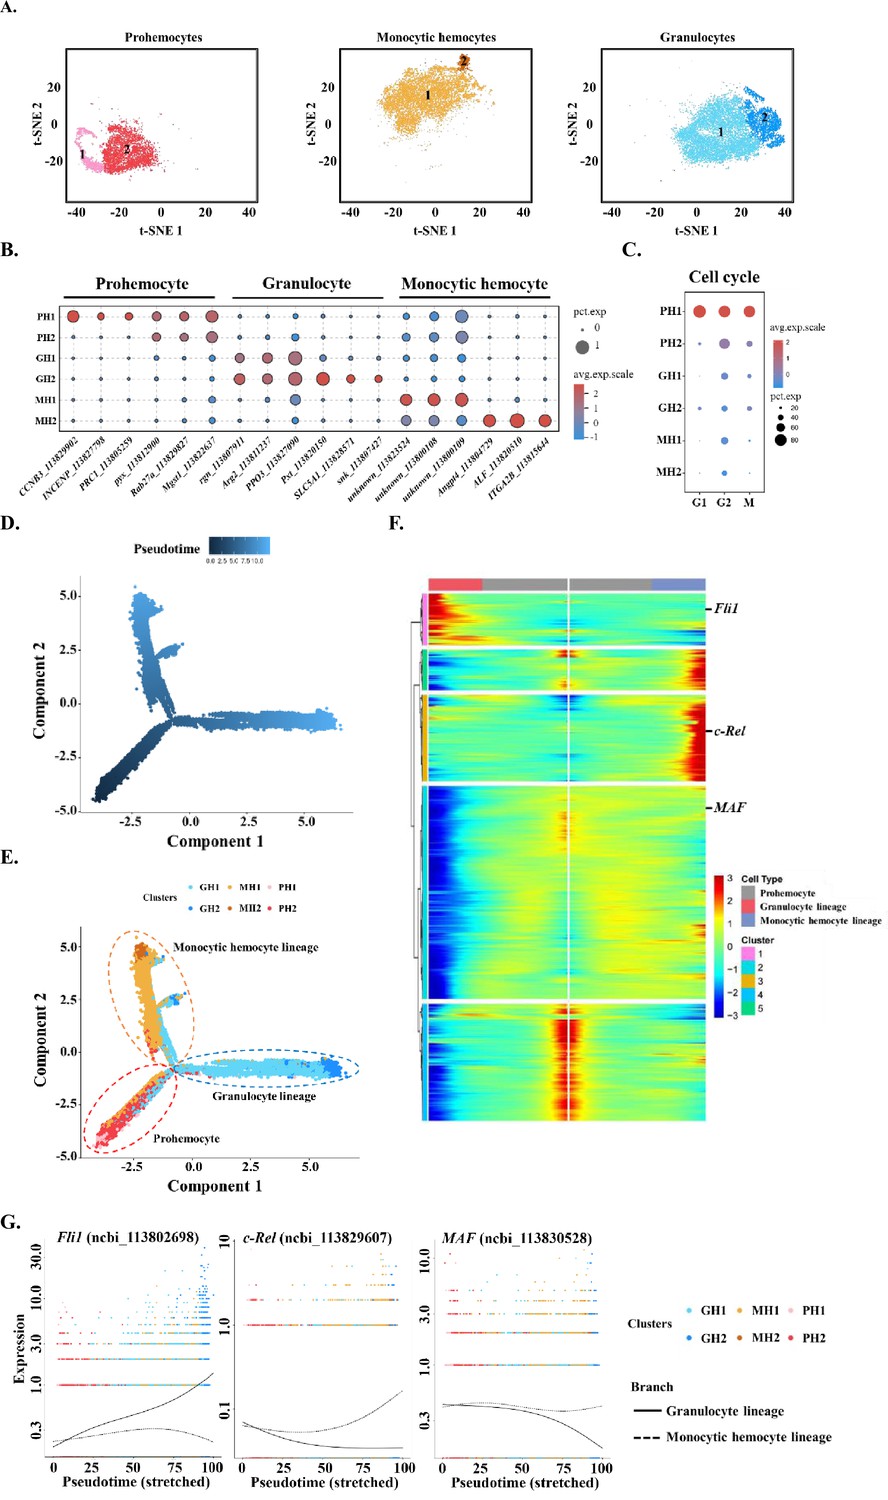
Subclustering and pseudotime trajectory analyses of three major hemocyte types in shrimp hemolymph.
(A) Subclusters of hemocytes–prohemocytes (PH), monocytic hemocytes (MH), granulocytes (GH) are projected onto two-dimensional t-SNE plots. The numbers in the plots represent the subcluster number. (B) Dot plot showing corresponding expression of cluster marker genes. The color indicates mean expression and dot size represents the percentage of cells within the cluster expressing the marker. Last nine digits of each marker gene are the NCBI GeneID. (C) Expression of cell-cycle regulating genes in the six subtypes. Dot color indicates average expression levels and dot size displays the average percentage of cells with cell cycle controlling genes (Cdk1(ncbi_113818305), CycD(ncbi_113814652), and CycE(ncbi_113822658) for G1; stg(ncbi_113800052), CycA(ncbi_113821735), and CycB(ncbi_113803283) for G2; polo(ncbi_113805901), aurB(ncbi_113827838), and birc5(ncbi_113828653) for M) in each subcluster. (D) A differentiation trajectory of PH, GH, and MH subpopulation using Monocle2 (n=31821). (E) Differentiation trajectory reconstruction with 6 subclusters. PH lineage, GH lineage, and MH lineage were labelled with red, blue, and brown circles respectively. (F) A heatmap showing differentially expressed gene dynamics during hemocyte differentiation process. (G) Spline plots showing the expression dynamics of Fli1, c-Rel, and MAF. Imaginary line, monocytic hemocyte lineage; Full line, granulocyte lineage.
Figure 2—figure supplement 1
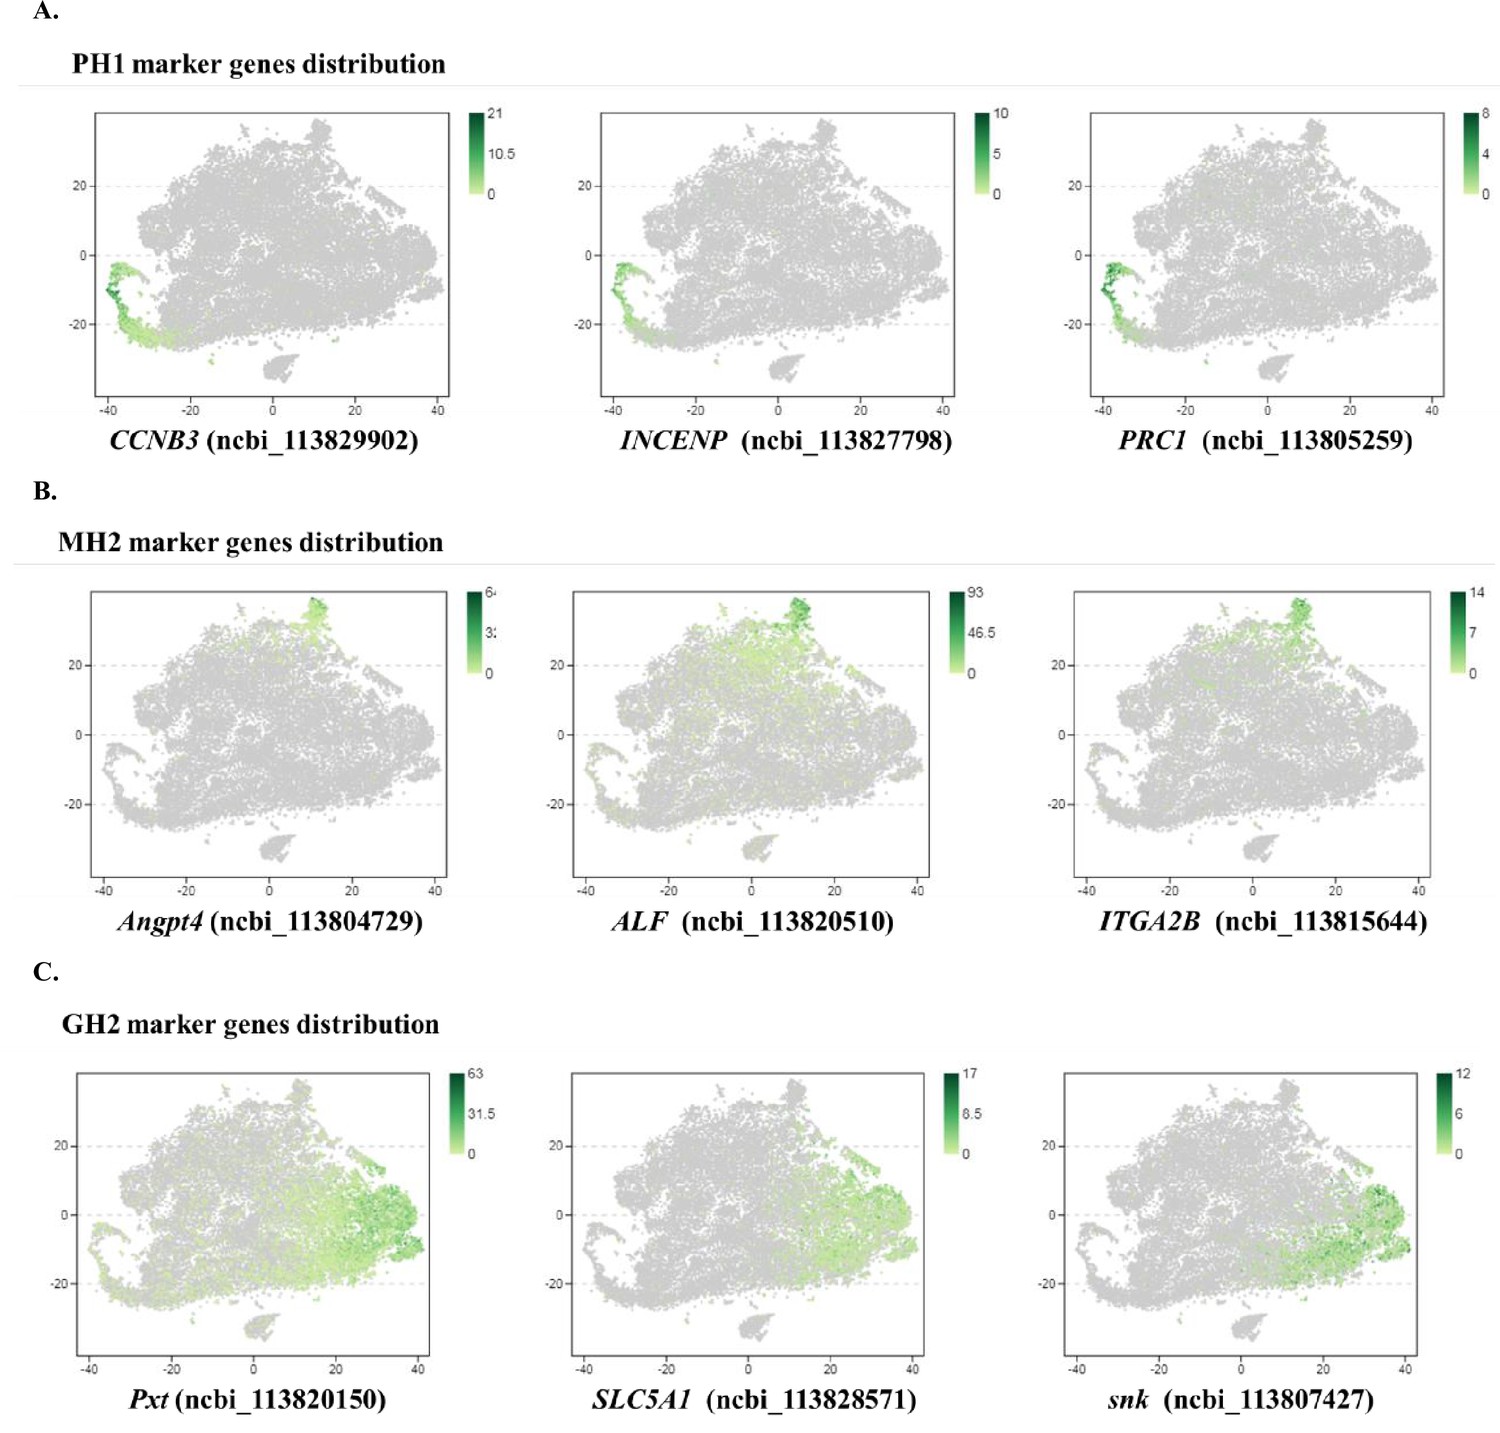
Distribution of the marker genes for PH1, MH2 and GH2.
Figure 3 with 1 supplement

Identification of MH2 as macrophage-like phagocytic cells.
(A) Comparison between MH2 and human macrophage marker genes. (B) A representative contour plot of shrimp hemocytes against FITC-VP. Threshold intensity (FITC-A) was set to <103 representing control hemocytes (R2), and >2 × 10³ representing phagocytic hemocytes (R1). R1 and R2 were sorted based on the forward scatter (FSC) and fluorescence intensity (FITC) two-dimensional space. (C) Confocal microscopy of sorted hemocytes (R1) with ingested FITC-labelled Vibrio Parahemolyticus. Green, ingested Vibrio Parahemolyticus; Blue, nuclei. Scale bar: 10 μM. (D) Efficiency of the phagocytosis inhibitor on the Vibrio Parahemolyticus uptake of shrimp hemocytes. The results are presented as mean ± SD of 6–8 replicates. Asterisks denote statistical significance (**p=0.007) between the control and different treatments. (E) Differential gene expression analysis (CHIT1 (**p=0.004), Lyz1 (*p=0.049), and NAGA (*p=0.032)) between R1 and R2 sorted using FACS and analyzed using qPCR. (F) Differential protein expression analysis (NAGA, LYZ1, and NLRP3) between R1 and R2 sorted using FACS. The immunoblot signals were quantified with ImageJ. The relative immunoblot signal intensities of NAGA (*p=0.011), LYZ1 (*p=0.022), and NLRP3 (**p=0.009) compared with that of ß-actin were recorded with bar chart. Both qPCR and immunoblot data were analyzed using the student t test.
-
Figure 3—source data 1
Flow cytometry source data for Figure 3D.
- https://cdn.elifesciences.org/articles/80127/elife-80127-fig3-data1-v2.pdf
-
Figure 3—source data 2
Raw qPCR data for Figure 3E.
- https://cdn.elifesciences.org/articles/80127/elife-80127-fig3-data2-v2.csv
-
Figure 3—source data 3
Raw and labeled western blot source images for Figure 3F.
- https://cdn.elifesciences.org/articles/80127/elife-80127-fig3-data3-v2.zip
Figure 3—figure supplement 1
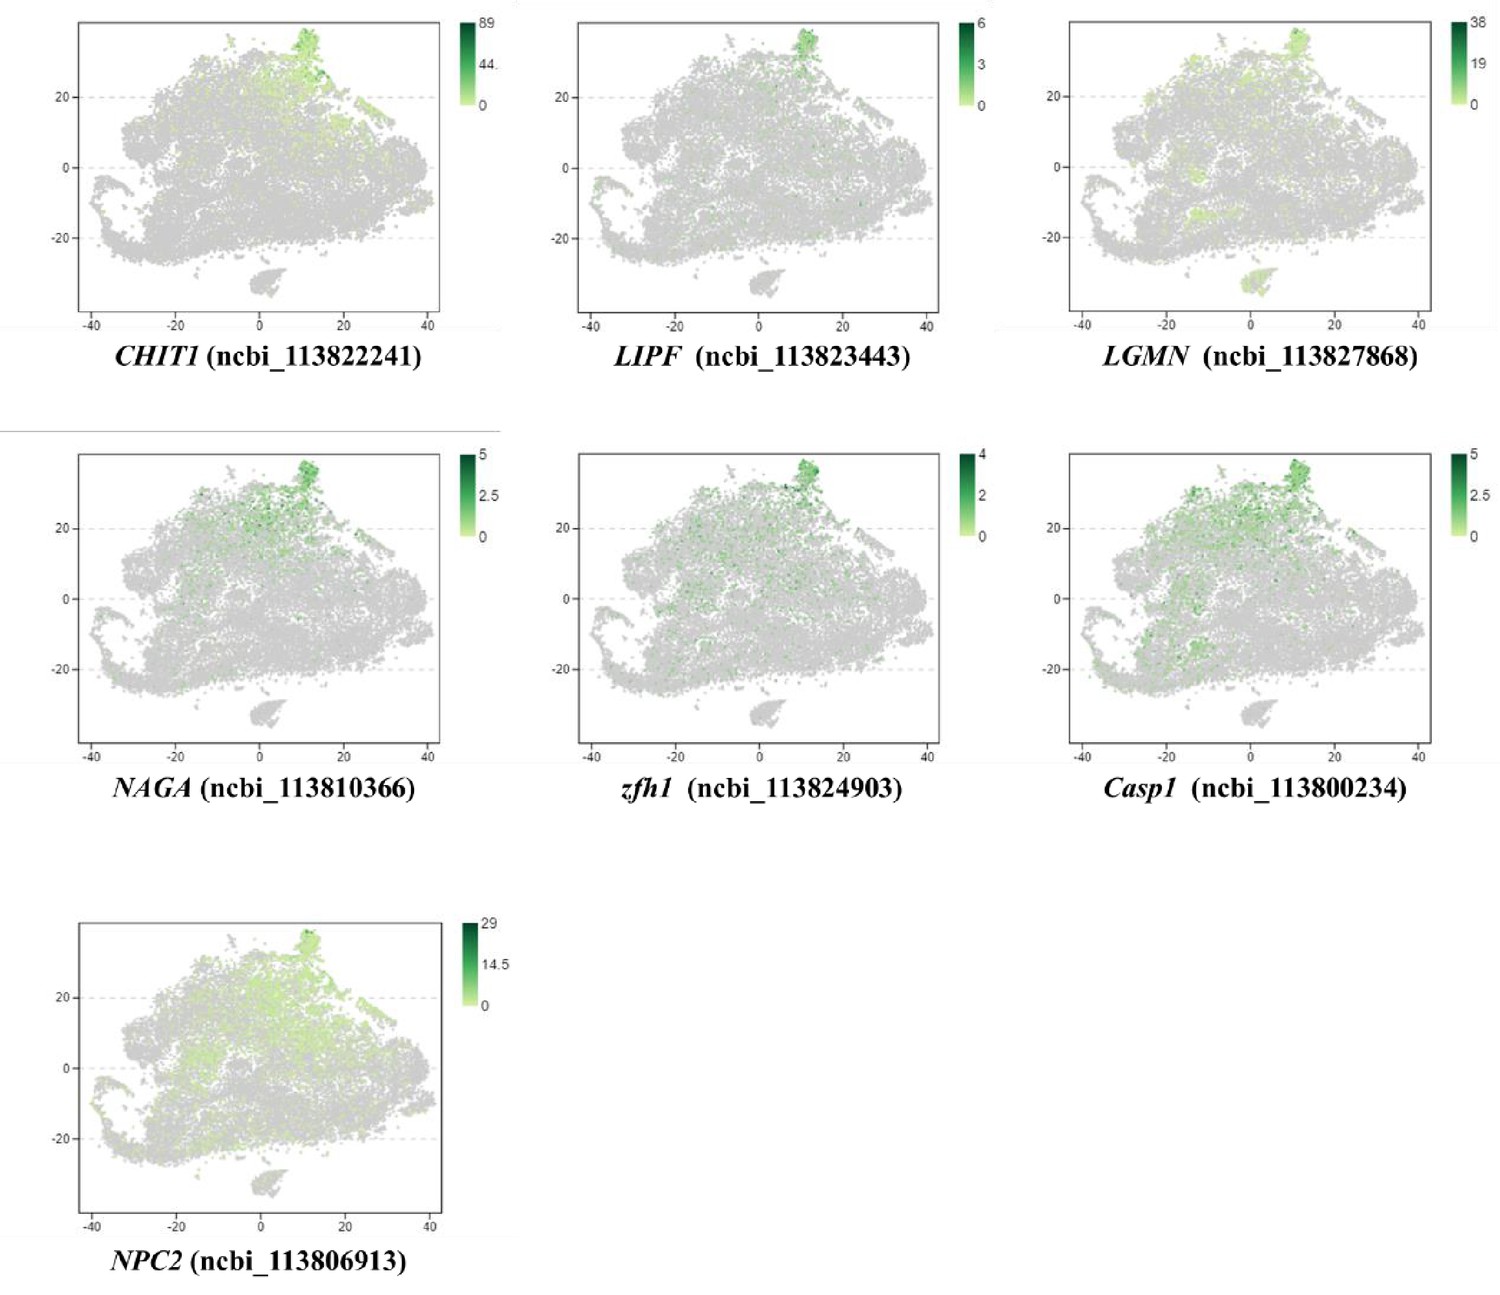
Distribution of MH2 marker genes, which are conserved with that of human macrophages.
Figure 4
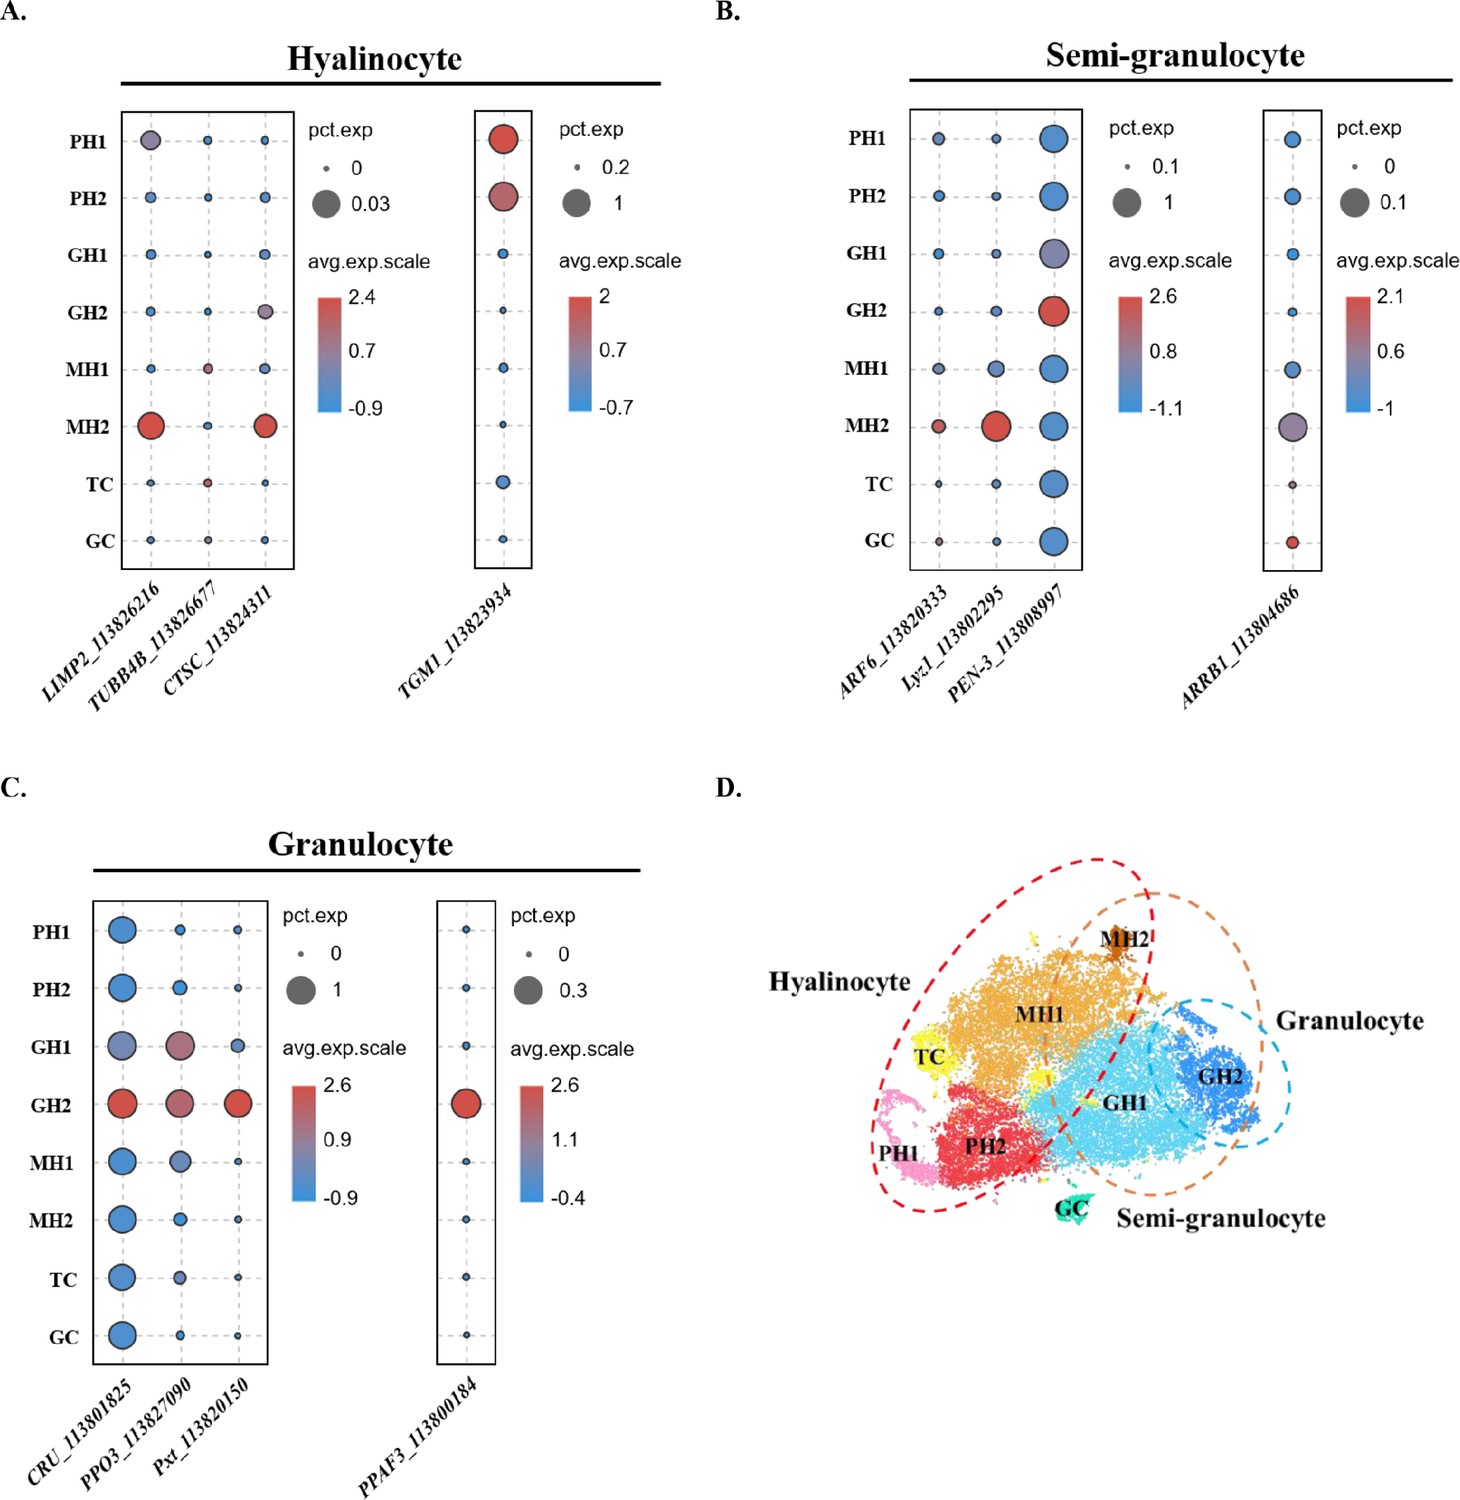
Comparison between the traditional classification and the classification in this study.
(A) Dot plot showing corresponding expression of previously reported hyalinocyte marker genes in eight subclusters. (B) Dot plot showing corresponding expression of previously reported semi-granulocyte marker genes in eight subclusters. (C) Dot plot showing corresponding expression of previously reported granulocyte marker genes in eight subclusters. The color indicates mean expression, and dot size represents the percentage of cells within the cluster expressing the marker. (D) A proposed model for comparison between two classifications. The hyalinocyte, semi-granulocyte, and granulocyte were labelled on the t-SNE map with red, brown, and blue circles, respectively.
Author response image 1
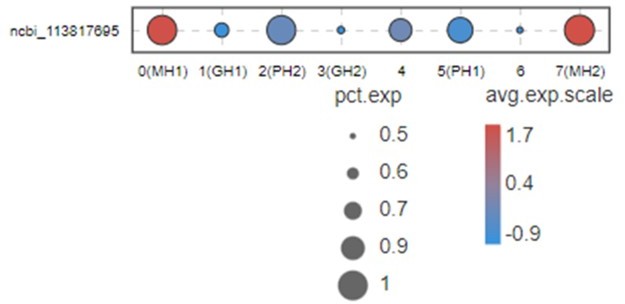
This Figure indicates that VEGF3 has no significant differentially expression in MH1 and MH2 populations.
Thus, we don’t list this gene in Figure 2B and give a discussion for this marker. Moreover, it is difficult to address this point because VEGFs in shrimp have five subtypes. All five subtypes play some roles during WSSV infection (doi: 10.1016/j.fsi.2015.10.026 doi: 10.1016/j.dci.2016.05.020 doi: 10.1016/j.fsi.2018.10.019). Only VEGF3 was highly expressed in MH subtype. This system is too complicated and far away from being clarified at this moment. Thus, it is very difficult to discussion this part now.
Author response image 2
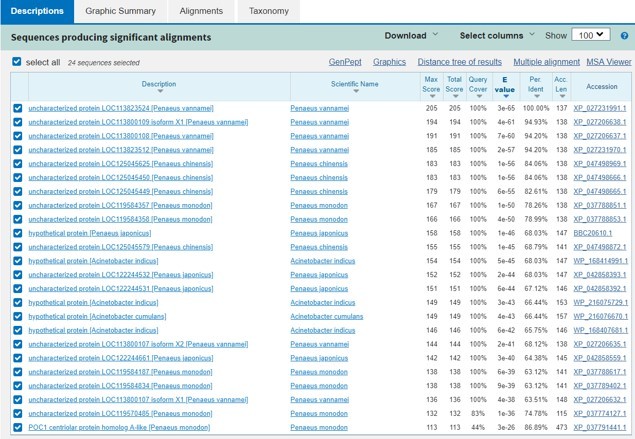
This Image represents the top three genes are quite similar and only conserved in shrimp.
The blast results don’t show much information about these proteins’ function.
Author response image 3
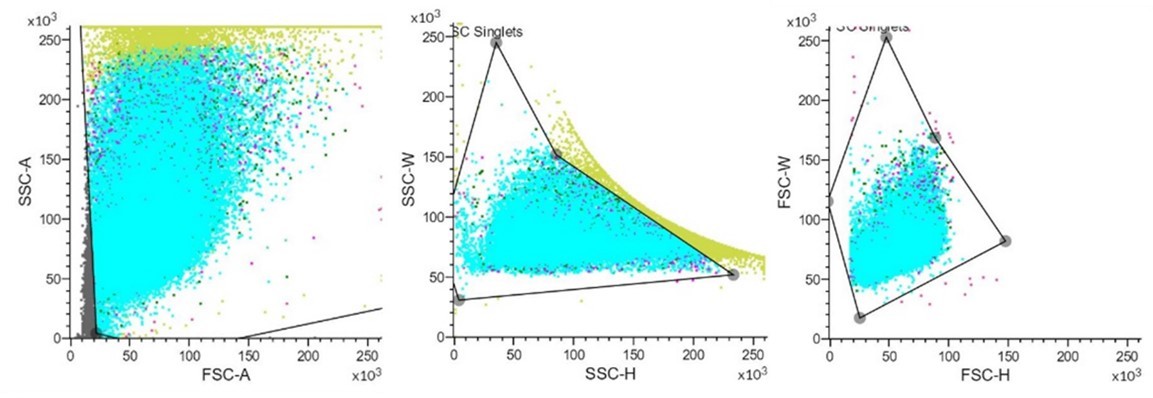
These images show that setting a suitable gating strategy to excluded interference factors to visualize FITC.
Tables
Key resources table
| Reagent type (species) or resource | Designation | Source or reference | Identifiers | Additional information |
|---|---|---|---|---|
| Antibody | Anti-ß-ACTIN (Rabbit monoclonal) | Beyotime | Cat#AF5003 | WB (1:200) |
| Antibody | Anti-NAGA (Rabbit polyclonal) | SinoBiological | Cat#13686-T24 | WB (1:200) |
| Antibody | Anti-LYZ1 (Rabbit polyclonal) | Bioss Antibodies | Cat#bs-0816R | WB (1:200) |
| Antibody | Anti-NLRP3 (Rabbit polyclonal) | GenScript | polypeptide (aa29-42) WB (1:200) | |
| Strain, strain background (Vibrio parahaemolyticus) | FITC-VP | Shantou University | 2×10⁶ particles/g | |
| Chemical compound, drug | OptiPrep | Axis-shield | Cat# AS1114542 | |
| Chemical compound, drug | Trypan blue | Solarbio | Cat# C0040 | |
| Chemical compound, drug | FITC | Bioss | Cat# D-9801 | |
| Chemical compound, drug | Hoechst 33342 stain | Beyotime | Cat# C1028 | 100× |
| Peptide, recombinant protein | rEGFP | Huang et al., 2021 (https://doi.org/10.3389/fimmu.2021.707770) | recombinant plasmid, prokaryotic expression, purification | |
| Peptide, recombinant protein | rCREG | Huang et al., 2021 (https://doi.org/10.3389/fimmu.2021.707770) | recombinant plasmid, prokaryotic expression, purification | |
| Biological sample (Penaeus vannamei) | Haemolymph | Shantou local farms | Freshly isolated from Penaeus vannamei | |
| Commercial assay, kit | RNAprep Pure Micro Kit | TIANGEN | Cat#DP420 | |
| Commercial assay, kit | First Strand cDNA Synthesis Kit | Beyotime | Cat#D7168M | |
| Commercial assay, kit | 3’Reagent Kits v3.1 | 10 X Genomics | 1000268 | |
| Sequence-based reagent | CHIT1_F | This paper | qPCR primers | GTCGAAATTCCGGCCAAAGA |
| Sequence-based reagent | CHIT1_R | This paper | qPCR primers | GGCCCGTTCTTGTTTGACTT |
| Sequence-based reagent | Lyz1_F | This paper | qPCR primers | CAAGAACTGGGAGTGCATCG |
| Sequence-based reagent | Lyz1_R | This paper | qPCR primers | TCTGGAAGATGCCGTAGTCC |
| Sequence-based reagent | NAGA _F | This paper | qPCR primers | CTACGAGGACTACGGCAACT |
| Sequence-based reagent | NAGA _R | This paper | qPCR primers | CGAACTCTGGGTAGCCTTCA |
| Sequence-based reagent | EF-1α_F | This paper | qPCR primers | GTATTGGAACAGTGCCCGTG |
| Sequence-based reagent | EF-1α_R | This paper | qPCR primers | ACCAGGGACAGCCTCAGTAAG |
Additional files
-
Supplementary file 1
A CSV table containing specifically expressed marker genes for transitional cell (TC).
- https://cdn.elifesciences.org/articles/80127/elife-80127-supp1-v2.csv
-
Supplementary file 2
A CSV table containing specifically expressed marker genes for germ-like cell (GC).
- https://cdn.elifesciences.org/articles/80127/elife-80127-supp2-v2.csv
-
Supplementary file 3
A CSV table containing specifically expressed marker genes for prohemocyte 1 (PH1).
- https://cdn.elifesciences.org/articles/80127/elife-80127-supp3-v2.csv
-
Supplementary file 4
A CSV table containing specifically expressed marker genes for granulocyte 2 (GH2).
- https://cdn.elifesciences.org/articles/80127/elife-80127-supp4-v2.csv
-
Supplementary file 5
A CSV table containing specifically expressed marker genes for monocytic hemocyte 2 (MH2).
- https://cdn.elifesciences.org/articles/80127/elife-80127-supp5-v2.csv
-
Supplementary file 6
A CSV table containing specifically expressed marker genes for prohemocyte 2 (PH2).
- https://cdn.elifesciences.org/articles/80127/elife-80127-supp6-v2.csv
-
Supplementary file 7
A CSV table containing specifically expressed marker genes for granulocyte 1 (GH1).
- https://cdn.elifesciences.org/articles/80127/elife-80127-supp7-v2.csv
-
Supplementary file 8
A CSV table containing specifically expressed marker genes for monocytic hemocyte 1 (MH1).
- https://cdn.elifesciences.org/articles/80127/elife-80127-supp8-v2.csv
-
Supplementary file 9
A CSV table containing differentially expressed genes between monocytic hemocyte lineage and granulocyte lineage.
- https://cdn.elifesciences.org/articles/80127/elife-80127-supp9-v2.csv
-
Supplementary file 10
A CSV table containing a comparison between this study and other invertebrate single-cell cellular immunity studies.
- https://cdn.elifesciences.org/articles/80127/elife-80127-supp10-v2.csv
-
Supplementary file 11
A CSV table containing sequence alignment between shrimp marker genes in this study and its human homolog.
- https://cdn.elifesciences.org/articles/80127/elife-80127-supp11-v2.csv
-
MDAR checklist
- https://cdn.elifesciences.org/articles/80127/elife-80127-mdarchecklist1-v2.pdf
Download links
A two-part list of links to download the article, or parts of the article, in various formats.
Downloads (link to download the article as PDF)
Open citations (links to open the citations from this article in various online reference manager services)
Cite this article (links to download the citations from this article in formats compatible with various reference manager tools)
Single-cell RNA sequencing analysis of shrimp immune cells identifies macrophage-like phagocytes
eLife 11:e80127.
https://doi.org/10.7554/eLife.80127


