Ligand-induced shifts in conformational ensembles that describe transcriptional activation
- Department of Biochemistry and Molecular Biology, Pennsylvania State University, United States
- Department of Chemistry, Pennsylvania State University, United States
Figures
Figure 1 with 1 supplement
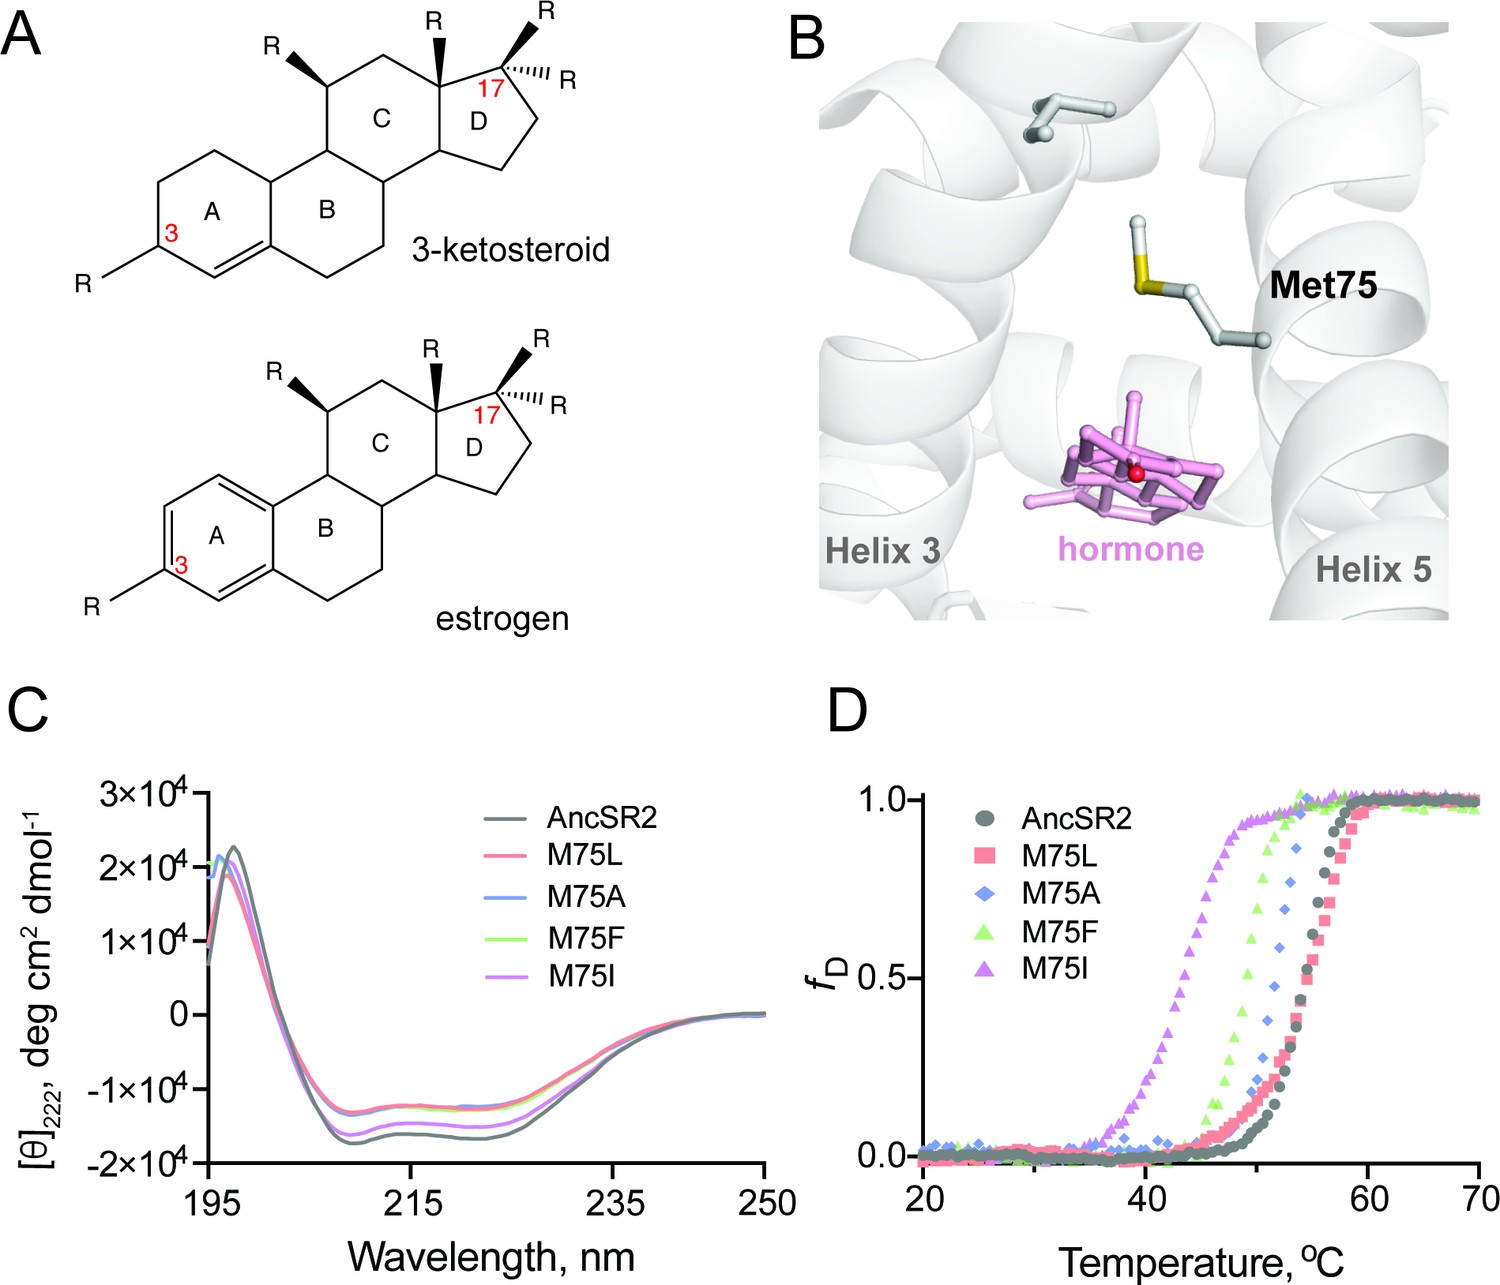
Structure and stability of AncSR2 and M75 mutants.
(A) Chemical structure of A-ring aromatized estrogen and non-aromatized 3-ketosteroid. (B) Met75 (H5) is positioned to form critical contacts with H3 and the hormone located in the ligand binding pocket. (C) Far-UV CD spectra of AncSR2 and its variants in the wavelength range 195–250 nm, showed mutants LBD remains in the folded state similarly as AncSR2. (D) Normalized heat-induced denaturation transition curves of AncSR2 and its variants monitored by change in the [θ]222 as function of temperature. Each curve represents averaged measurements from two replicates and two independent purifications.
Figure 1—figure supplement 1
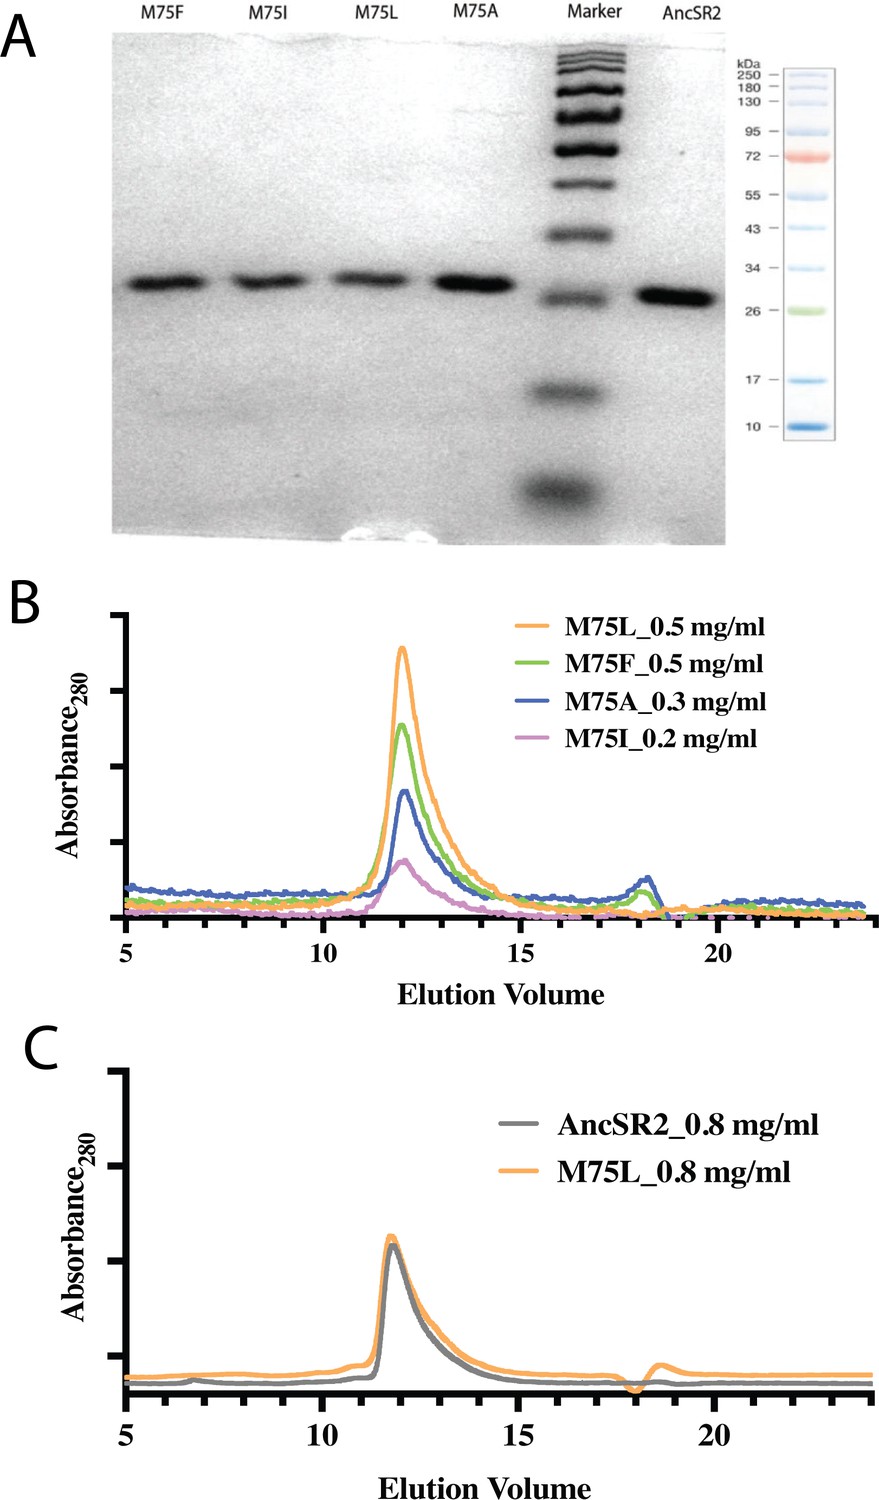
Purity and homogeneity of mutants were assessed by SDS-PAGE and Gel filtration chromatography.
(A) Purity of the LBDs were assessed on 14% SDS-PAGE. (B) Gel filtration profile of AncSR2 and variants over ENrich SEC 70 (Bio-Rad, USA) gel filtration column at 4 °C. A 100 μl sample of mutants at concentrations of 0.2 mg-0.5 mg/ml was loaded on pre-equilibrated SEC70 gel filtration column and their elution profile was monitored at a wavelength 280 nm. (C) A higher concentration (0.8 mg/ml) of AncSR2 and M75L mutant proteins was loaded on the column to check the concentration effect on the elution profile. Mutant LBDs eluted as a single peak at identical positions as AncSR2 LBD, suggesting that LBD mutants maintain the AncSR2 globular conformation.
-
Figure 1—figure supplement 1—source data 1
14% SDS-PAGE showing purity of the purified LBD of AncSR2 and variants.
- https://cdn.elifesciences.org/articles/80140/elife-80140-fig1-figsupp1-data1-v1.zip
Figure 2 with 2 supplements
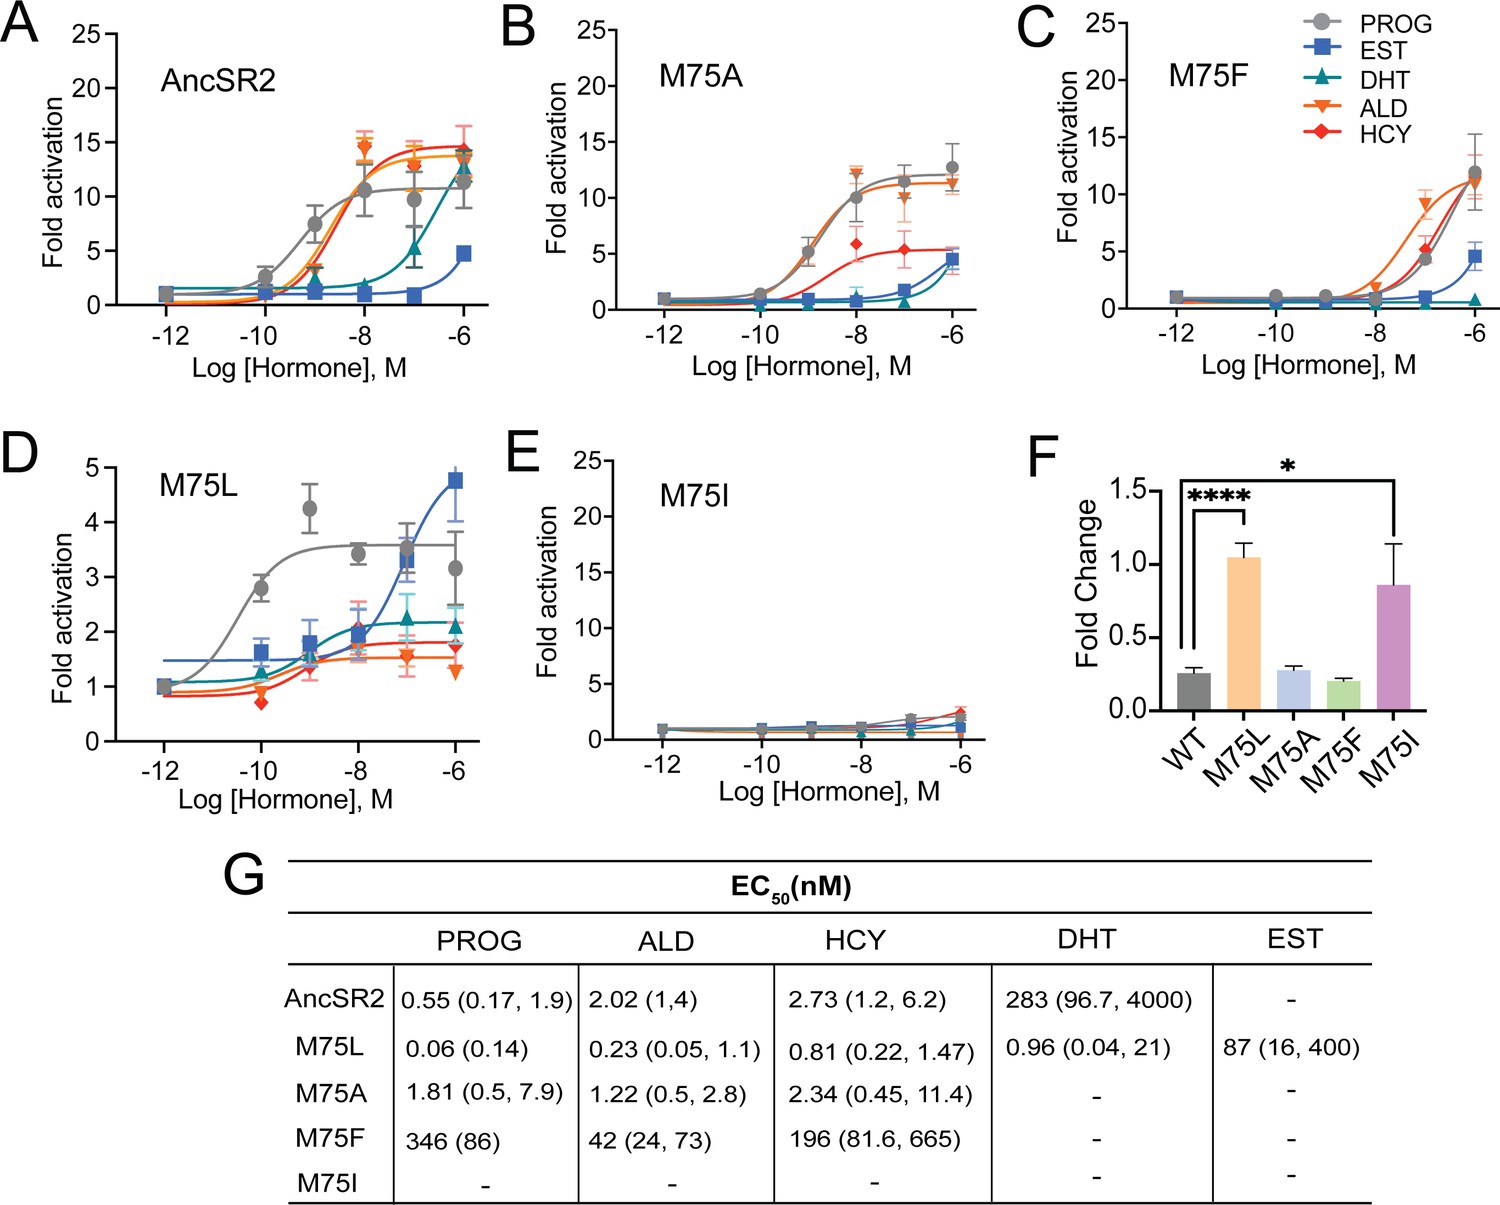
Differential ligand activation of AncSR2 variants.
Dose-response curves of AncSR2 and its variants in the presence of aromatized and non-aromatized hormones. Five hormones are used: progesterone (PROG), aldosterone (ALD), hydrocortisone (HCY), Dihydrotestosterone (DHT) and Estradiol (EST). (A) AncSR2 receptor showed differential response to non-aromatized hormones with no response to estradiol with ligand treatment up to 1 µM. (B) M75A substitution slightly increased the fold activation as compared to AncSR2 with no change in the receptor efficacy for progesterone, aldosterone, hydrocortisone. (C) M75F substitution decreased the receptor responsiveness for hormones. (D) M75L receptor efficacy is significantly reduced compared to WT AncSR2. In contrast to WT AncSR2, M75L was activated by estradiol. (E) M75I substitution completely abolished the ligand activation for both types of hormones. Each data point is an average of two to three biological replicates. The error bar associated with each data point represent SEM. (F) M75L and M75I receptors fold change over empty vector in the absence of hormone suggest that they exhibit constitutive activity. Two-tailed unpaired t-test, (****) p<0.0001, (*) p<0.05. (G). Table shows EC50 values obtained from the analysis of dose-response curves of individual receptors for different hormones. 95% confidence interval values are shown in parentheses.
Figure 2—figure supplement 1
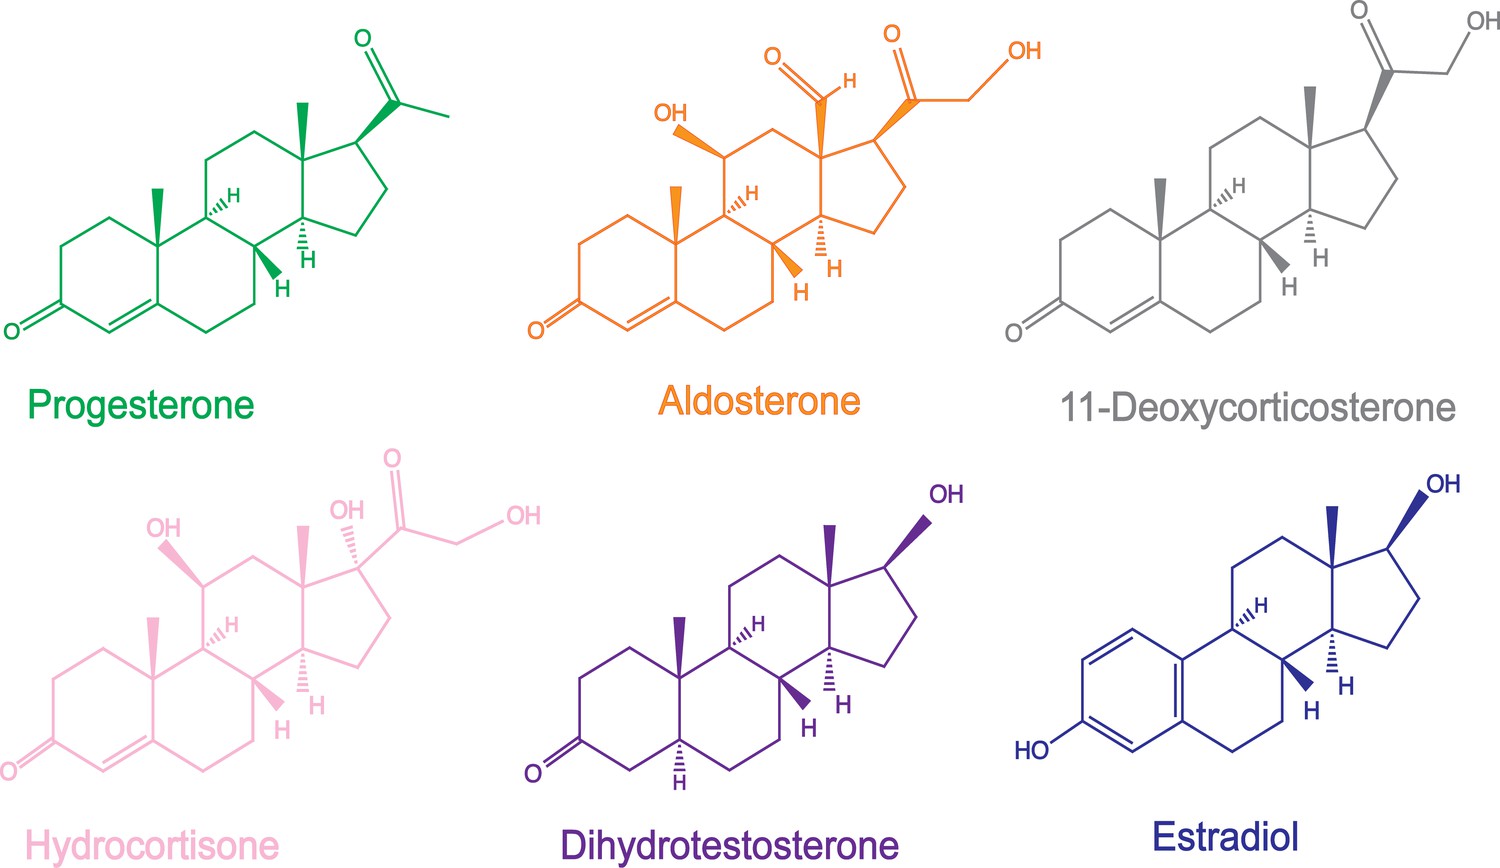
Chemical structures of different hormones used in the FP-based competition binding experiments.
Figure 2—figure supplement 2
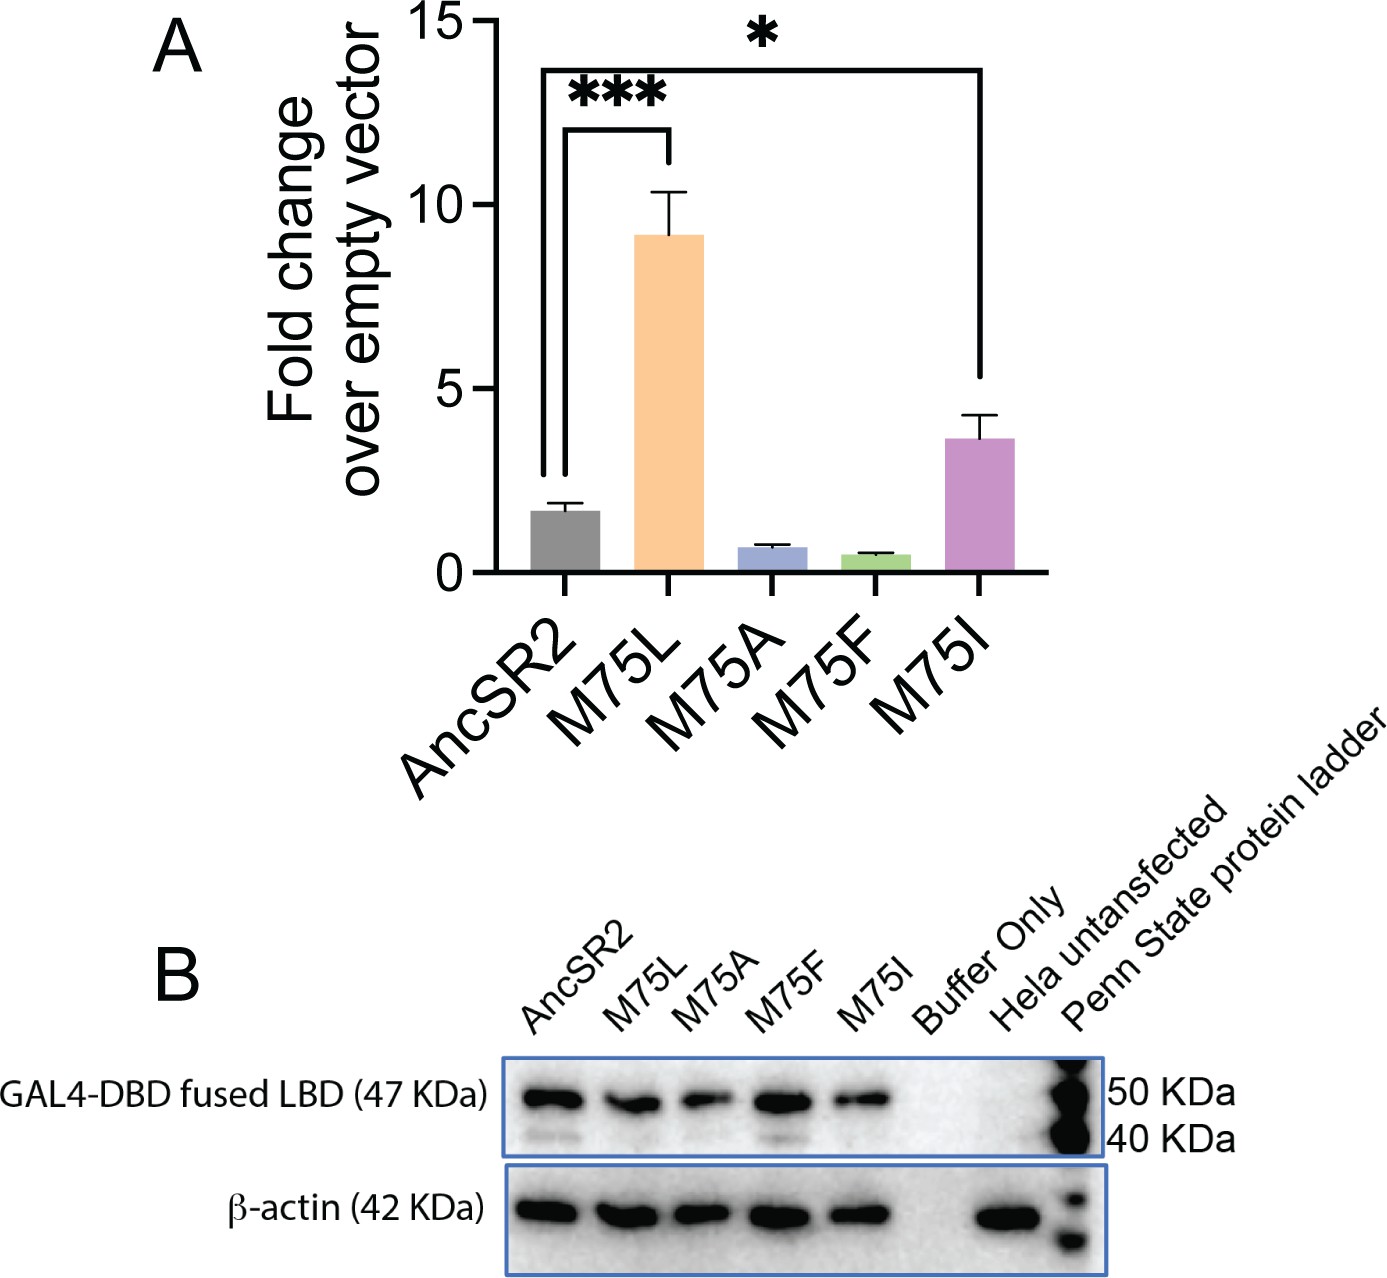
Constitutive activity and expression levels of AncSR2 variants.
(A) The constitutive activity of M75L receptor was independent of the cell lines used. Fold change of AncSR2 and variants over empty vector in the absence of ligand (cell line: CHO). The error bars associated with each column represent SEM from three independent replicates. Two-tailed unpaired t-test, (***) p<0.0002, (*) p<0.05. (B) Western blot experiment showing that the expression of mutant proteins are comparable to WT AncSR2.
-
Figure 2—figure supplement 2—source data 1
Western blot experiments to show that expression of mutant proteins are comparable to WT AncSR2.
An equal amount (40 μg) of total protein samples were electrophoresed on SDS-PAGE and transferred to a PVDF membrane. (A) Gal4-DBD fused protein was detected using ECI (Thermofisher scientific, USA) after incubation of mouse monoclonal anti-GAL4DBD antibody (sc510, Santacruz Biotechnology, Santa cruz, USA) and horse reddish peroxidase linked secondary antibody (sc-525409, Santacruz Biotechnology, Santa cruz, USA). Negative control was non-transfected Hela cells. (B) The same blot stripped off and then restained with rabbit raised anti-actin polyclonal antibody (A2066, Millipore Sigma, USA) and detected by Goat raised horse reddish peroxidase linked secondary antibody (ab97051, Abcam, USA).
- https://cdn.elifesciences.org/articles/80140/elife-80140-fig2-figsupp2-data1-v1.zip
Figure 3
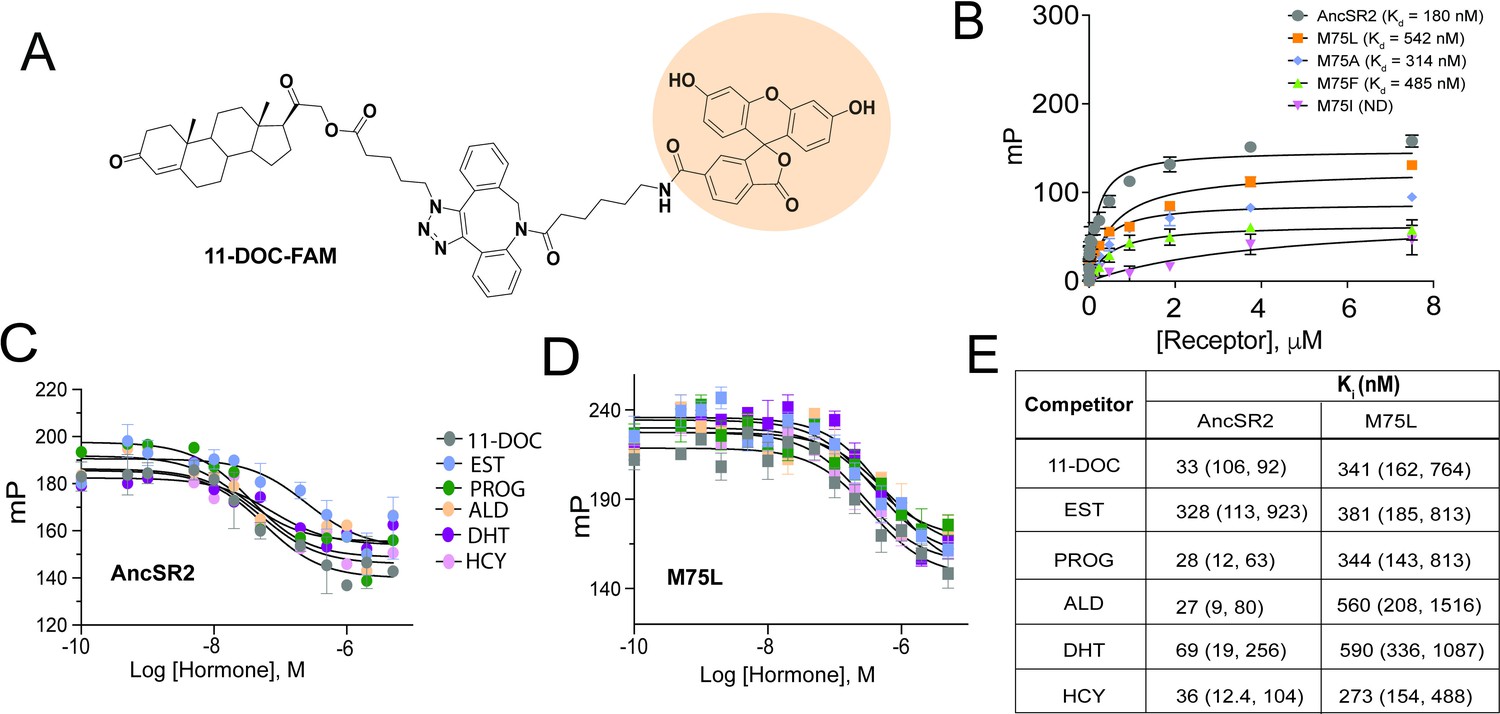
Fluorescence polarization assay of binding affinity of AncSR2 and M75 mutants.
(A) Structure of synthesized probe: FAM labelled 11-DOC (11-DOC-FAM). (B) 11-DOC-FAM binds to AncSR2-LBD and M75L, M75A, M75F with equilibrium dissociation constant, Kd = 180 nM (107, 293) and Kd = 542 nM (330,869), Kd = 314 nM (127, 692), Kd = 485 nM (227, 986), respectively. 95% confidence intervals are shown in parentheses. Binding data is the average of six (for WT AncSR2 and M75L) and three (M75A, M75F and M75I) replicates from two and one independent experiment, respectively where each experiment consists of three independent replicates. (C and D) FP-based competition binding experiments shows that all steroid hormones bind WT AncSR2 and M75L with nM inhibition constants (Ki), respectively. Error bars indicate SD from three independent replicates. (E) Ki values obtained for five hormones from FP-based competition ligand binding assay. 95% confidence intervals from independent triplicate measurements are shown in parentheses.
Figure 4 with 4 supplements
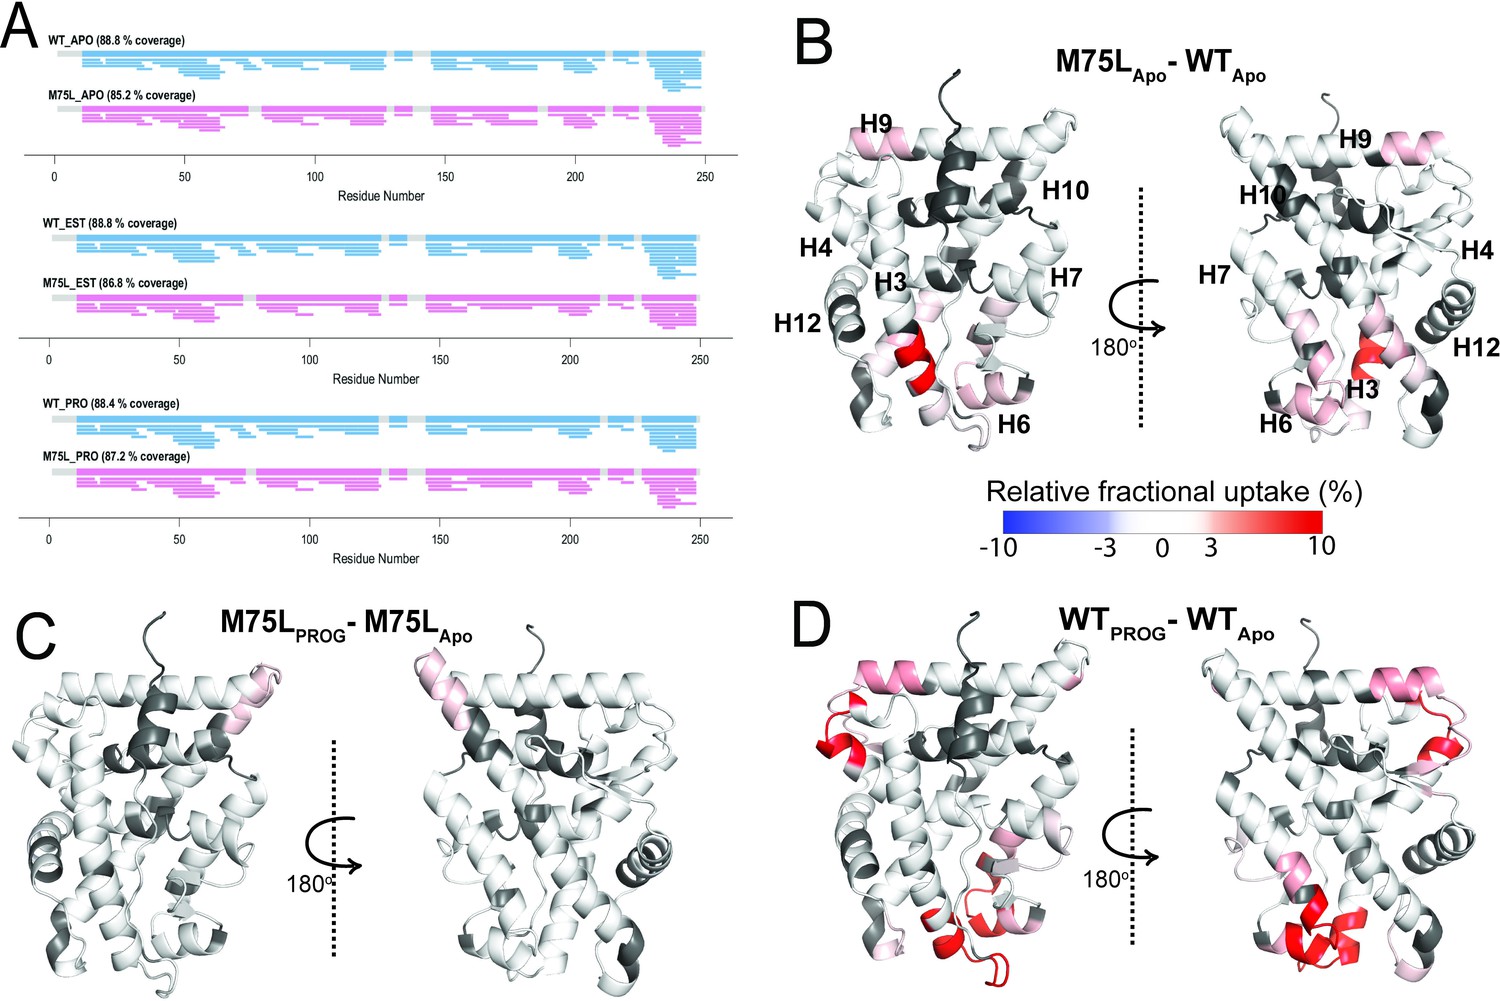
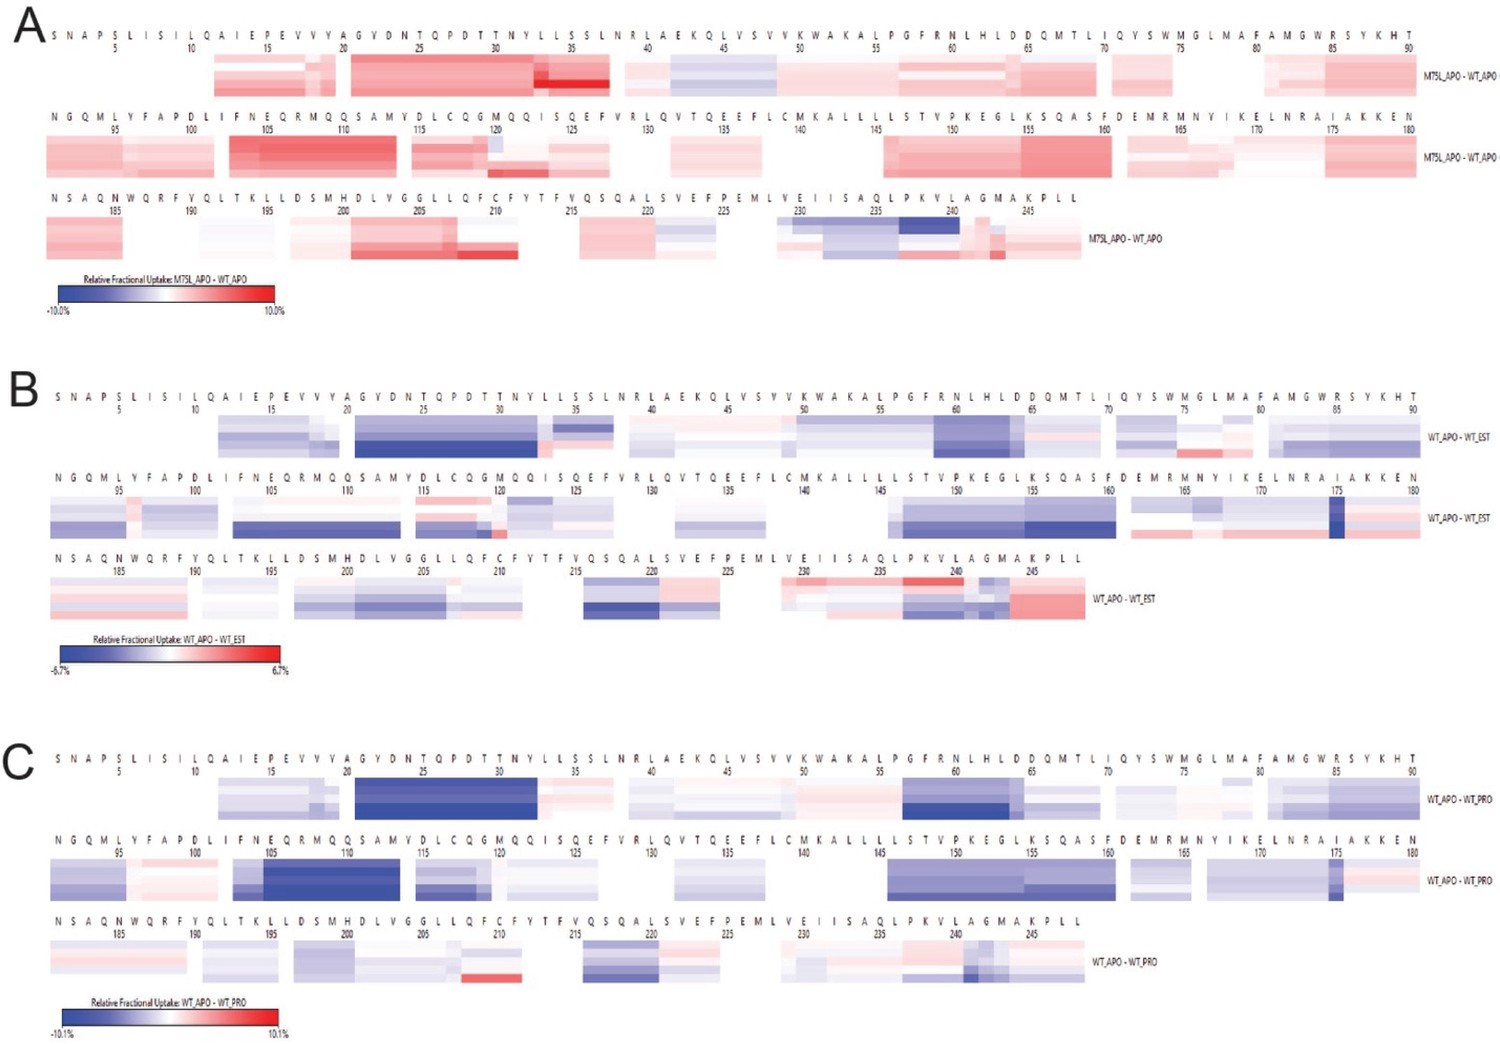
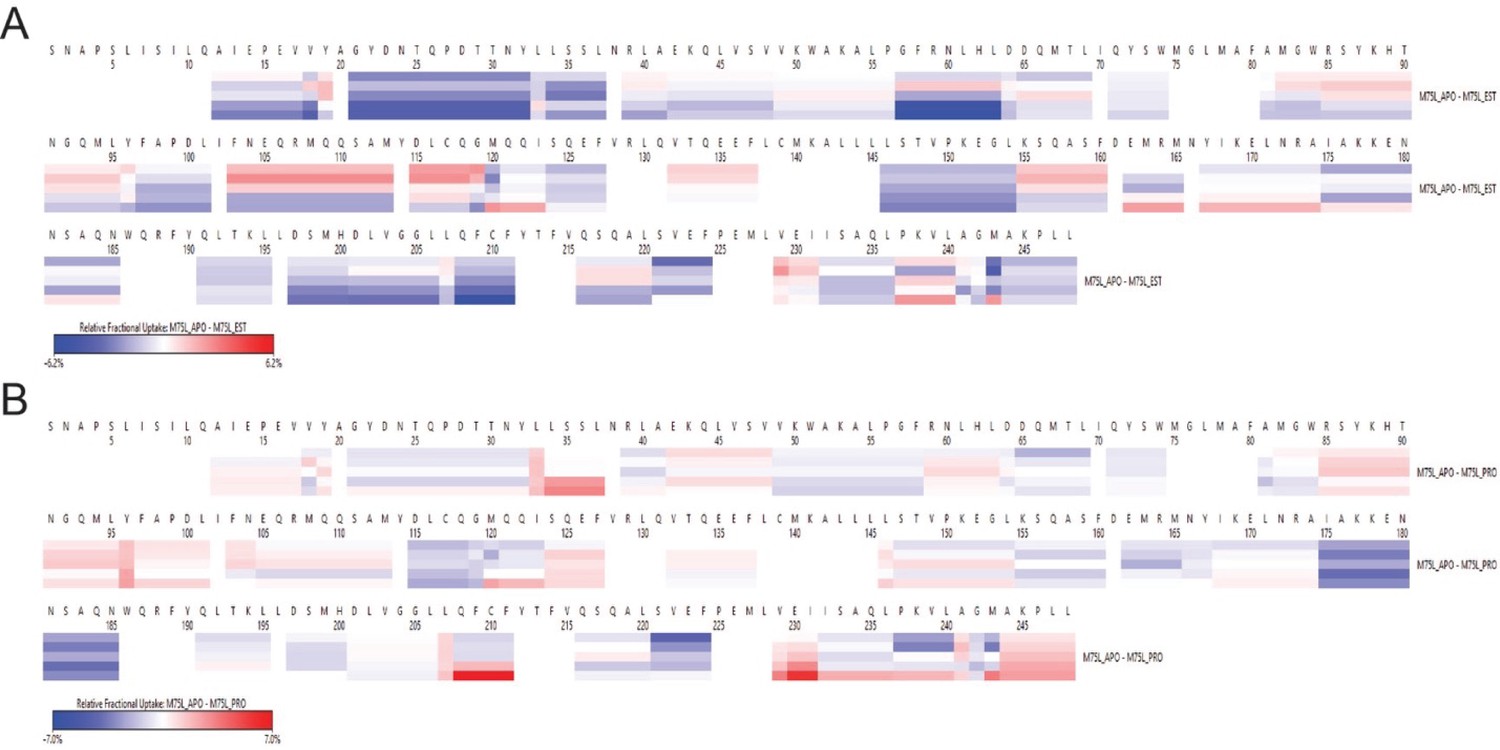
Conformational effects of AncSR2 M75L mutation probed by HDX-MS.
(A) Sequence coverage maps for WT AncSR2 (blue) and M75L (pink) in their apo, estradiol (EST), and progesterone (PROG) bound form. (B) The percentage difference in relative fractional uptake (ΔRFU) of deuterium at a time point (15 min) between M75L and WT AncSR2 apo states (M75LApo – WTApo). (C) ΔRFU between M75L-progesterone bound and M75L Apo state (M75LPROG-M75LApo). (D) ΔRFU between WT-progesterone bound and WT Apo state (WTPROG-WTApo). Color bar indicates the fractional difference in relative deuterium uptake for the two states compared. Positive percentage numbers (red) correspond to higher deuterium exchange in state A compared to state B, that is, deprotection, while negative numbers (blue) indicate lower exchange, that is, protection against deuteration exchange. Dark grey regions represent peptides with no sequence coverage.
Figure 4—figure supplement 1
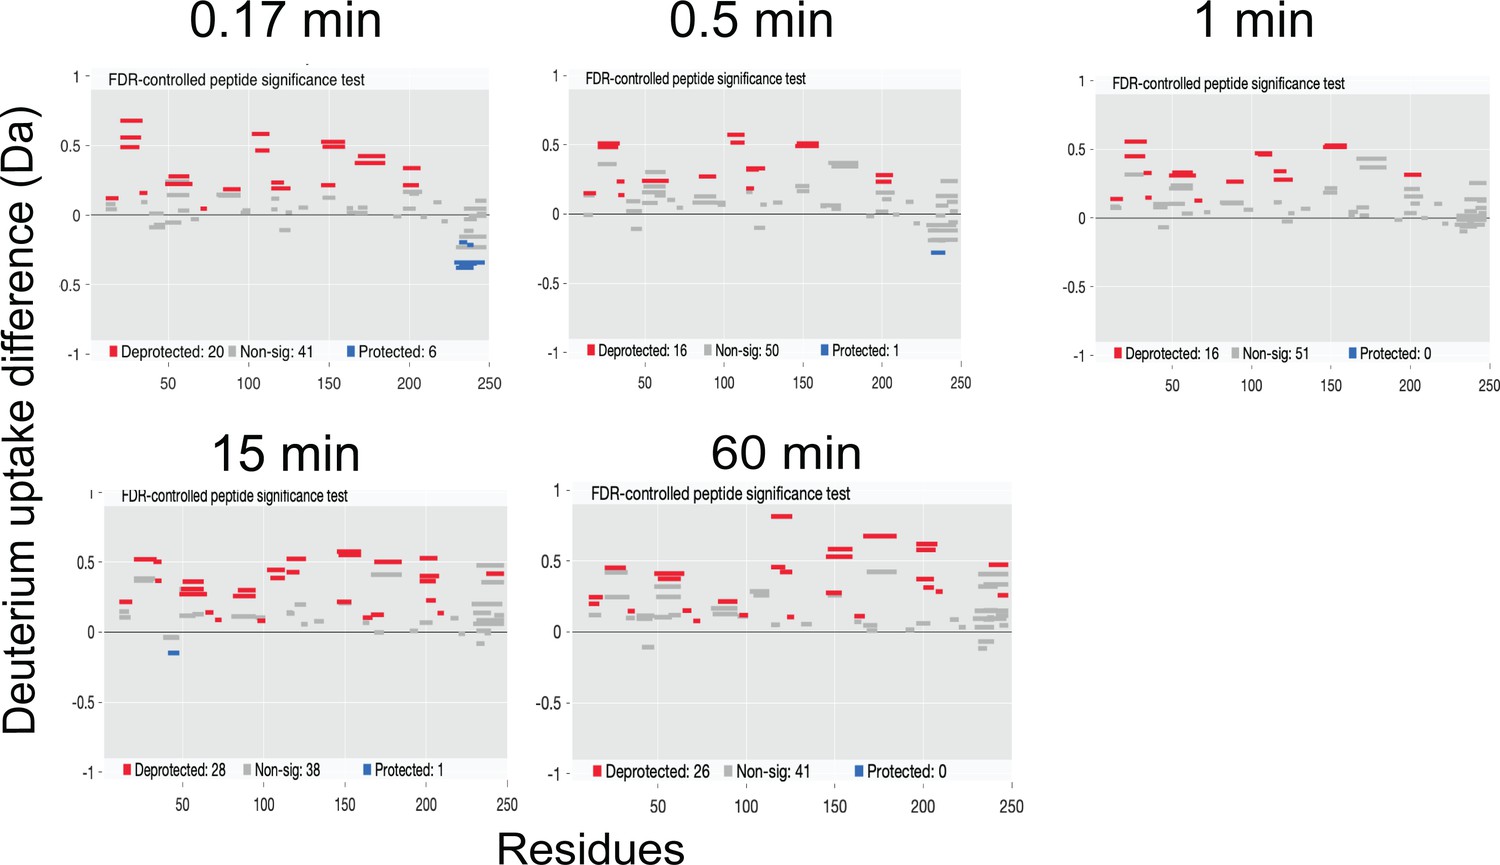
Deuterium exchange difference plot (Woods plot) between M75L and WT AncSR2 apo states (M75LApo – WTApo) at multiple time points.
A positive difference indicates increased exchange in the apo M75L while a negative difference represents decrease in the deuterium exchange.
Figure 4—figure supplement 2
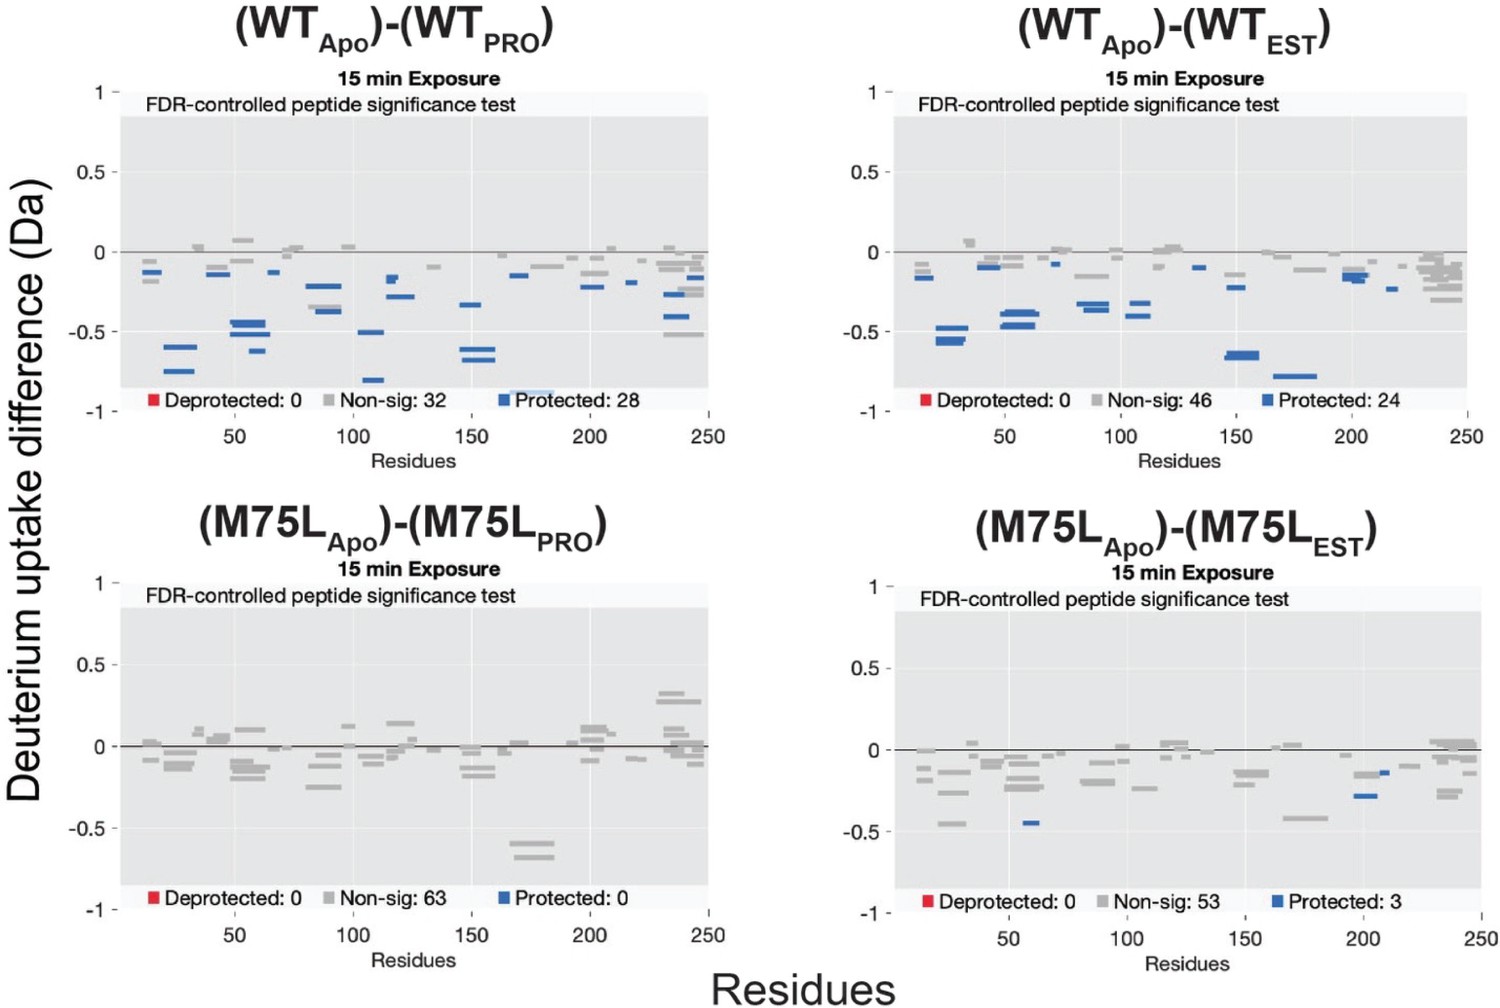
Deuterium exchange difference plots (Time = 15 min) between M75L and AncSR2 apo and ligand-bound states.
AncSR2 in the PRO and EST-bound states showed significantly increased deuterium exchange. In M75L-PRO-bound states, no uptake difference was observed in most protein regions while significant decreased exchange was seen (close to significant threshold value –0.5 Da) in the peptide region (56-63).
Figure 4—figure supplement 3
The relative fractional uptake of AncSR2 and M75L under different states.
(A) Relative fractional uptake of M75L and WT AncSR2 in the apo state. Relative fractional uptake of WT AncSR2 apo state with WT-EST (B) and WT-PRO (C) bound state.
Figure 4—figure supplement 4
Relative fractional uptake of M75L apo state with M75L-EST (A) and M75L-PRO (B) bound state.
Figure 5 with 4 supplements

Contact measurements and conformational analysis of classical MD simulations.
(A) AncSR2 structure indicating positions of M75 along with bound hormone and additional H5 and H3 residues used to determine contact measurements. To assess H3-H5 interhelical distances, measurements were performed between Leu42-Trp71 and Gln41-res75. (B) Average distances between residue 75 (H5) and A-ring of hormones. (C) Average distances between L42 Cα and Trp71 Cα atoms. M75A showed the smallest distances, M75F the largest, with all other complexes in between, indicating that the size of the sidechain determines the interhelical distance. (D) Average distances between Q41 Cα and res75 Cα atoms. This contact follows the same trends observed in (C). Individual data points in B, C, D represent distance measurements averaged over simulations. Each box and whisker representation displays the distribution of calculated distances for the five hormone-bound complexes and apo receptor. The lower bounds for each box in (C and D) correspond to the apo receptors. (E) Two potential explanations for enhanced activity in M75A are the proximity of Q41 (top) and Trp71 (bottom) to hormones, due to the reduced H3-H5 distances. (F) In estradiol-bound M75F, a pi-stacking triad is formed between Trp71, Phe75 and the hormone A-ring. This observation suggests an explanation for why the mutant is selectively activated by 3-ketosteroids but not by estrogens. (G) Simulations predict that the Ile sidechain of M75I is likely to insert into the binding pocket and interfere with ligand binding. This effect is not observed any of the other complexes.
Figure 5—figure supplement 1
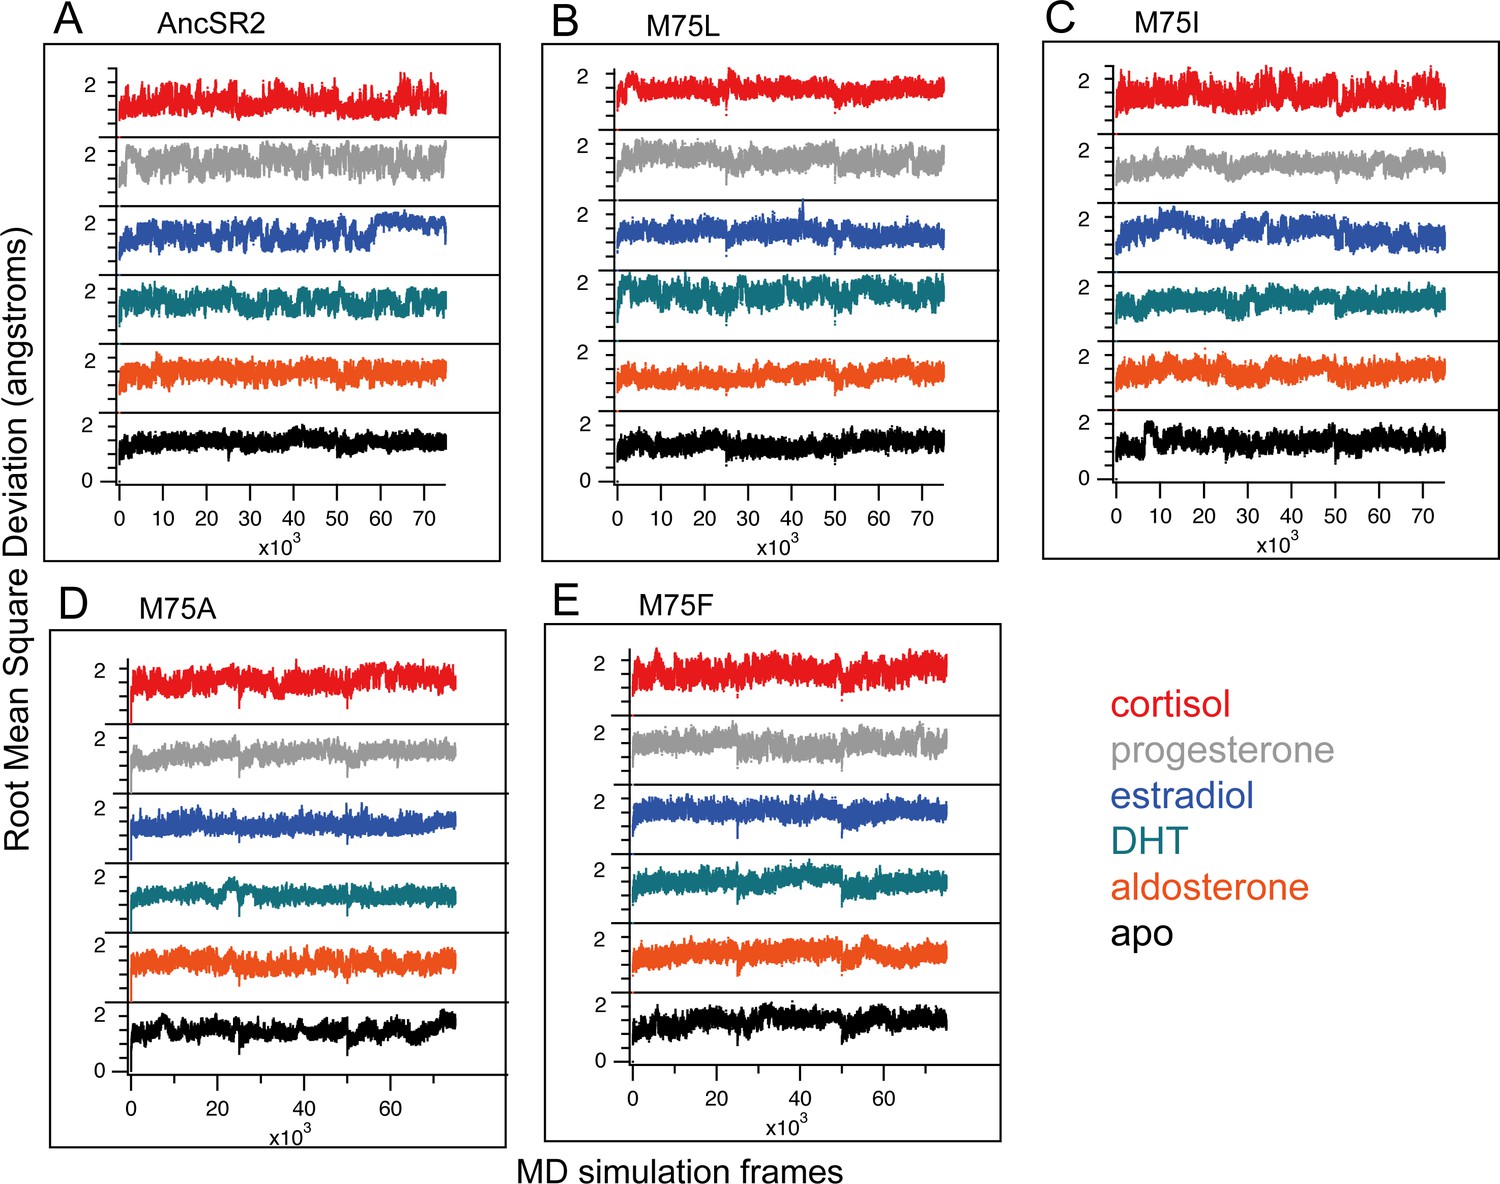
Root mean square deviation (RMSD) calculated for all complexes from classical MD simulations.
Figure 5—figure supplement 2
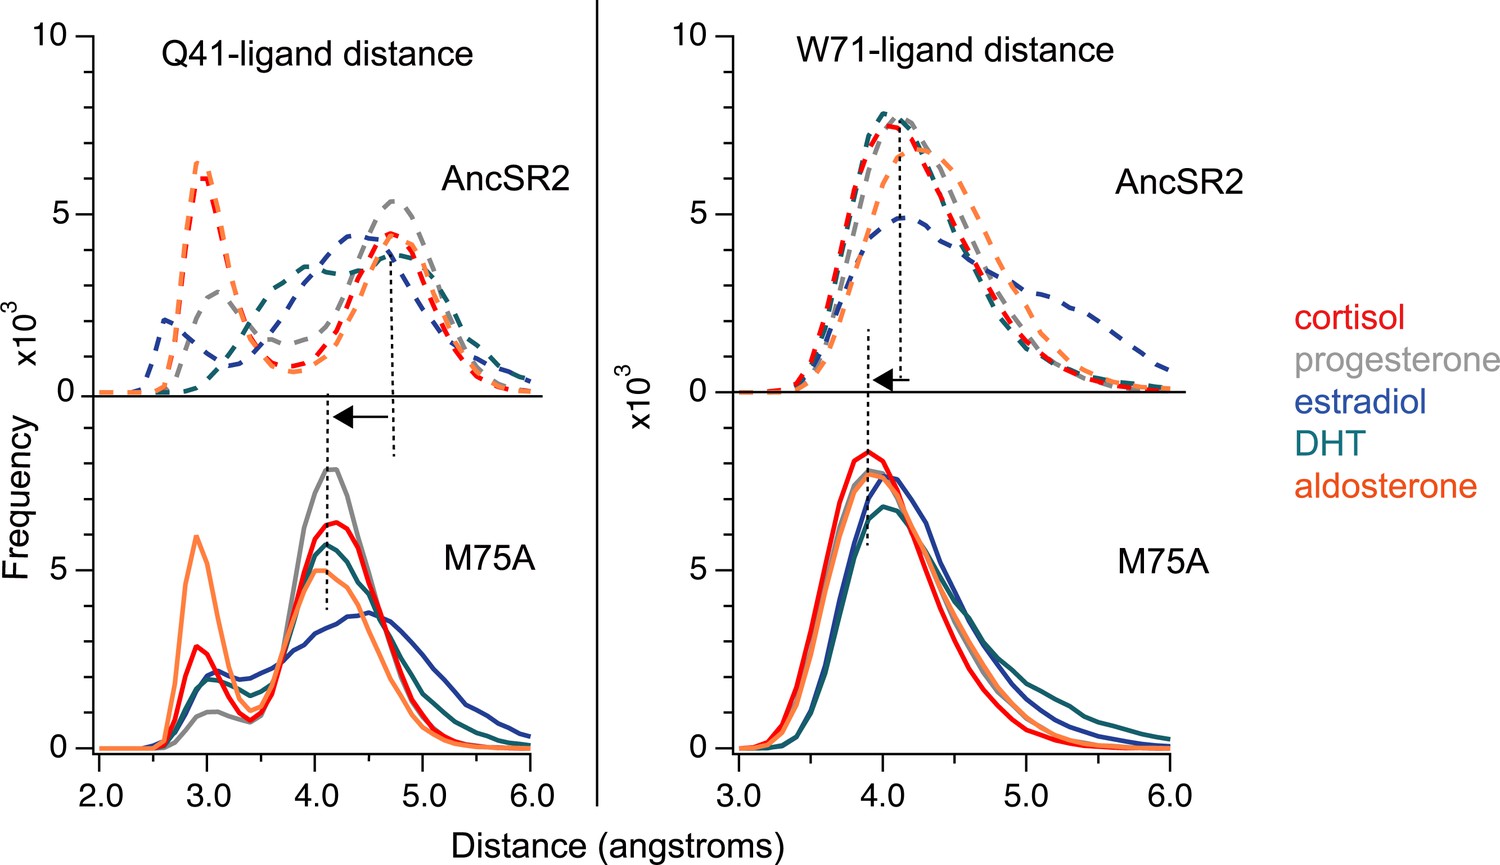
Distribution of calculated distances between Q41-ligand (left) and W71-ligand.
All heavy atoms of either residues or ligands were used to determine the shortest distance between both (See Materials and methods – Analysis). The shortest distances over the length of the trajectory (75,000 points) were binned to generate the plots above.
Figure 5—figure supplement 3
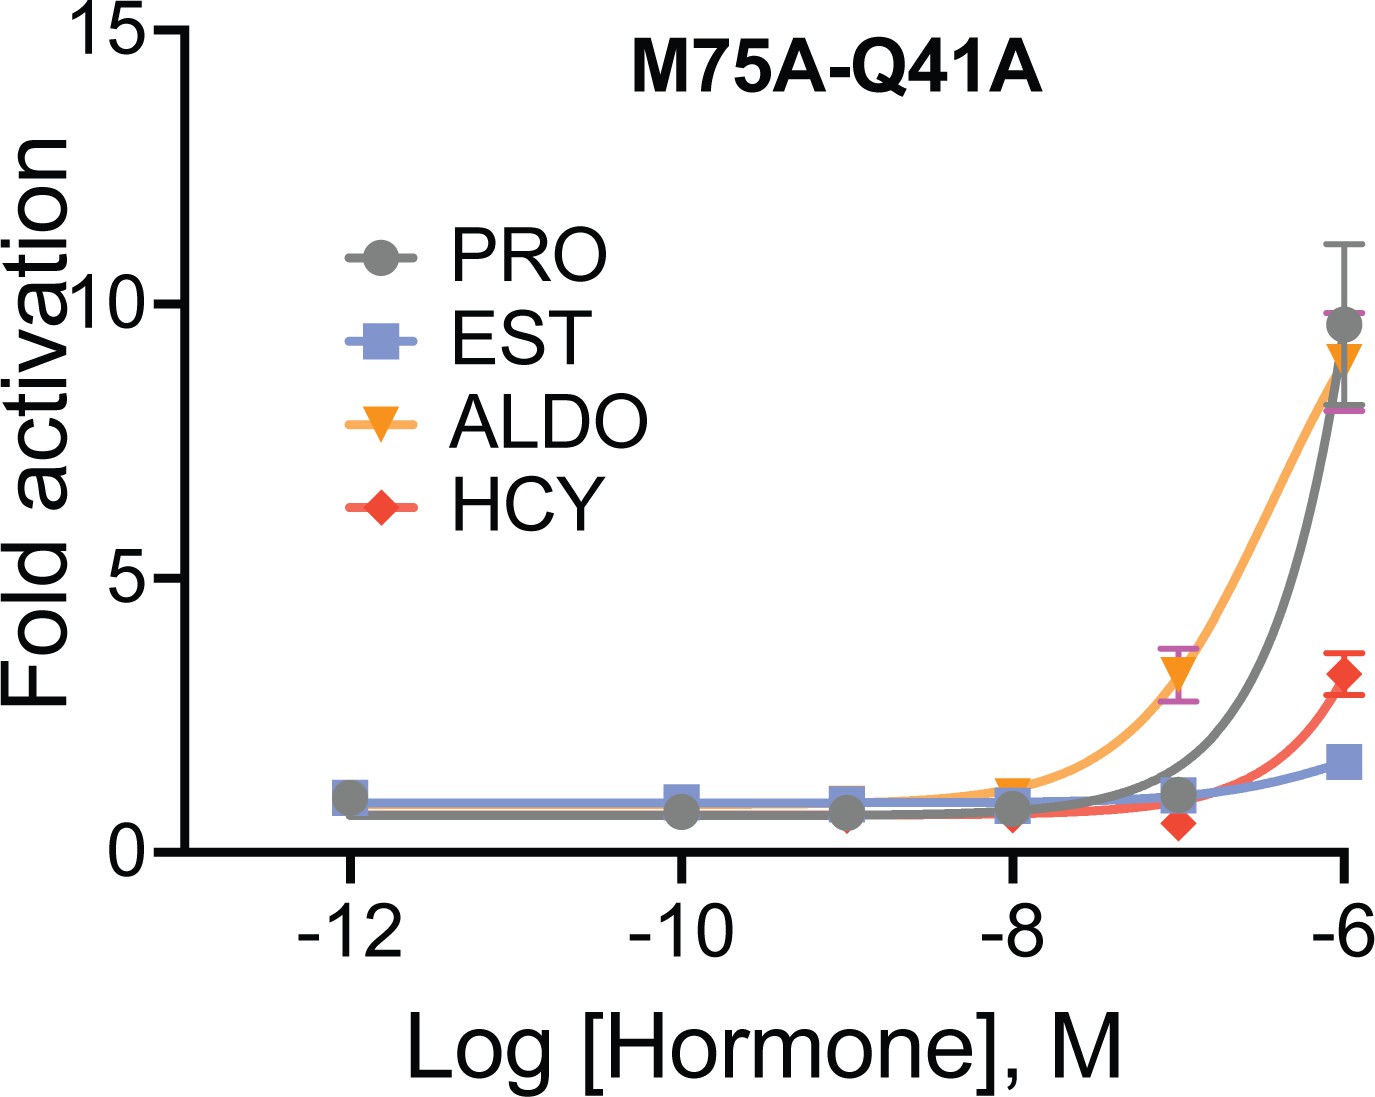
M75A mutant receptor activation response abolished upon substitution of Q41A in the M75A background mutant (M75A-Q41A).
Four different ligands used in the assay: progesterone (PRO), estradiol (EST), aldosterone (ALDO) and hydrocortisone (HCY). Each data point is average of six independent replicates from two biological experiment. The error bar associated with each data point represent SEM.
Figure 5—figure supplement 4
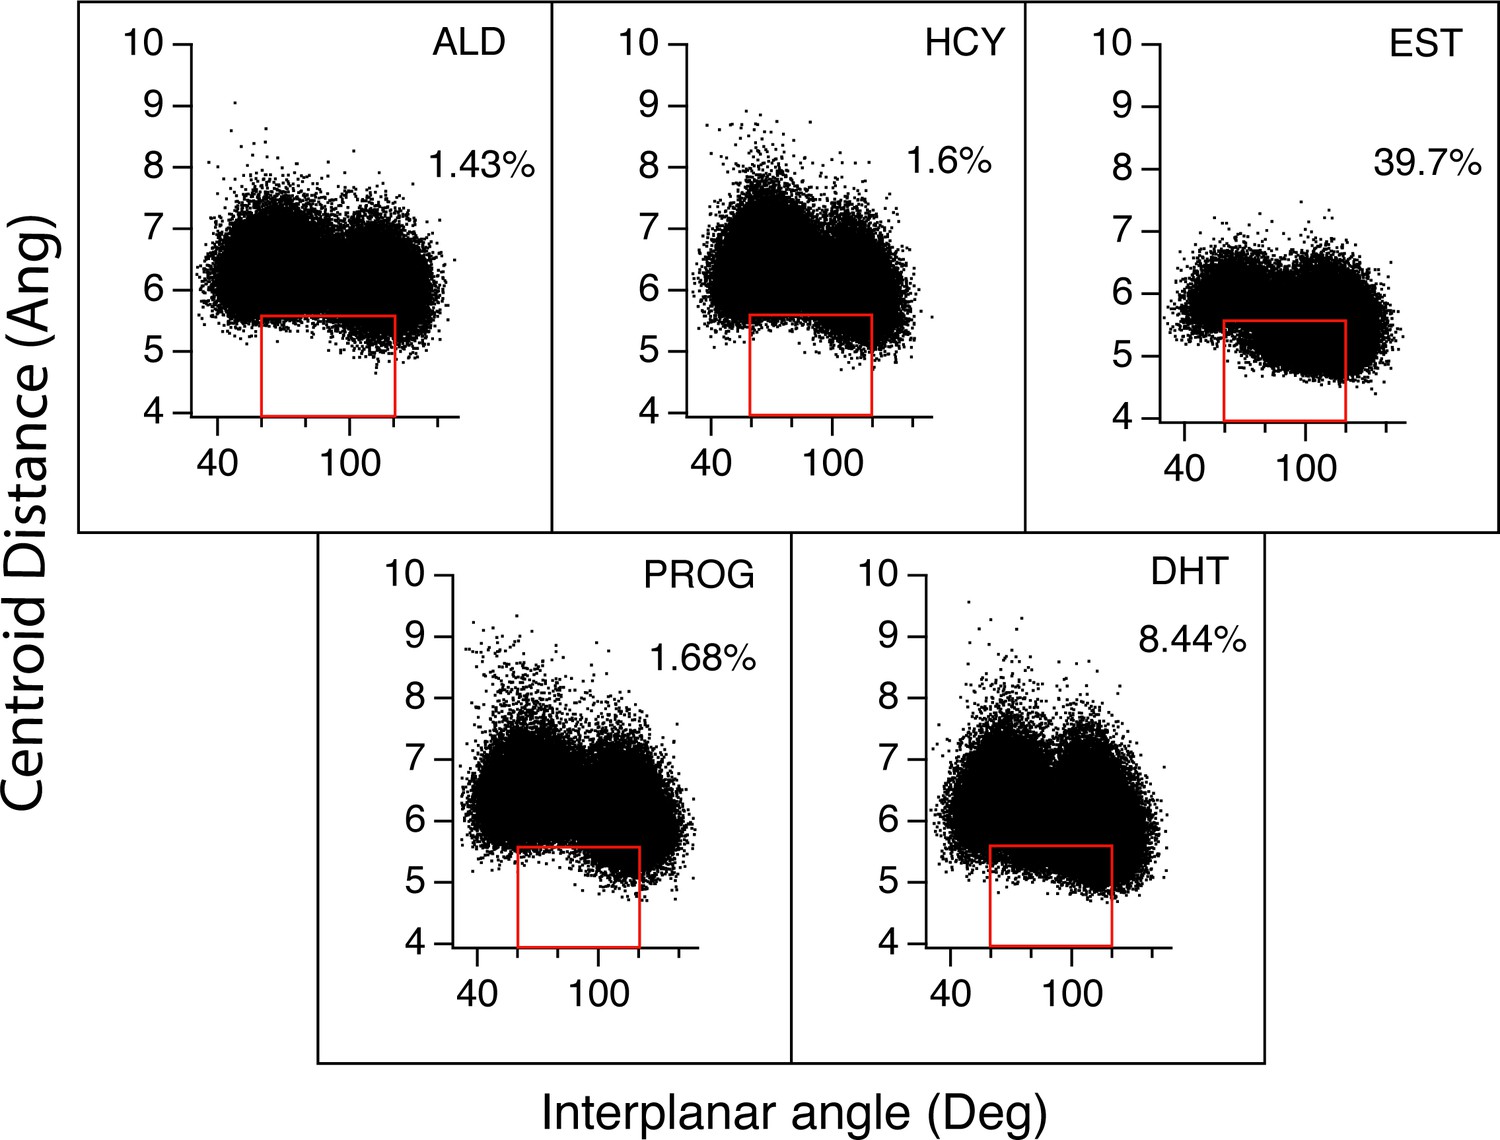
Distances and angles between F75 and W71 are monitored for MD simulations of M75F complexes.
Red boxes indicate when pi stacking occurred between both rings. Numbers indicate the percentage of time spent by both rings in pi-stacking for all complexes.
Figure 6

Clustering of accelerated MD simulations and correlation analysis.
(A) Conformations obtained from accelerated MD simulations of unliganded AncSR2 were co-clustered with frames obtained from M75 mutants. M75A reveals substantial conformational overlap with AncSR2, M75F reveals no AncSR2 overlap while both M75L and M75I stabilize a minor conformational substate of AncSR2. Each stacked cluster represented the population obtained from WT AncSR2 frames (gray) stacked on the fraction obtained from mutant complexes (blue/green/pink/purple). (B–E) For each AncSR2 variant (except M75I), frames from ligand-bound simulations were co-clustered with conformations from the unliganded simulation of the same receptor. In M75A (B), M75L(D) and WT AncSR2 (E) all hormones introduce new conformational states to varying extents. In M75F, all liganded complexes show overlap with the apo receptor. Each stacked cluster represented the population obtained from apo frames (gray) stacked with the fraction of the cluster containing ligand-bound frames (blue/green/pink/black). (F–H) Overlap fraction shows correlation with EC50 (F), and fractional fold activation, measured as fold change at 100 nM (G) and 10 nM (H) ligand divided by Emax/efficacy.
Figure 7 with 2 supplements
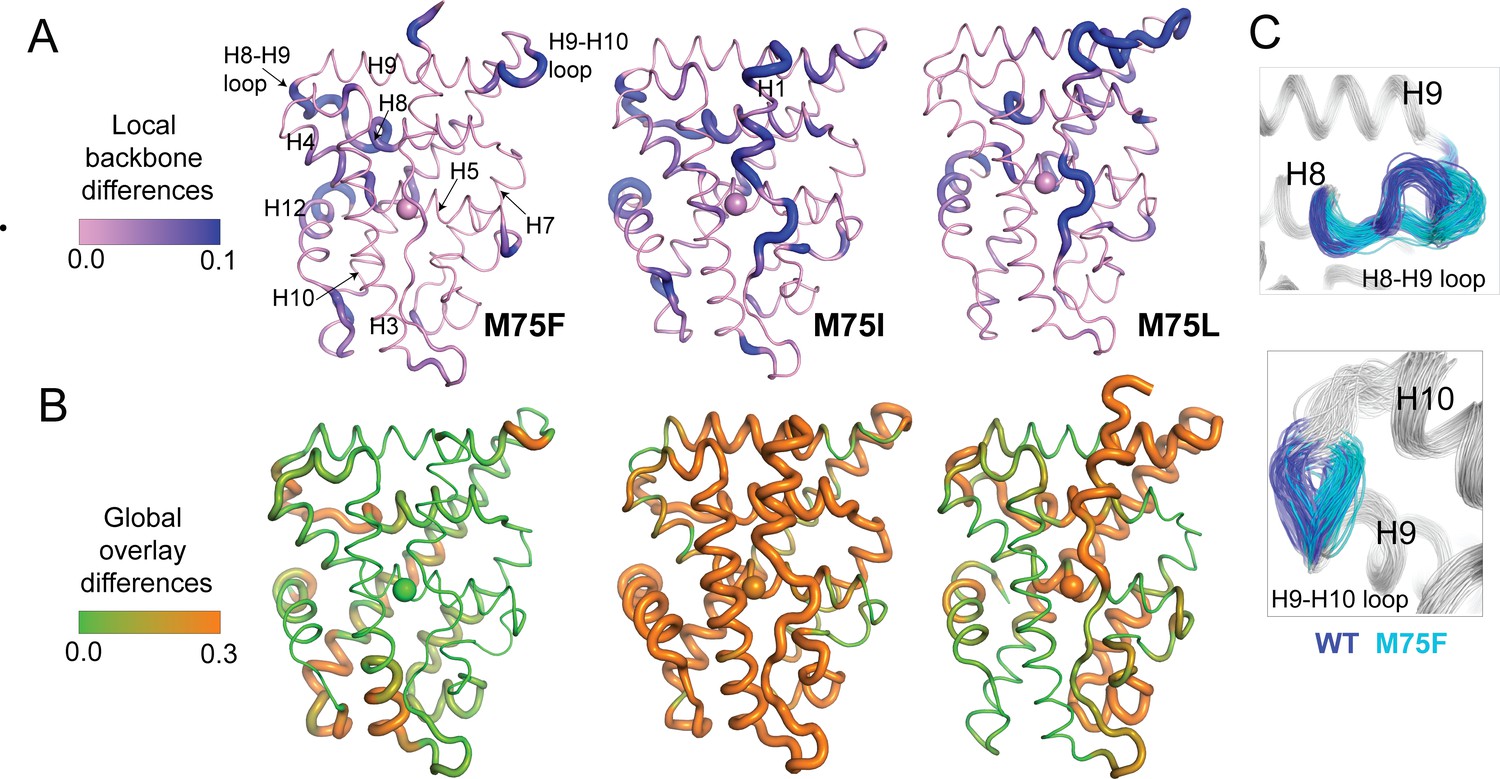
Structural analysis of MD simulations of AncSR2 variants to explain altered transcriptional response.
(A) Ensemblator analysis of local/backbone changes of M75 variants compared to WT AncSR2. Conformational changes are quantified and colored by the discrimination index (DI). Lower DI values indicate regions where structures are nearly identical between WT and mutant receptors while higher DI indicates changes in local backbone angles induced by mutations. Spheres on H5 identify position 75. (B) Ensemblator analysis of global changes in M75 mutants compared to WT. Structures are globally overlaid prior to analysis. Structures are colored by DI, where lower values correspond to highly similar regions in superimposed structures while higher values indicate regions of structural dissimilarity. Spheres on H5 identify position 75. (C) Overlay of 200 structures used for Ensemblator analysis showing conformational changes observed in H8-H9 and H9-H10 loops. Structures from WT AncSR2 are colored blue while mutant structures are shown in cyan, illustrating that structural variations are the result of mutation.
Figure 7—figure supplement 1
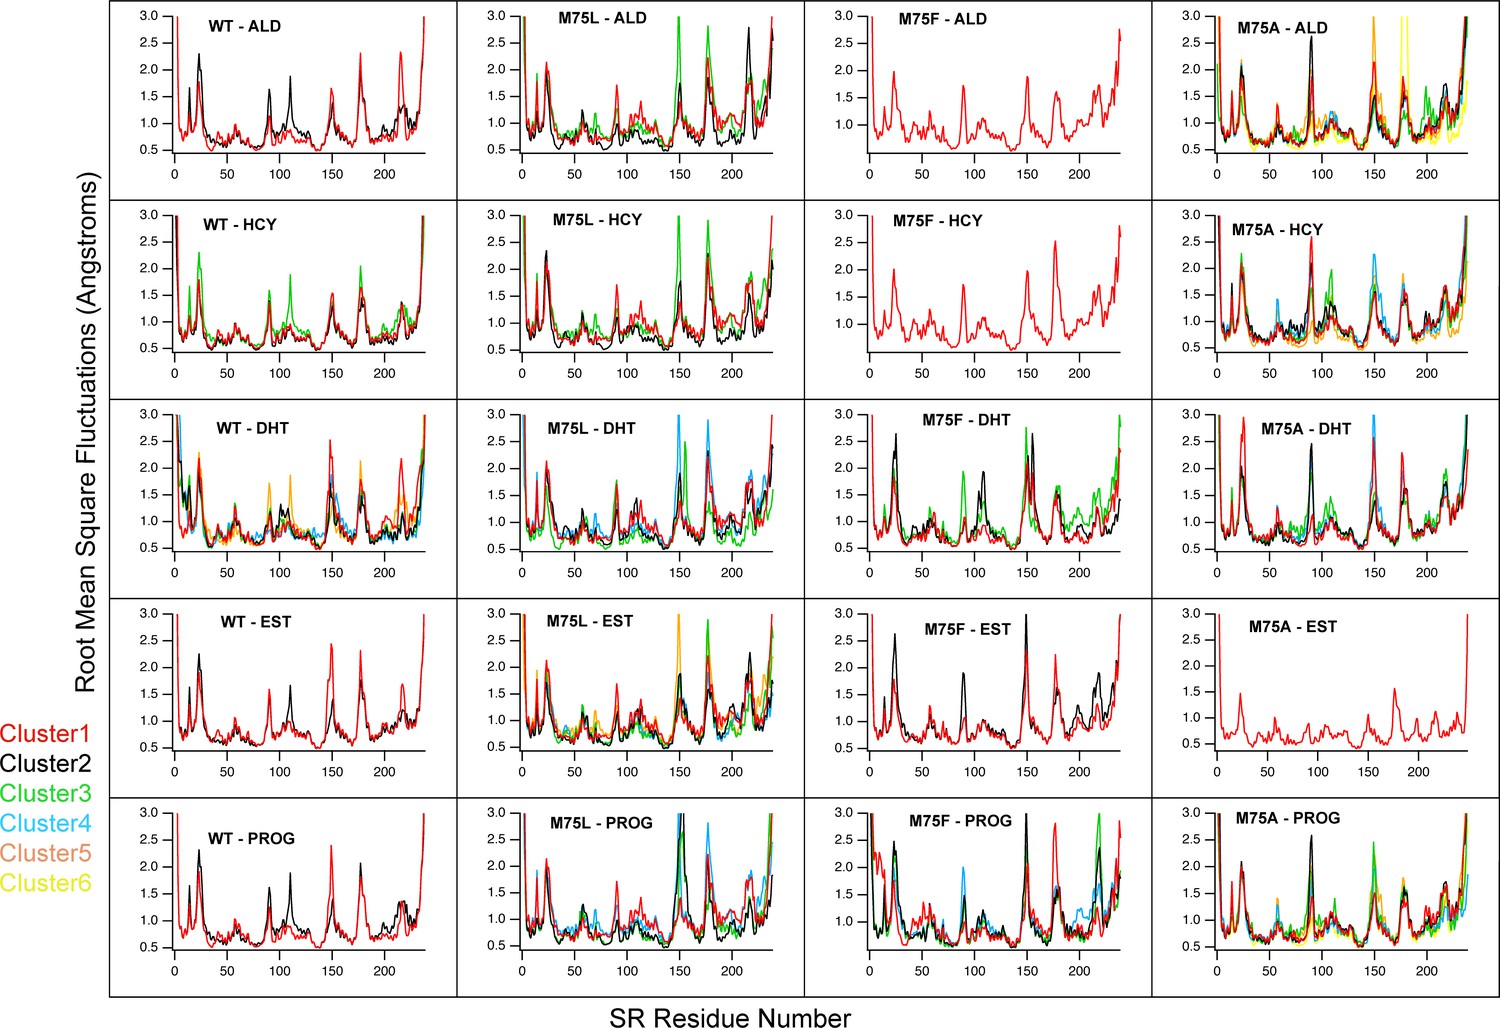
Root mean square fluctuations (RMSF) for each cluster, by receptor-ligand complex.
Each graph contains the number of curves corresponding to the number of clusters from that analysis. Each curve is the calculated RMSF of all PDB frames in that cluster.
Figure 7—figure supplement 2
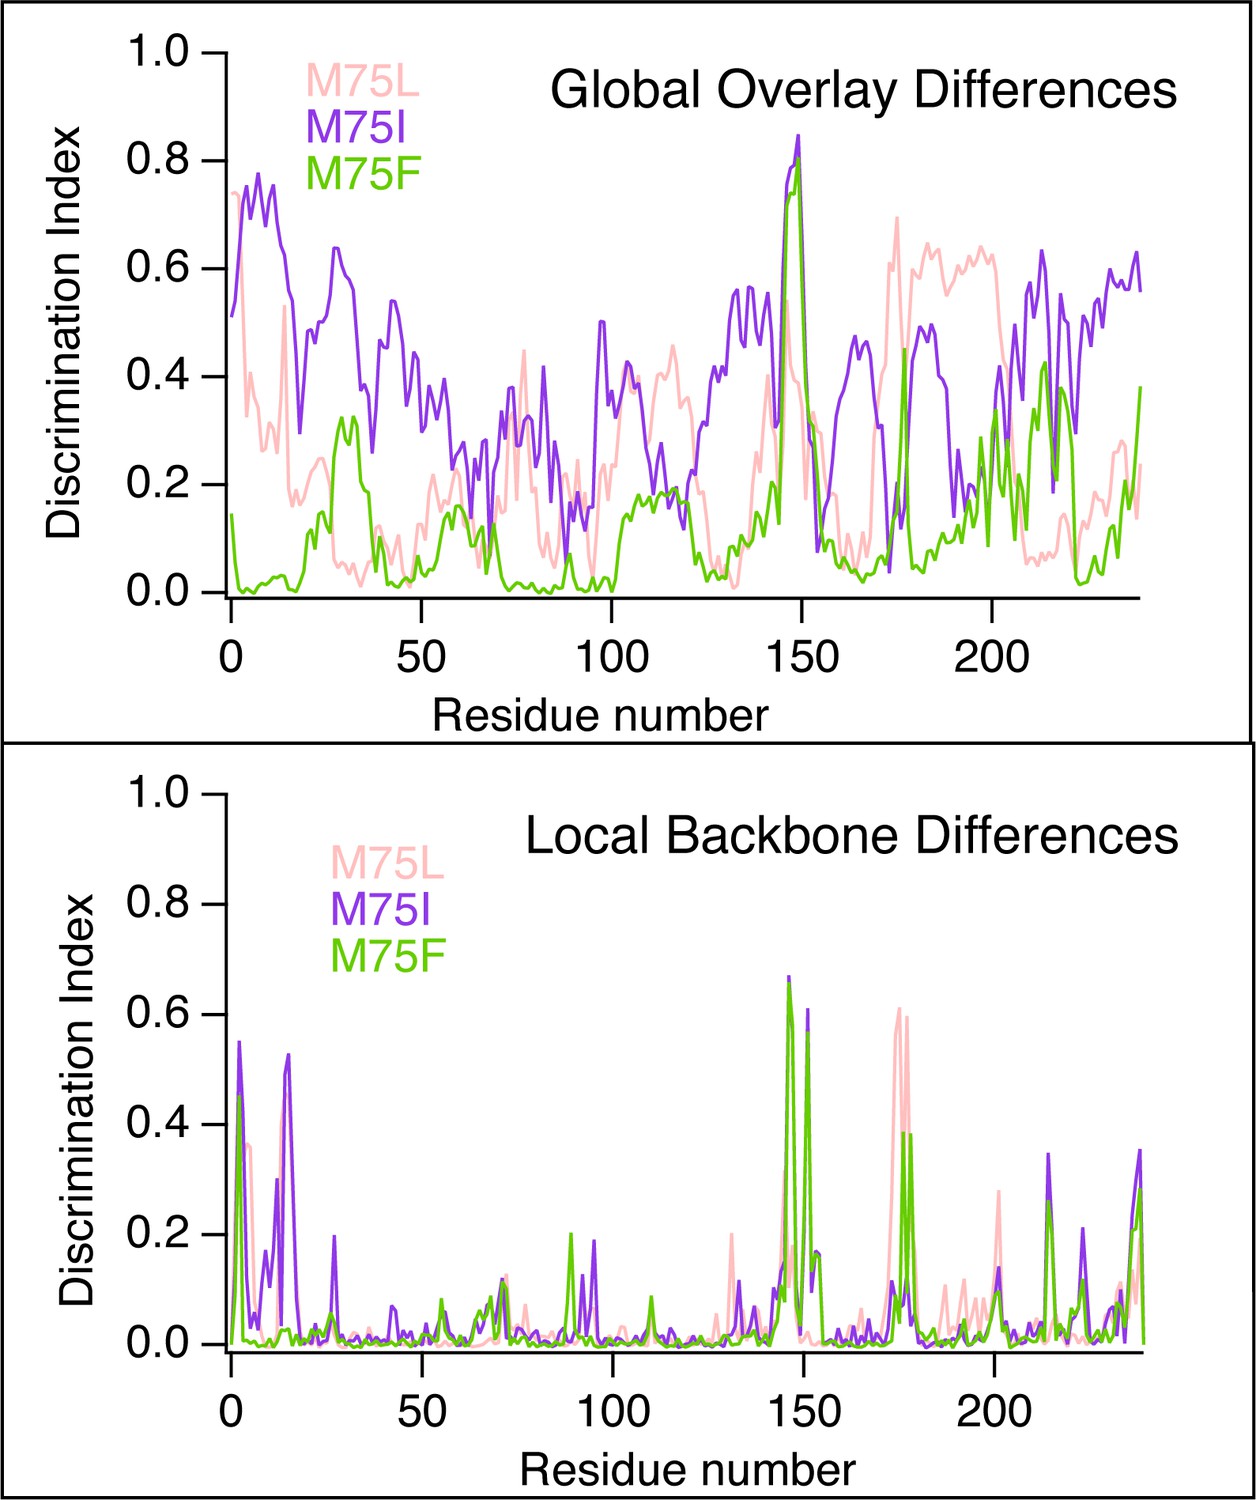
Discrimination Scores reporting on the global and local conformational differences between ensembles of WT AncSR2 and mutants.
Scheme 1

Synthesis of 11-DOC-FAM from 11-deoxycorticosterone.
Tables
Key resources table
| Reagent type (species) or resource | Designation | Source or reference | Identifiers | Additional information |
|---|---|---|---|---|
| Strain, strain background (Escherichia coli) | BL21(DE3) | New England Biolabs | C2527 | Chemically competent cells |
| Strain, strain background (Escherichia coli) | DH5α | New England Biolabs | C2987 | Chemically competent cells |
| Cell line (Homo-sapiens) | Hela | ATCC | - | Cell lines maintained in Penn State Sartorius Cell Culture facility |
| Cell line (Homo-sapiens) | CHO | ATCC | - | Cell lines maintained in Penn State Sartorius Cell Culture facility |
| Antibody | Anti-Gal4-DBD (Mouse monoclonal): (RK5C1) | Santacruz Biotechnology | sc-510 | WB (1:200) |
| Antibody | m-IgG Fc BP-HRP (Mouse polyclonal) | Santacruz Biotechnology | sc-525409 | WB (1:1000) |
| Antibody | Anti-actin (rabbit polyclonal) | Sigma | A2066 | WB (1:8000) |
| Antibody | Goat-anti Rabbit IgG H+L (HRP) (Goat polyclonal) | Abcam | Ab97051 | WB (1:5000) |
| Recombinant DNA reagent | pSG5-Gal4-DBD fused LBD (plasmid) | Reference Eick et al., 2012 | - | Eick et al., 2012, Plos Genetics |
| Sequence-based reagent | M75L_F | IDT | PCR primers | 5'- CTGGATGGGCCTGTTGGCCTTCGCCAT-3’ |
| Sequence-based reagent | M75L_R | IDT | PCR primers | 5’- ATGGCGAAGGCCAACAGGCCCATCCAG –3' |
| Sequence-based reagent | M75A_F | IDT | PCR primers | 5’-CCTGGATGGGCCTGGCGGCCTTCGCCATGG-3’ |
| Sequence-based reagent | M75A_R | IDT | PCR primers | 5’-CCATGGCGAAGGCCGCCAGGCCCATCCAGG-3’ |
| Sequence-based reagent | M75F_F | IDT | PCR primers | 5’- CTGGATGGGCCTGTTCGCCTT CGCCATGG-3’ |
| Sequence-based reagent | M75F_R | IDT | PCR primers | 5’-CCATGGCGAAGGCG AACAGGCCCATCCAG-3’ |
| Sequence-based reagent | M75I_F | IDT | PCR primers | 5’-CCTGGATGGGC CTGATAGCCTTCGCCATG-3’ |
| Sequence-based reagent | M75I_R | IDT | PCR primers | 5’-CATGGCGAAGGCTATCAGGCC CATCCAGG-3’ |
| Sequence-based reagent | M75A-Q41A_F | IDT | PCR primers | 5'-GGCTGGCCGAGA AGGCGCTGGTGTCTGTGG-3' |
| Sequence-based reagent | M75A-Q41A_R | IDT | PCR primers | 5'-CCACAGACACCAG CGCCTTCTCGGCCAGCC-3' |
| Commercial assay or kit | Nucleospin Plasmid purification kit | Clontech | Clontech:639647 | Used for Plasmid DNA purification according to manufacturer’s protocol. |
| Commercial assay or kit | Dual-Glo Luciferase kit | Promega | E2980 | - |
| Chemical compound | FuGENE HD | Promega | E2311 | - |
| chemical compound, drug | β-Estradiol | Sigma Aldrich | E8875 | - |
| chemical compound, drug | Progesterone | Acros Organics | AC225650050 | - |
| chemical compound, drug | Aldosterone | CAYMAN Chemical | 15273 | - |
| Chemical compound, drug | Hydrocortisone 98% 1GR | Acros Organics | AC352450010. 103515–190 | - |
| Chemical compound, drug | 11-Deoxycorticosterone Acetate 97% | Acros Organics | 460470010 | - |
| Chemical compound, drug | Dihydrotestosterone(DHT) | Selleckchem.com | S4757 | - |
| Chemical compound, drug | Dimethyl Sulfoxide (DMSO) | VWR | BDH115-1LP | - |
| Chemical compound, drug | Glycine 99+%, Molecularbiology grade, Ultrapure | Thermo Fisher Scientific | J16407-A1 | - |
| Chemical compound, drug | Ammonium Persulfate 98+% ACS reagent | Millipore Sigma | 248614–500 G | - |
| Chemical compound, drug | Glycerol Certified ACS | Fisher Scientific | G33-4 | - |
| Chemical compound, drug | DL-Dithotheitol | Sigma-Aldrich | D0632-5G | - |
| Chemical compound, drug | DL-Dithotheitol | Alfa Aesar | A15797 | - |
| Commercial assay or kit | Quick Start Bradford 1 X | Bio-Rad | 5000205 | Used according to manufacturer’s protocol |
| Commercial assay or kit | Pierce ECL Western Blotting substrate | ThermoFisher Scientific | 32109 | Used according to manufacturer’s protocol |
| Software, algorithm | Prism 9 | Graph Pad Prism | GPS-1988381 | - |
| Software, algorithm | AMBER 2020 | Case, 2020 | https://ambermd.org | |
| Software, algorithm | Carma | Glykos, 2006 | https://utopia.duth.gr/ glykos/Carma.html | |
| Software, algorithm | MMTSB | Feig et al., 2004 | http://blue11.bch.msu.edu/mmtsb/Main_Page | |
| Software, algorithm | VMD | Humphrey et al., 1996 | RRID: SCR_001820 | |
| Other | Yeast Extract Powder | RPI | Y200250 | Used for preparation of Luria Bertini Media. See in Methods subsection section’s “Cloning, expression, and purification of ligand binding domain of WT and mutants” |
| Other | Tryptone | RPI | T60060 | Used for preparation of Luria Bertini Media. See in Methods subsection section’s “Cloning, expression, and purification of ligand binding domain of WT and mutants” |
| Other | Trypsin | Corning | 25–053 C1 | See Methods subsection Western blotting and Luciferase reporter assay |
| Other | Fetal Bovine Serum | Corning | 35-072CV | See Methods subsection Western blotting and Luciferase reporter assay |
| Other | Phosphate- Buffered Saline | Corning | 21–040-CV | Used for washing of Hela and CHO cells during cell passage. See Methods subsection Western blotting and Luciferase reporter assay |
| Other | NaCl | RPI | Y200250 | Used for preparation of Luria Bertini Media and different buffers. See in Methods subsection section’s “Cloning, expression, and purification of ligand binding domain of WT and mutants” |
| Other | Ethidium Bromide solution | VWR | 97064–970 | Used to visualize electrophoresed DNA. See Methods subsection “Cloning, expression, and purification of ligand binding domain of WT and mutants” |
| Other | Tris-Base | Fisher Scientific | BP152-500 | For preparation of protein purification buffers. See in Methods subsection section’s “Cloning, expression, and purification of ligand binding domain of WT and mutants” |
| Other | HEPES | Fisher Scientific | BP310-500 | Used in ligand binding assay. See Methods subsections “Cloning, expression, and purification of ligand binding domain of WT and mutants” and ligand binding assay |
| Other | Sodium Deoxycholate | Sigma | D6750 | See Methods subsection Western blotting |
| Other | 3X-Gel loading dye | New England Biolabs | B7703 | For protein sample load during SDS-PAGE (Figure 1—figure supplement 1). See Methods subsection “Cloning, expression, and purification of ligand binding domain of WT and mutants” |
| Other | 6X-Gel loading dye | New England Biolabs | B7025S | For DNA loading on agarose gels. See Methods subsection “Cloning, expression, and purification of ligand binding domain of WT and mutants” |
| Other | Pre-stained Protein Ladder | New England Biolabs | P04772S | See Methods subsection “Cloning, expression, and purification of ligand binding domain of WT and mutants” |
| Other | Every Blot Blocking Buffer | Bio-Rad | 12010020 | Used according to manufacturer’s protocol. See Methods subsection Western blotting. |
| Other | Syringe filter (0.22 micron) | Fisherbrand | 09-720-511 | See Methods subsection “Cloning, expression, and purification of ligand binding domain of WT and mutants.” |
| Other | Halt Protease & Phosphatase Inhibitor | ThermoFisher Scientific | 78440 | Used according to manufacturer’s protocol. See Methods subsection Western blotting |
| Other | Amicon-Ultra-15 | Millipore, USA | UFC901024 | See in Methods subsection section’s “Cloning, expression, and purification of ligand binding domain of WT and mutants” |
| Other | EcoRI-HF | New England Biolabs | R3101S | Used according to manufacturer’s protocol. See in Methods subsection “Cloning, expression, and purification of ligand binding domain of WT and mutants” |
| Other | HindIII-HF | New England Biolabs | R3104S | Used according to manufacturer’s protocol. See in Methods subsection “Cloning, expression, and purification of ligand binding domain of WT and mutants” |
| Other | DpnI | New England Biolabs | R0176S | Used according to manufacturer’s protocol for methylated DNA stand degradation. See Methods subsection “Cloning, expression, and purification of ligand binding domain of WT and mutants” |
| Other | Nuvia-IMAC | Bio-Rad | 780–0812 | See Methods subsection “Cloning, expression, and purification of ligand binding domain of WT and mutants” |
| Other | ENrich SEC70 | Bio-Rad | 7801070 | See Methods subsection “Cloning, expression, and purification of ligand binding domain of WT and mutants” |
| Other | ENrich SEC650 | Bio-Rad | 7801650 | See Methods subsection “Cloning, expression, and purification of ligand binding domain of WT and mutants” |
Additional files
-
Supplementary file 1
Oligonucleotide primers used for site-directed mutagenesis.
- https://cdn.elifesciences.org/articles/80140/elife-80140-supp1-v1.docx
-
Supplementary file 2
Fractional populations for clusters.
- https://cdn.elifesciences.org/articles/80140/elife-80140-supp2-v1.docx
-
MDAR checklist
- https://cdn.elifesciences.org/articles/80140/elife-80140-mdarchecklist1-v1.docx
Download links
A two-part list of links to download the article, or parts of the article, in various formats.
Downloads (link to download the article as PDF)
Open citations (links to open the citations from this article in various online reference manager services)
Cite this article (links to download the citations from this article in formats compatible with various reference manager tools)
Ligand-induced shifts in conformational ensembles that describe transcriptional activation
eLife 11:e80140.
https://doi.org/10.7554/eLife.80140


