Depletion or cleavage of cohesin during anaphase differentially affects chromatin structure and segregation
- DNA motors Group, MRC London Institute of Medical Sciences, United Kingdom
- Institut Pasteur, CNRS UMR 3525, Université Paris Cité, Unité Régulation Spatiale des Génomes, France
Figures
Figure 1 with 2 supplements
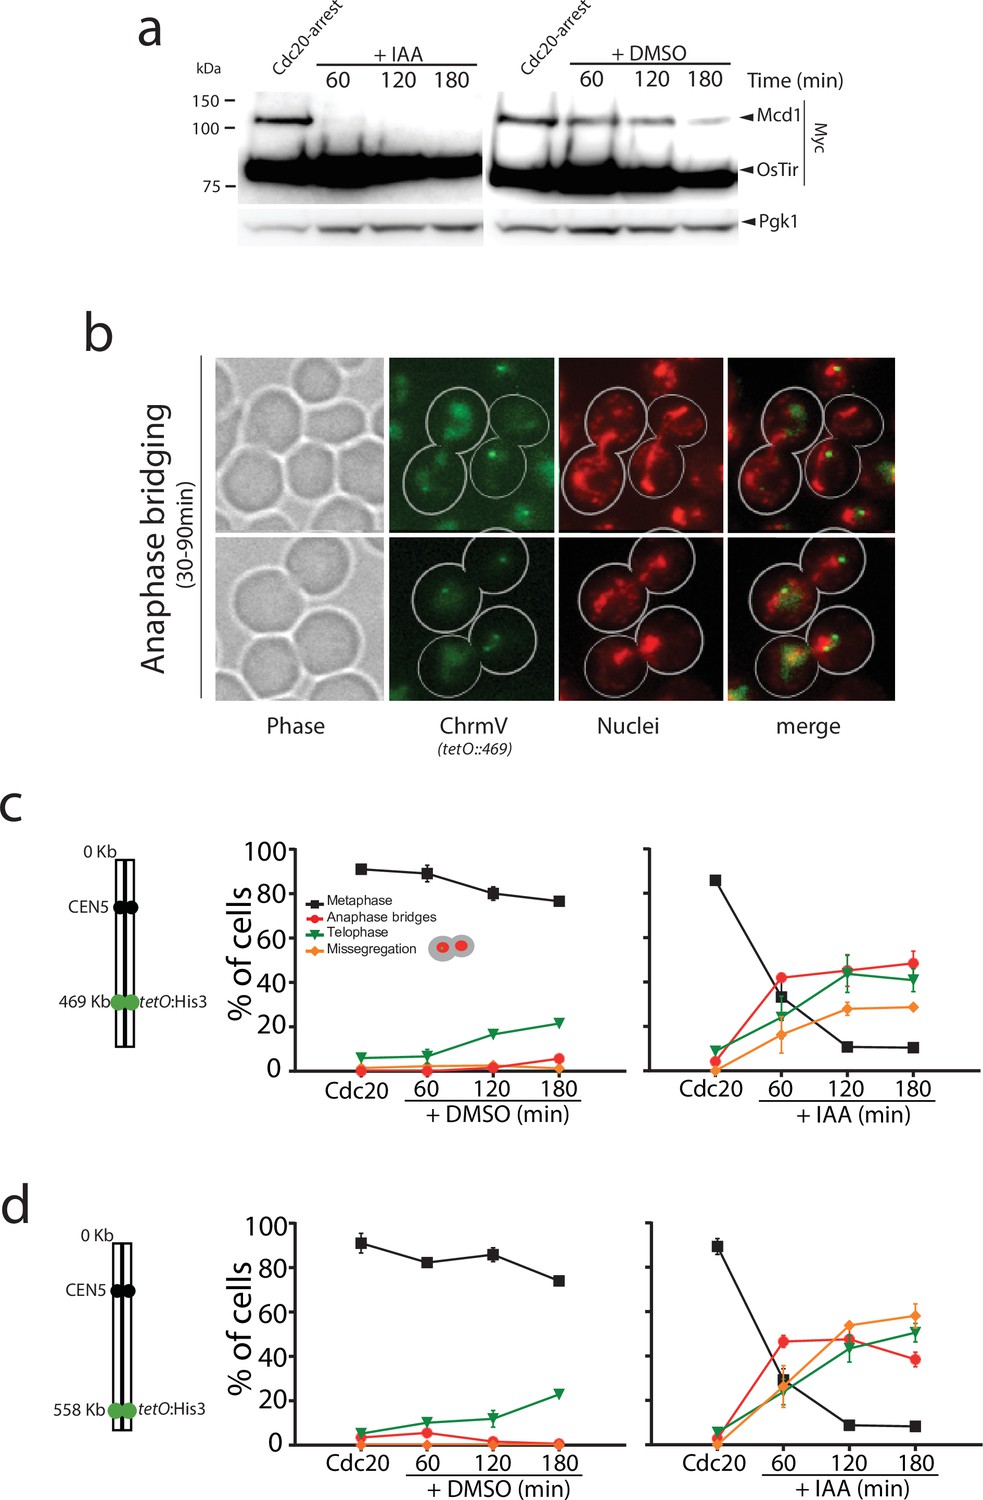
Mcd1 degradation causes catastrophic chromosome segregation.
(a) Cells containing MCD1 tagged with the auxin degron (MCD1-AID) were arrested in metaphase (Cdc20 arrest). The culture was split in two, one half was treated with DMSO and the other with 6 mM auxin (IAA) to degrade Mcd1. Samples were taken for an anti-Myc immunoblotting to detect Mcd1. (b) Representative images of cells 30–90 min after degradation of Mcd1. Cells were analysed for nuclear separation (DAPI stain, red) and chromosome segregation (green fluorescent protein [GFP] dots marking the middle of chromosome V; tet:469, green). (c) Analysis of nuclear and chromosome segregation using DAPI and GFP dots marking the middle of chromosome V (tet:469). Experimental conditions for the timecourse are as described in (a). Each timepoint represents the average of the percentage of three biological replicas of at least 100 cells per timepoint. Error bars show SEM. (d) Analysis of nuclear and chromosome segregation using DAPI and GFP dots marking the telomeric region of chromosome V (tet:558). Experimental conditions for the timecourse are as described in (a). Each timepoint represents the average of the percentage of three biological replicas of at least 100 cells per timepoint. Error bars show SEM.
-
Figure 1—source data 1
Source data 1 contains two blots shown in main Figure 1a.
- https://cdn.elifesciences.org/articles/80147/elife-80147-fig1-data1-v2.zip
Figure 1—figure supplement 1
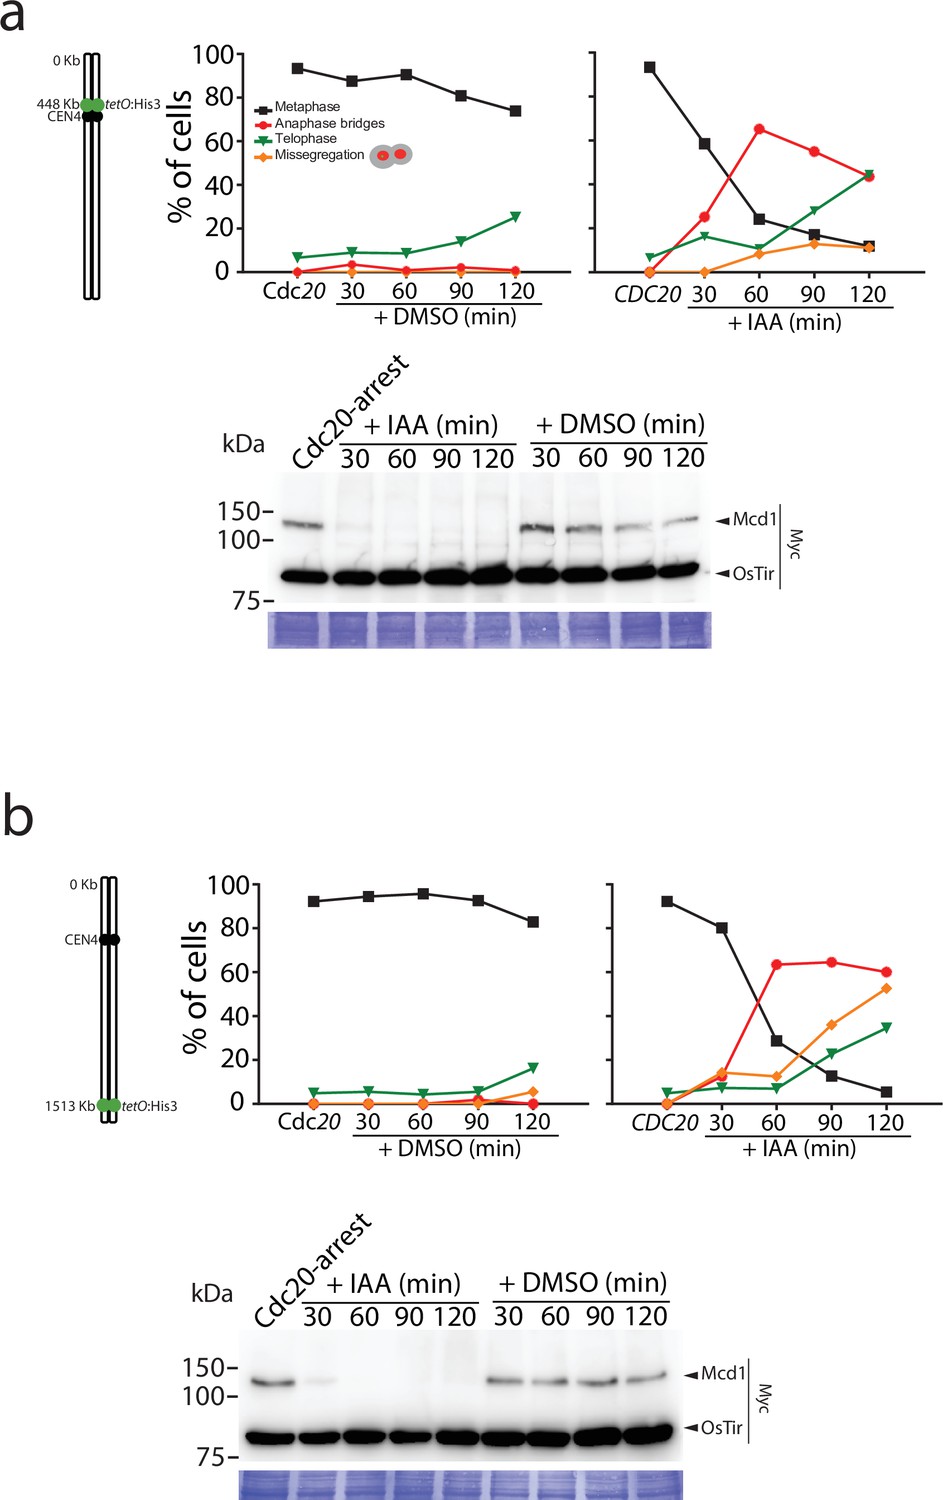
Mcd1 degradation causes catastrophic segregation of large chromosomes.
(a) Cells with MCD1 tagged with the auxin degron (MCD1-AID) and with the centromere of the chromosome IV (tetO::448) marked with green fluorescent protein (GFP) were synchronised in metaphase (Cdc20). The culture was split in two, one of them was treated with DMSO 1% and the other with 1 mM of IAA to degrade Mcd1-AID. Samples were collected at the indicated timepoints and chromosome segregation analysis (top) and immunoblotting to follow Mcd1-aid (bottom) was performed. (b) Cells treated as in (a), but with the subtelomere of chromosome IV (tetO::1513) marked with GFP. Each timepoint represents the percentage of cells at the indicated cell cycle stage. At least 100 cells were quantified for each timepoint.
-
Figure 1—figure supplement 1—source data 1
One blot shown.
- https://cdn.elifesciences.org/articles/80147/elife-80147-fig1-figsupp1-data1-v2.zip
-
Figure 1—figure supplement 1—source data 2
One blot shown.
- https://cdn.elifesciences.org/articles/80147/elife-80147-fig1-figsupp1-data2-v2.zip
Figure 1—figure supplement 2
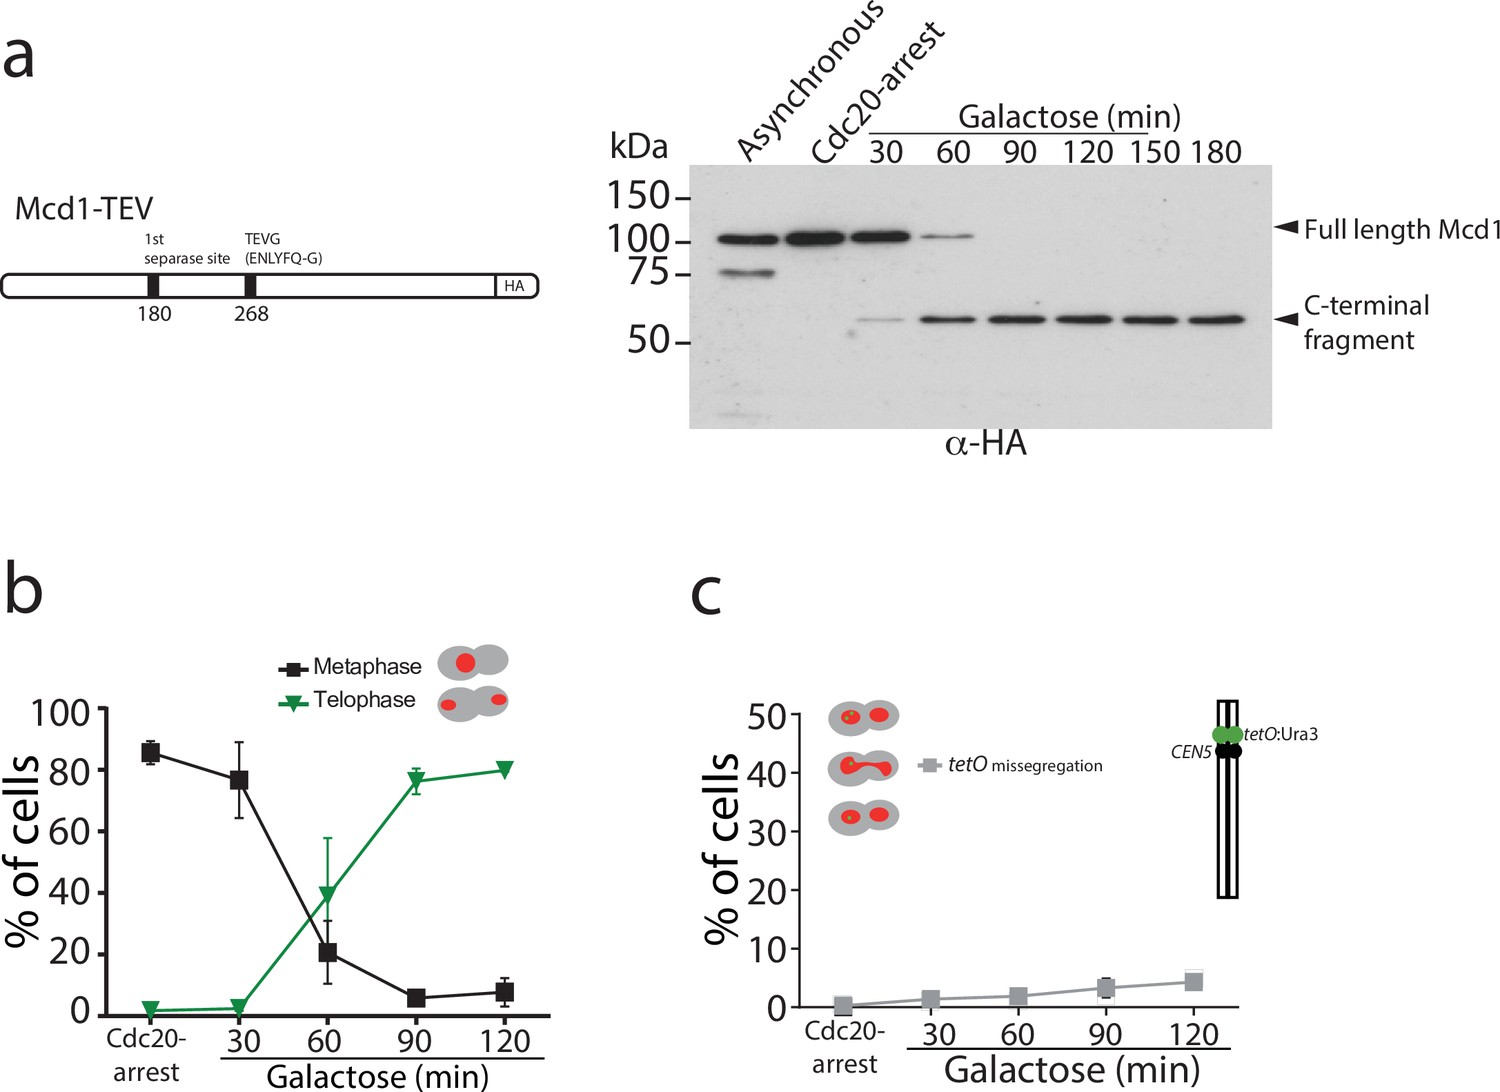
TEV-mediated cleavage of Mcd1 allows nuclear segreagation.
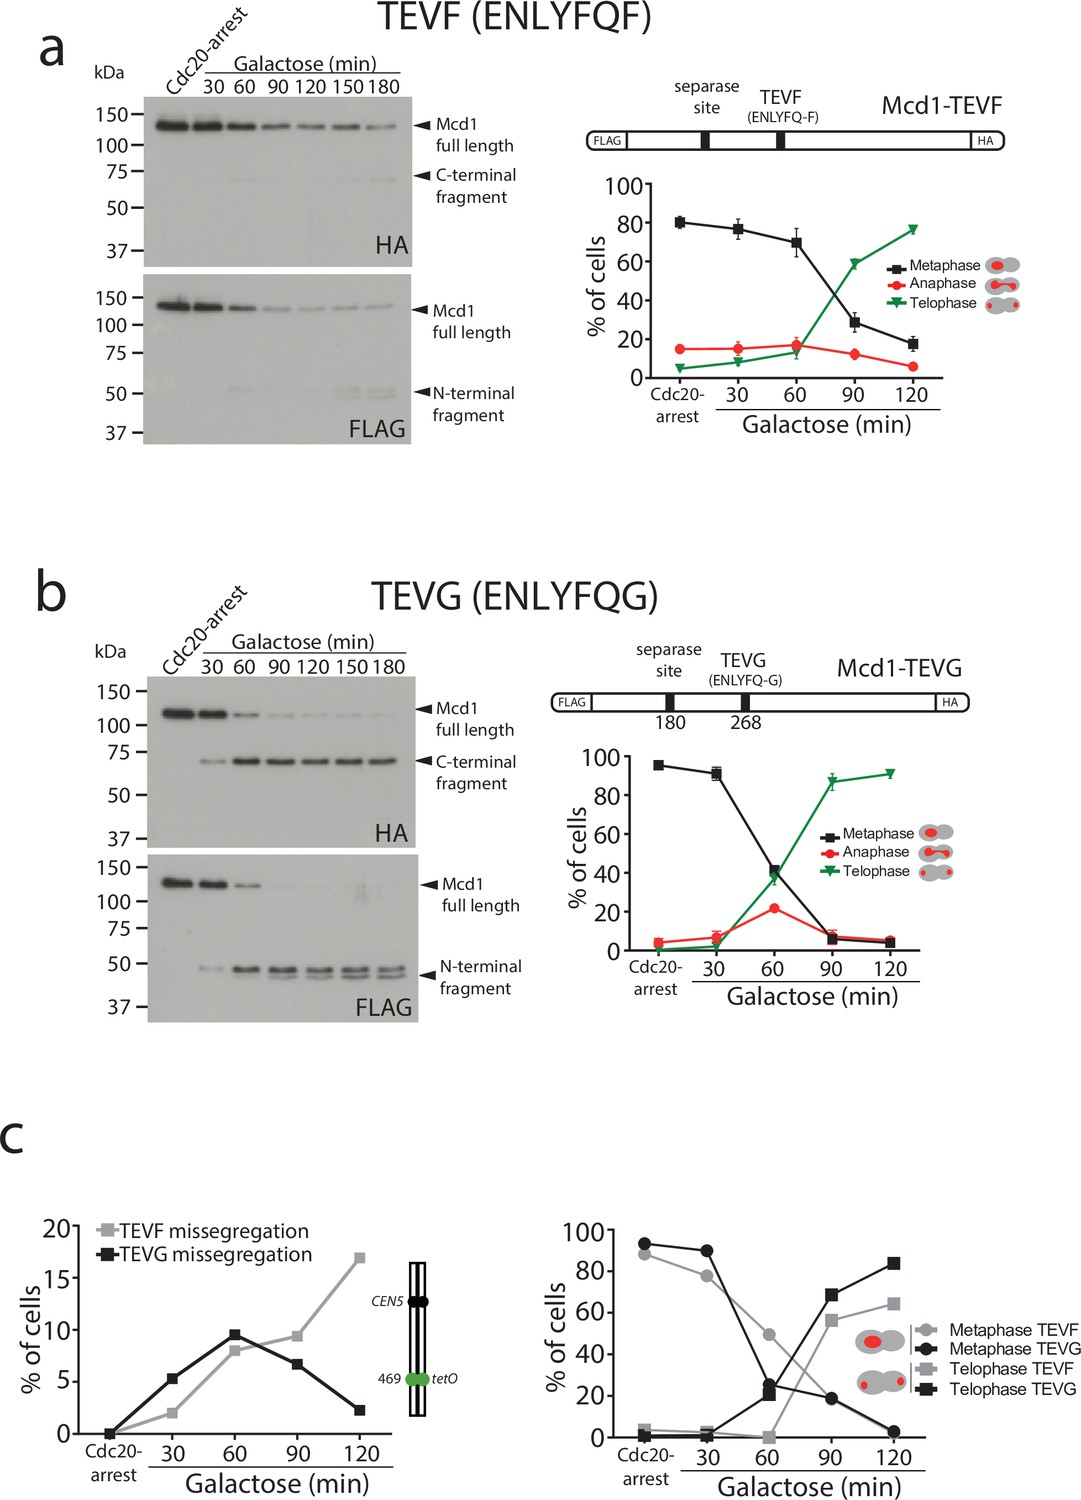
(a) Schematic of engineered MCD1 with the wild-type separase cleavage site maintained in the position 180 and the separase cleavage position 268 replaced by the tobacco etch virus (TEV) cleavage sequence ENLYFQG (upper panel). Cells were arrested in metaphase (Cdc20 arrest) and induced to express TEV protease. Samples were taken every 30 min for 3 hr for immunoblotting against HA epitope to follow the C-terminus of Mcd1. (b) Nuclear segregation in TEV-induced anaphase. Nuclear segregation was monitored using DAPI staining of cells. Experimental protocol as in (a). (c) Chromosome segregation in TEV-induced anaphase. Chromosome tags inserted in a centromere proximal site (Ura3::tetO) on chromosome V were monitored for segregation. Experimental protocol as in (a). Each timepoint represents the average of the percentage of two biological replicas of at least 100 cells at the indicated cell cycle stage. Error bars represent the SEM.
-
Figure 1—figure supplement 2—source data 1
Source data 2 contains one blot shown in Figure 1—figure supplement 2.
5 blots shown.
- https://cdn.elifesciences.org/articles/80147/elife-80147-fig1-figsupp2-data1-v2.zip
Figure 2 with 1 supplement
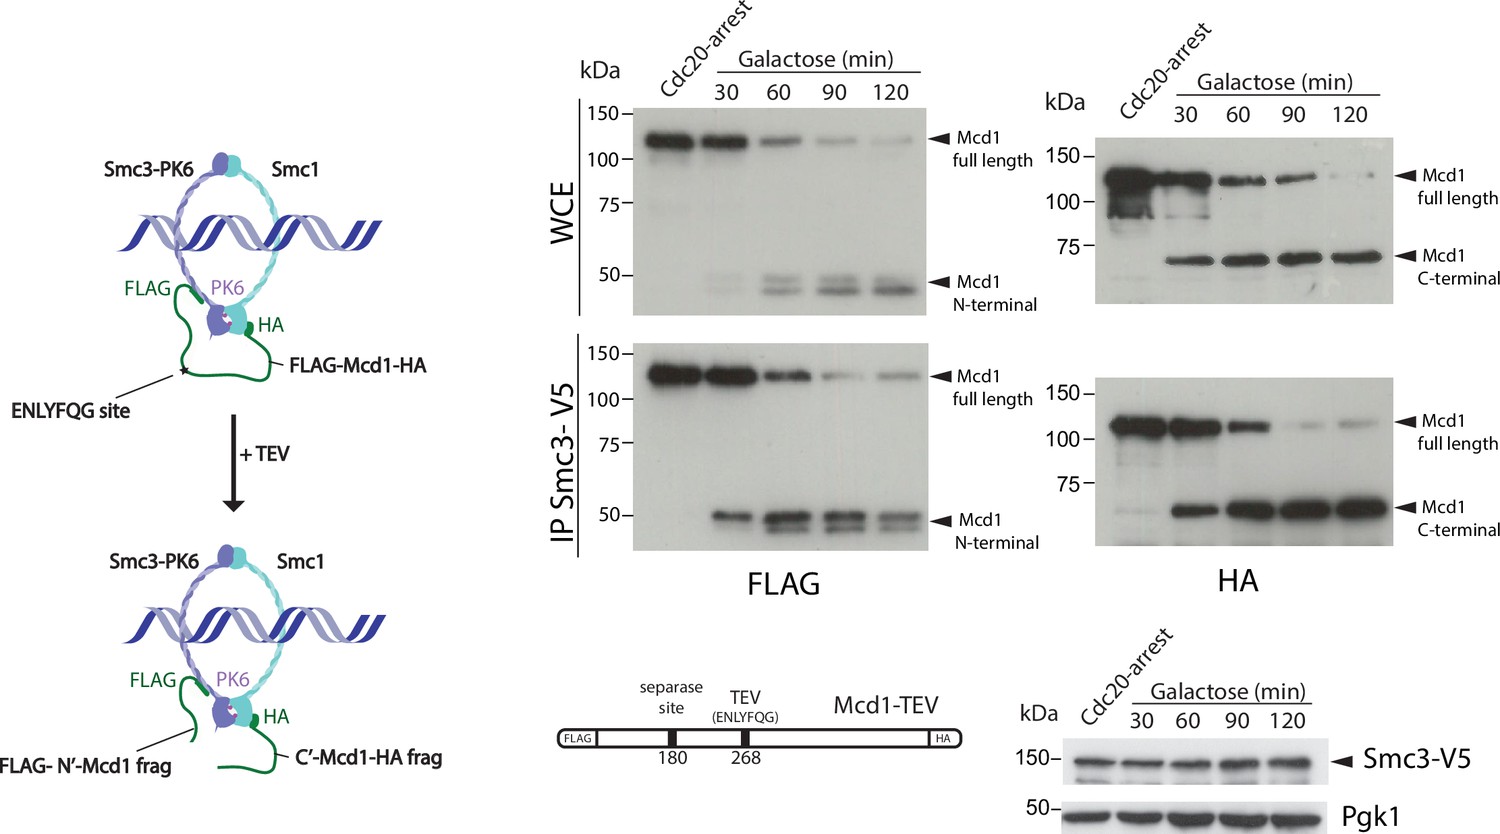
Cohesin ring structure remains after tobacco etch virus (TEV) cleavage of Mcd1.
Schematic of engineered cohesin with MCD1 tagged in N-terminus with FLAG, the C-terminus with HA, and with a substitution of the 268 separase cleavage site with the TEV cleavage sequence ENLYFQG. Cells also harboured a copy of Smc3 tagged in C-terminus with V5 (left). Cells were synchronised using a Cdc20 arrest and TEV was induced to cleave Mcd1. Samples were taken every 30 min for 2 hr and Smc3 immunoprecipitated using anti-V5 antibody. We used immunoblotting with anti-FLAG and HA antibodies to detect the cleaved fragments of Mcd1 (right).
-
Figure 2—source data 1
Six blots shown in main Figure 2.
- https://cdn.elifesciences.org/articles/80147/elife-80147-fig2-data1-v2.zip
Figure 2—figure supplement 1
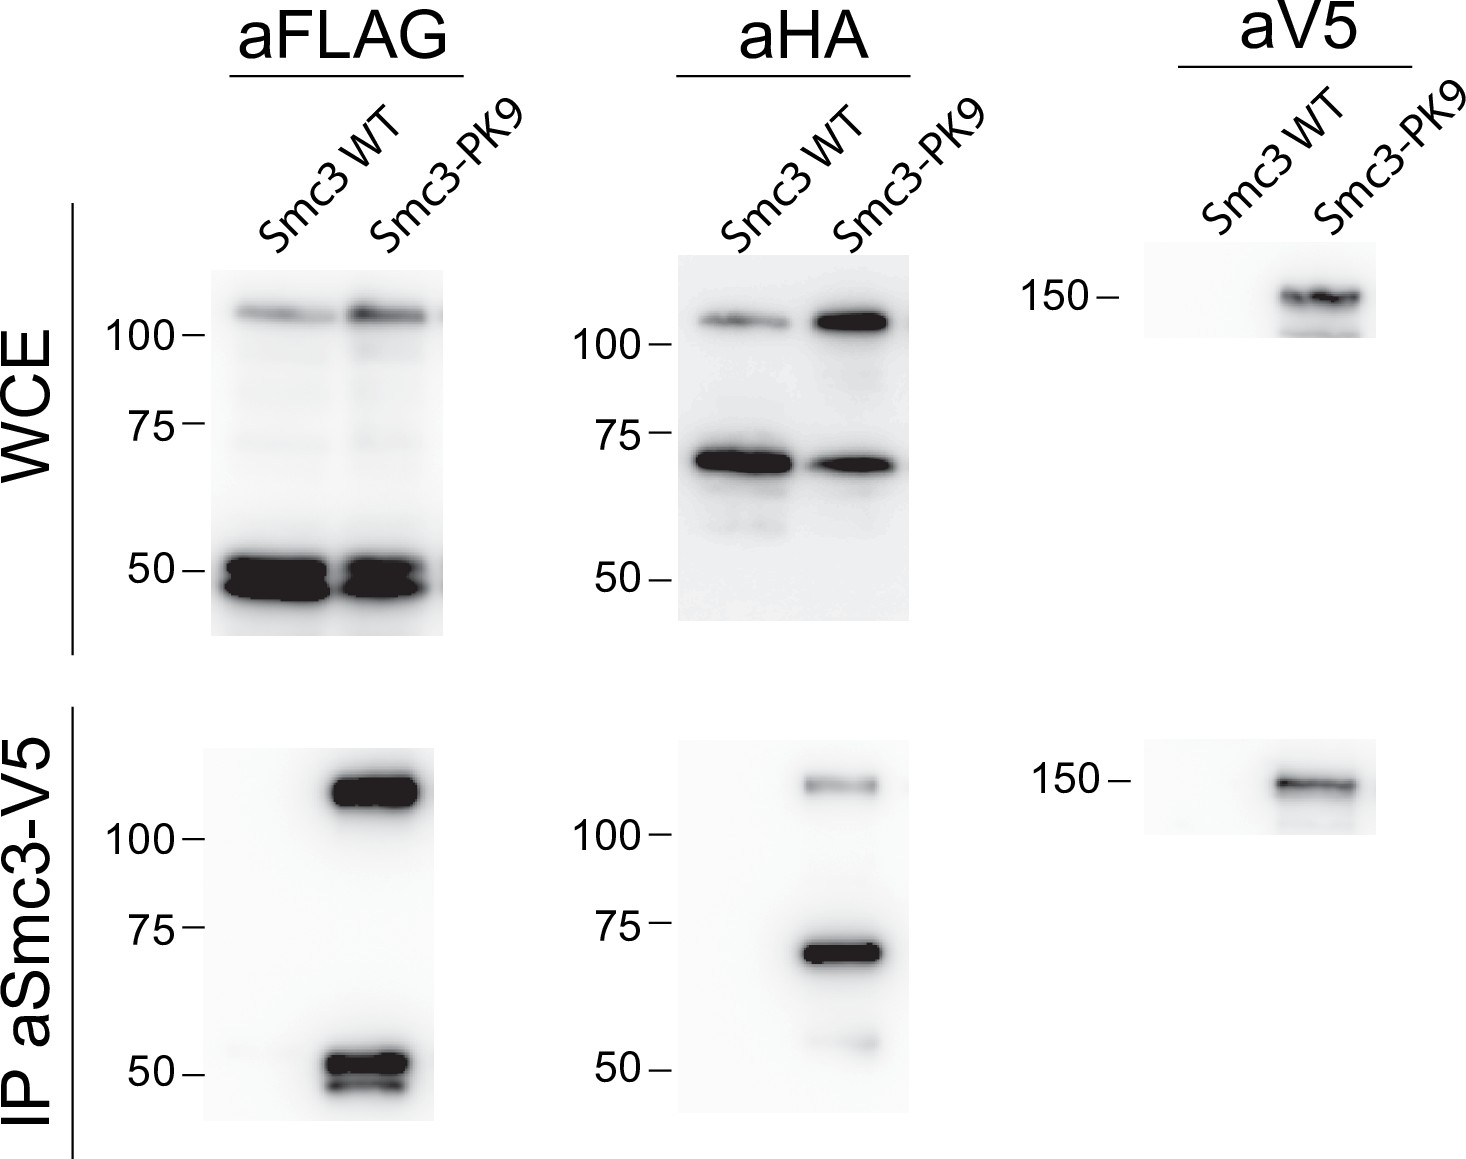
Cells with MCD1 tagged in N-terminus with FLAG, C-terminus with HA, with the 268 separase cleavage position substituted by the tobacco etch virus (TEV) cleavage sequence ENLYFQG (TEV-G) and with SMC3 tagged in C-terminus with V5 were synchronised in metaphase (Cdc20) and Mcd1 was cleaved in the TEV cleaving site.
Samples were taken after 2 hr of induction of the TEV protease and Smc3-V5 was pulled down using anti-V5 antibody followed by anti-FLAG or HA immunoblotting to detect Mcd1 N-terminus or C-terminus cleaved fragments, respectively. A negative control without V5 tag in Smc3 was included.
-
Figure 2—figure supplement 1—source data 1
Three blots shown.
- https://cdn.elifesciences.org/articles/80147/elife-80147-fig2-figsupp1-data1-v2.zip
-
Figure 2—figure supplement 1—source data 2
Two blots shown.
- https://cdn.elifesciences.org/articles/80147/elife-80147-fig2-figsupp1-data2-v2.pdf
Figure 3
Degradation of Mcd1 fragments after tobacco etch virus (TEV) cleavage affects segregation efficiency.
(a) Cells with MCD1 tagged at its N-terminus with FLAG and its C-terminus with HA, and with the 268 separase cleavage site replaced by the TEV recognition site ENLYFQF (TEVF) (top right diagram) were arrested in Cdc20 before TEV induction. Samples were taken every 30 min for 2 hr and immunoblotted against FLAG or HA to detect Mcd1 N-terminus and C-terminus cleaved fragments, respectively (left). Nuclear segregation was monitored during the TEV-induced anaphase with DAPI staining (bottom right graph). Error bars are standard deviations. (b) Cells with MCD1 tagged at its N-terminus with FLAG and its C-terminus with HA, and with the 268 separase cleavage site replaced by the TEV recognition site ENLYFQG (TEVG) (top right diagram) were arrested in Cdc20 before TEV induction. Samples were taken every 30 min for 2 hr and immunoblotted against FLAG or HA to detect Mcd1 N-terminus and C-terminus cleaved fragments, respectively (left). Nuclear segregation was monitored during the TEV-induced anaphase with DAPI staining (bottom right graph). Error bars are standard deviations. (c) Cells carrying MCD1 with the 268 separase cleavage site substituted for either TEV cleavage ENLYFQF (TEVF) or ENLYFQG (TEVG) were treated as in (a and b) and monitored for nuclear and chromosome segregation using DAPI and green fluorescent protein (GFP) dots marking the middle of chromosome V (tet:469). Each timepoint represents the average of the percentage of three biological replicas of at least 100 cells per timepoint. Error bars show SEM.
-
Figure 3—source data 1
Two blots shown in main Figure 3a.
- https://cdn.elifesciences.org/articles/80147/elife-80147-fig3-data1-v2.zip
-
Figure 3—source data 2
Two blots shown in main Figure 3b.
- https://cdn.elifesciences.org/articles/80147/elife-80147-fig3-data2-v2.zip
Figure 4 with 2 supplements
Depletion or cleavage of cohesin differentially affects chromatin structure during anaphase.
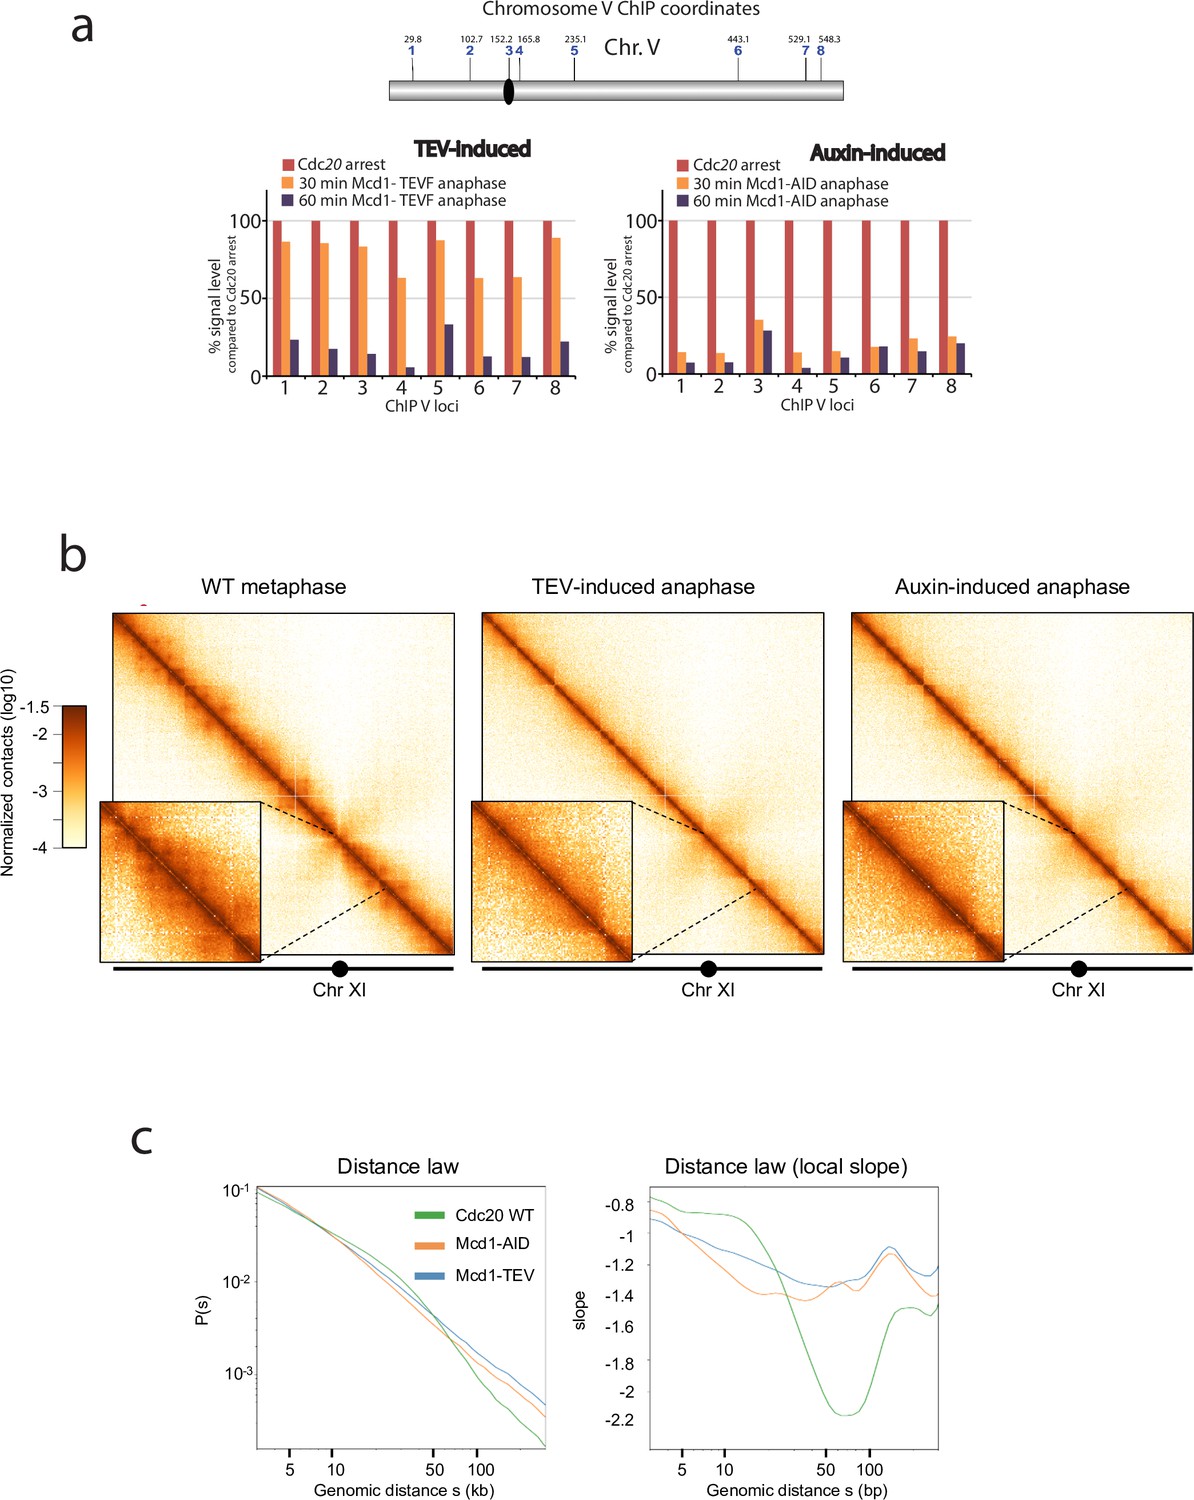
(a) Chromatin immunoprecipitation analysis (ChIP) of Smc3-V5 binding along chromosome V of cells arrested in metaphase (Cdc20 arrest) containing either MCD1 with the 268 separase cleavage site substituted by the tobacco etch virus (TEV) recognition sequence ENLYFQF (TEVF) or with MCD1-AID. Samples were taken every 30 min for 1 hr after induction of the TEV protease or addition of the auxin IAA respectively and analysed. (b) Cells containing either MCD1-TEVG or MCD1-AID were arrested in Cdc20 metaphase arrest and MCD1 was cleaved or degraded respectively. Samples for HiC analysis were taken (MCD1 TEVG 90 min; MCD1-AID 60 min). Contact maps (bin = 1 kb) of chromosome V from cell populations are shown. Brown to yellow colour scales represent high to low contact frequencies, respectively (log10). A Cdc20 metaphase arrest was also processed as a reference. n=1 (left) and n=2 (middle and right) biological replicates for each condition. (c) Average intrachromosomal arm contact frequency (p) between two loci with respect to their genomic distance (s) along the chromosome, of cell populations treated as in ‘a’ (left). Derivative of p(s) curve (right).
Figure 4—figure supplement 1
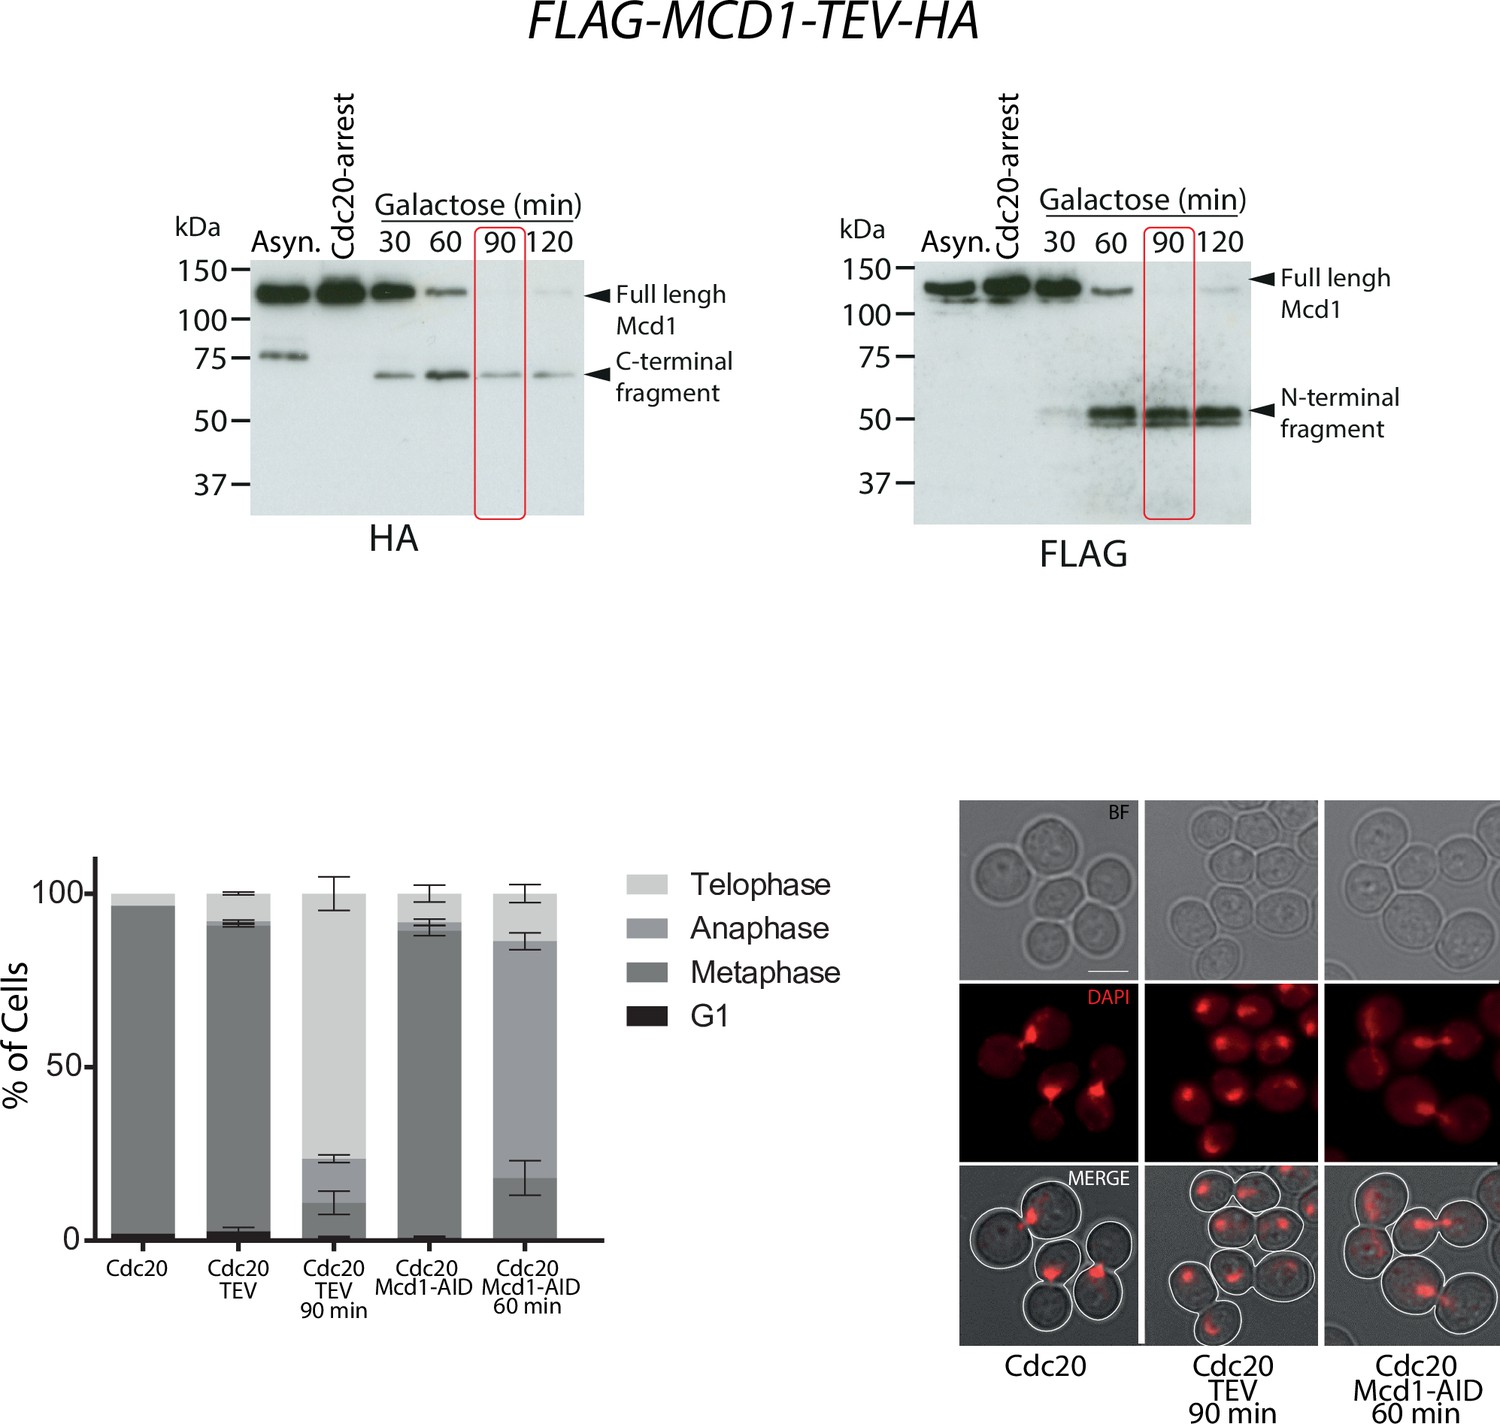
Cells containing either MCD1 TEVG or MCD1-AID were arrested in Cdc20 metaphase arrest and MCD1 was cleaved or degraded, respectively.
Samples for WB analysis were taken every 30 min for 2 hr followed by immunoblotting to detect Mcd1. Samples at the timepoints highlighted in red MCD1 TEV-G 90 min cleavage and MCD1-AID 60 min degradation were taken to be processed for Hi-C (top and middle blots). The cell cycle stage of these samples was quantified (bottom left). Representative cell images of each sample are shown (bottom right).
-
Figure 4—figure supplement 1—source data 1
Two blots shown.
- https://cdn.elifesciences.org/articles/80147/elife-80147-fig4-figsupp1-data1-v2.zip
Figure 4—figure supplement 2
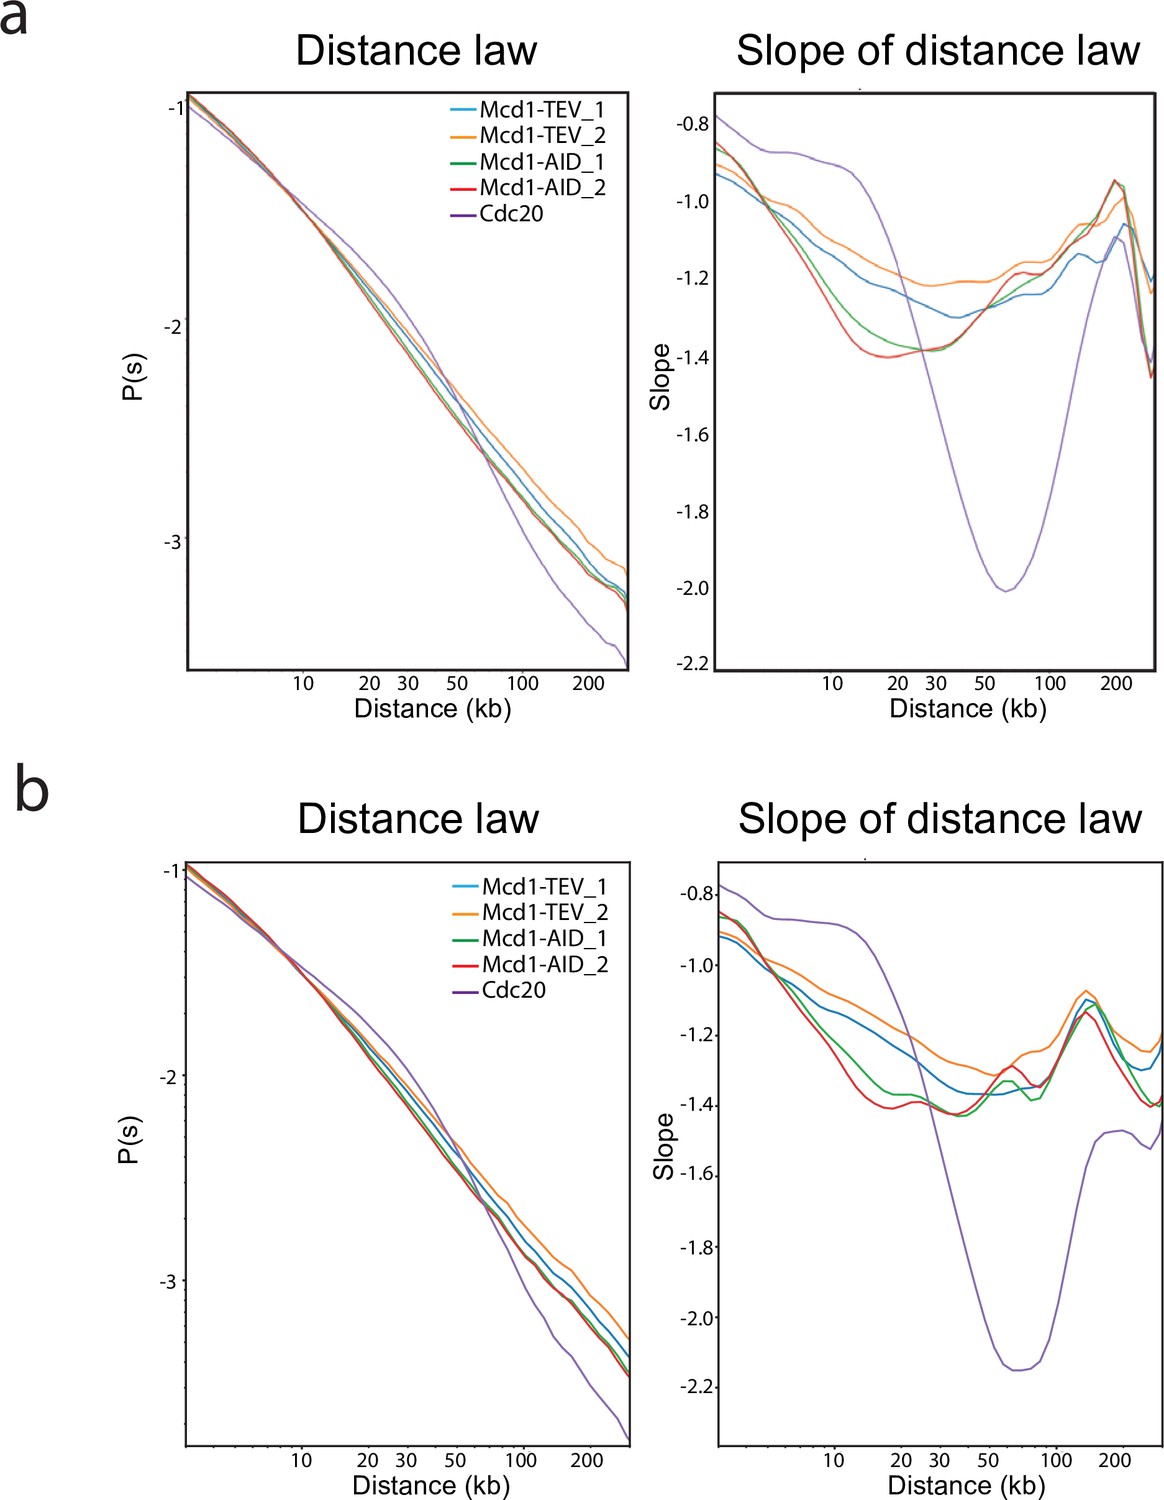
Contact probability as a function of genomic distance P(s), and its derivative, determined from replicates of samples in Figure 4c.
(a) Contact probability (p(s)) of cells containing either MCD1 TEVG or MCD1-AID synchronised in metaphase (Cdc20) and cleaved for 90 min or degraded for 60 min, respectively. Biological replicas are shown. (b) Contact probability calculated as in (a), but without the 200 kb region surrounding the centromeres.
Figure 5 with 2 supplements
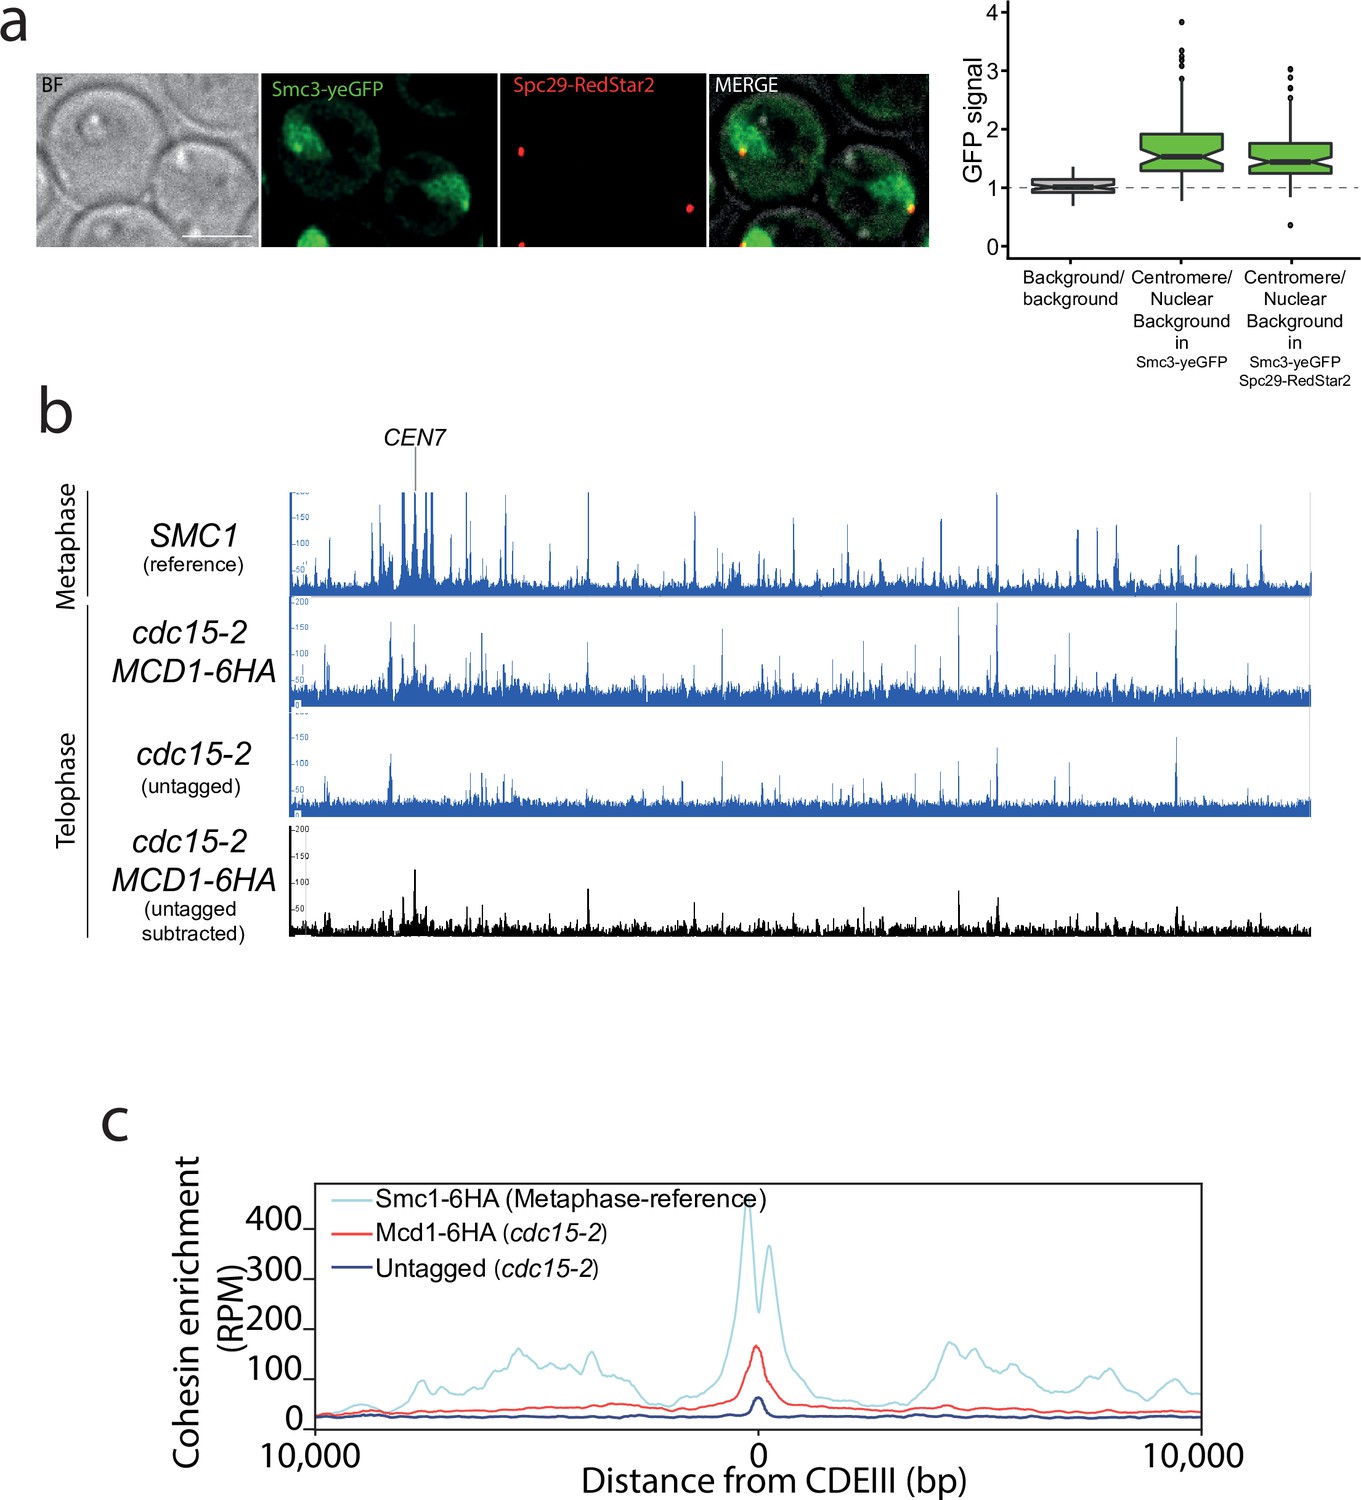
Cohesin is present around centromere regions in telophase-arrested cells.
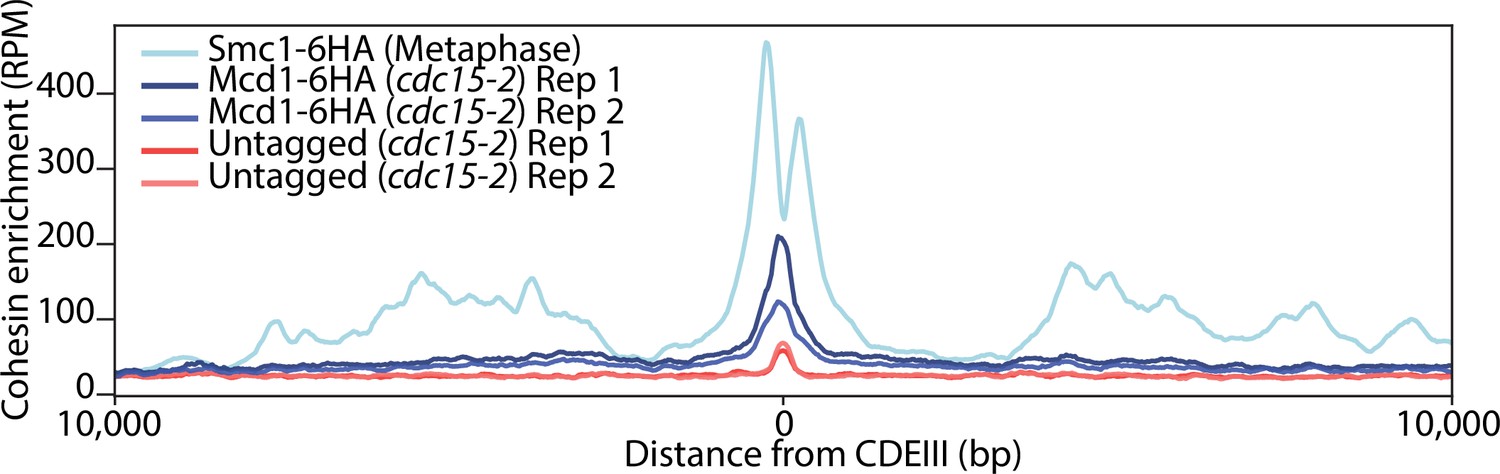
(a) Cells containing CDC15-AID and the tagged cohesin subunit SMC3-yeGFP were arrested in late anaphase and the green fluorescent protein (GFP) signal at the centromere was calculated as a ratio comparing it to the nuclear background signal. Cells also carried Spc29-RedStar2, a spindle pole body component that was used as spatial reference to determine colocalisation with centromeres. For each timepoint at least 20 cells of two biological replicas were quantified. (b) Enrichment of cohesin along Saccharomyces cerevisiae chromosome 7 measured by calibrated ChIP-seq in cells containing MCD1-6HA arrested in late anaphase (cdc15-2) and untagged cells arrested in telophase (cdc15-2). We used a previously published dataset (GSE118534) for Smc1 binding to metaphase-arrested cells as a reference to illustrate the position of cohesin sites on metaphase chromosomes (top; SMC1 reference). The bottom black lane shows the enrichment of cohesin subunit Mcd1-6HA after subtraction of ChIP-seq signal of the untagged cells arrested in telophase (cdc15-2). CEN7 marks the location of the centromere. (c) Average calibrated ChIP-seq profiles of Mcd1-6HA (telophase arrest, cdc15-2) from the centromere CDEIII region of the 16 yeast chromosomes is shown. Smc1 profile from cells arrested in metaphase is shown as a reference (GSE118534).
Figure 5—figure supplement 1
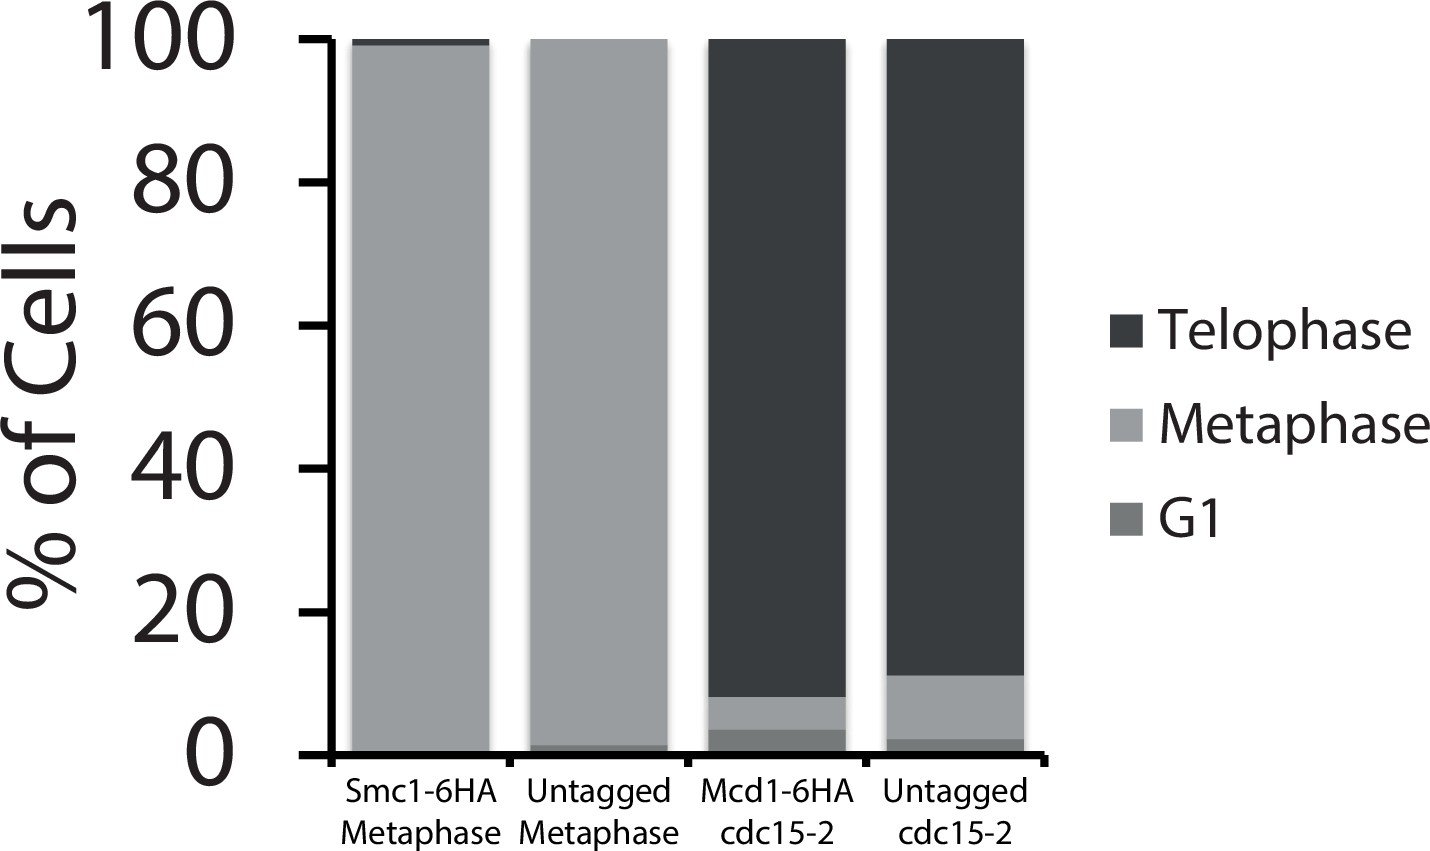
Microscope quantification of the cell cycle stage of cells used for ChIP-seq experiments, containing SMC1-6HA arrested in metaphase (nocodazole), untagged cells arrested in metaphase (nocodazole), cells containing MCD1-6HA arrested in cdc15-2 late anaphase, and untagged cells arrested in cdc15-2.
Figure 5—figure supplement 2
Enrichment of cohesin around CENs measured by calibrated ChIP-seq.
Smc1-6HA ChIP-seq profiles of SMC1-6HA wild-type cells synchronised in metaphase, Mcd1-6HA ChIP-seq profiles of cdc15-2 cells synchronised in telophase, and ChIP-seq profiles of untagged cdc15-2 cells synchronised in telophase are shown. The number of reads at each base pair from the centromere CDEIII was averaged over all 16 chromosomes. The profile of each biological repetition is shown.
Figure 6 with 1 supplement
Cohesin organises centromere regions in telophase-arrested cells.
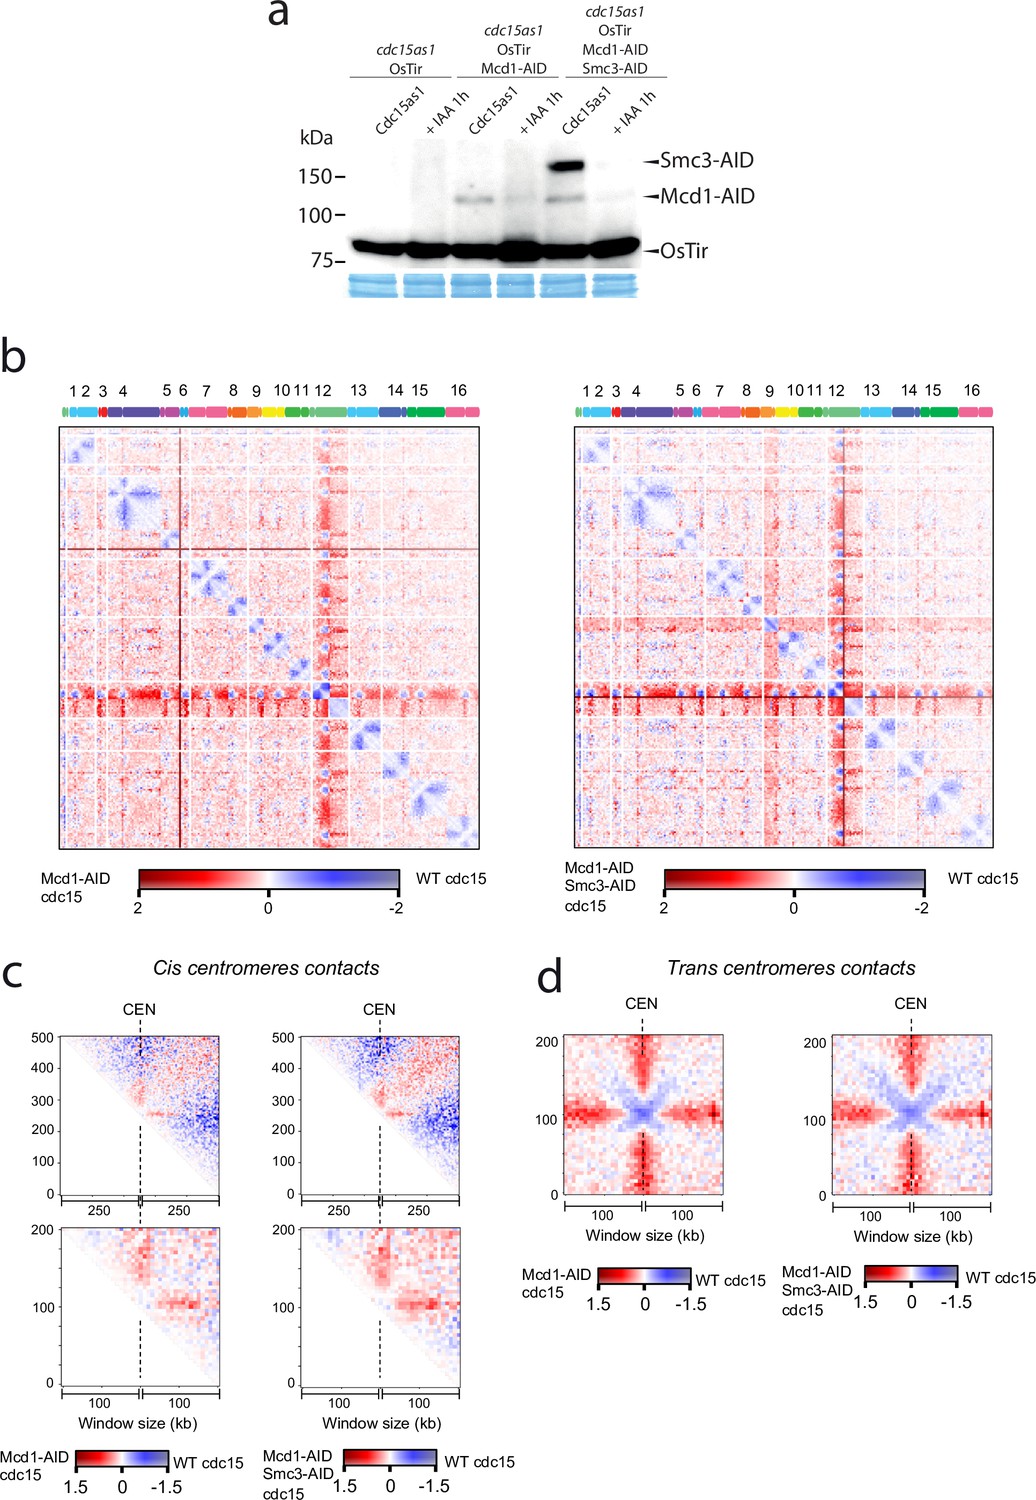
(a) Degradation of cohesin subunits in telophase-arrested cells using cdc15-as allele. Cdc15-as cells and cdc15-as cells carrying MCD1-AID or MCD1-AID and SMC3-AID were synchronised in late anaphase (cdc15-as) and treated with IAA for 1 hr to deplete Mcd1-AID and Smc3-AID. Samples were taken for HiC and for immunoblotting to follow the degradation of Mcd1 and Smc3. (b) Log2 ratio of contact maps between cdc15-as arrested cells depleted in Mcd1 and cdc15-as arrested wild-type (WT) cells (left). Log2 ratio of contact maps between cdc15-as arrested cells depleted in Mcd1 and Smc3 and cdc15-as arrested WT cells (right). x-axis represents the 16 chromosomes of the yeast genome depicted on top of the matrix. Blue to red colour scales represent the enrichments in contacts in one sample respect to the other (bin = 50 kb). (n=1 biological replicate for each condition). (c) Log2 ratio between cdc15as Mcd1 ± Scm3 depleted and cdc15as pile-ups of contact maps of the 500 kb (top) and 200 kb (bottom) cis peri-centromeric regions (bin = 5 kb). (d) Log2 ratio between cdc15as Mcd1 ± Scm3 depleted and cdc15as pile-ups of contact maps of the 100 kb trans peri-centromeric regions (bin = 5 kb).
-
Figure 6—source data 1
One blot shown in main Figure 6a.
- https://cdn.elifesciences.org/articles/80147/elife-80147-fig6-data1-v2.zip
Figure 6—figure supplement 1
Cohesin organises centromere regions in telophase-arrested cells.
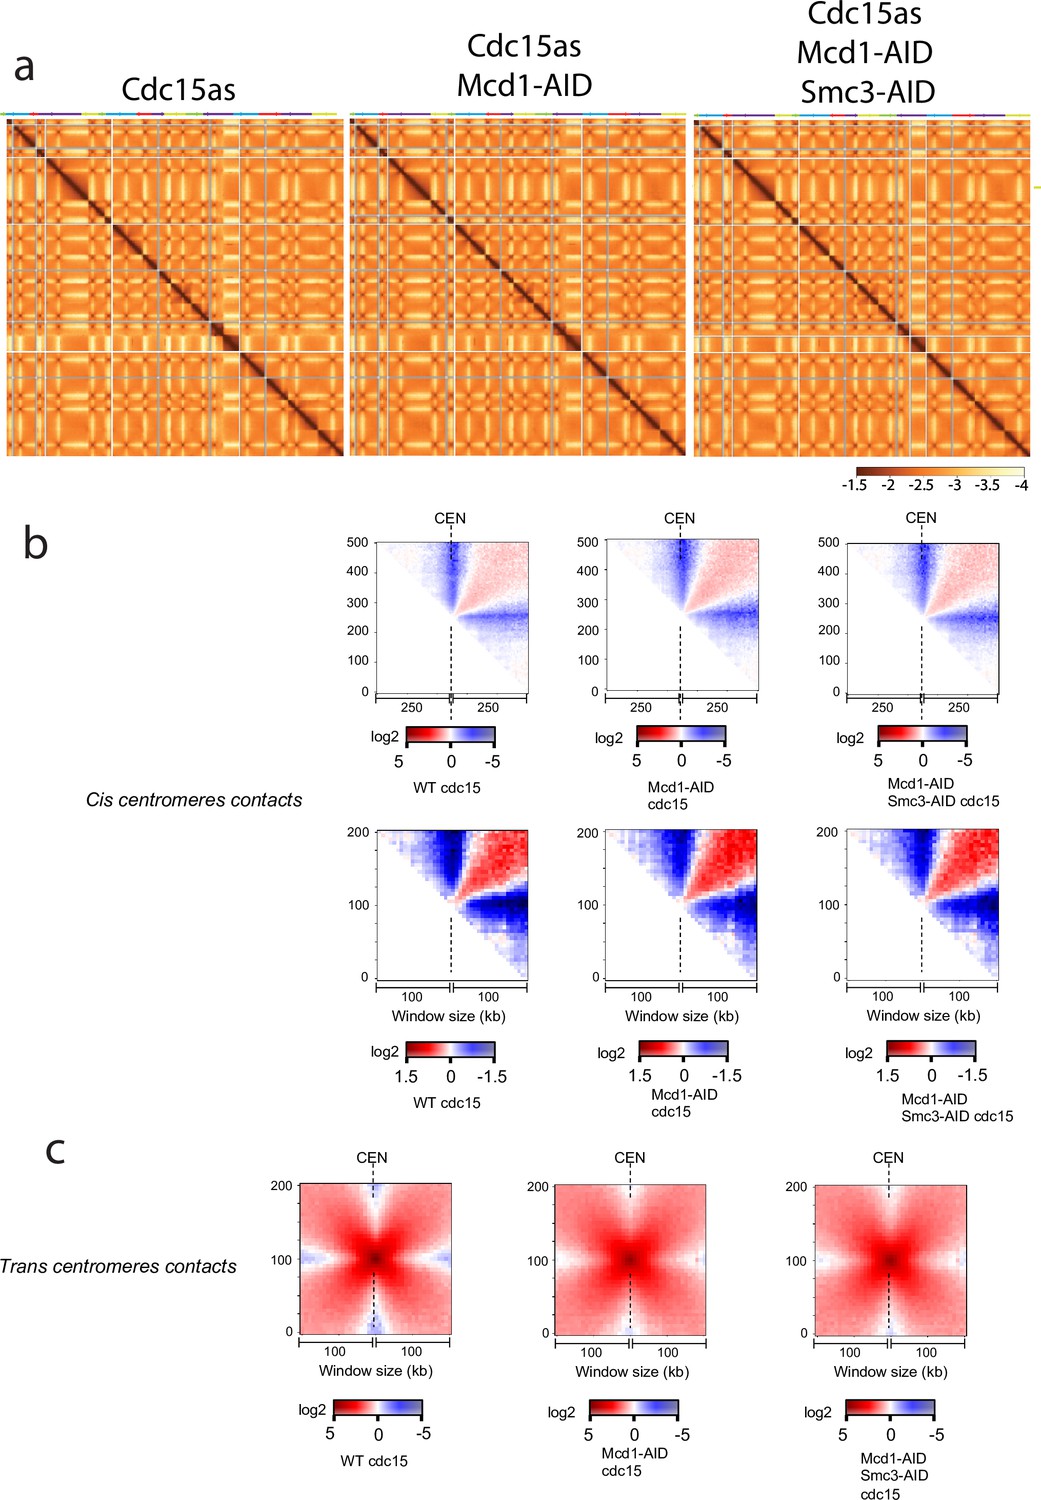
(a) Contact maps generated from cells synchronised in cdc15-as and cells synchronised in cdc15-as containing MCD1-AID or MCD1-AID and SMC3-AID. Cells were synchronised in late anaphase (cdc15-as) and treated with IAA for 1 hr to deplete Mcd1-AID and Smc3-AID. Samples were taken for HiC and for WB. x- and y-axis represent the 16 chromosomes of the yeast genome, displayed above the maps. Brown to yellow colour scales represent high to low contact frequencies, respectively (log10). (b) Pile-ups of contact maps of the 250 kb (top) or 100 kb (bottom) peri-centromeric regions in cis for cells synchronised in cdc15-as (left), in cdc15as and Mcd1-AID depleted (middle) or in cdc15as and Mcd1-AID and Smc3-AID depleted (right) (bin = 5 kb). (c) Pile-ups of contact maps of the 100 kb peri-centromeric regions in trans for cells synchronised in cdc15-as (left), in cdc15as and Mcd1-AID depleted (middle) or in cdc15as and Mcd1.
Figure 7
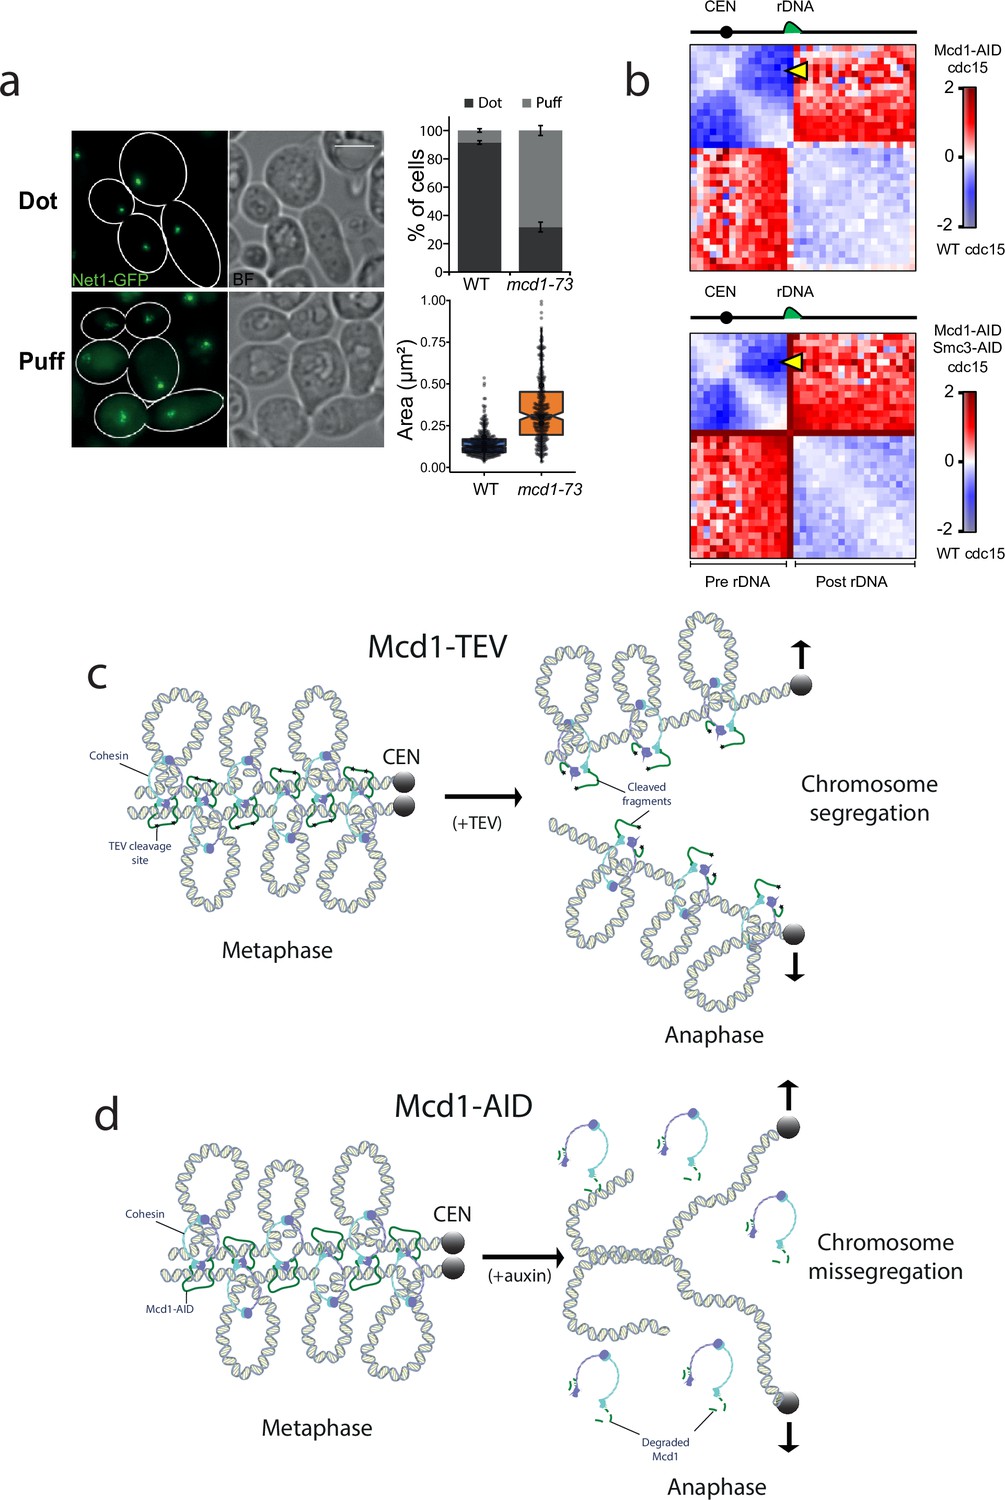
Cohesin has a structural role after metaphase.
(a) Cells containing cdc15-as and NET1-yeGFP with either MCD1 wild-type (WT) or the temperature-sensitive allele mcd1-73 were arrested in telophase (cdc15-as) at 25°C and then the temperature was shifted to 37°C for 30 min. Cells were then imaged under the microscope. Representative images of the experiment are shown. White scale bars represent 5 μm (left). Quantification of the rDNA morphology was scored (upper right). Net1-GFP area marking the rDNA was quantified (lower right). At least 100 cells of two biological replicas were quantified for each condition. (b) Log2 ratio of chromosome XII contact maps between Cdc15 and Cdc15 Mcd1-AID (top) or Cdc15 and Cdc15 Mcd1-AID Smc3-AID (bottom). The yellow arrow points at the contacts made between the CEN12 and the rDNA. (c) Diagram showing a potential model explaining how TEV-cleaved cohesin could maintain the looped organisation of segregating chromatids. TEV cleavage of Mcd1 could be retained in one of the two segregating chromatids maintaining some of the structural functions. In this scenario sister chromatid cohesion would be lost but the loop organisation of individual chromatids would be partially maintained, thus facilitating segregation. (d) Diagram showing a potential model explaining how degradation of cohesin subunit Mcd1 could lead to catastrophic segregation. Mcd1 degradation leads to the destabilisation of cohesin on chromatin. In the absence of cohesin, though cohesion is dissolved (allowing genome separation), the loss of structure on separated chromatids would prevent their segregation and cells would exhibit the anaphase bridges phenotypes observed.
Tables
Table 1
Yeast strains used in this study.
| CCG14820 | CCG4000; MET3-3HA-CDC20:TRP1; ADH1-OsTIR1::URA; MCD1:AID-9Myc:Hph; TetR-GFP::ADE2; TetO:469Kb ChrV:HIS3 | This study |
| CCG14881 | CCG4000; MET3-3HA-CDC20:TRP1; ADH1-OsTIR1::URA; MCD1:AID-9Myc:Hph; TetR-GFP::ADE2; TetO:558Kb ChrV:HIS3 | This study |
| CCG14629 | CCG4000; MET3-3HA-CDC20:TRP1; ADH1-OsTIR1::URA; MCD1:AID-9Myc:Hph; TetR-GFP::ADE2; TetO:448Kb ChrIV:HIS3 | This study |
| CCG14635 | CCG4000; MET3-3HA-CDC20:TRP1; ADH1-OsTIR1::URA; MCD1:AID-9Myc:hph; TetR-GFP::ADE2; TetO:1513Kb ChrIV:HIS3 | This study |
| K9027 | MATα; MCD1Δ:HIS3; MCD1TEV268::LEU2; GAL-NLS-mcy9-TEVprotease-NLS2::TRP1 (10-fold integrant by southern); ura3::3xURA3 tetO112; his3::HIS3 tetR-GFP; MET3-HA3-CDC20::TRP1; ade2-1 can1-100 GAL psi+ | Uhlmann et al., 2000 |
| CCG12955 | CCG12681; SMC3-V5:HPH | This study |
| CCG12356 | CCG4000; MET3-3HA-CDC20:TRP1, FLAG-MCD1-268TEVF-6HA:LEU2, GAL- TEV-9Myc::URA3; tetR-GFP::ADE2 | This study |
| CCG12351 | CCG4000; MET3-3HA-CDC20:TRP1, FLAG-MCD1-268TEVG-6HA:LEU2, GAL1-TEV-9Myc::URA3; tetR-GFP::ADE2 | This study |
| CCG14783 | CCG12351; TetO:469Kb ChrV:HIS3 | This study |
| CCG14784 | CCG12356; TetO:469Kb ChrV:HIS3 | This study |
| CCG14882 | CCG14635; SMC3-V5:hph | This study |
| CCG12925 | CCG12682; SMC3-V5:HPH | This study |
| CCG13574 | CCG4000, MET3-3HA-CDC20:TRP1; pADH1-OsTIR1::URA; TetR-GFP::ADE2 | This study |
| CCG14635 | CCG4000; MET3-3HA-CDC20:TRP1; ADH1-OsTIR1::URA; MCD1:AID-9Myc:hph; TetR-GFP::ADE2; TetO:1513Kb ChrIV:HIS3 | This study |
| CCG14880 | CCG4000; ADH1-OsTIR1::LEU; CDC15:AID-9Myc:Hph | This study |
| CCG14909 | CCG4000; ADH1-OsTIR1::LEU; CDC15:AID-9Myc:Hph SMC3-yeGFP:Kan | This study |
| CCG14910 | CCG4000; ADH1-OsTIR1::LEU; CDC15:AID-9Myc:Kan; SMC3-yeGFP:Hph; SPC29-RedStar2:Nat | This study |
| CCG1835 | MATa bar1:hisG ura3-1 trp1-1 leu2-3,112 his3-11 ade2-1 can1-100 GAL+cdc15-2 | This study |
| CCG14731 | CCG1835; MCD1-6HA:Hyg | This study |
| CCG14758 | CCG4000; SMC1-6HA:Nat; pADH1-OsTIR1::URA | Garcia-Luis et al., 2019. |
| CCG14821 | CCG4000 pADH1-OsTIR1::LEU; cdc15as1:KanMX | This study |
| CCG14822 | CCG14821 MCD1:AID-9Myc:Hph | This study |
| CCG14823 | CCG14822 SMC3:AID-9Myc:Hph | This study |
Table 2
Primers used in this study.
| Primer number | Target | Primer |
|---|---|---|
| 4729 | Chr.V 235.1 (235000)_F | GCATGTGGATGTTTTTGGGGT |
| 4730 | Chr.V 235.1 (235125)_R | GAGACACTAGAGGGGCTATCCT |
| 4731 | Chr.V 443.1 (443017)_F | TCCACGTAATATTGCGGCCT |
| 4732 | Chr.V 443.1 (443151)_R | AATGCCAACTCAGCTTTGCG |
| 4733 | Chr.V 529.1 (529089)_F | ACTGAGAGGGAAGGACGACT |
| 4734 | Chr.V 529.1 (529198)_R | AATCGGCGTCAGACAAACCT |
| 4735 | Chr.V 548.3 (548276)_F | GGAAAATAGCCGCCCAAGGA |
| 4736 | Chr.V 548.3 (548398)_R | TGGCATAACAGACTACAGCAAA |
| 4737 | Chr.V 102.7(102733)_F | CGCATGCTTTTCTCAGACCTT |
| 4738 | Chr.V 102.7(102863)_R | TGCGGTACTGAGGGCCAAAT |
| 4739 | Chr.V 29.8(29844)_F | ATAGTTTGGGTGCTGCTGATT |
| 4740 | Chr.V 29.8(29970)_R | ACATTTTGCCGCCATACACA |
| 4557 | Ch.V_165.8_F | CGCGTTGGTCAAGCCTCATA |
| 4558 | Ch V_165.8_R | CACTACTCGGCTTCTTGCCA |
| 4563 | CEN5_152.2_F | CAAGCCACTGTTGGCGTTTC |
| 4564 | CEN5_152.2_R | TTATGTGCGGCTTTGTCAGC |
Additional files
Download links
A two-part list of links to download the article, or parts of the article, in various formats.
Downloads (link to download the article as PDF)
Open citations (links to open the citations from this article in various online reference manager services)
Cite this article (links to download the citations from this article in formats compatible with various reference manager tools)
Depletion or cleavage of cohesin during anaphase differentially affects chromatin structure and segregation
eLife 11:e80147.
https://doi.org/10.7554/eLife.80147


