PH domain-mediated autoinhibition and oncogenic activation of Akt
- Department of Biological Chemistry and Molecular Pharmacology, Harvard Medical School, United States
- Division of Genetics, Department of Medicine, Brigham and Women's Hospital,, United States
- Department of Cancer Biology, Dana-Farber Cancer Institute, United States
- Department of Cancer Biology and Genetics, The Ohio State University, United States
Figures
Figure 1 with 1 supplement
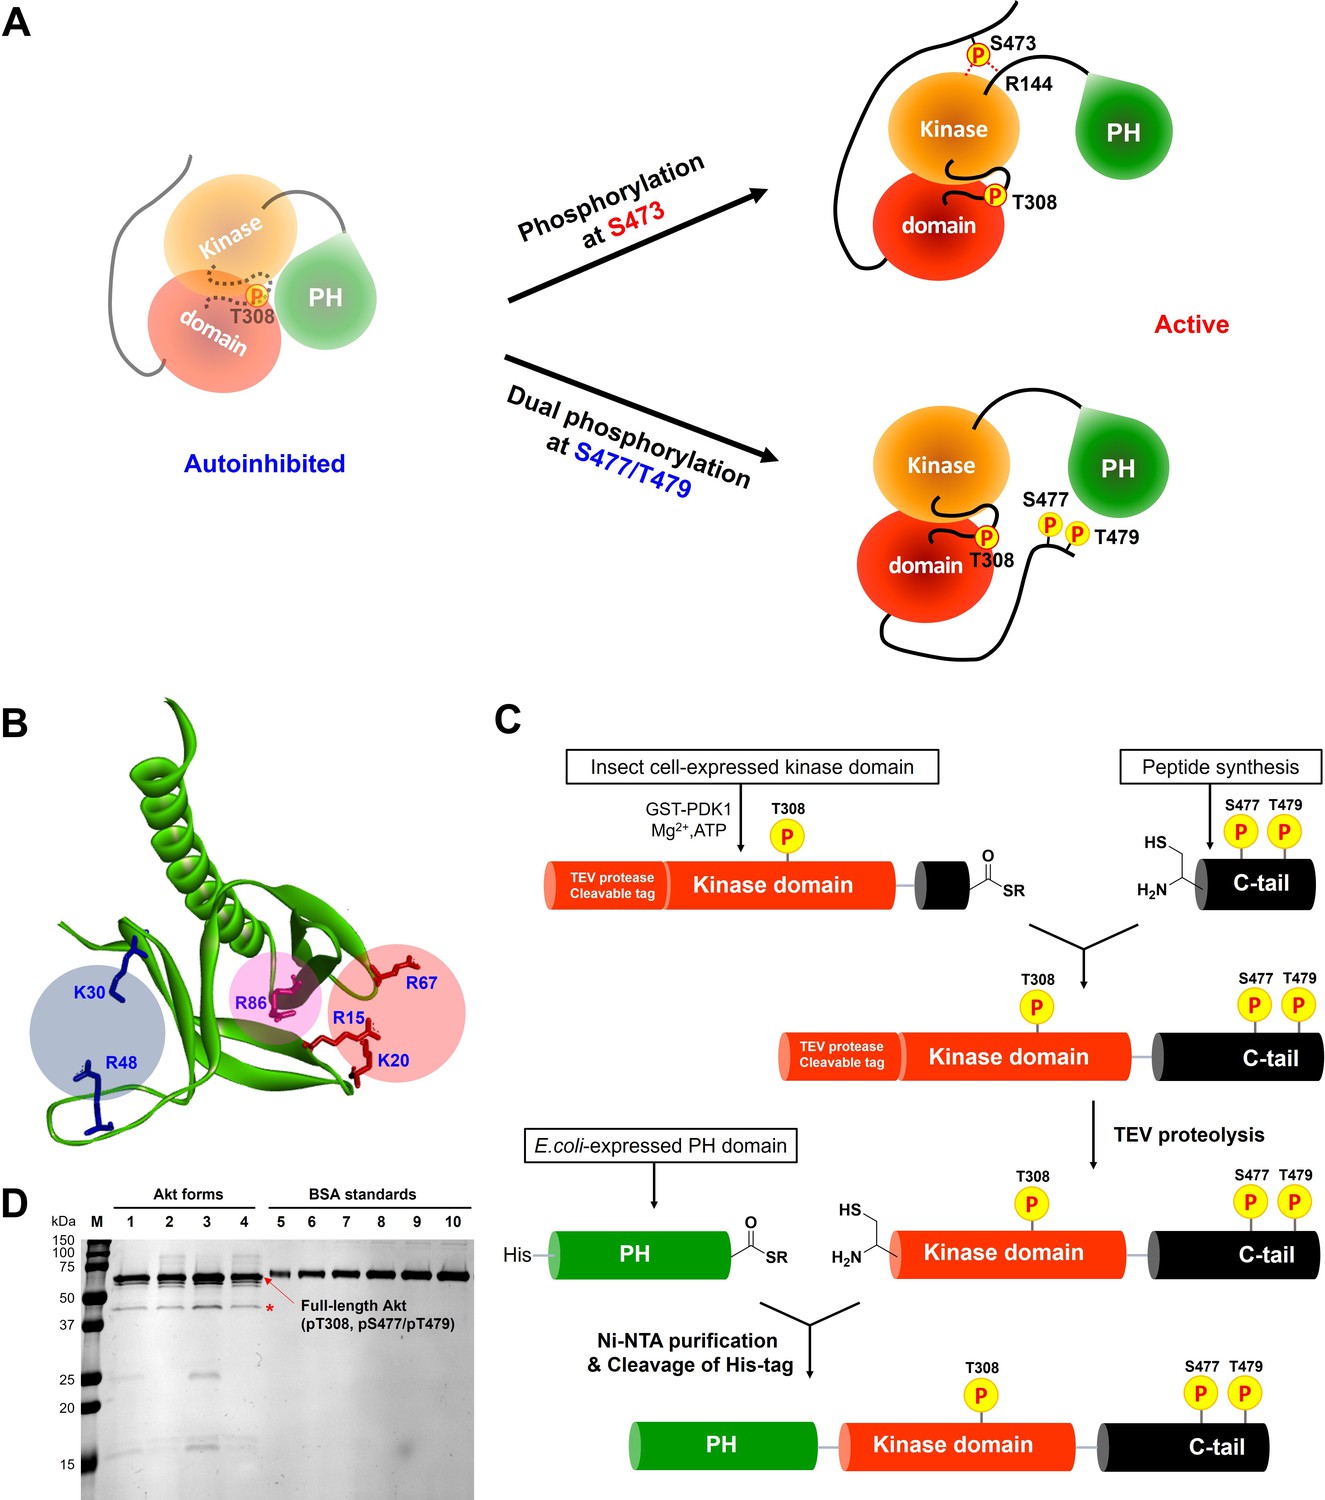
Distinct potential Akt regulation mechanisms associated with pS473 and pS477/pT479, and a semisynthetic strategy to generate site specifically modified Akt forms.
(A) Two different proposed Akt activation mechanisms by C-tail phosphorylation events at Ser473 and Ser477/Thr479. (B) Inspection of the crystal structure of the Akt PH domain (PDB:1UNP) identified three potential pSer477/pThr479 basic binding surfaces in the PH domain highlighted in colored circles. (C) Three-piece expressed protein ligation strategy to make full-length Akt forms with site-specific and stoichiometric phosphorylation at Thr308, Ser477, and Thr479 as well as different alanine mutations on their PH domains. (D) The purity and concentration of each Akt form determined using SDS-PAGE followed by Coomassie staining. Lane 1: WT (A1), lane 2: R86A (A2), lane 3: K30A R48A (A3), lane 4: R15A K20A R67A (A4), lanes 5 ̶ 10: BSA standards 0.1, 0.2, 0.3, 0.4, 0.5, 0.6 μg, M: protein markers (kDa). * Mark indicates PreScission Protease added to cleave the N-terminal tags, which does not appear to alter the Akt catalytic activities.
-
Figure 1—source data 1
Raw gel image showing the purity and concentration of each Akt mutant.
- https://cdn.elifesciences.org/articles/80148/elife-80148-fig1-data1-v2.zip
Figure 1—figure supplement 1
List of semisynthetic Akt constructs.
Semisynthetic full-length Akt (aa 1–580) and ΔPH Akt (aa 122–580) constructs used in this study for biochemical experiments showing their mutations and phosphorylation status.
Figure 2
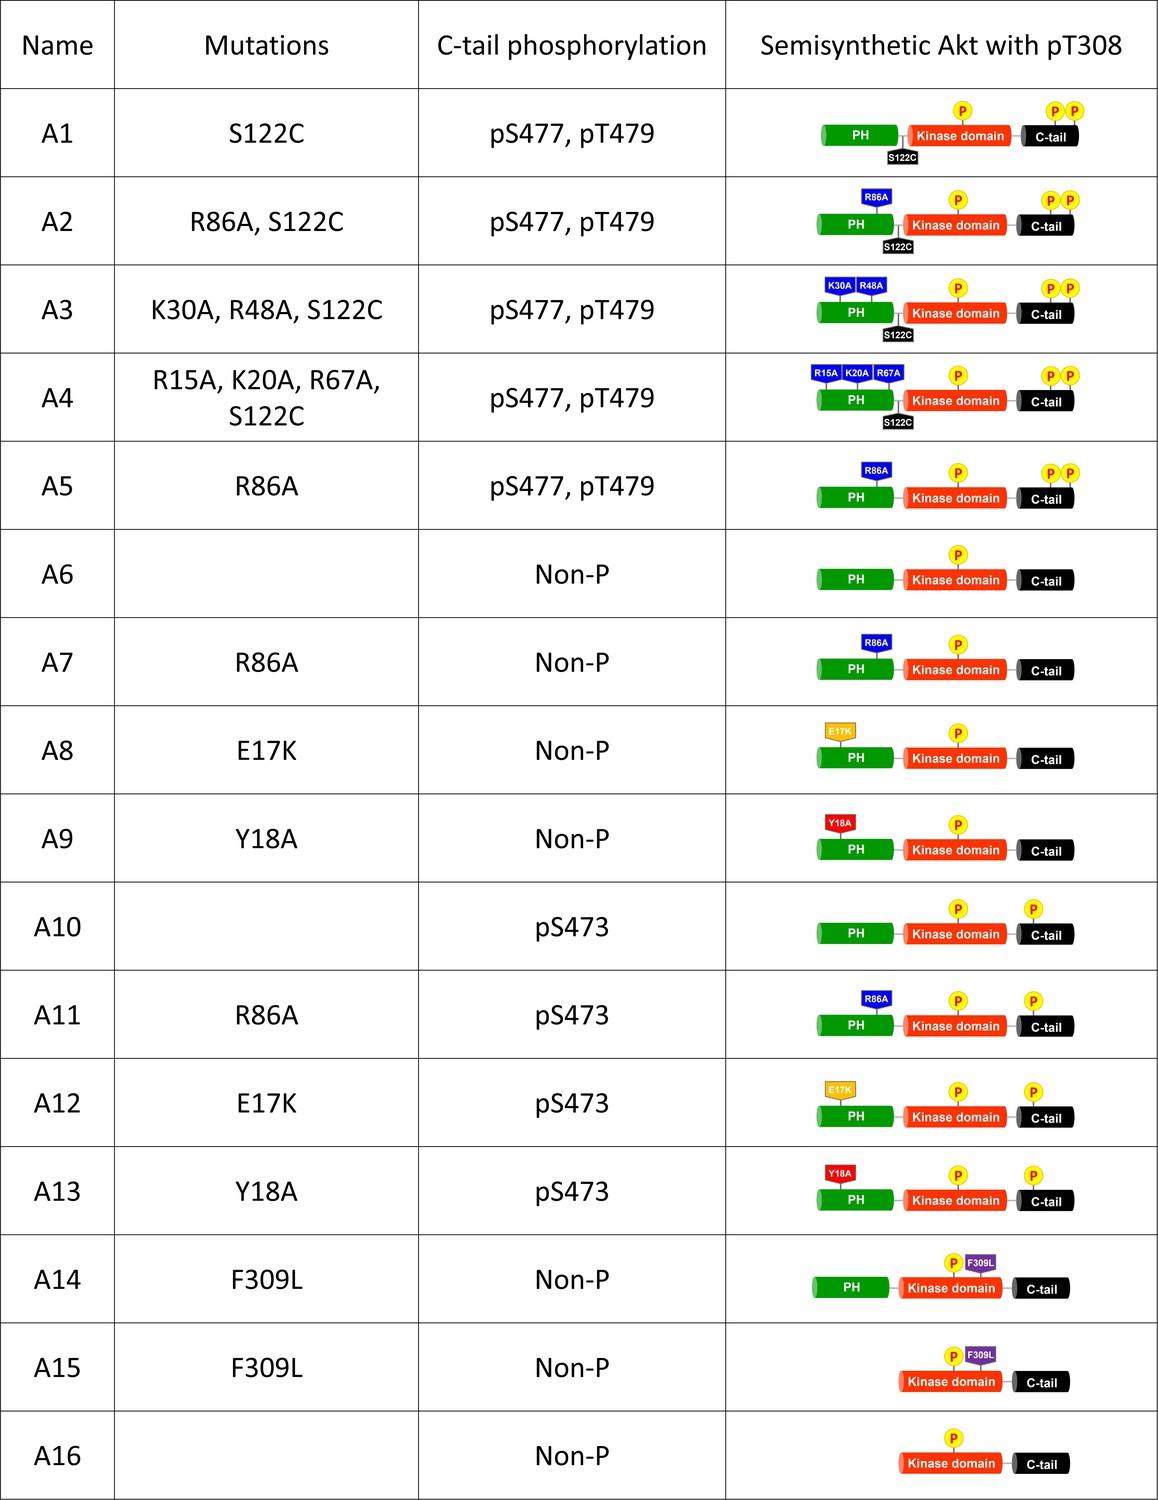
Kinase activities of Akt PH domain basic residue mutations and analysis of R86A PH domain intermolecular binding to the Akt kinase domain.
(A) Enzymatic activities of full-length Akt mutants possessing pT308 and pS477/pT479 (A1–A4) prepared using a three-piece expressed protein ligation (EPL) strategy. (B) Enzymatic activities of full-length R86A Akt mutant forms with differentially phosphorylated C-tails (A5: pS477/pT479, A7: Non-P, A11: pS473) relative to WT Akt containing pS473 (A10) as a control. These Akt forms were prepared using a two-piece EPL strategy. These kinase assays were performed in buffer containing 250 μM ATP and 20 μM GSK3 peptide as substrates (n≥3, SD shown). (C) MST (microscale thermophoresis) binding experiments using the N-terminally Cy5-labeled kinase domain with pT308 as a target protein and the isolated PH domain (WT or R86A) as a ligand. WT: red, R86A: blue (n=3, SEM shown).
-
Figure 2—source data 1
Kinase activity assays with full-length Akt mutants having pT308 and pS477/pT479.
- https://cdn.elifesciences.org/articles/80148/elife-80148-fig2-data1-v2.zip
-
Figure 2—source data 2
Kinase activity assays with full-length R86A Akt mutant forms with differentially phosphorylated C-tails.
- https://cdn.elifesciences.org/articles/80148/elife-80148-fig2-data2-v2.zip
Figure 3 with 5 supplements
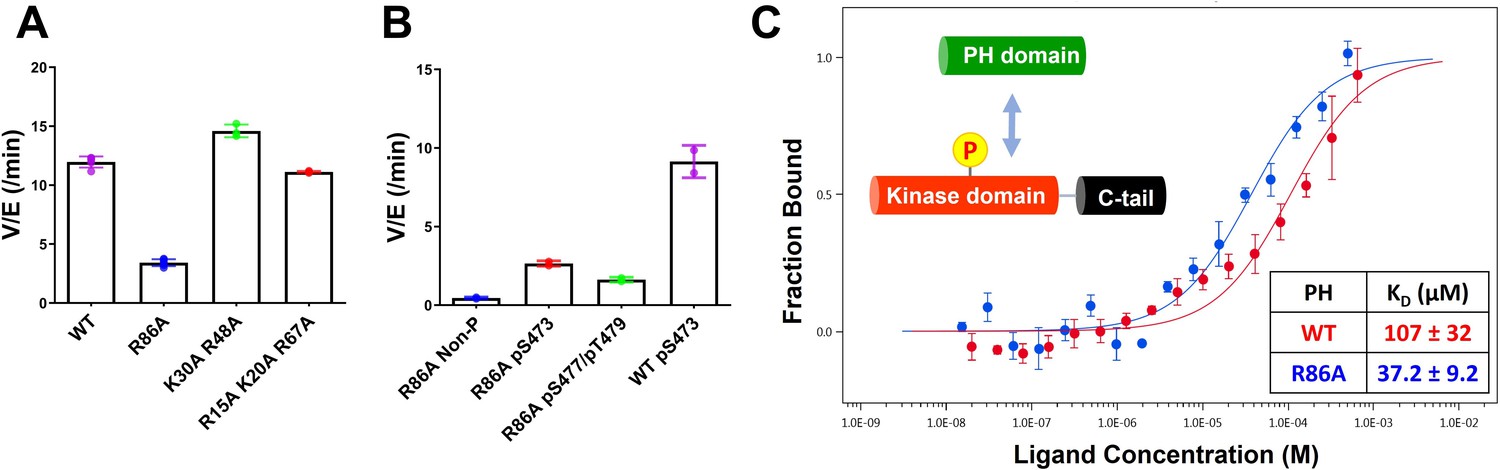
Structural studies on the R86A PH domain using NMR and X-ray crystallography.
(A) 1H-15N HSQC NMR spectra of 15N-labeled isolated PH domain. WT: blue, R86A: red. (B) Quantified chemical shift perturbations (CSPs) by R86A. Combined CSPs are plotted along the PH domain primary sequence for R86A isolated PH domain (top) and R86A PH domain in full-length Akt (bottom) referenced to the corresponding WT constructs. Red dash lines correspond to the standard deviation to the mean, excluding outliers (higher than ×3 SDM). Negative bars (–0.1) indicate nonassigned residues. (C) CSPs between WT and R86A PH domains corresponding to spectra in (A) are represented on a white (not significant) to red (maximum CSP) scale on the X-ray structure of R86A PH domain. Ala86 is shown in cyan. Most CSPs form a disk around the mutation site, but longer-range effects are seen as well. (D) X-ray crystal structure of the WT PH domain (PDB: 1UNP) or (E) the R86A PH domain (PDB: 7MYX). (F) The 2Fo–Fc omit map contoured at 1 sigma around E17 and Y18 residues of the isolated R86A PH domain.
-
Figure 3—source data 1
Quantification of chemical shift perturbations by R86A in the isolated PH domain or the PH domain in full-length Akt.
- https://cdn.elifesciences.org/articles/80148/elife-80148-fig3-data1-v2.zip
Figure 3—figure supplement 1
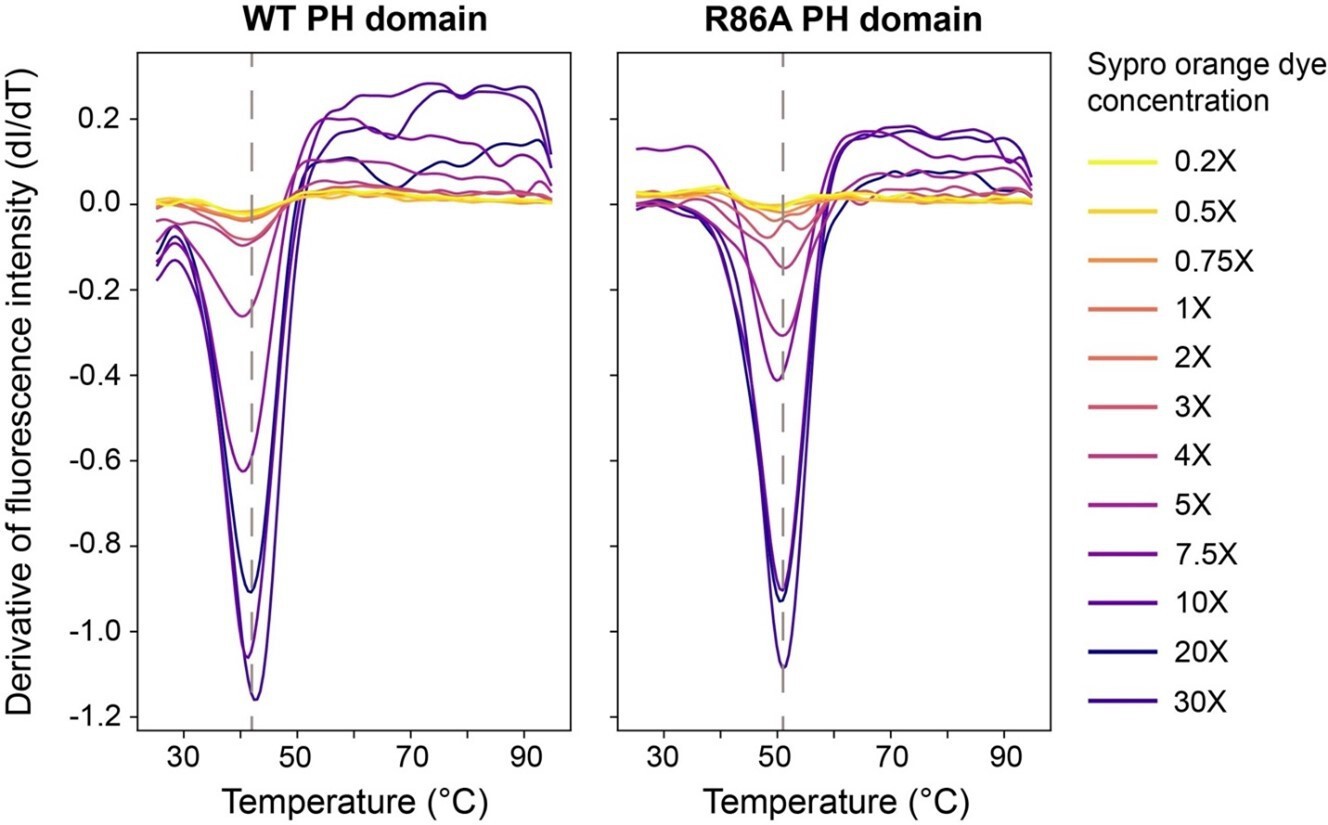
Thermal stability of PH domains.
Differential scanning fluorescence intensity plotted as derivative to the temperature for a range of Sypro orange dye concentrations (color code). Fitted melting temperatures (Tm) are 42°C and 51°C for WT and R86A PH domains, respectively.
Figure 3—figure supplement 2
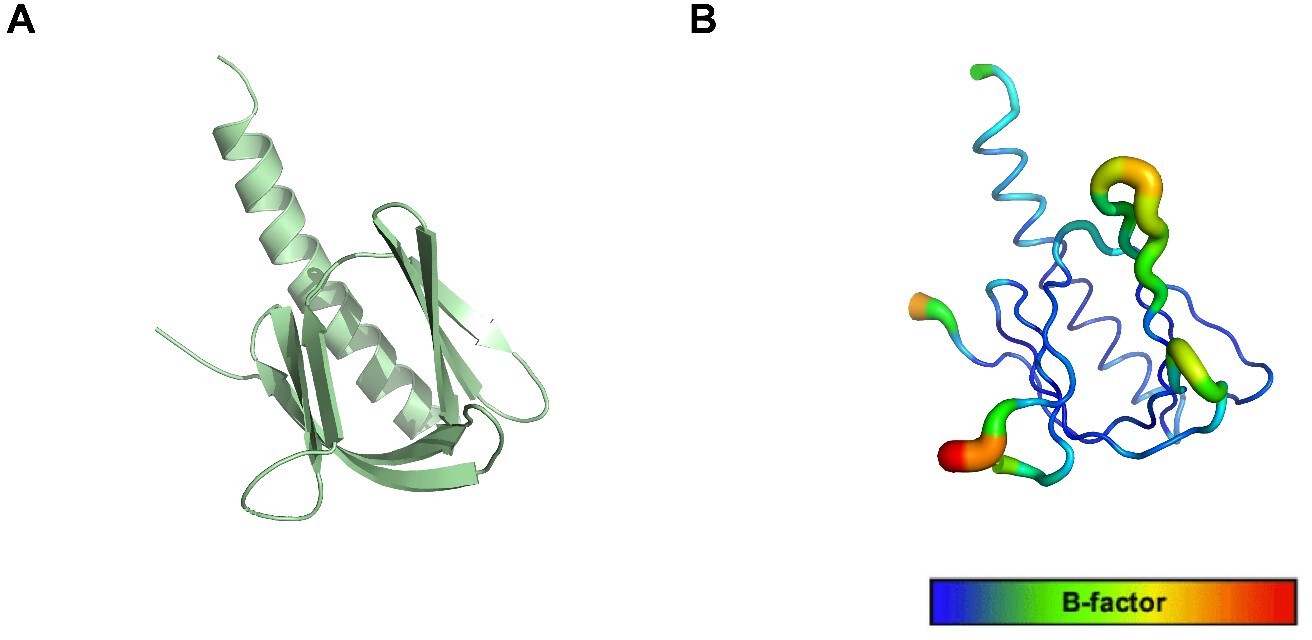
The structure of the R86A PH domain with b-factor values.
(A) The whole X-ray structure of the R86A (PDB: 7MYX). (B) B-factor values are represented on a blue (lowest) to red (highest) scale on the R86A structure.
Figure 3—figure supplement 3
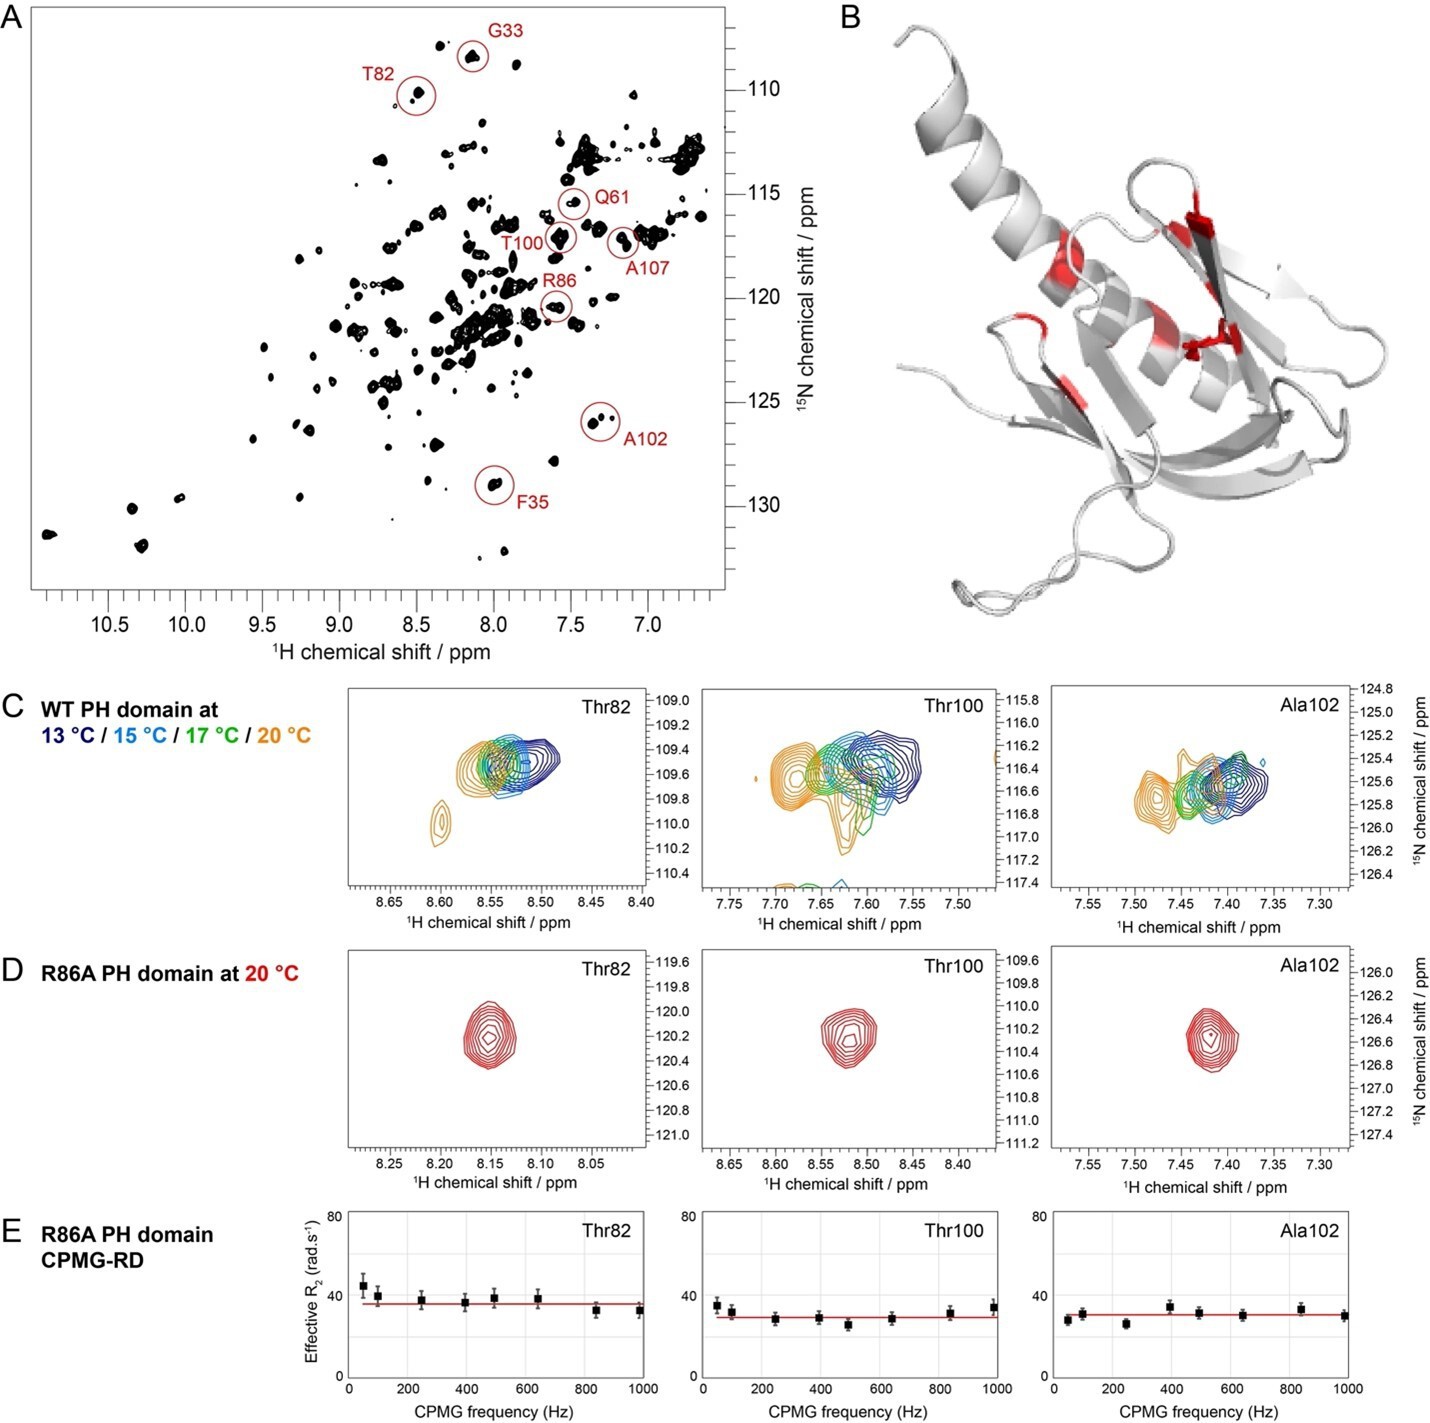
R86A removes WT PH domain dynamics.
(A) 1H-15N HSQC spectrum of WT PH domain at 20°C. Residues that exhibit evidence of multiple conformations (multiple NMR signals) are circled in red. (B) Residues exhibiting multiple conformations are displayed in red on the crystal structure of WT PH domain (PDB: 1UNP). R86 is shown in stick representation. The disk-like arrangement around the PH domain is reminiscent of Figure 3C. (C) 1H-15N HSQC spectra of WT PH domain at different temperatures. Examples of residues that exhibit multiple conformations in the isolated WT PH domain are shown. These multiple conformations are temperature-dependent, which is an indication of conformational exchange. (D) 1H-15N HSQC spectrum at 20°C for Thr82, Thr100, and Ala102 in R86A. There is no evidence of multiple conformations. (E) Carr-Purcell-Meiboom-Gill (CPMG) relaxation-dispersion profiles for Thr82, Thr100, and Ala102 in R86A. There is no dispersion, indicating no dynamics in the μs-ms timescale.
-
Figure 3—figure supplement 3—source data 1
NMR relaxation studies on the R86A PH domain.
- https://cdn.elifesciences.org/articles/80148/elife-80148-fig3-figsupp3-data1-v2.zip
Figure 3—figure supplement 4
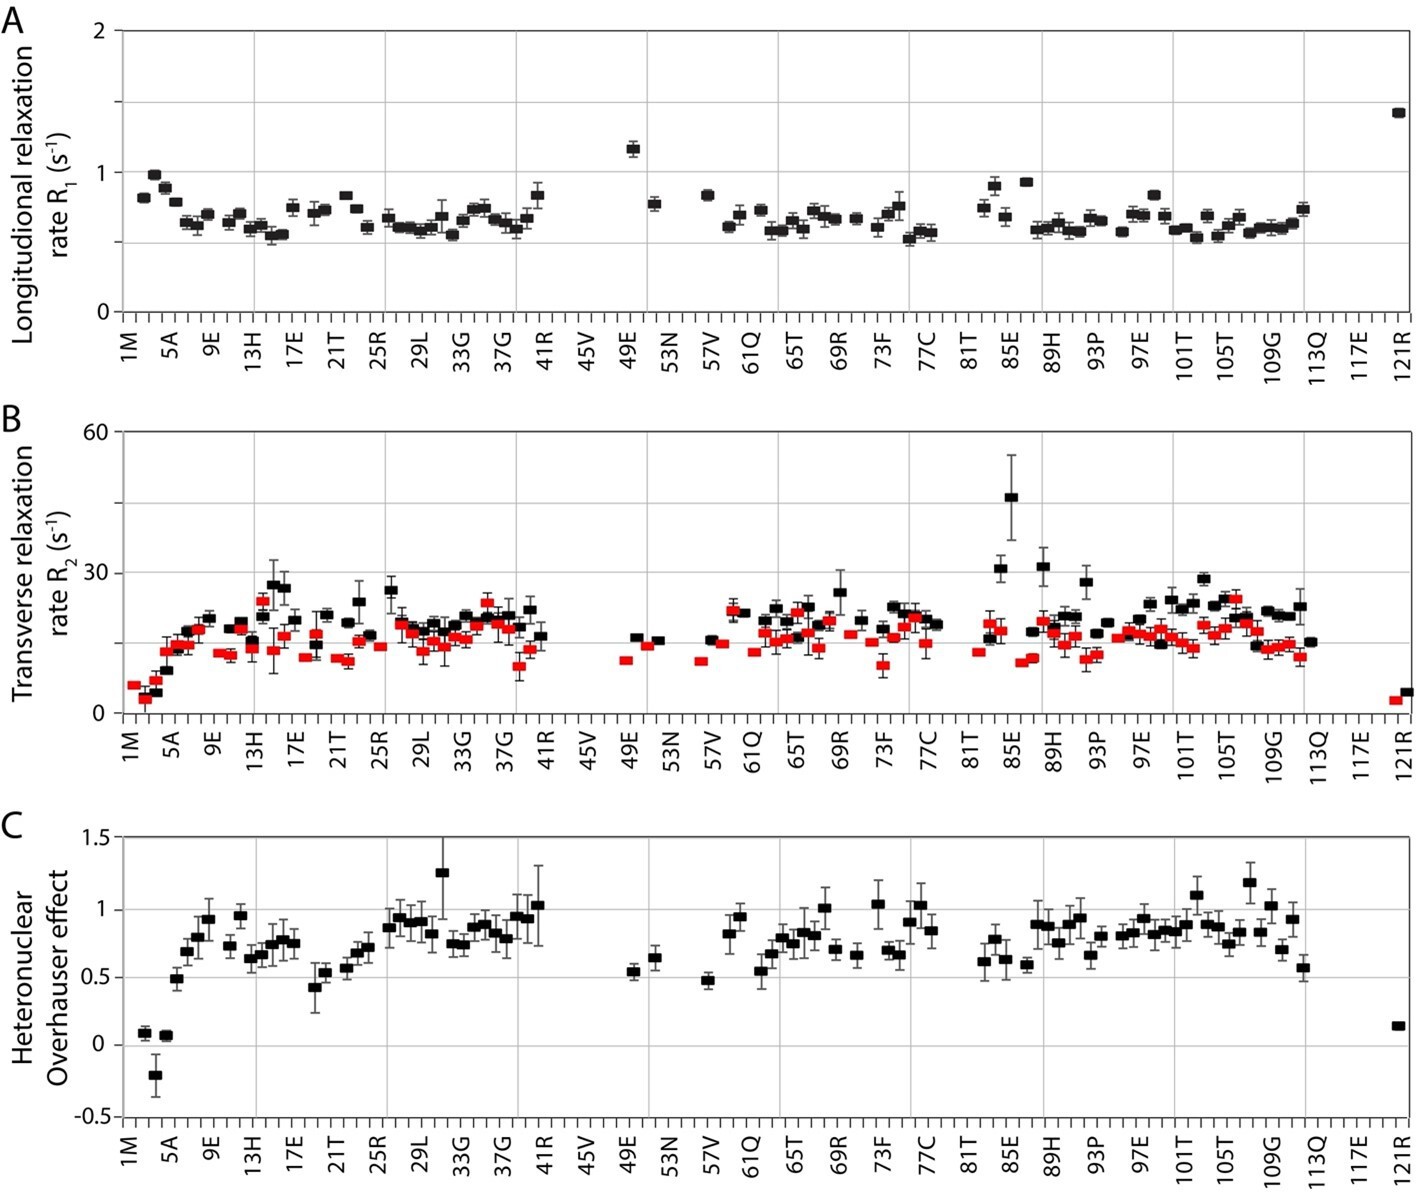
Rigidity of PH domain R86A mutant.
(A) Residue-specific longitudinal relaxation rates (15N R1) are below 1, except for the flexible loop and C-termal residue. (B) Residue-specific transverse relaxation rates (15N R2, black) and transverse dipole-dipole/chemical shift anisotropy cross-correlated relaxation rates (Etaxy, red) show high rigidity of R86A and no significant evidence for chemical exchange apart from local effects around the mutation site. (C) {1H-}15N heteronuclear Overhauser effects are well above 0.65 in regions of secondary structure. The correlation time calculated from the average R2/R1 is 8.73 ns, corresponding to a molecular weight of 14.6 kDa (very close to the construct 14.4 kDa).
Figure 3—figure supplement 5
Modes of interaction of WT and R86A PH domains to Akt kinase domain.
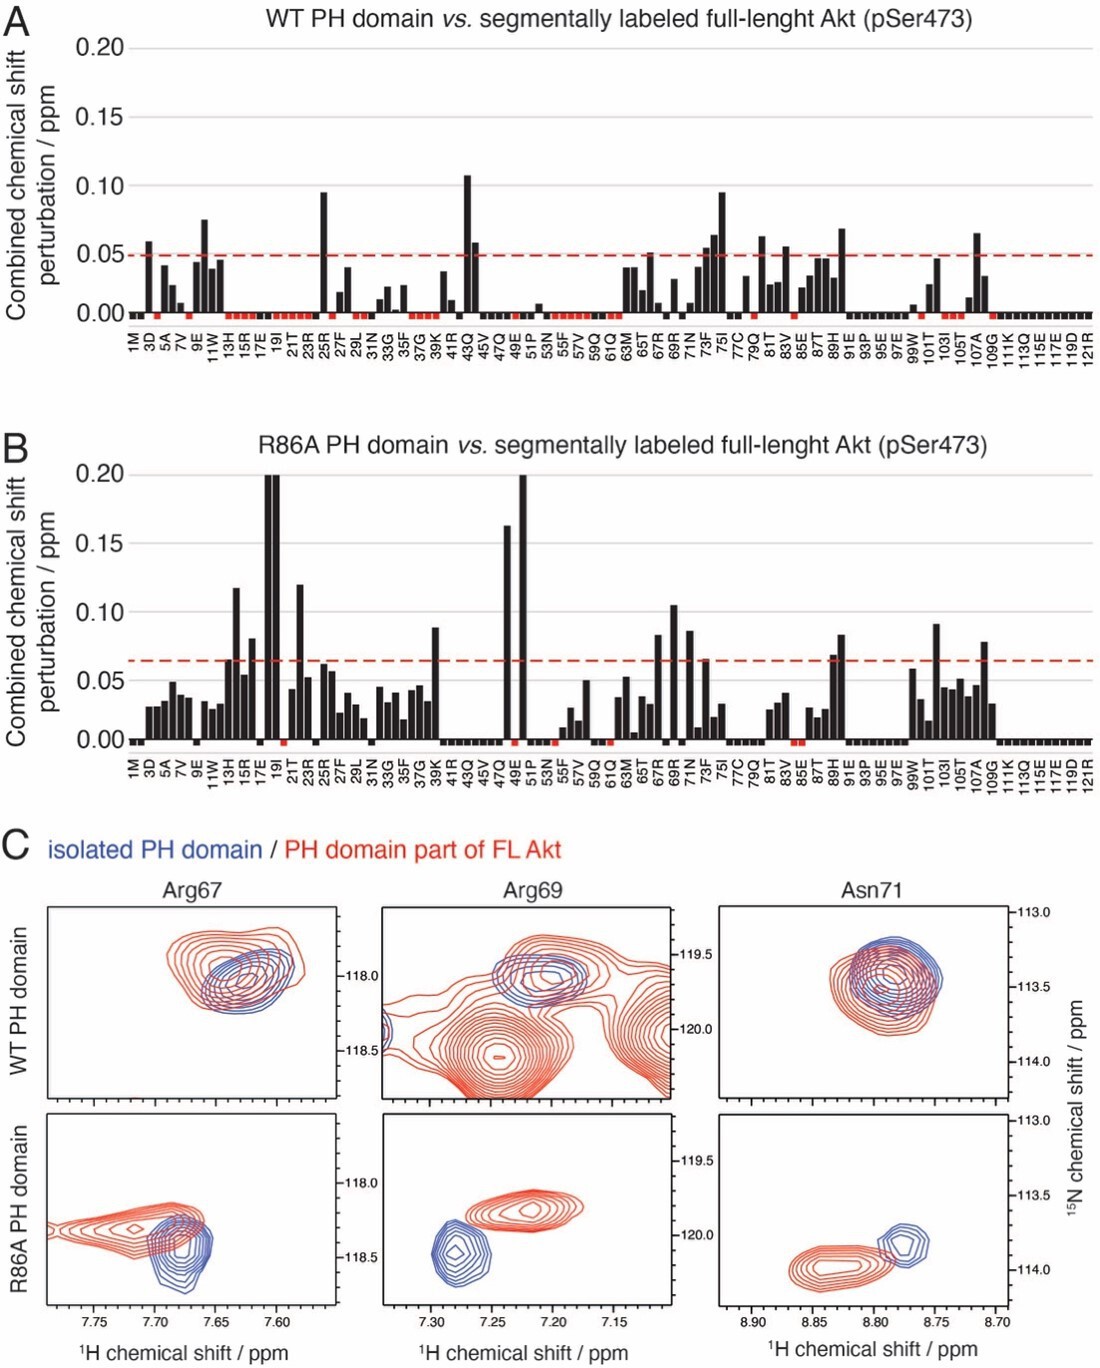
(A–B) Combined chemical shift perturbations between WT (A) or R86A (B) isolated PH domain and part of the full-length Akt (pSer473) plotted along the PH domain primary sequence. Red dotted lines correspond to the standard deviation to the mean, excluding outliers (higher than ×3 SDM). Black negative bars indicate nonassigned residues. Red negative bars indicate residues which NMR signal is absent from segmentally labeled spectra, either because their intensities are too weak or because they are broadened by their strong interaction with the kinase domain. A more complete pattern is obtained for R86A due to the higher percentage of assigned residues. Notable differences in interaction are seen around residues 67–73. As examples, peaks corresponding to Arg67, Arg69, and Asn71 are shown (C).
Figure 4 with 3 supplements
E17K and Y18A mutations promote the catalytic activity of Akt and disrupt the interdomain interactions between the PH and kinase domains.
(A) MST (microscale thermophoresis) binding experiments using N-terminally Cy5-labeled kinase domain with pT308 as a target protein and isolated PH domain as a ligand. R86A: blue, E17K/R86A: yellow, Y18A/R86A: red (n=3, SEM shown). (B) Steady-state kinetic plots of full-length Akt mutants with pT308 (B) in the absence or (C) presence of a pS473 C-tail modification (A6–A13). Kinase assays were performed with each Akt mutant in buffer containing 20 μM GSK3 peptide substrate and varying amounts of ATP (0–2.5 mM). Kinetic parameters of each Akt mutant were determined from V/[E] versus [ATP] plots (n=2, SEM shown).
-
Figure 4—source data 1
Kinase activity assays with full-length Akt mutants (WT, R86A, E17K, Y18A) having pT308 and non-phosphorylated C-tail.
- https://cdn.elifesciences.org/articles/80148/elife-80148-fig4-data1-v2.zip
-
Figure 4—source data 2
Kinase activity assays with full-length Akt mutants (WT, R86A, E17K, Y18A) having pT308 and pS473.
- https://cdn.elifesciences.org/articles/80148/elife-80148-fig4-data2-v2.zip
Figure 4—figure supplement 1
The role of the hydroxyl group of Tyr18 in the PH-kinase domain interaction.
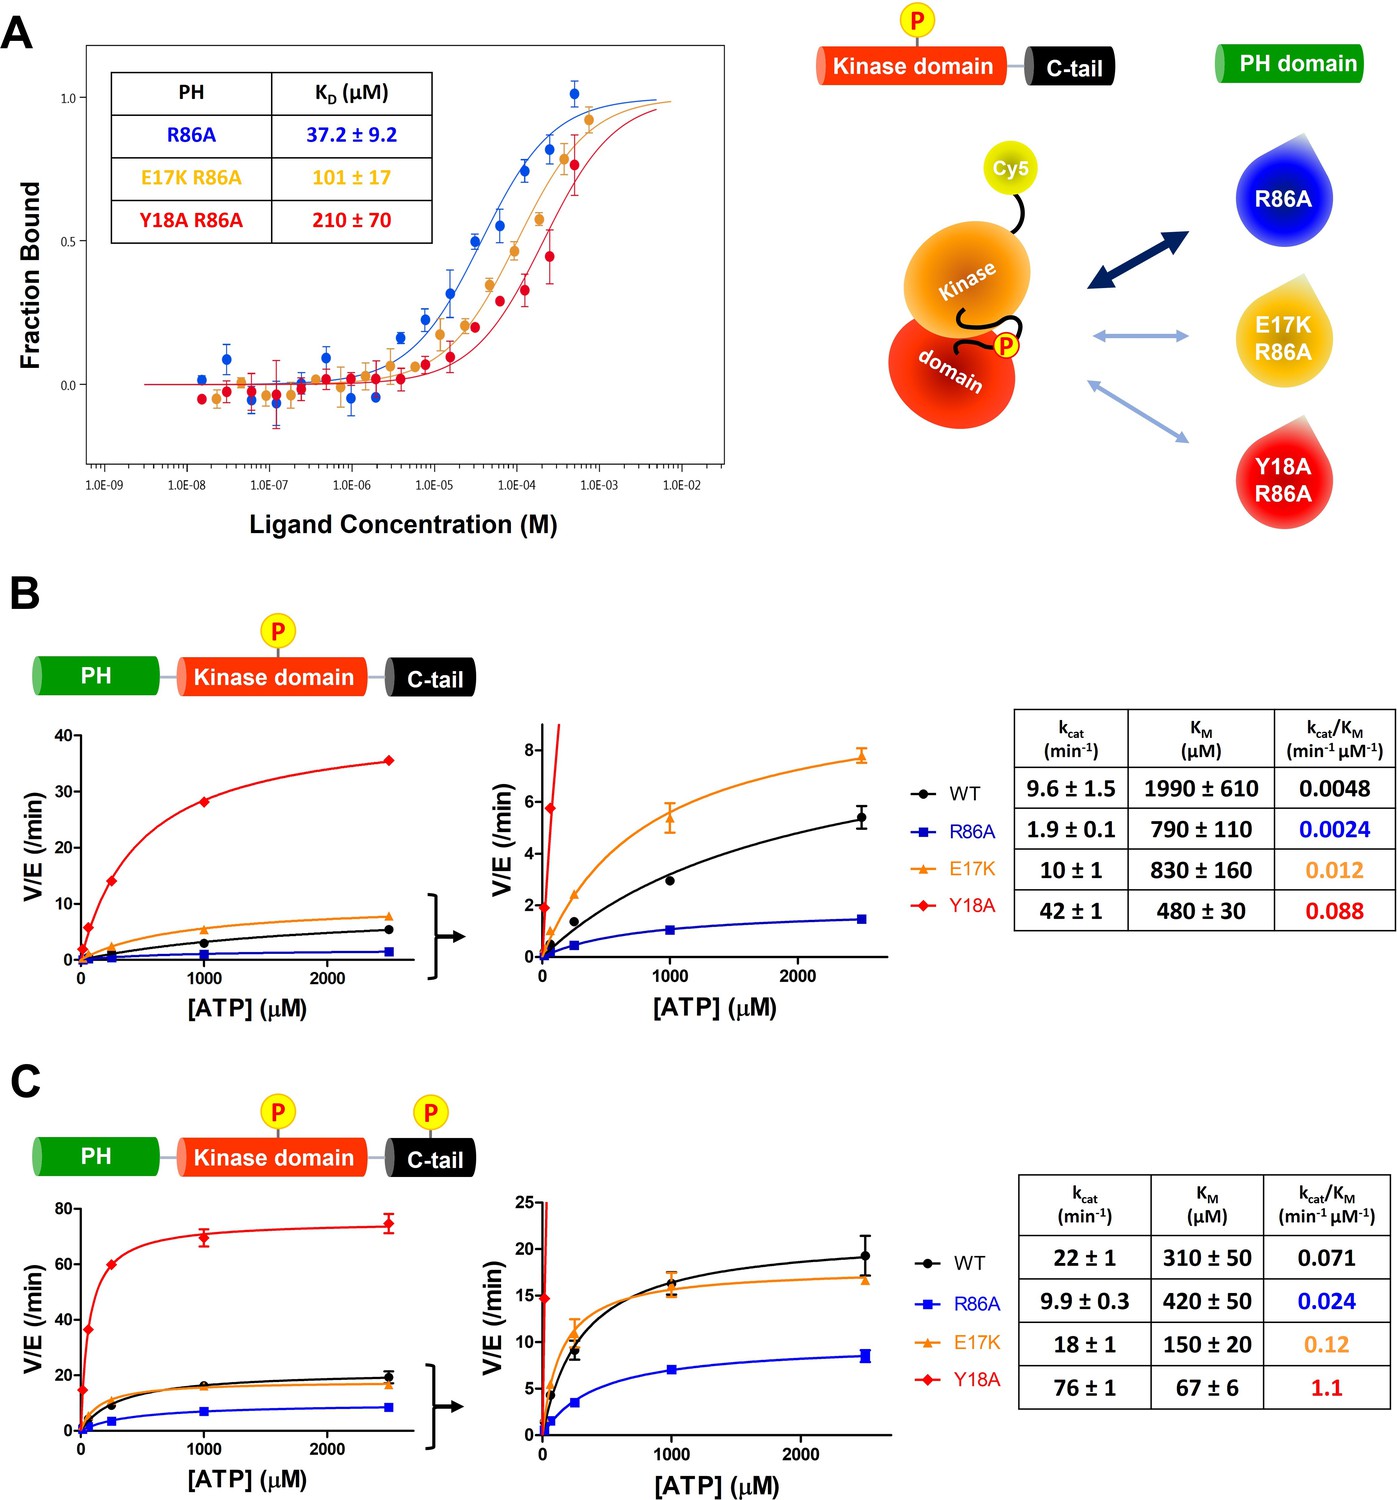
(A–B) MST (microscale thermophoresis) binding experiments using N-terminally Cy5-labeled kinase domain with pT308 as a target protein and isolated PH domain as a ligand. R86A: blue, Y18A R86A: red, Y18F/R86A: green, E17K/R86A: yellow, E17K/Y18F/R86A: purple (n=3, SEM shown). The obtained binding affinity (KD) values were showed in the tables. (C) Crystal structure of the E17K PH domain complexed with IP4 (PDB: 2UZS) showing a hydrogen bond between the mutated lysine residue at the Glu17 position and the hydroxyl group of Tyr18 (IP4, not shown).
Figure 4—figure supplement 2
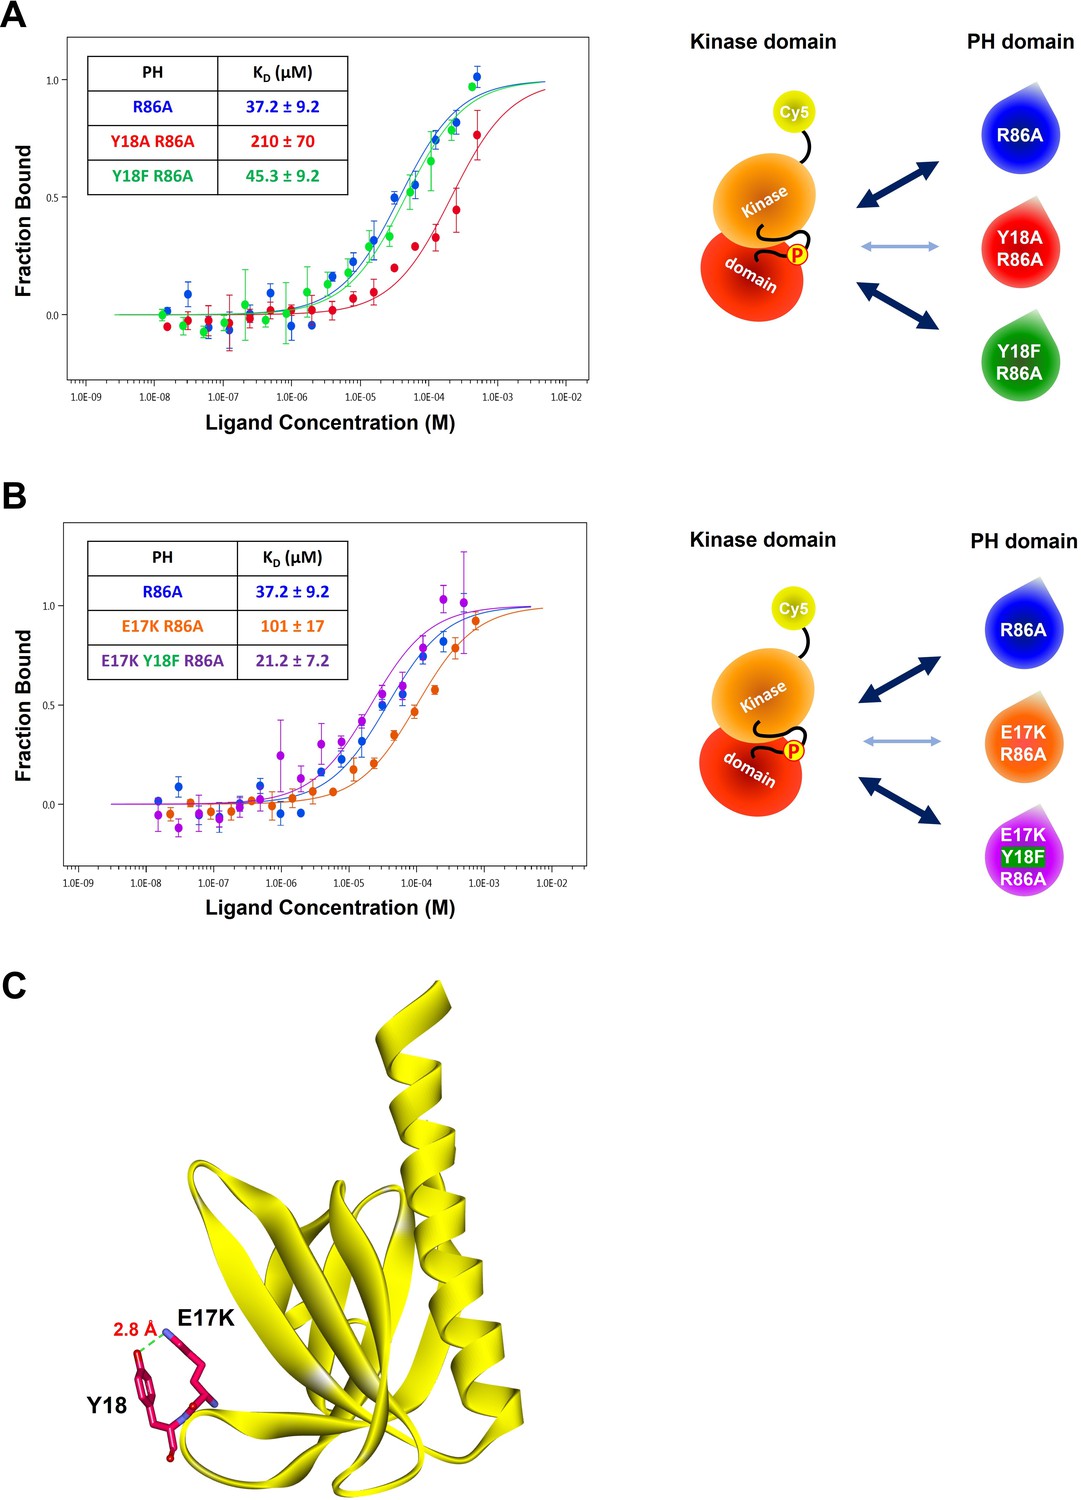
Semisynthesis of Akt mutants containing pT308 in the absence or presence of pS473 using a two-piece ligation strategy.
(A) Semisynthesis of Akt mutant forms having pT308 with or without pS473 (A6–A13). The intact PH domain-kinase domain constructs having different mutations were expressed using insect cells and then ligated with either non-phosphorylated or S473-phosphorylated synthetic C-tail peptides to make full-length Akt mutant forms. PDK1-catalyzed phosphorylation was performed to introduce pT308 into the activation loop before the C-tail ligation reaction. (B) Western blot analysis to confirm the phosphorylation levels at Ser473 and Thr308 of each Akt construct.
-
Figure 4—figure supplement 2—source data 1
Raw western blot images showing the phosphorylation levels at Ser473 and Thr308 of each Akt construct.
- https://cdn.elifesciences.org/articles/80148/elife-80148-fig4-figsupp2-data1-v2.zip
Figure 4—figure supplement 3
Validation of full-length Akt mutant proteins.
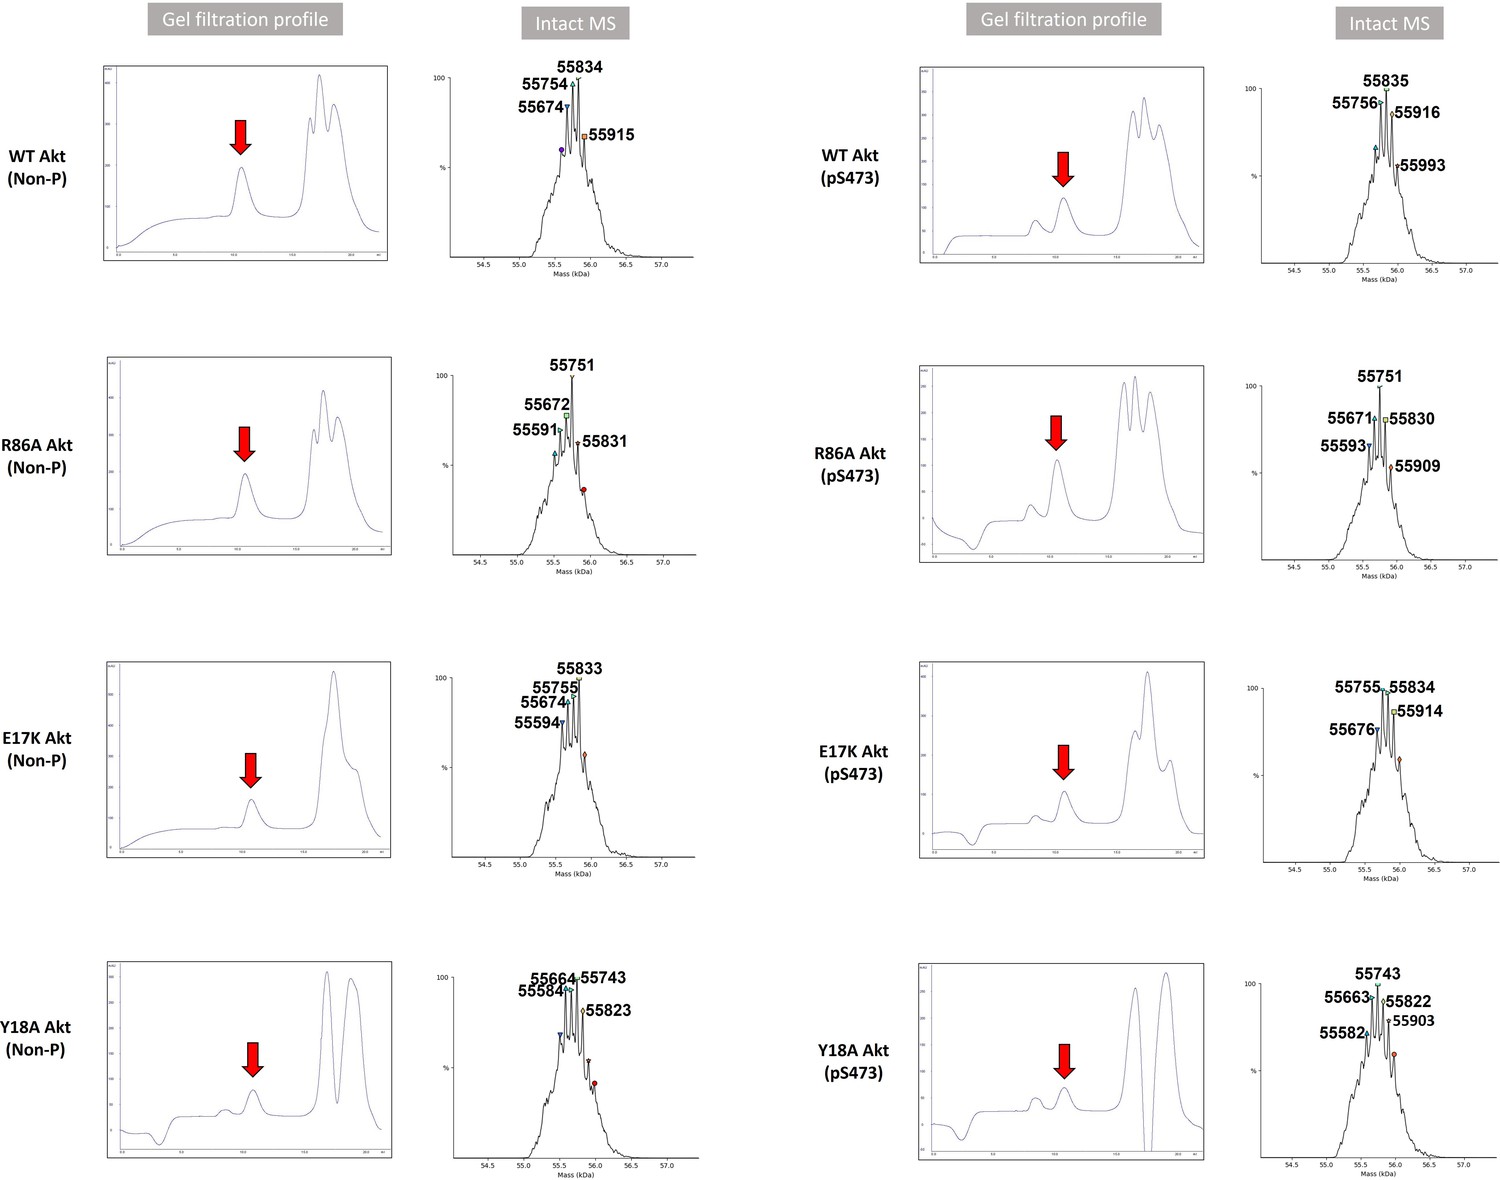
Gel filtration profile and intact MS analysis of each full-length Akt mutant having activation loop phosphorylation at Thr308 with or without C-tail phosphorylation at Ser473 (Non-P or pS473). Calculated molecular weight of each Akt construct assuming Thr450 is phosphorylated and its N-terminus is acetylated after the N-terminal methionine cleavage: WT(Non-P) (A6): 55758.5 Da, R86A(Non-P)(A7): 55673.4 Da, E17K (Non-P)(A8): 55757.6 Da, Y18A(Non-P)(A9): 55666.5 Da, WT(pS473)(A10): 55838.5 Da, R86A(pS473)(A11): 55753.4 Da, E17K (pS473)(A12): 55837.6 Da, Y18A(pS473)(A13): 55746.4 Da.
Figure 5 with 1 supplement

Phospholipid, phosphatidylinositol 3,4,5-triphosphate (PIP3) binding affinities and PP2A-mediated phosphatase removal of pT308 among several full-length Akt mutant forms.
(A) PIP3 binding assays with several isolated Akt PH domain forms. WT: black, R86A: blue, E17K: yellow, Y18A: red, E17K Y18A: green. Fluorescent anisotropy spectra were obtained from the mixture of 50 nM fluorescein-labeled soluble (C8) PIP3 and varying amount of Akt PH domain (0–50 μM). The KD values were determined from fluorescence anisotropy versus PH domain protein concentration plots (n=3, SD shown). (B) Full-length Akt mutants have different sensitivities toward the dephosphorylation of pT308 by PP2A phosphatase. Dephosphorylation assays were performed with Akt mutants containing pT308 and lacking C-tail phosphorylation (A6–A9). The dephosphorylation rates were monitored by western blots with anti-pT308 antibody and T1/2 values shown were determined from plots for fraction of pT308 versus time (n≥3, SEM shown).
-
Figure 5—source data 1
Fluorescence anisotropy binding experiments to measure the phospholipid, phosphatidylinositol 3,4,5-triphosphate (PIP3) binding affinities of the PH domain mutants.
- https://cdn.elifesciences.org/articles/80148/elife-80148-fig5-data1-v2.zip
-
Figure 5—source data 2
Dephosphorylation assays using PP2A phosphatase on full-length Akt mutants containing pT308 and a non-phosphorylated C-tail with raw western blot images.
- https://cdn.elifesciences.org/articles/80148/elife-80148-fig5-data2-v2.zip
Figure 5—figure supplement 1
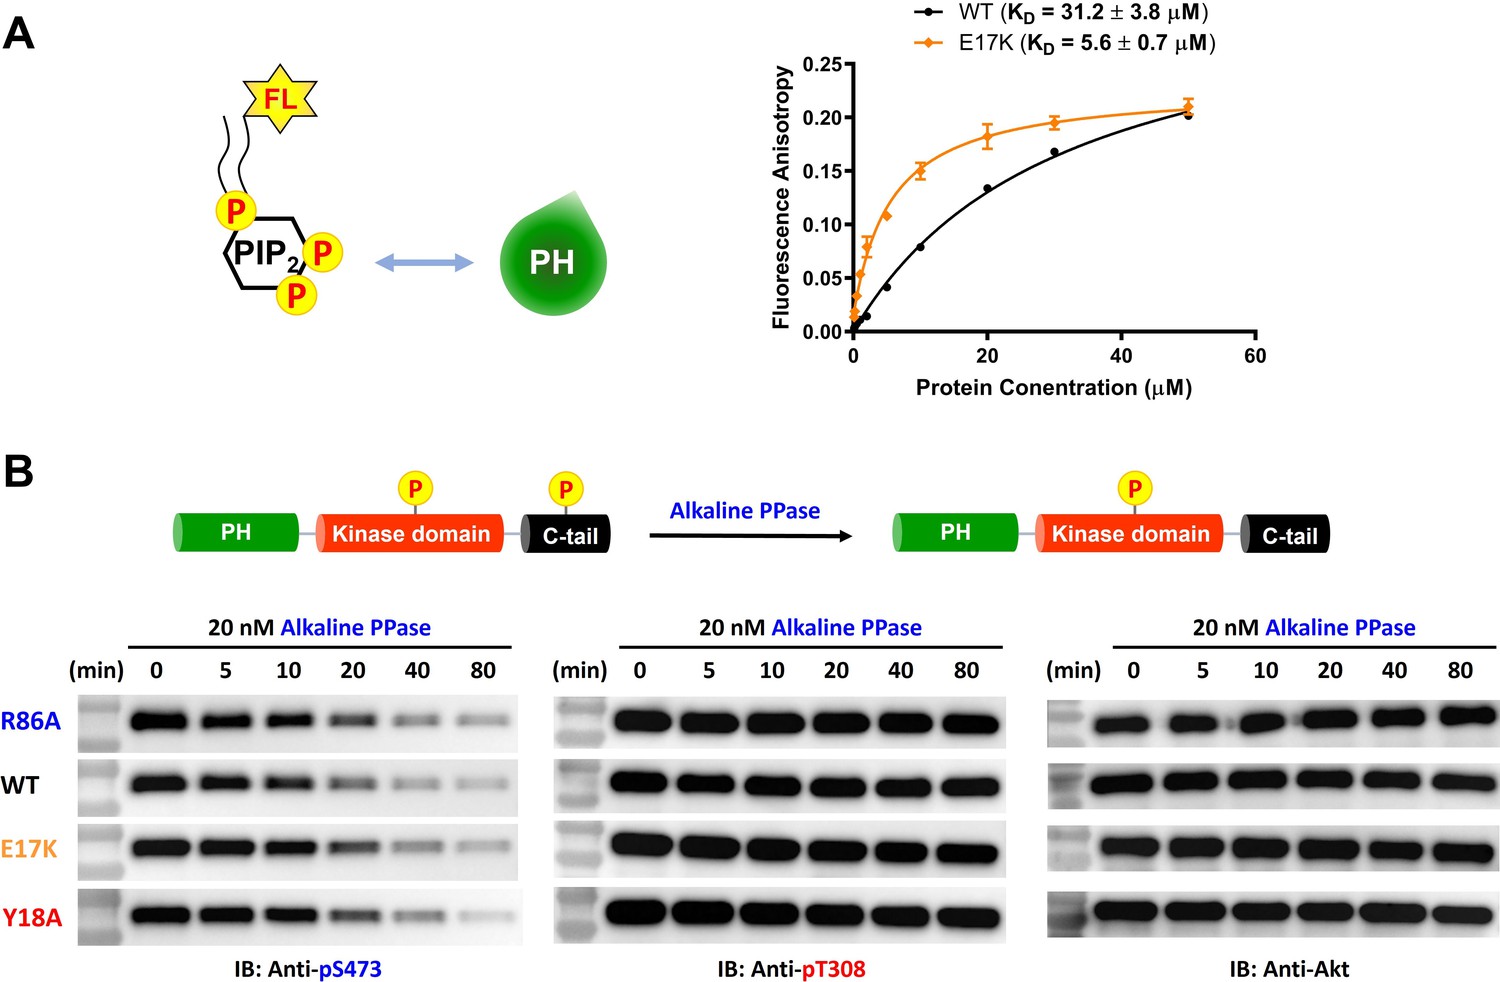
E17K mutation on the PH domain enhances its phosphatidylinositol 4,5-bisphosphate (PIP2) binding affinity while not changing sensitivity toward dephosphorylation of pS473.
(A) PIP2 binding assay with the isolated PH domain. WT: black, E17K: yellow. Fluorescent anisotropy spectra were obtained from mixtures of 50 nM fluorescein-labeled soluble (C8) PIP2 and varying amounts of Akt PH domain (0–50 μM). The KD values were determined from plots of fluorescence anisotropy versus PH domain protein concentration (n≥3, SD shown). (B) Alkaline phosphatase dephosphorylates Akt mutants at pS473 with similar rates, while not dephosphorylating pT308 under these conditions. Akt mutants with pT308 and pS473 (A10–A13) were employed for dephosphorylation assays with alkaline phosphatase. The dephosphorylation rates were monitored by western blots with anti-pS473, anti-pT308, anti-Akt antibodies.
-
Figure 5—figure supplement 1—source data 1
Fluorescence anisotropy binding experiments to measure the phosphatidylinositol 4,5-bisphosphate (PIP2) binding affinities of the PH domain mutants.
- https://cdn.elifesciences.org/articles/80148/elife-80148-fig5-figsupp1-data1-v2.zip
-
Figure 5—figure supplement 1—source data 2
Dephosphorylation assays using alkaline phosphatase on full-length Akt mutants having pT308 and pS473 with raw western blot images.
- https://cdn.elifesciences.org/articles/80148/elife-80148-fig5-figsupp1-data2-v2.zip
Figure 6 with 4 supplements
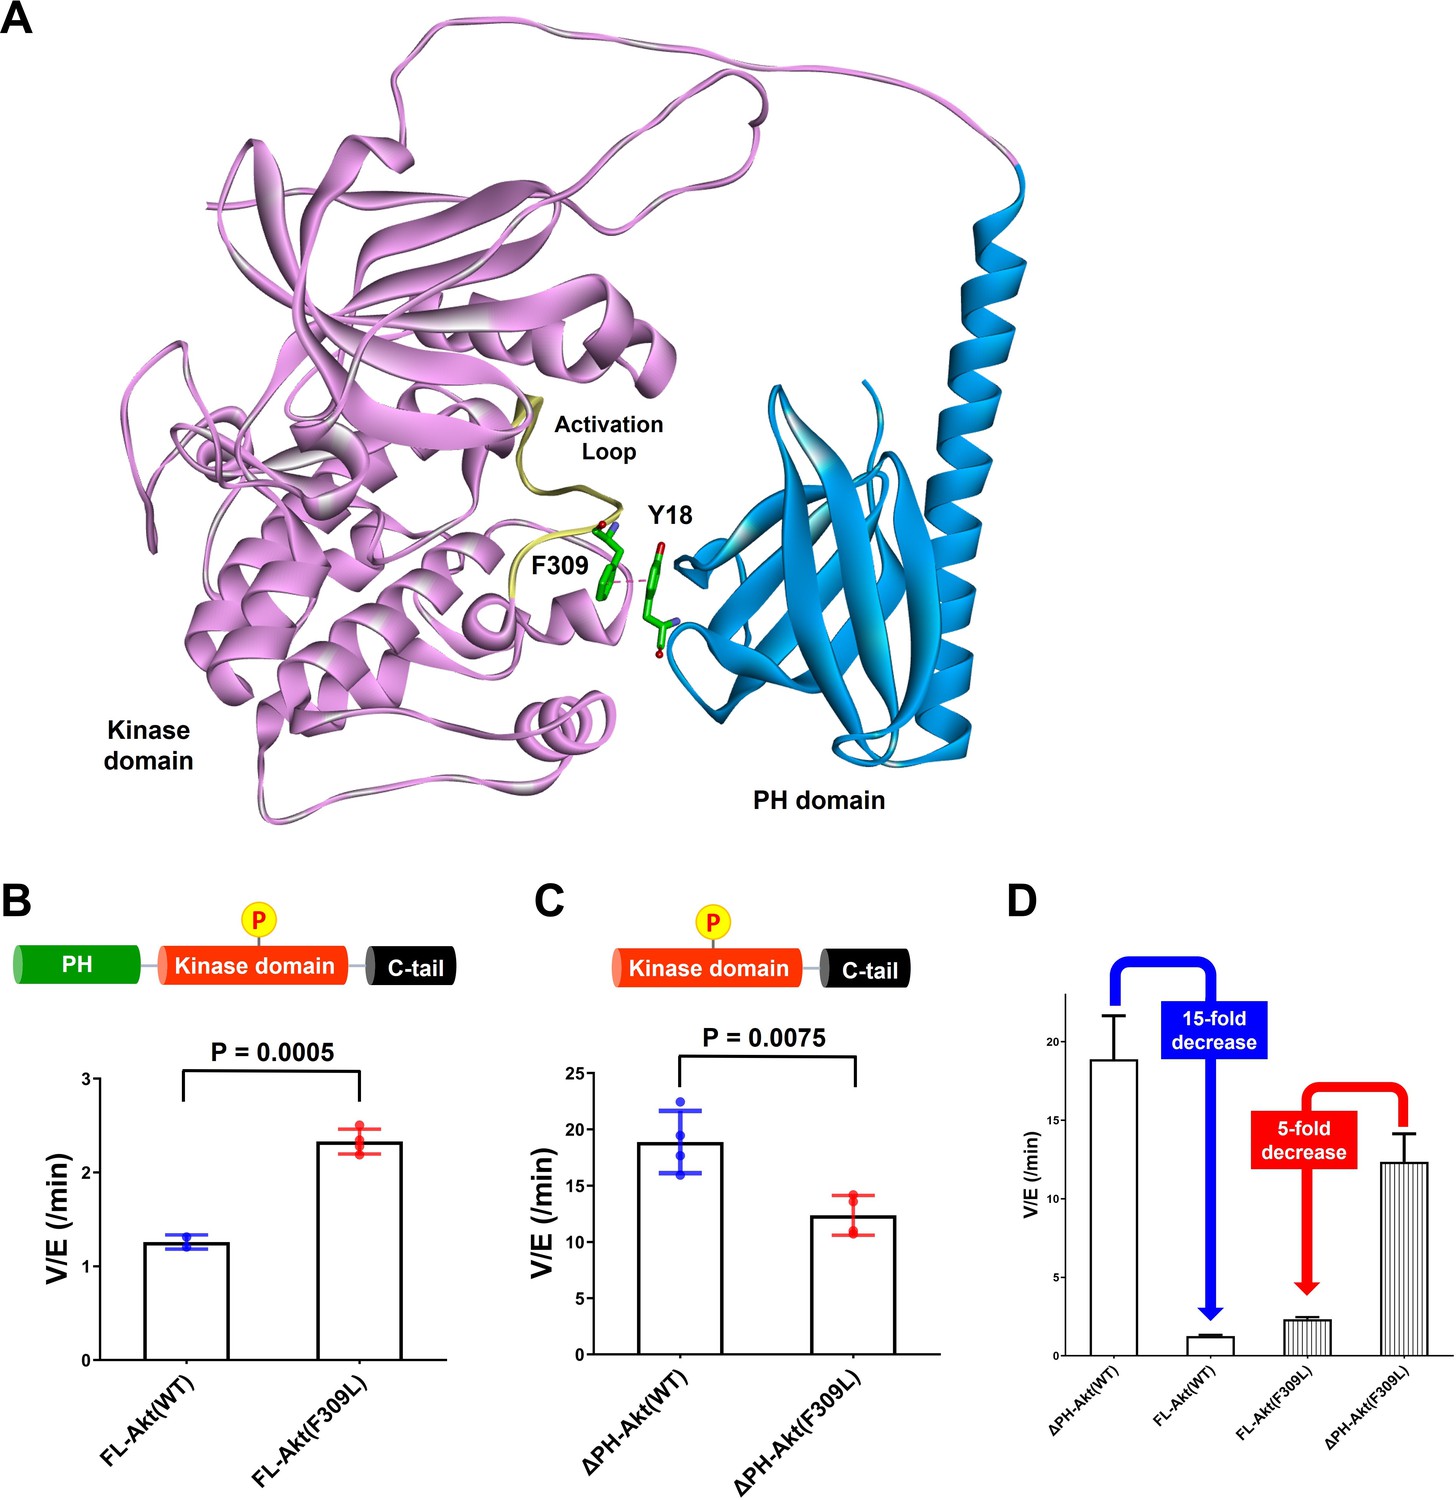
Investigating the role of Phe309 in PH domain-mediated Akt autoinhibition.
(A) Proposed interaction between Tyr18 of the PH domain and Phe309 on the activation loop of the Akt kinase domain in the AlphaFold-predicted full-length Akt structure. (B) Enzymatic activities of full-length WT (A6) or F309L (A14) Akt mutant forms containing pT308 and non-phosphorylated C-tails. (C) Enzymatic activities of PH domain-deleted WT or F309L Akt mutant forms containing pT308 and non-phosphorylated C-tails. (D) The enzymatic activities of WT (A16) or F309L (A15) Akt mutant forms conferred by the PH domain. Kinase assays were performed with each Akt construct in a buffer containing 250 μM ATP and 20 μM GSK3 peptide as substrates (n = 4, SD shown).
-
Figure 6—source data 1
Kinase activity assays with full-length or PH domain-deleted Akt mutant forms (WT, F309L) having pT308 and non-phosphorylated C-tail.
- https://cdn.elifesciences.org/articles/80148/elife-80148-fig6-data1-v2.zip
Figure 6—figure supplement 1
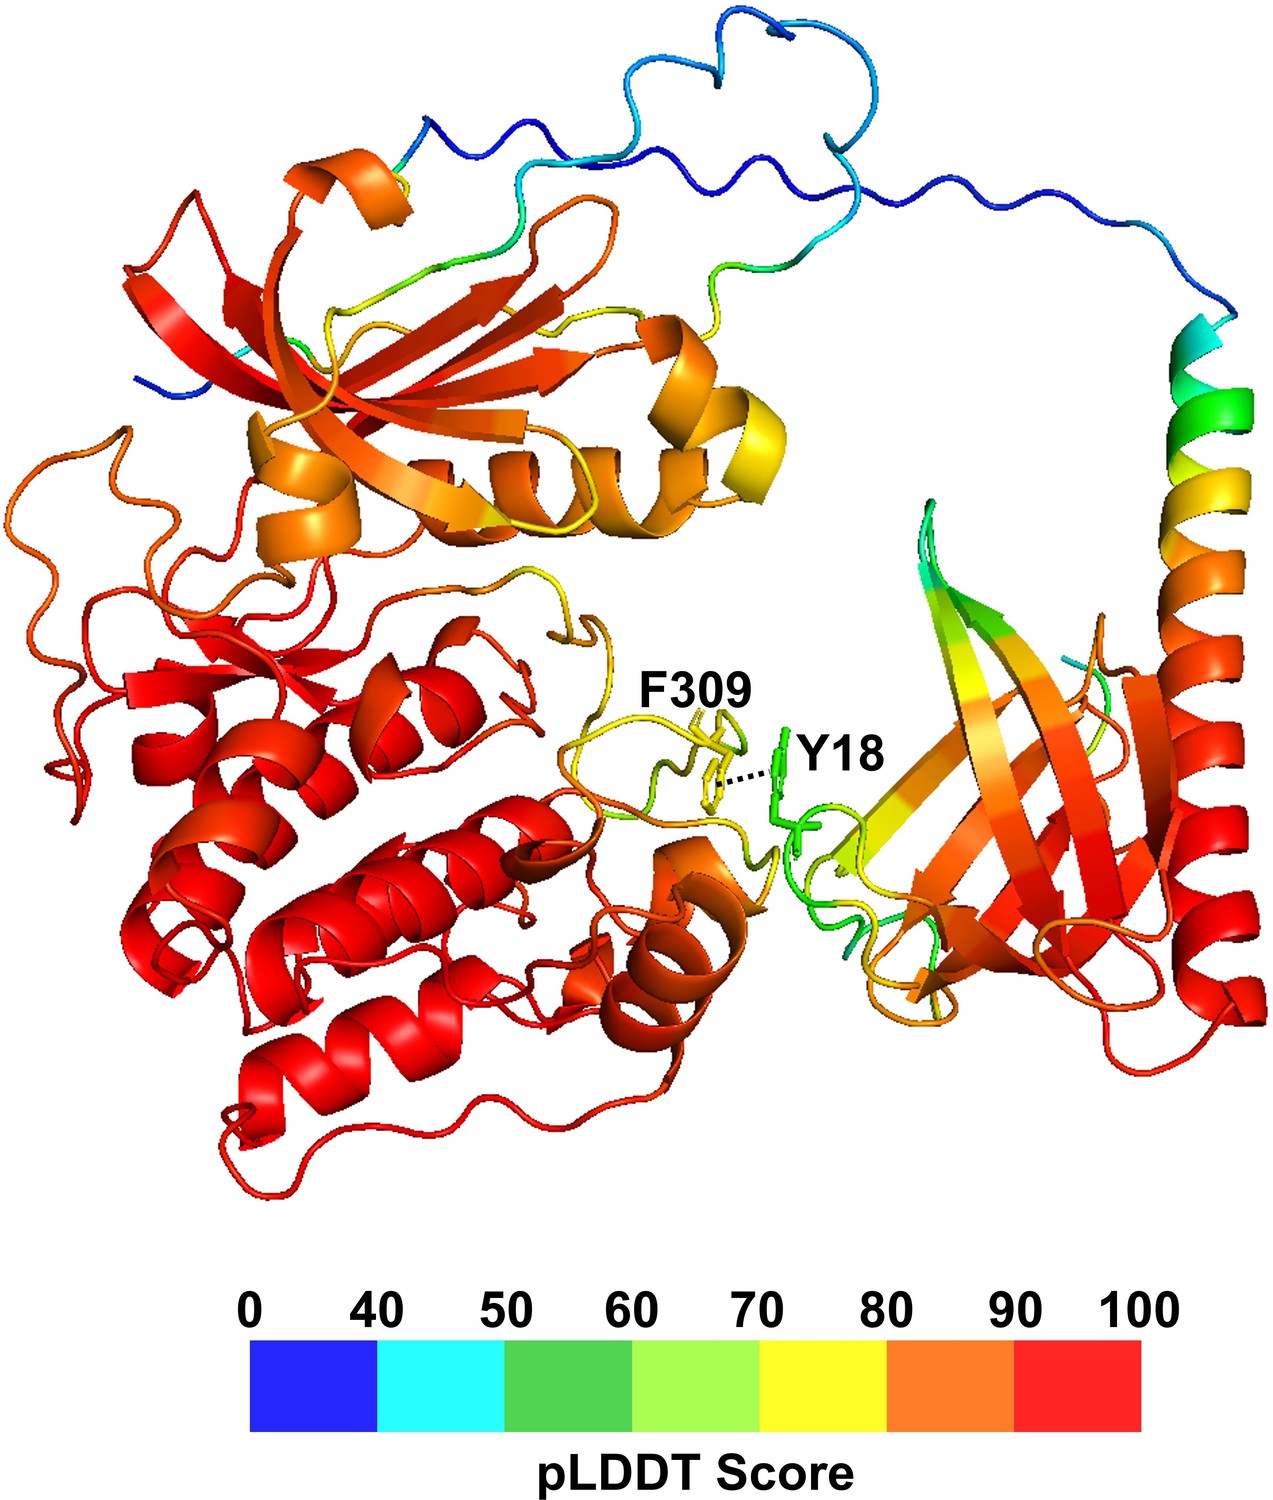
The AlphaFold-predicted full-length Akt structure with its confidence score (pLDDT).
pLDDT scores are represented on a blue (lowest) to red (highest) scale on the full-length Akt structure. pLDDT > 90 (red) indicates regions that are modeled with high accuracy. Regions with 90 > pLDDT > 70 (orange and yellow) are generally well predicted. Regions with 70 > pLDDT > 50 (green) have low confidence. pLDDT < 50 (blue) indicates regions that are expected to be disordered.
Figure 6—figure supplement 2
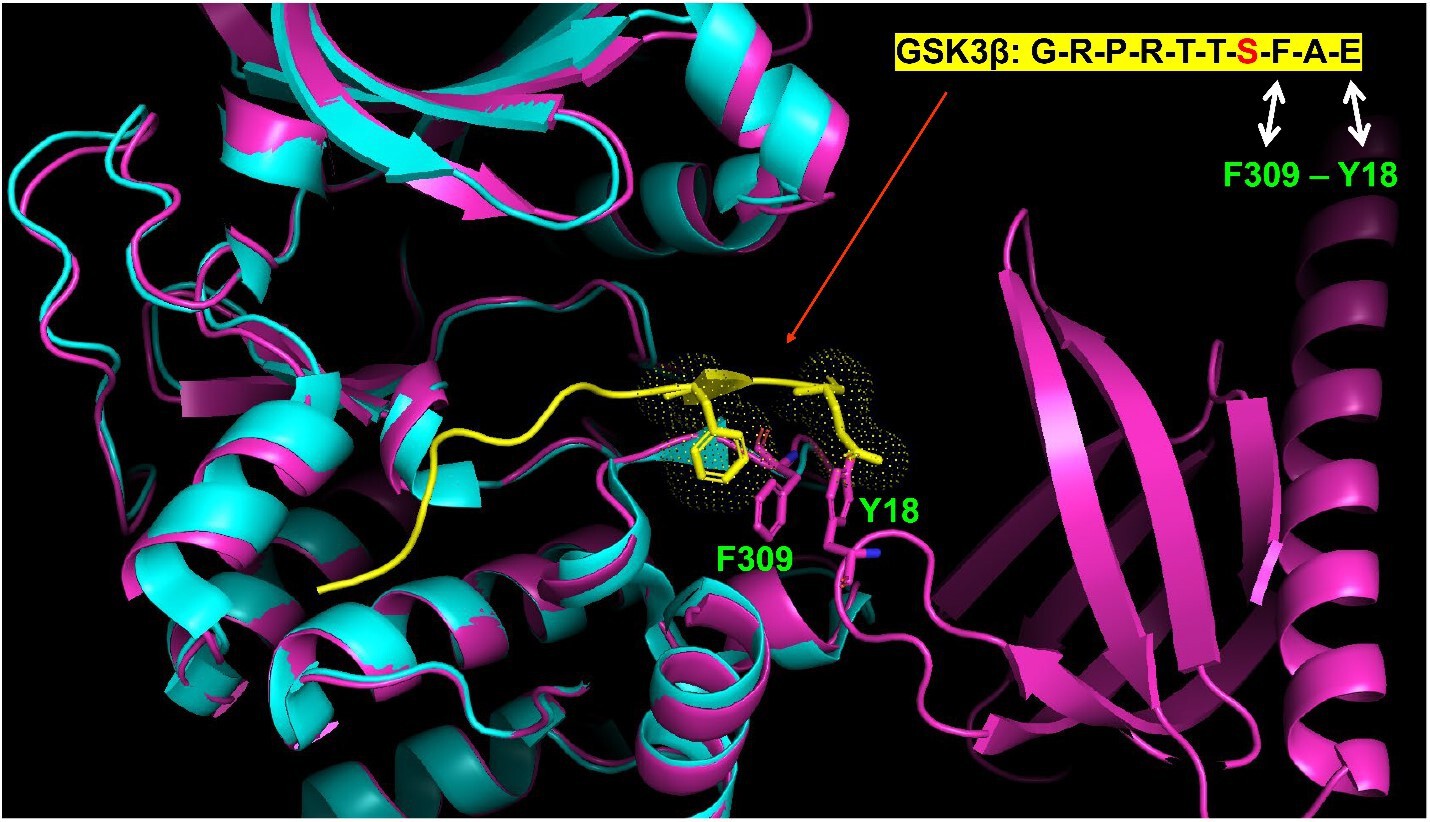
The proposed F309-Y18 interaction would sterically clash with residues on an Akt peptide substrate.
Superimposition of Google AlphaFold-predicted full-length Akt structure (pink) and the crystal structure of the kinase domain of Akt (cyan) with GSK3β peptide substrate (yellow) (PDB: 6NPZ).
Figure 6—figure supplement 3
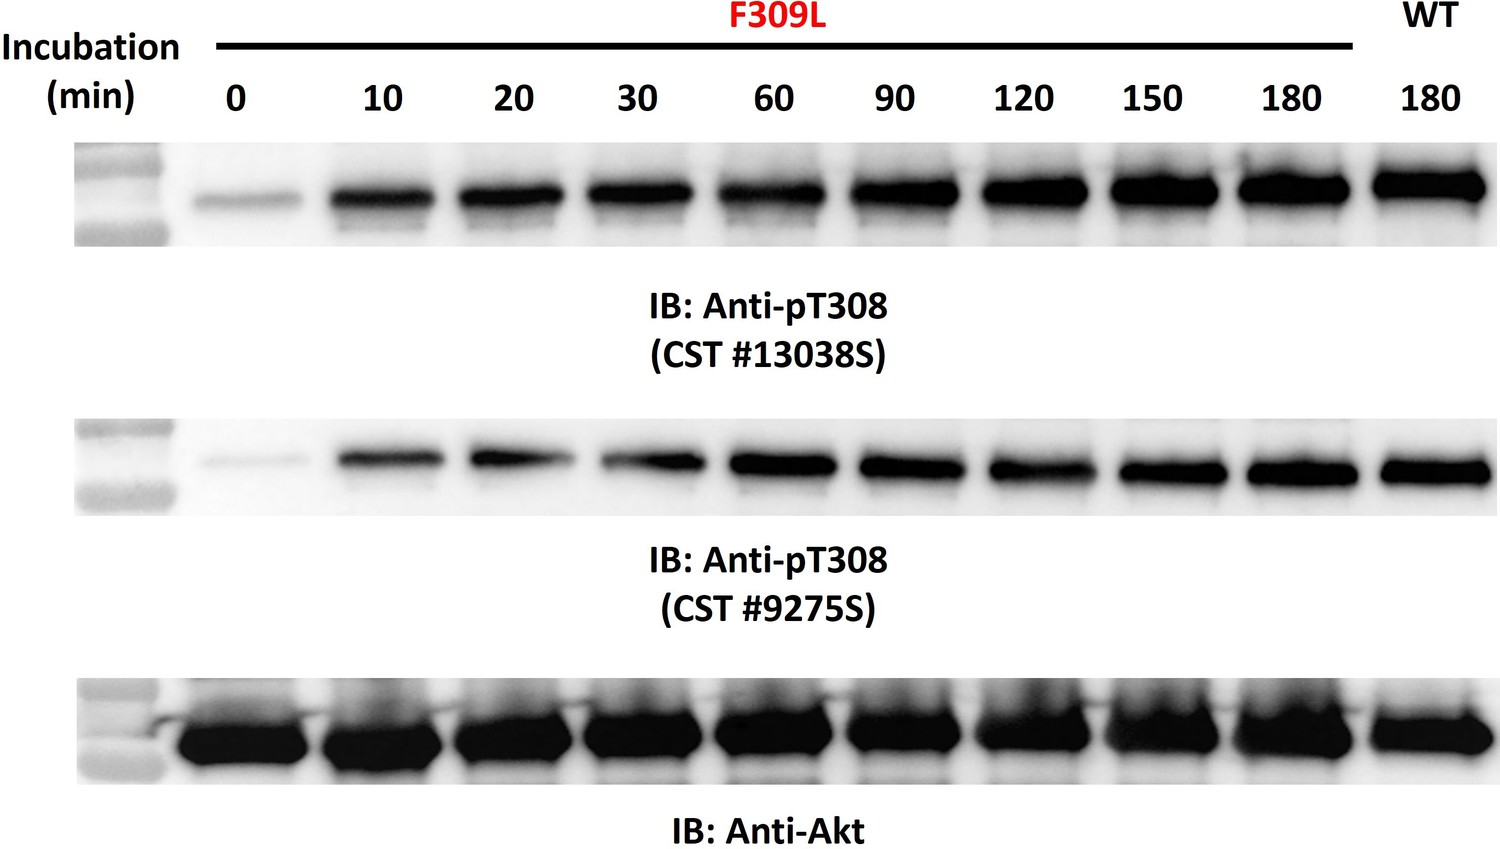
The F309L Akt mutant is efficiently phosphorylated at Thr308 via in vitro by PDK-1.
Time-dependent western blot-based monitoring of in vitro PDK1 phosphorylation at Thr308 of F309L Akt mutant by using two kinds of pT308-specific antibodies.
-
Figure 6—figure supplement 3—source data 1
Raw western blot images showing the efficient phosphorylation of the F309L mutant at Thr308 by PDK-1.
- https://cdn.elifesciences.org/articles/80148/elife-80148-fig6-figsupp3-data1-v2.zip
Figure 6—figure supplement 4
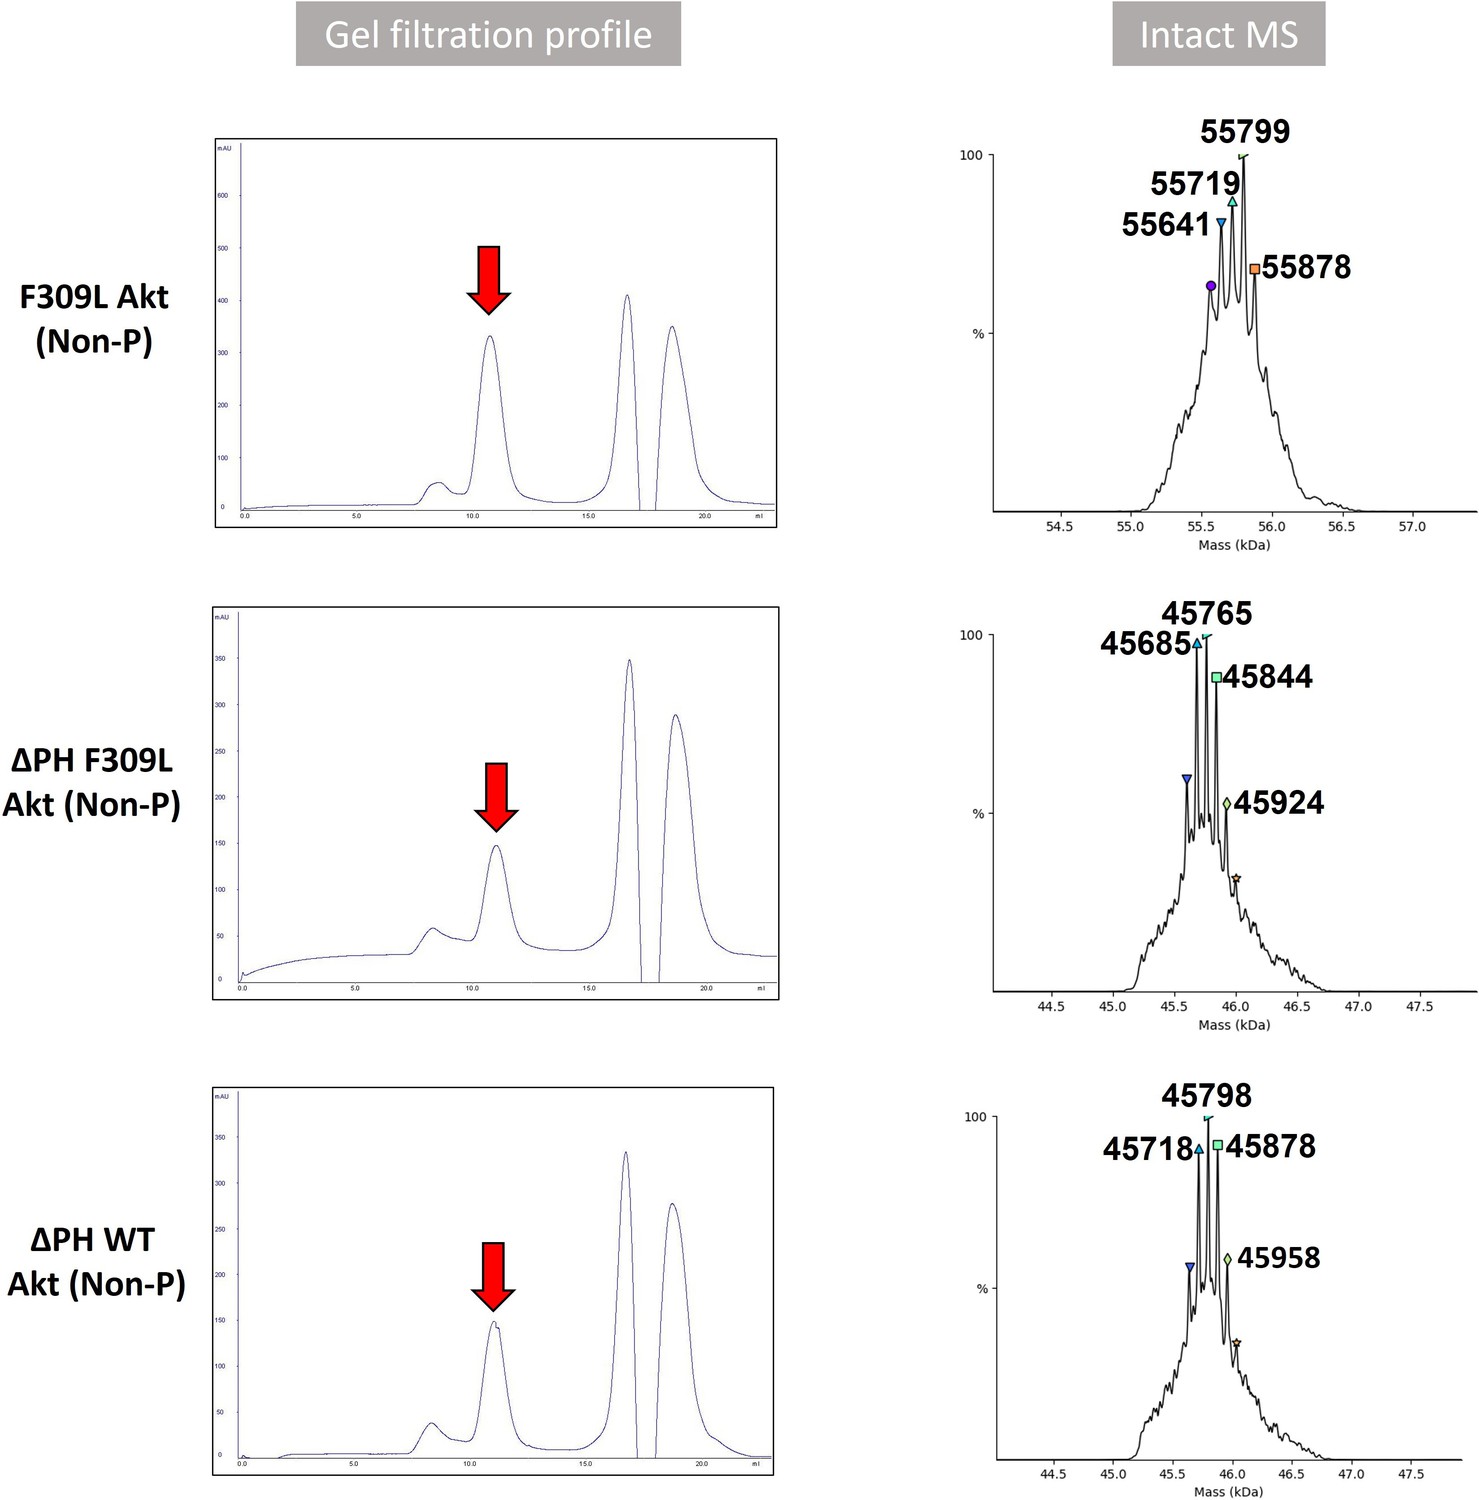
Validation of modified Akt proteins.
Gel filtration profile and intact MS analysis of full-length F309L Akt and PH domain-deleted Akt (ΔPH F309L Akt or ΔPH WT Akt) having activation loop phosphorylation at Thr308 without C-tail phosphorylation at Ser473 (Non-P). Calculated molecular weight of full-length F309L Akt (Non-P; A14) construct assuming Thr450 is phosphorylated and N-terminus is acetylated after the N-terminal methionine cleavage is 55724.5 Da. Expected molecular weight of ΔPH F309L Akt (A15; 45769.6 Da) or ΔPH WT Akt (A16; 45803.6 Da) is calculated based on the assumption that Thr450 is phosphorylated and N-terminus is acetylated.
Figure 7 with 1 supplement
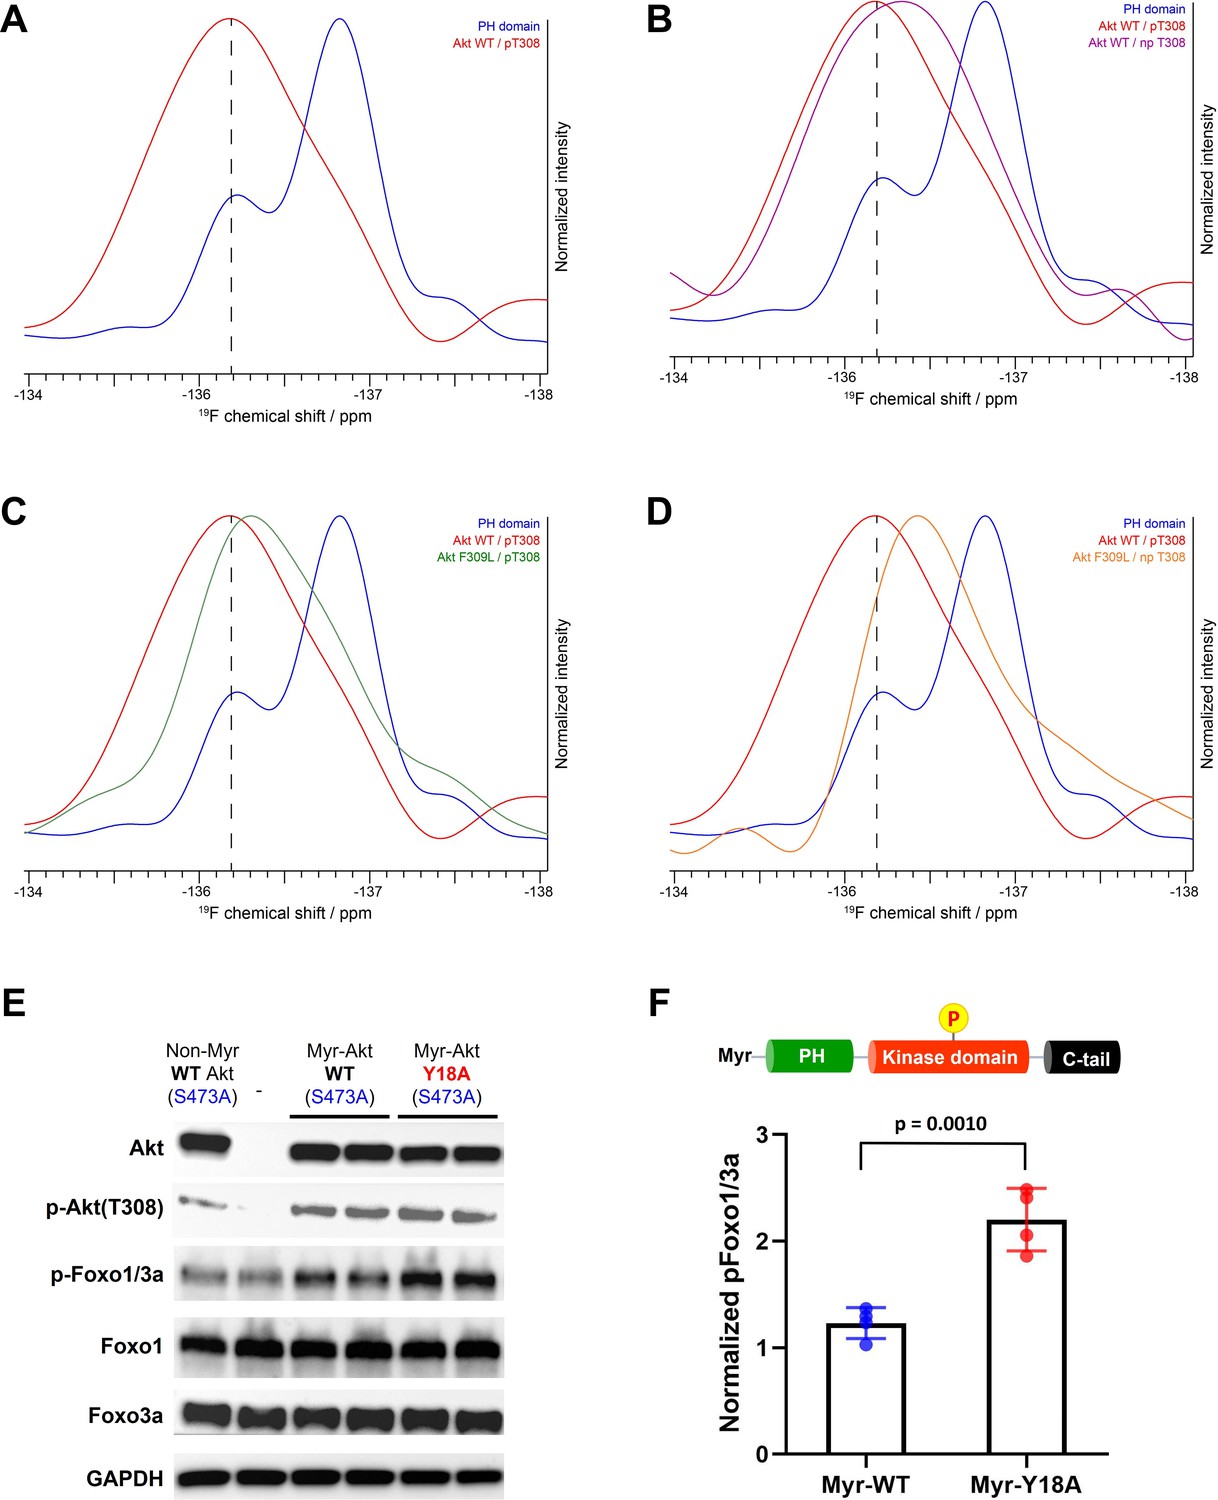
NMR analysis of fluoro-Tyr18-containing Akt forms and cellular assays on myristoylated Y18A Akt.
(A–D) 19F NMR spectra acquired on the isolated PH domain (blue), and full-length Akt WT (red) and F309L with pT308 (green), as well as full-length Akt WT (purple) and F309L with no pT308 (orange). The PH domain is specifically labeled with 19F at position 3 of Tyr18 aromatic ring and includes the R86A mutation. All spectra are normalized in intensity to the highest signal (major conformation in isolated PH domain). (E) Cellular analysis of the effects of Y18A mutation on Akt activity. Akt1/2 knockout HCT116 cells were transfected to express non-Myr WT Akt, myristoylated Akt (Myr-Akt) WT, or Myr-Akt Y18A mutant carrying an S473A mutation and then western blot analysis was done with Akt, Foxo1, and Foxo3a primary antibodies. (F) Quantified p-Foxo1/3a levels from cells expressing Myr-WT or Y18A Akt. The p-Foxo1/3a levels are normalized based on that of non-Myr WT Akt (n=4, SD shown).
-
Figure 7—source data 1
Quantification of cell-based assays with raw western blot images.
- https://cdn.elifesciences.org/articles/80148/elife-80148-fig7-data1-v2.zip
Figure 7—figure supplement 1
19 F NMR spectra acquired on the isolated PH domain incorporating fluoro-Tyr at Y18 position at different temperatures.
The spectra show multiple peaks (marked with arrows) from the single fluoro-Tyr and their relative sizes were changed at different temperatures. 15°C: blue, 25°C: red, 35°C: green.
Author response image 1
Assigned 1H-15N HSQC spectrum of WT PH domain at 20 °C.
Red asterisks mark unassigned peaks. Top: primary sequence with assigned residues in blue and residues likely corresponding to unassigned peaks (red asterisks) in red.
Tables
Table 1
Data collection and refinement statistics.
| Akt R86A PH domain, PDB ID: 7MYX | |
|---|---|
| Data collection* | |
| Space group | C 1 2 1 |
| Cell dimensions | |
| a, b, c (Å) | 84.8, 33.6, 42.4 |
| α, β, γ (°) | 90.0, 119.3, 90.0 |
| Resolution (Å) | 36.96–1.39 (1.44–1.39) |
| No. reflections | 68960 (6254) |
| No. unique reflections | 20816 (1987) |
| Rmeas | 0.0487 (0.134) |
| Rmerge | 0.0409 (0.111) |
| Rpim | 0.0261 (0.074) |
| I/σ (I) | 32.0 (9.60) |
| CC1/2 (%) | 99.6 (98.2) |
| Completeness (%) | 97.2 (95.1) |
| Redundancy | 3.3 (3.1) |
| Refinement | |
| Resolution (Å) | 36.96–1.39 |
| No. reflections | 20,568 |
| Rwork/Rfree | 0.18/0.20 (0.20/0.23) |
| No. atoms | |
| Protein | 958 |
| Ligand | – |
| Water | 111 |
| B factors | |
| Protein | 16.7 |
| Ligand | – |
| Water | 27.2 |
| R.m.s. deviations | |
| Bond lengths (Å) | 0.006 |
| Bond angles (°) | 0.80 |
| Ramachandran | |
| Preferred (%) | 98.17 |
| Allowed (%) | 1.83 |
| Outliers (%) | 0 |
| A single crystal was used to collect data. *Values in parentheses are for the highest-resolution shell. | |
Key resources table
| Reagent type (species) or resource | Designation | Source or reference | Identifiers | Additional information |
|---|---|---|---|---|
| Gene (human) | Akt1 | Addgene https://doi.org/10.1093/nar/gkh238 | https://identifiers.org/RRID/RRID:addgene_9021 | |
| Strain, strain background (Escherichia coli) | Rosetta 2 (DE3) pLysS | Novagen | Cat. No.: 71400 | Competent cells |
| Strain, strain background (Escherichia coli) | DH10Bac | Invitrogen | Cat. No.: 18297010 | Competent cells |
| Cell line (insect cell) | Sf21 | Invitrogen | 11497-013 | |
| Cell line (insect cell) | Sf9 | Invitrogen | 11496-015 | |
| Cell line (human) | Akt1/2 KO HCT116 | https://doi.org/10.1073/pnas.0914018107 | The Akt1-/-and Akt2-/- HCT116 colon cancer cell line was given as a gift from Dr Bert Vogelstein (Johns Hopkins University) (Ericson et al., 2010). These cells were validated by western blot showing the absence of Akt and by the lack of signaling response to growth factors. They were also shown to be mycoplasma-free by PCR testing. | |
| Antibody | pan-Akt (11E7) (Rabbit monoclonal) | Cell Signaling Technology | Cat. No.: 4685S, RRID:AB_10698888 | WB (1:1000) |
| Antibody | Akt phospho-Thr308 (Rabbit monoclonal) | Cell Signaling Technology | Cat. No.: 9275S, RRID:AB_329828 | WB (1:1000) |
| Antibody | Akt phospho-Ser473 [EP2109Y] (Rabbit monoclonal) | Abcam | Cat. No.: ab81283, RRID:AB_2224551 | WB (1:1000) |
| Antibody | Foxo1 (C29H4) (Rabbit monoclonal) | Cell Signaling Technology | Cat. No.: 2880S, RRID:AB_2106495 | WB (1:1000) |
| Antibody | Foxo3a (75D8) (Rabbit monoclonal) | Cell Signaling Technology | Cat. No.: 2880S, RRID:AB_836876 | WB (1:1000) |
| Antibody | Phospho-Foxo1(Thr24)/ Foxo3a(Thr32) (Rabbit monoclonal) | Cell Signaling Technology | Cat. No.: 2880S, RRID:AB_329842 | WB (1:1000) |
| Antibody | GAPDH (14C10) (Rabbit monoclonal) | Cell Signaling Technology | Cat. No.: 2118S, RRID:AB_561053 | WB (1:5000) |
| Antibody | HRP conjugated, anti-Rabbit IgG (Goat monoclonal) | Cell Signaling Technology | Cat. No.: 7074S, RRID:AB_2099233 | WB (1:5000) |
| Chemical compound, drug | Ammonium chloride (15N, 99%) | Cambridge Isotope Laboratories | Cat. No.: NLM-467-1 | |
| Chemical compound, drug | Glyphosate | Sigma-Aldrich | Cat. No.: 337757 | |
| Chemical compound, drug | L-Phenylalanine | Sigma-Aldrich | Cat. No.: P5482 | |
| Chemical compound, drug | L-Tryptophan | Sigma-Aldrich | Cat. No.: T0254 | |
| Chemical compound, drug | 3-Fluoro-L-Tyrosine | AmBeed | Cat. No.: A374537 | |
| Chemical compound, drug | Sulfo-Cy5-NHS ester | Lumiprobe | Cat. No.: 43320 | |
| Chemical compound, drug | 32P-ATP | Perkin Elmer | Cat. No.: NEG002Z2-50UC | |
| Chemical compound, drug | PIP3-Fluorescein (ammonium salt) | Cayman Chemical | Cat. No.: 10010383 | |
| Chemical compound, drug | PIP2-Fluorescein (ammonium salt) | Cayman Chemical | Cat. No.: 10010388 | |
| Chemical compound, drug | Pierce Avidin | Thermo Fisher Scientific | Cat. No.: 21128 | |
| Chemical compound, drug | PreScission protease | Cytiva | Cat. No.: 27-0843-01 | |
| Chemical compound, drug | Alkaline phosphatase (Calf Intestinal) | NEB | Cat. No.: M0290S | |
| Chemical compound, drug | PP2A catalytic subunit (human recombinant, L309 deletion) | Cayman Chemical | Cat. No.: 10011237 | |
| Software, algorithm | Coot | https://doi.org/10.1107/s0907444910007493 | ||
| Software, algorithm | ImageQuant TL version 7.0 | GE Healthcare | ||
| Software, algorithm | GraphPad Prism version 9.1.2 | GraphPad | ||
| Software, algorithm | NmrPipe | https://doi.org/10.1007/BF00197809 | ||
| Software, algorithm | CCPNmr Analysis version 2.4 | https://doi.org/10.1002/prot.20449 | ||
| Software, algorithm | Topspin version 3.6 | Bruker |
Additional files
Download links
A two-part list of links to download the article, or parts of the article, in various formats.
Downloads (link to download the article as PDF)
Open citations (links to open the citations from this article in various online reference manager services)
Cite this article (links to download the citations from this article in formats compatible with various reference manager tools)
PH domain-mediated autoinhibition and oncogenic activation of Akt
eLife 11:e80148.
https://doi.org/10.7554/eLife.80148


