Multivalency, autoinhibition, and protein disorder in the regulation of interactions of dynein intermediate chain with dynactin and the nuclear distribution protein
- Department of Biochemistry and Biophysics, Oregon State University, United States
- Department of Chemistry, Lewis & Clark College, United States
- Oregon State University NMR Facility, United States
Figures
Figure 1 with 1 supplement
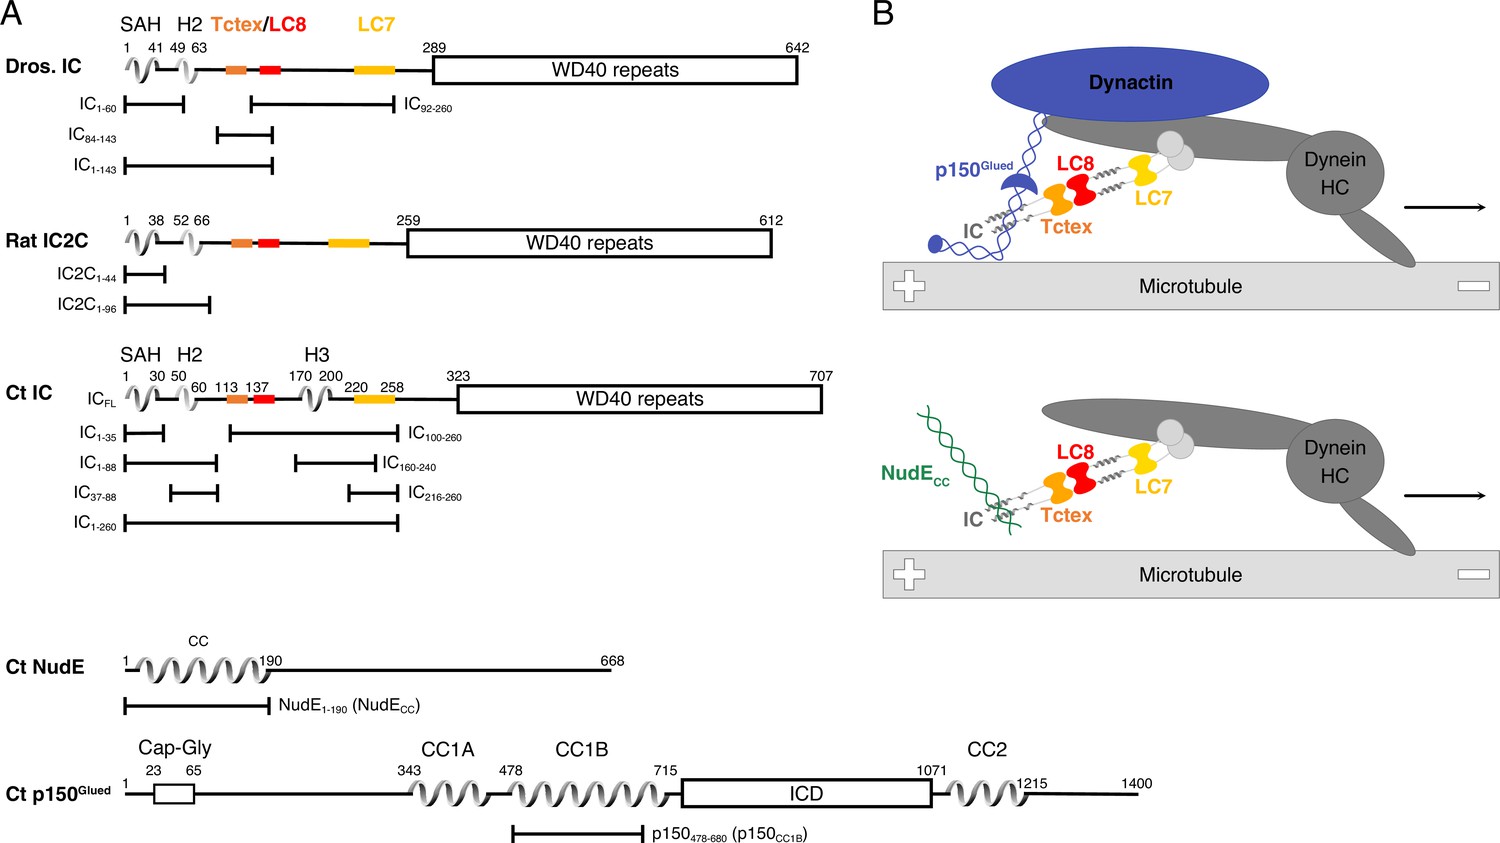
Domain architecture for dynein intermediate chain (IC), dynactin p150Glued, and nuclear distribution protein (NudE).
(A) Domain architecture diagrams for IC from Drosophila melanogaster (Dros. IC) and Rattus norvegicus (Rat IC2C) and constructs used in earlier work are provided for comparison. Proteins and constructs used in this work are from Chaetomium thermophilum (Ct). All ICs have an N-terminal single α-helix (SAH), followed by either a transient/nascent or folded second helix (H2). In Ct, there is an additional helix (H3). The Tctex (orange), LC8 (red), and LC7 (yellow) binding sites are well characterized in Dros. IC and Rat IC2C, and their position in Ct were predicted based on sequence and structure comparison. The C-terminal domain is predicted to contain seven WD40 repeats. The Ct constructs ICFL, IC1-88, IC37-88, IC1-260, IC100-260, IC140-260, IC216-260, and IC216-260 are used in this paper; the IC1-35 construct was used in prior work. Ct p150Glued is predicted to have a Cap-Gly domain near the N-terminus, and two coiled-coil (CC) domains, CC1 and CC2, that are separated by an intercoil domain. CC1 is further divided into two regions called CC1A and CC1B. p150478-680 (p150CC1B) is the construct used in this work. Ct NudE is predicted to have an N-terminal CC region followed by disorder. NudE1-190 (NudECC) is the construct used in this work. (B) Contextual models of dynein with the heavy chains (HC) crudely shown in dark gray. IC in the subcomplex (light gray) is shown in the same orientation as the domain architecture schematic in panel A. The top model depicts the interaction between the p150Glued subunit of dynactin (blue) and the SAH and H2 regions of IC while the bottom model depicts the interaction between NudECC (green) and the SAH region of IC. In both models, dynein is a processive motor traveling toward the minus end of a microtubule, and IC is shown with the homodimeric dynein light chains: Tctex (orange), LC8 (red), and LC7 (yellow).
Figure 1—figure supplement 1
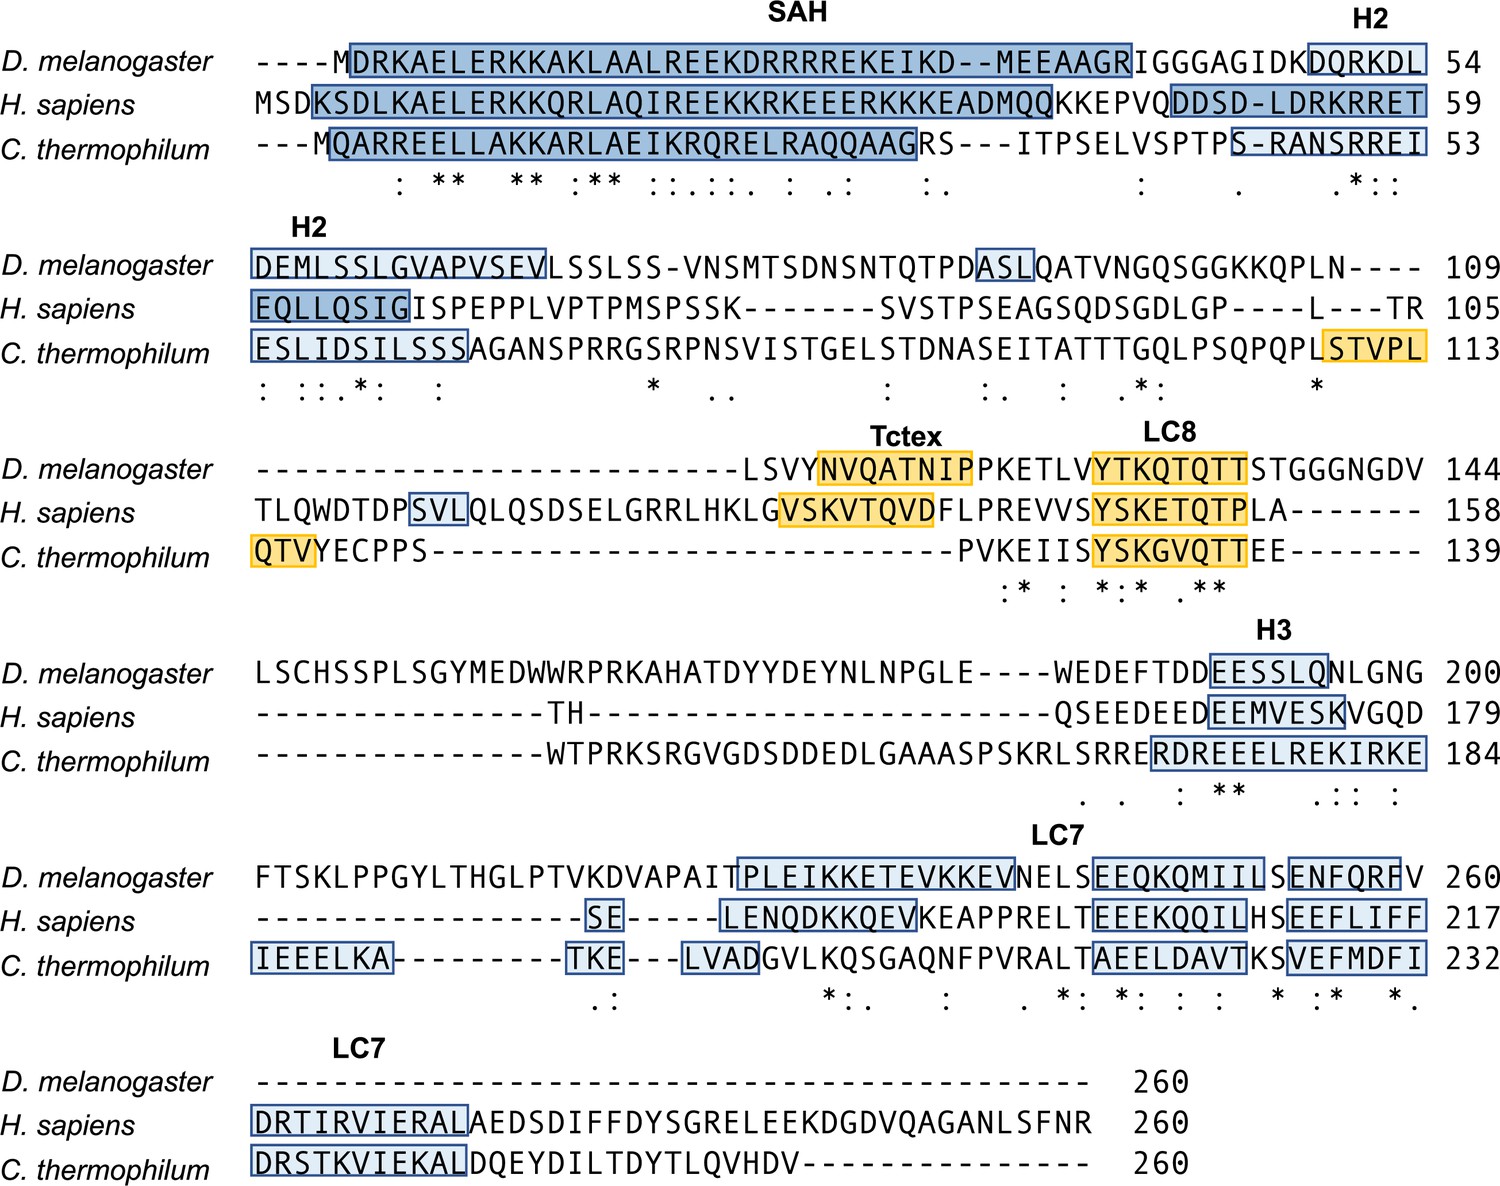
Intermediate chain (IC) sequence alignment.
Alignment of the first 260 residues of IC from Drosophila, human, and Chaetomium thermophilum using the Multiple Alignment using Fast Fourier Transform (MAFFT) alignment program (Katoh and Standley, 2013). Identical (asterisk), strongly similar (colon), and weakly similar (period) residues are shown at the bottom of each alignment. Known or predicted α-helical secondary structure (single α-helix [SAH], H2, H3, and the LC7 binding domain) is highlighted in blue, with the darker shade of blue indicating stronger prediction. Known or predicted binding sites for Tctex and LC8 are highlighted in yellow (Jespersen et al., 2019).
Figure 2
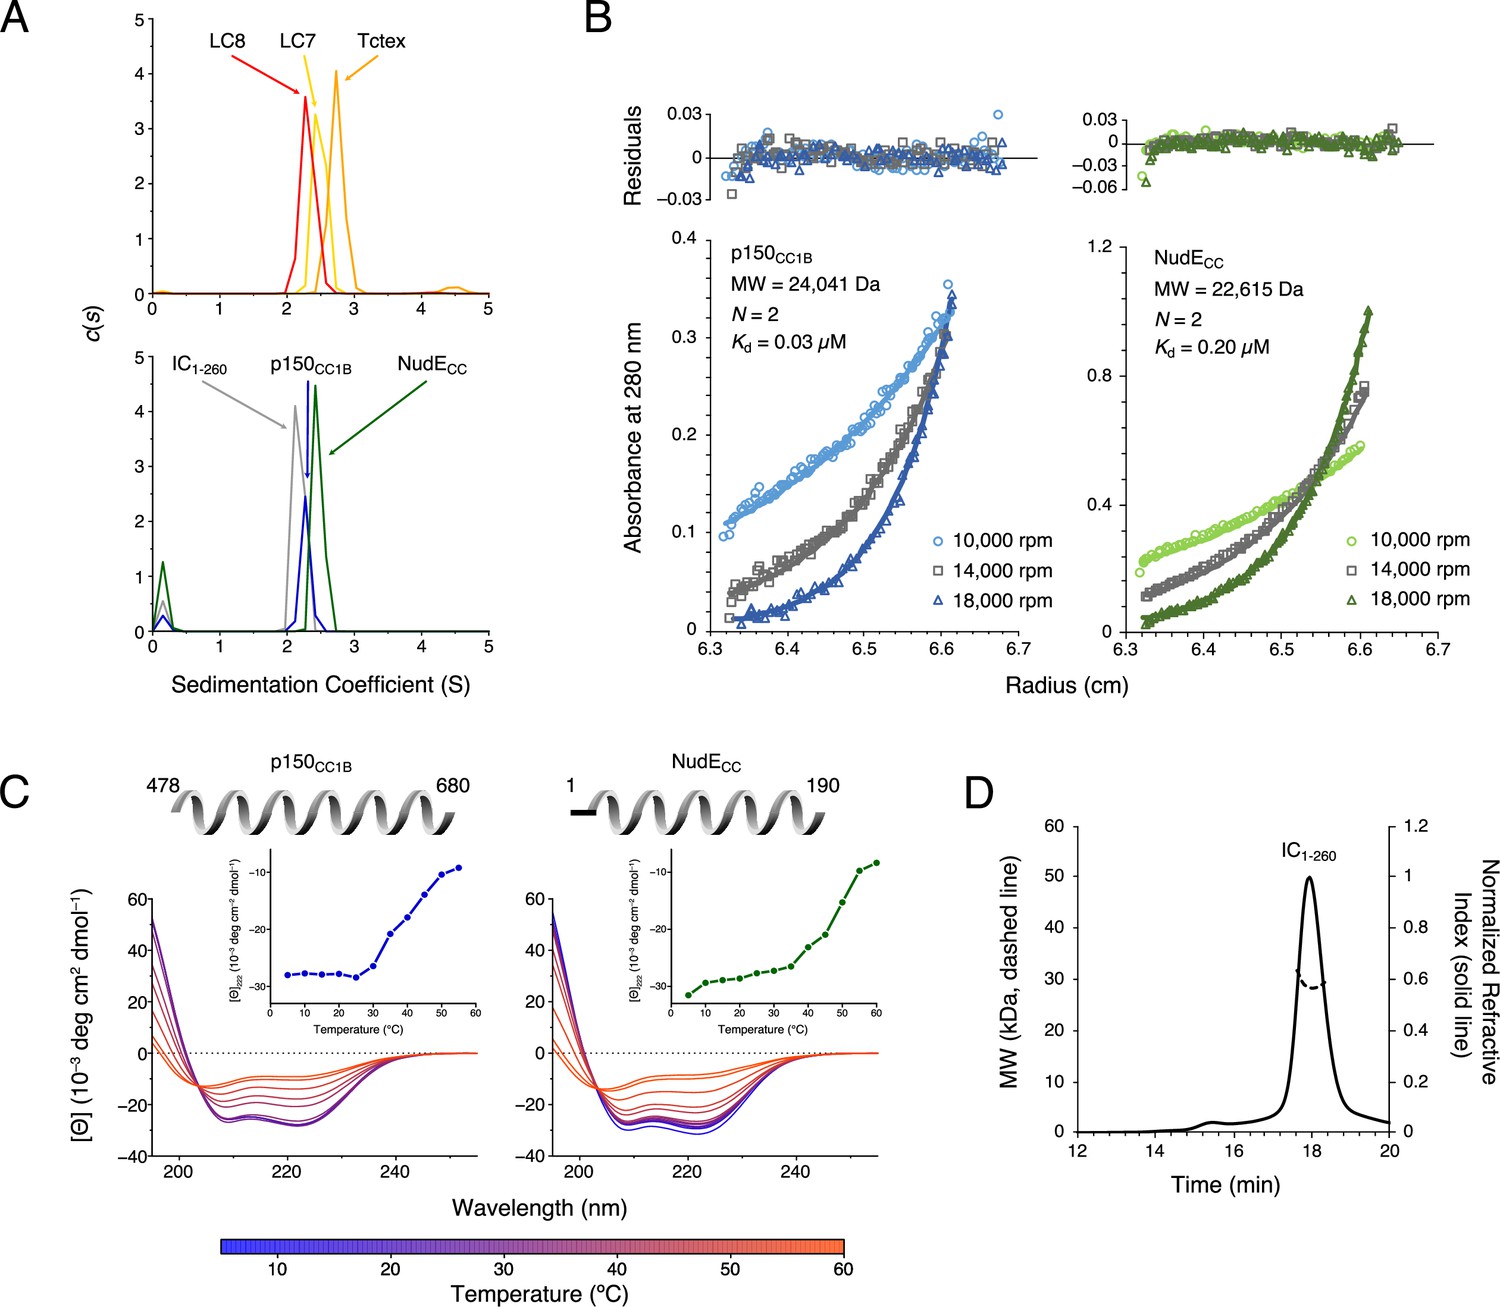
Chaetomium thermophilum (Ct) p150CC1B, NudECC, and dynein light chains are dimeric, whereas Ct IC1-260 is monomeric.
(A) Sedimentation velocity analytical ultracentrifugation profiles for LC8 (red), LC7 (yellow), and Tctex (orange) (top), and, IC1-260 (gray), p150CC1B (blue), and NudECC (green) (bottom). All samples were at protein concentration of 30 µM. (B) Sedimentation equilibrium analytical ultracentrifugation data for p150CC1B (blue) and NudECC (green) at three speeds (10,000, 14,000, and 18,000 rpm). Data were fit to a monomer-dimer binding model. The quality of the fits to this model is reflected by the plots of the residuals on top. The monomeric masses determined by fitting this data compare very well to the masses expected based on the sequences for the constructs. The stoichiometry (N) values of 2 indicate that both p150CC1B and NudECC are dimers in solution. (C) Circular dichroism spectra of p150CC1B and NudECC acquired at temperatures in the 5–60°C range. The shape of the spectra for both p150CC1B and NudECC indicates α-helical secondary structure, and the 222/208 ratios (1.04 and 1.00 for p150CC1B and NudECC, respectively) are consistent with coil-coiled structures. Inset graphs show the molar ellipticity at 222 nm as a function of temperature. (D) Multi-angle light scattering of IC1-260 gives an estimated mass of 29.5 kDa, which indicates that, on its own, IC1-260 exists as a monomer in solution (calculated mass of monomer is 29.2 kDa).
-
Figure 2—source data 1
Source files for sedimentation velocity analytical ultracentrifugation, sedimentation equilibrium analytical ultracentrifugation, circular dichroism, and size exclusion chromatography with multi-angle light scattering data.
This Excel workbook contains all the data plotted in Figure 2. The different sheets correspond to different panels within the figure. Additional information regarding data collection can be found in the corresponding Methods section. Data were plotted using gnuplot.
- https://cdn.elifesciences.org/articles/80217/elife-80217-fig2-data1-v2.zip
Figure 3 with 2 supplements

Secondary structure and thermal stability of Chaetomium thermophilum (Ct) intermediate chain (IC).
(A) Agadir prediction for IC1-260 showing the percent helicity by residue (purple). Shown above the plot is a schematic structure for IC1-260 with labels for single α-helix (SAH), H2, and H3 above the helical structure. The sites for lights chain binding are also indicated. The amino acid sequence under the schematic is colored by amino acid type: hydrophobic (gray), positive (red), negative (blue), and neutral (orange). Variable temperature CD spectra of (B) IC1-260, (C) IC1-88, (D) IC100-260, and (E) IC160-240. The shapes of the spectra for all constructs indicate a mixture of α-helical secondary structure and regions of intrinsic disorder. Loss in structure, or lack thereof, over a temperature range of 5–50°C (blue for lowest, red for highest) indicates how each construct varies in stability and indicates that IC1-260 is the most thermally stable. The fractional helicity (FH) of each construct at 5°C was calculated based on the experimentally observed mean residue ellipticity at 222 nm as explained in the Methods section.
-
Figure 3—source data 1
Source files for IC1-260 helicity prediction and CD data.
This Excel workbook contains all the data plotted in Figure 3. The different sheets correspond to different panels within the figure. Additional information regarding data collection can be found in the corresponding Methods section. Data were plotted using gnuplot.
- https://cdn.elifesciences.org/articles/80217/elife-80217-fig3-data1-v2.zip
Figure 3—figure supplement 1
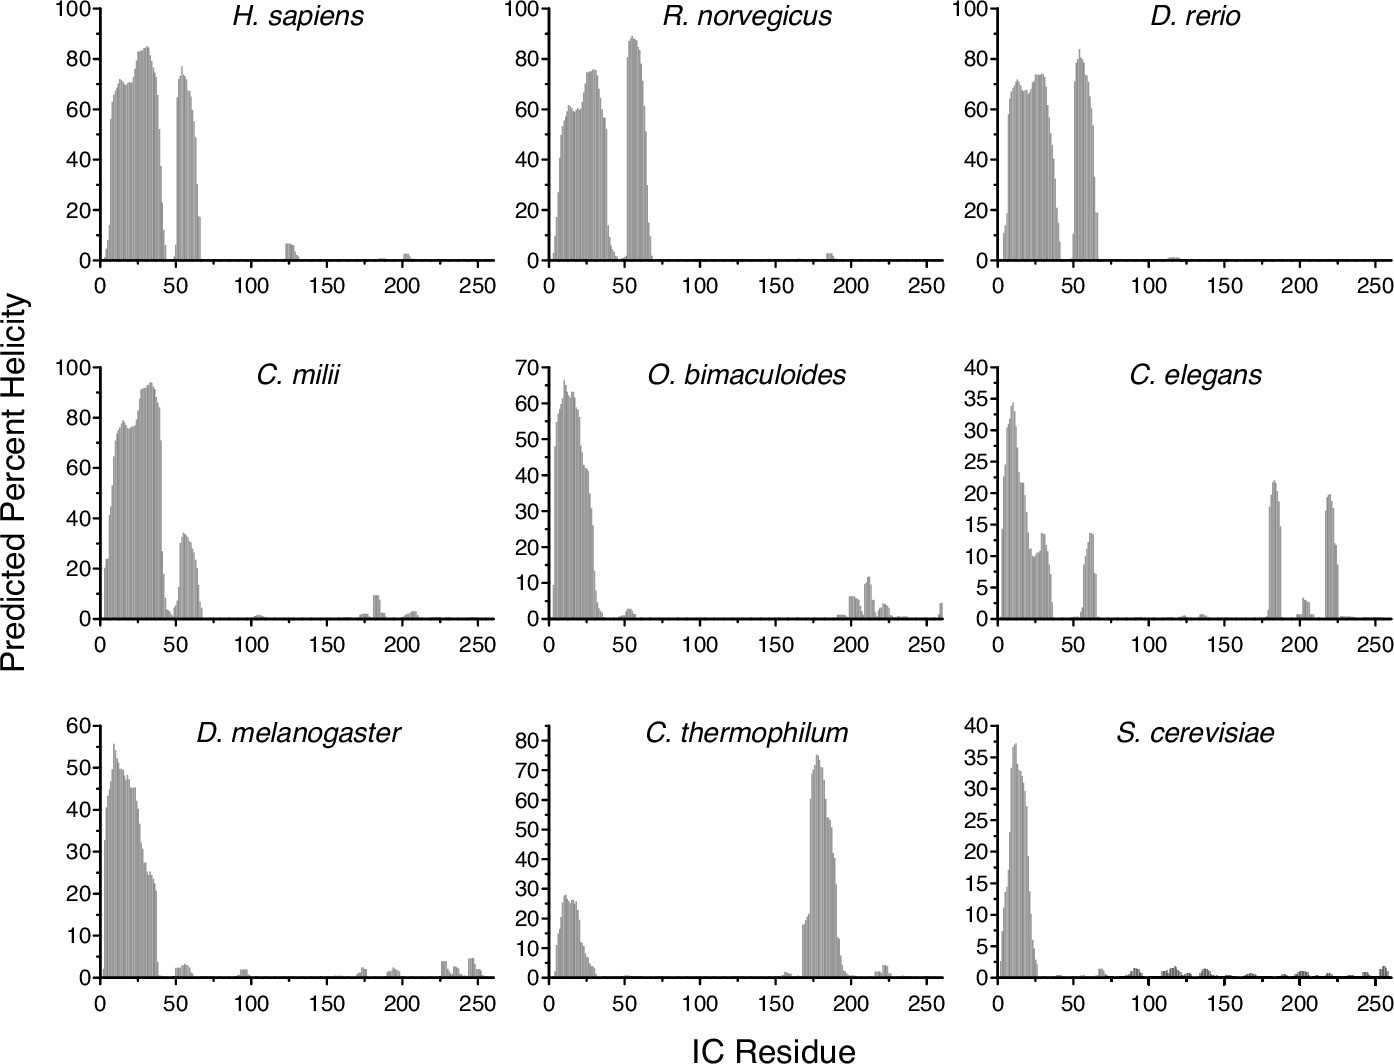
Predicted percent helicity in intermediate chain (IC) across species.
Residue-level percent helicity predictions generated using the Agadir algorithm for the first 260 amino acids of IC from Homo sapiens (human), Rattus norvegicus (rat), Danio rerio (zebrafish), Callorhinchus milii (Australian ghostshark), Octopus bimaculoides (Californian two-spot octopus), Caenorhabditis elegans (nematode), Drosophila melanogaster (fruit fly), Chaetomium thermophilum (thermophilic fungus), and Saccharomyces cerevisiae (yeast) (Muñoz and Serrano, 1997; Muñoz and Serrano, 1994; Muñoz and Serrano, 1995a; Muñoz and Serrano, 1995b).
-
Figure 3—figure supplement 1—source data 1
Source file for helix prediction of intermediate chain across species.
This Excel workbook contains the data plotted for the helix predictions shown in Figure 3—figure supplement 1. Additional information regarding data collection can be found in the corresponding Methods section. Data were plotted using gnuplot.
- https://cdn.elifesciences.org/articles/80217/elife-80217-fig3-figsupp1-data1-v2.zip
Figure 3—figure supplement 2
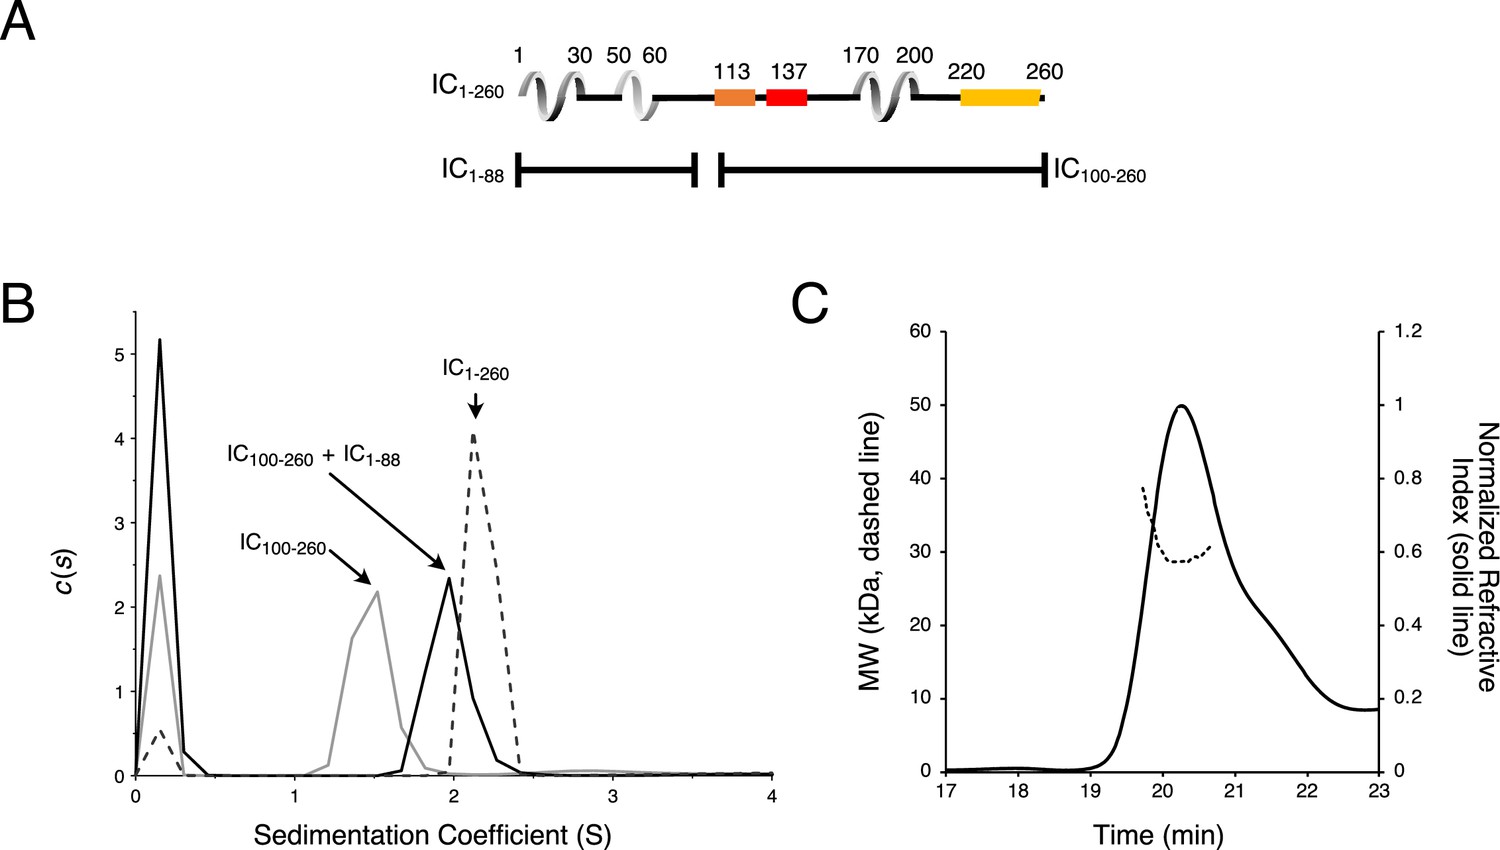
Chaetomium thermophilum (Ct) IC1-88 and Ct IC100-260 binding by sedimentation velocity analytical ultracentrifugation (SV-AUC).
(A) Domain architecture diagrams of IC1-260, IC1-88, and IC100-260. (B) SV-AUC experiments of IC100-260 (gray), IC100-260 mixed with IC1-88 at a 1:2 molar ratio (black), and IC1-260 (gray dashes). (C) The estimated mass of IC100-260/IC1-88 complex from MALS is 30.3 kDa, which indicates a 1:1 binding stoichiometry.
-
Figure 3—figure supplement 2—source data 1
Source file for sedimentation velocity analytical ultracentrifugation (SV-AUC) and size exclusion chromatography with multi-angle light scattering (SEC-MALS) of binding interactions between IC1-88 and IC100-260.
This Excel workbook contains the data plotted for the SV-AUC and SEC-MALS data shown in Figure 3—figure supplement 2 with different sheets corresponding to different panels within the figure. Additional information regarding data collection can be found in the corresponding Methods section. Data were plotted using gnuplot.
- https://cdn.elifesciences.org/articles/80217/elife-80217-fig3-figsupp2-data1-v2.zip
Figure 4 with 1 supplement
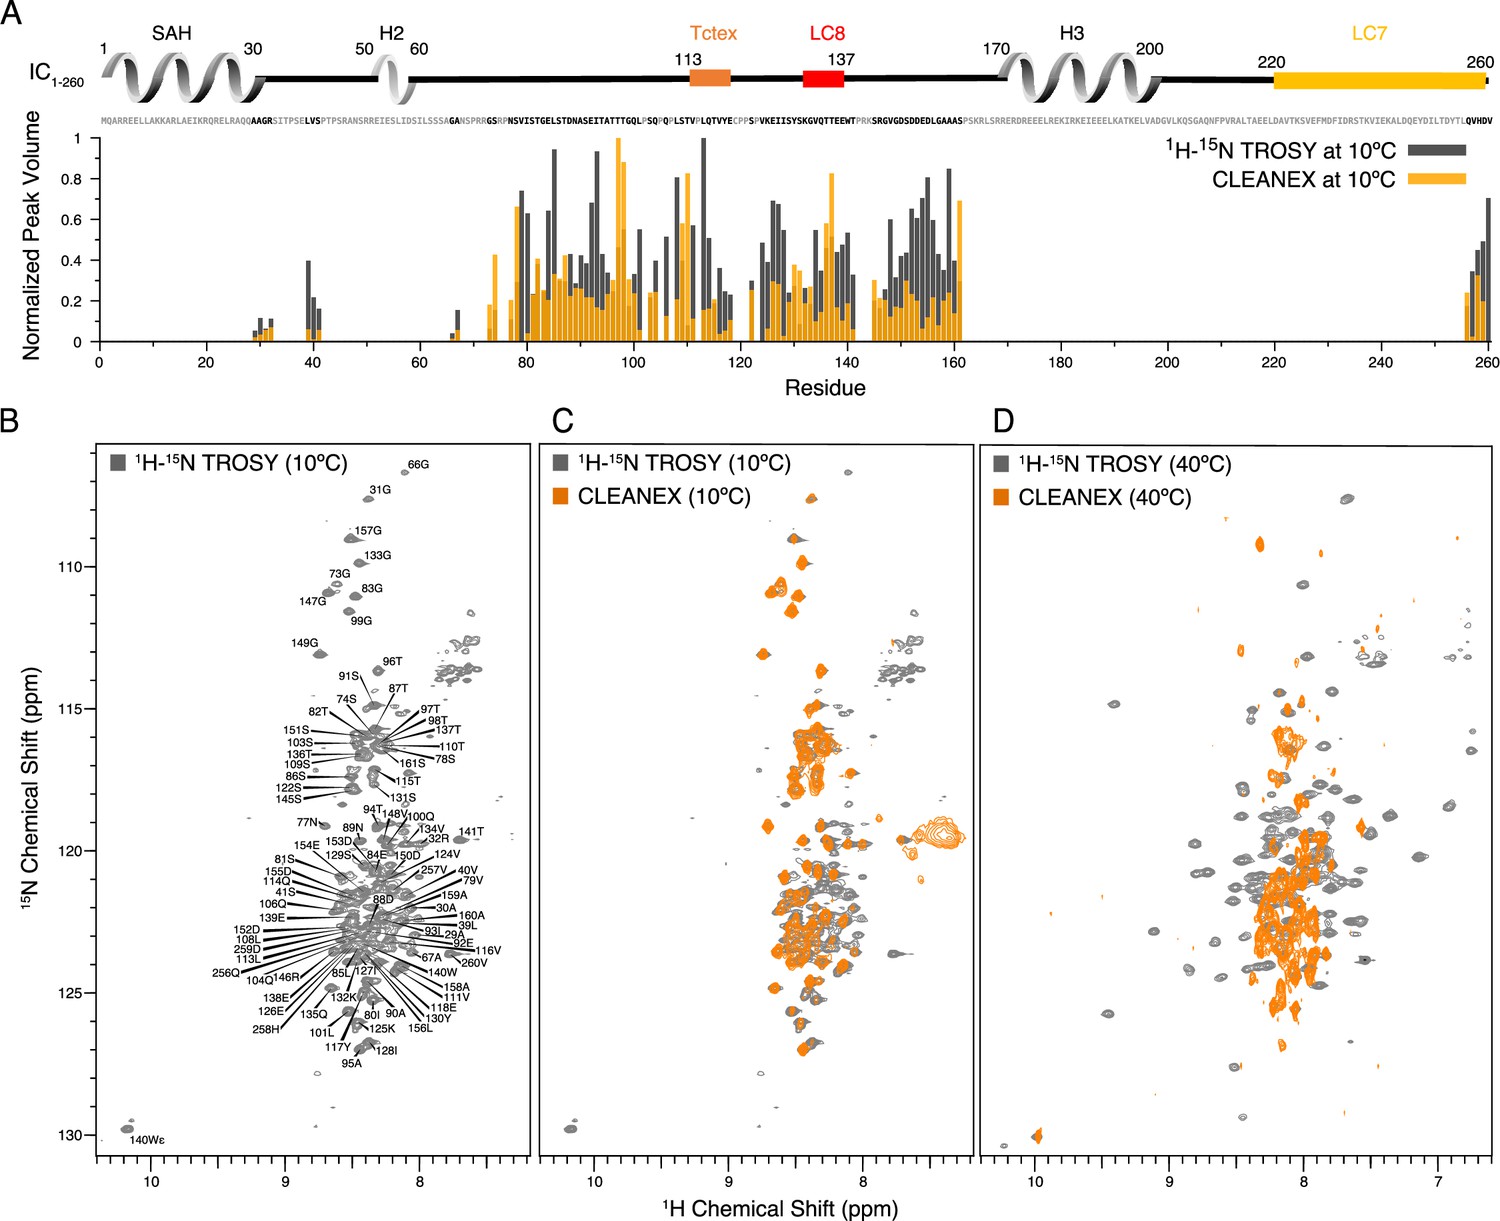
Identification of disordered linkers of Chaetomium thermophilum IC1-260 using nuclear magnetic resonance spectroscopy.
(A) Plot showing the normalized peak volumes at 10°C in the 1H-15N TROSY spectrum (gray) and in the CLEANEX spectrum (orange) of the amides that could be assigned. Assigned residues are in black in the sequence above the plot (and unassigned residues in gray); all assigned residues are from disordered regions of IC1-260. (B) 1H-15N TROSY spectrum of IC1-260 acquired at 800 MHz at 10°C showing amide assignments. (C) Overlay of a CLEANEX spectrum (orange) with the 1H-15N TROSY spectrum (gray) at 10°C, shows that most of the assignable residues are in exchange with the solvent on the timescale of the CLEANEX experiment. (D) At 40°C, 1H-15N TROSY spectrum (gray) shows new peaks appearing with greater chemical shift dispersion for IC1-260 in the 800 MHz. Overlaying a CLEANEX spectrum (orange) at this temperature reveals that most of the new peaks in the 1H-15N TROSY spectrum are from amides that are slow to exchange with the solvent and therefore are not observed in the CLEANEX spectrum.
-
Figure 4—source data 1
Source files for IC1-260 nuclear magnetic resonance (NMR) TROSY and CLEANEX data.
This Excel workbook contains the peak heights and volumes for residues within IC1-260 in the TROSY and CLEANEX NMR experiments collected at 10°C. Additional information regarding data collection can be found in the corresponding Methods section. Data were plotted using gnuplot.
- https://cdn.elifesciences.org/articles/80217/elife-80217-fig4-data1-v2.zip
Figure 4—figure supplement 1

Nuclear magnetic resonance spectra of intermediate chain (IC) are unaffected by salt concentration.
1H-15N TROSY spectra of IC1-260 in 20 mM NaCl (black) overlaid with IC1-260 in 250 mM NaCl (pink) at both 10°C (left) and at 40°C (right).
Figure 5
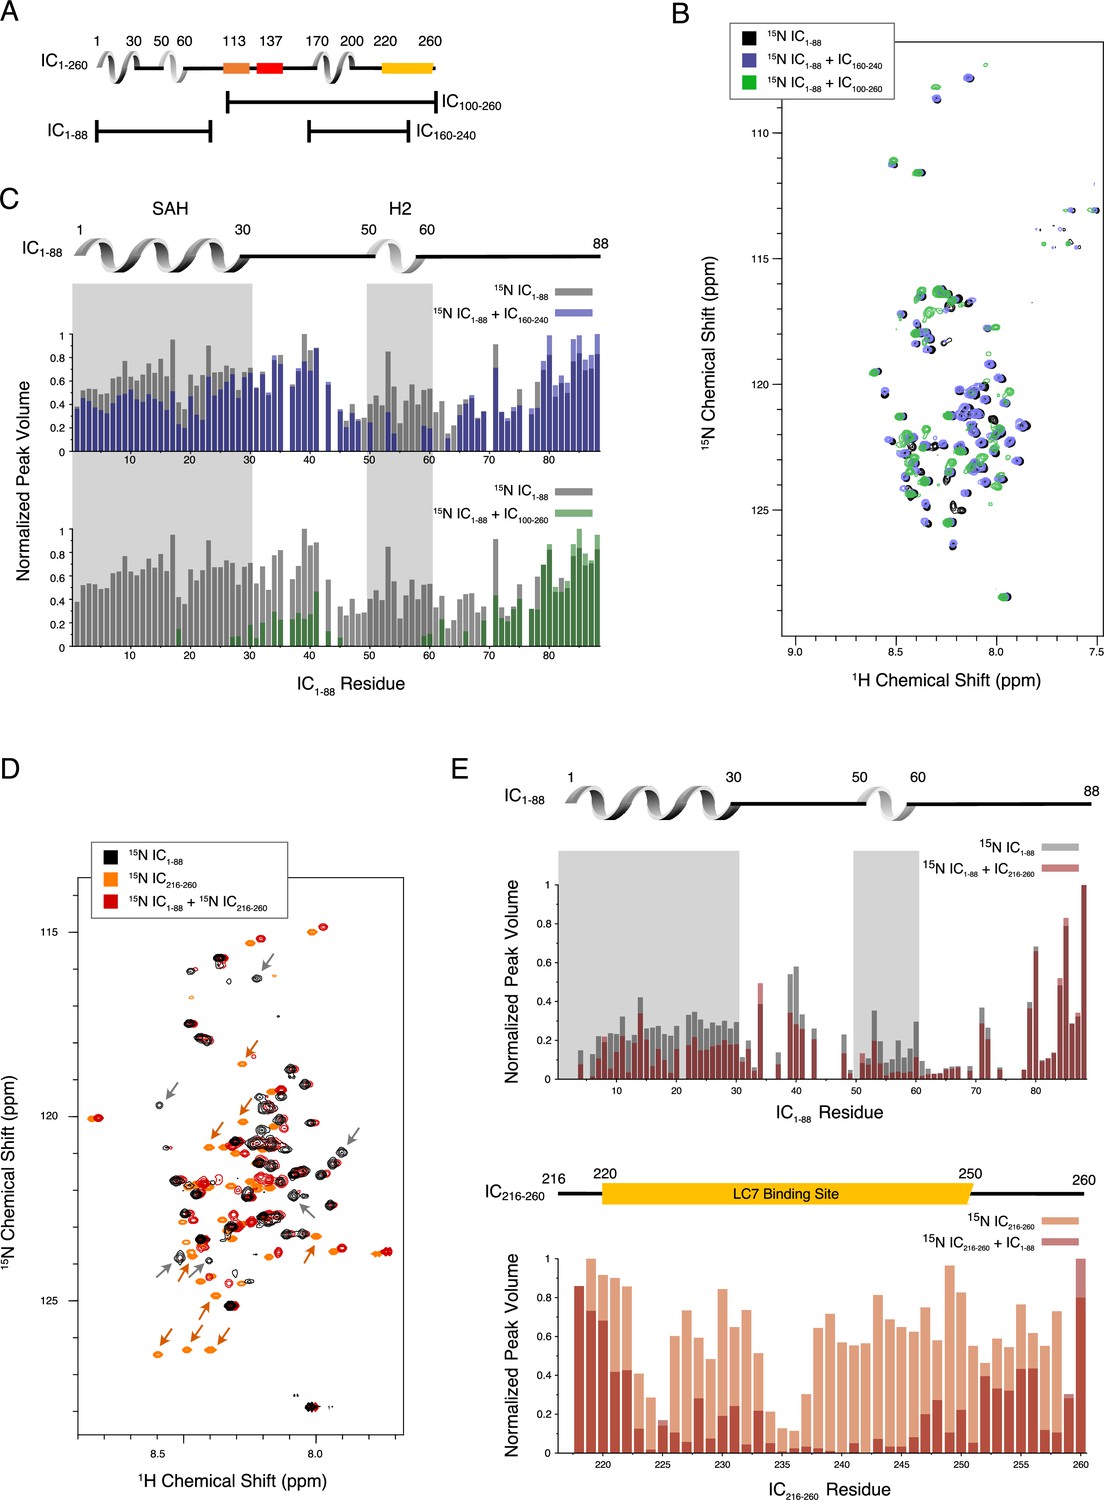
Evidence of tertiary contacts between the N and C-termini within Chaetomium thermophilum IC1-260.
(A) Domain architecture diagram for IC1-260 with bars shown below corresponding to the IC100-260, IC1-88, and IC160-240 constructs. (B) 1H-15N TROSY overlays of free 15N-labeled IC1-88 (black) and 15N-labeled IC1-260 bound to unlabeled IC160-240 (purple) and IC100-260 (green). Note, spectra are deliberately offset in the 1H dimension to help visualize overlapping peaks. (C) Normalized peak volumes in the 1H-15N TROSY spectra for (top) 15N-labeled IC1–88 (gray) and 15N-labeled IC1–88 + IC160-240 (purple) and (bottom) 15N-labeled IC1–88 (gray) and 15N-labeled IC1–88 + IC100-260 (green). (D) 1H-15N HSQC overlay of 15N-labeled IC1-88 (black), 15N-labeled IC216-260 (orange), and 15N-labeled IC216-260 bound to 15N-labeled IC1-88 (red). Arrows highlight some of the more significant peak disappearances for IC1-88 (gray arrows) and IC216-260 (orange arrows). Note, spectra are deliberately offset by 0.03 ppm in the 1H dimension to help visualize overlapping peaks. (E) Normalized peak volumes in the 1H-15N HSQC spectra for 15N-labeled IC216-260 (top, gray columns) and 15N-labeled IC216-260 (bottom, orange columns) when free and when in the presence of the other protein (red columns).
-
Figure 5—source data 1
Source files for nuclear magnetic resonance binding studies of intermediate chain (IC) fragments.
This Excel workbook contains the peak heights and volumes for residues within the 15N-labeled IC1-88 and 15N-labeled IC216-260 constructs upon binding of IC100-260, IC160-240, and 15N-labeled IC216-260 or 15N-labeled IC1-88. Additional information regarding data collection can be found in the corresponding Methods section. Data were plotted using gnuplot.
- https://cdn.elifesciences.org/articles/80217/elife-80217-fig5-data1-v2.zip
Figure 6 with 2 supplements
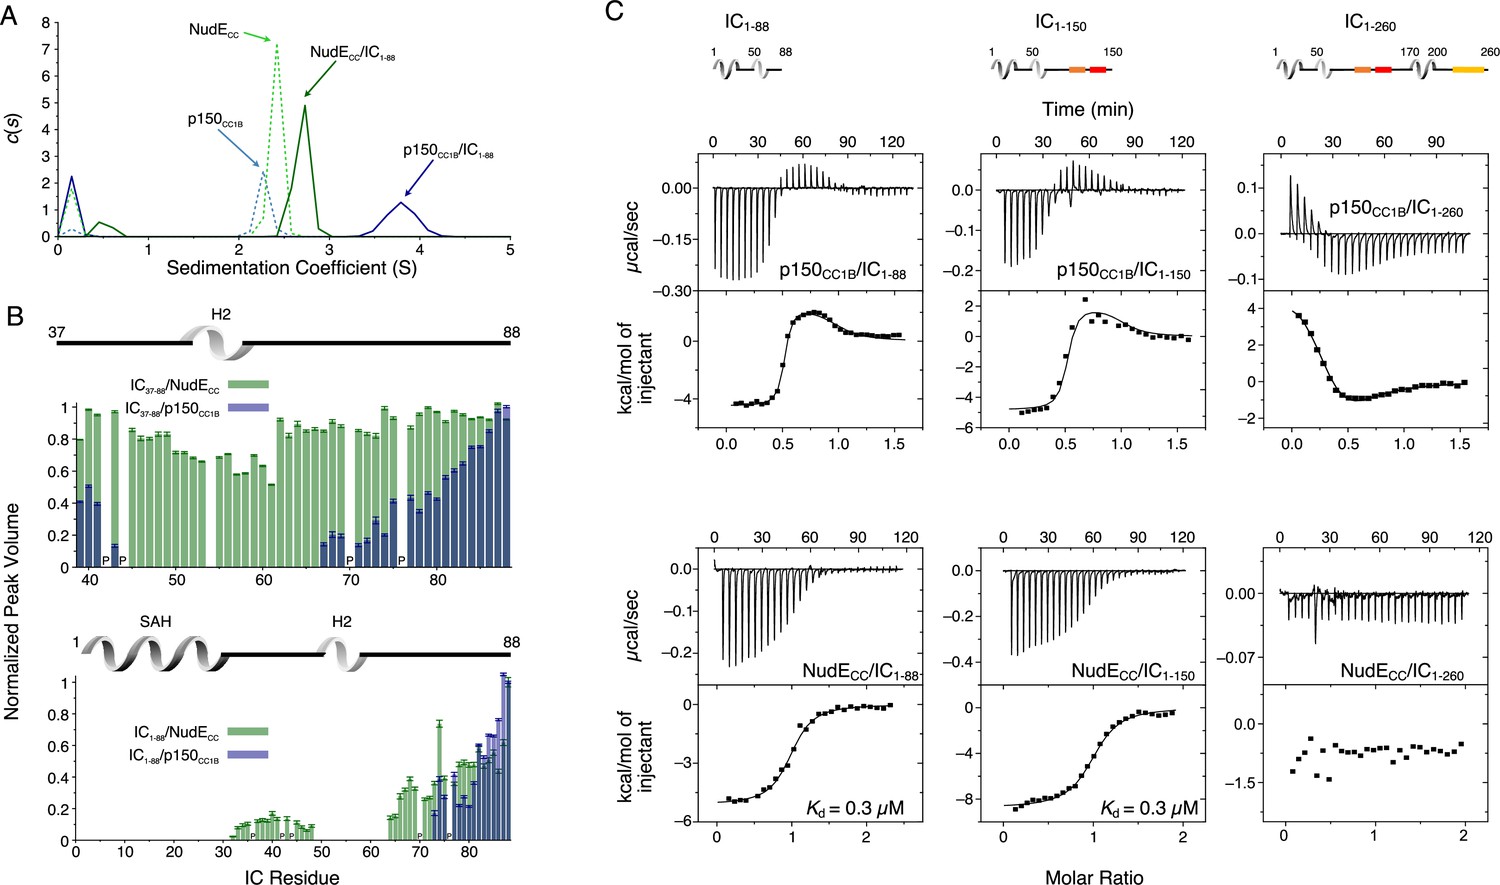
Binding interactions of Chaetomium thermophilum intermediate chain (IC) to p150CC1B and NudECC.
(A) Sedimentation velocity analytical ultracentrifugation profiles for samples containing p150CC1B (blue dashed line), NudECC (green dashed line), IC1-88/p150CC1B complex (blue solid line), and IC1-88/NudECC complex (green solid line) show that IC1-88 complexes have a larger sedimentation coefficient with p150CC1B than with NudECC. No data were collected for free IC1-88 because it has no absorbance at 280 nm. (B) Normalized peak volumes in the 1H-15N HSQC spectra for 15N-labeled IC37–88 (top) or 15N-labeled IC1–88 (bottom) when titrated with unlabeled p150CC1B (blue) and NudECC (green). ‘P’ indicates proline residues. No peak disappearance for IC37-88 was observed when NudECC was added. Error bars are based on propagating the root-mean-square noise of the individual spectra. (C) Isothermal titration calorimetry (ITC) thermograms for p150CC1B titrated with IC1-88 (top left), IC1-150 (top middle), and IC1-260 (top right), and for NudECC titrated with IC1-88 (bottom left), IC1-150 (bottom middle), and IC1-260 (bottom right), collected at 25°C (pH 7.5). Solid lines show fits to either a two-step binding model (p150CC1B) or a one-site binding model (NudECC). For IC1-260, reduced and endothermic binding is observed with p150CC1B whereas no binding is observed with NudECC.
-
Figure 6—source data 1
Source files for sedimentation velocity analytical ultracentrifugation (SV-AUC) and nuclear magnetic resonance (NMR) binding studies of intermediate chain (IC) fragments with p150CC1B and NudECC.
This Excel workbook contains the data plotted for the SV-AUC experiments as well as the NMR peak volume ratios for binding studies between 15N-labeled IC1-88 and 15N-labeled IC37-88 with p150CC1B and NudECC. Additional information regarding data collection can be found in the corresponding Methods section. Data were plotted using gnuplot.
- https://cdn.elifesciences.org/articles/80217/elife-80217-fig6-data1-v2.zip
Figure 6—figure supplement 1
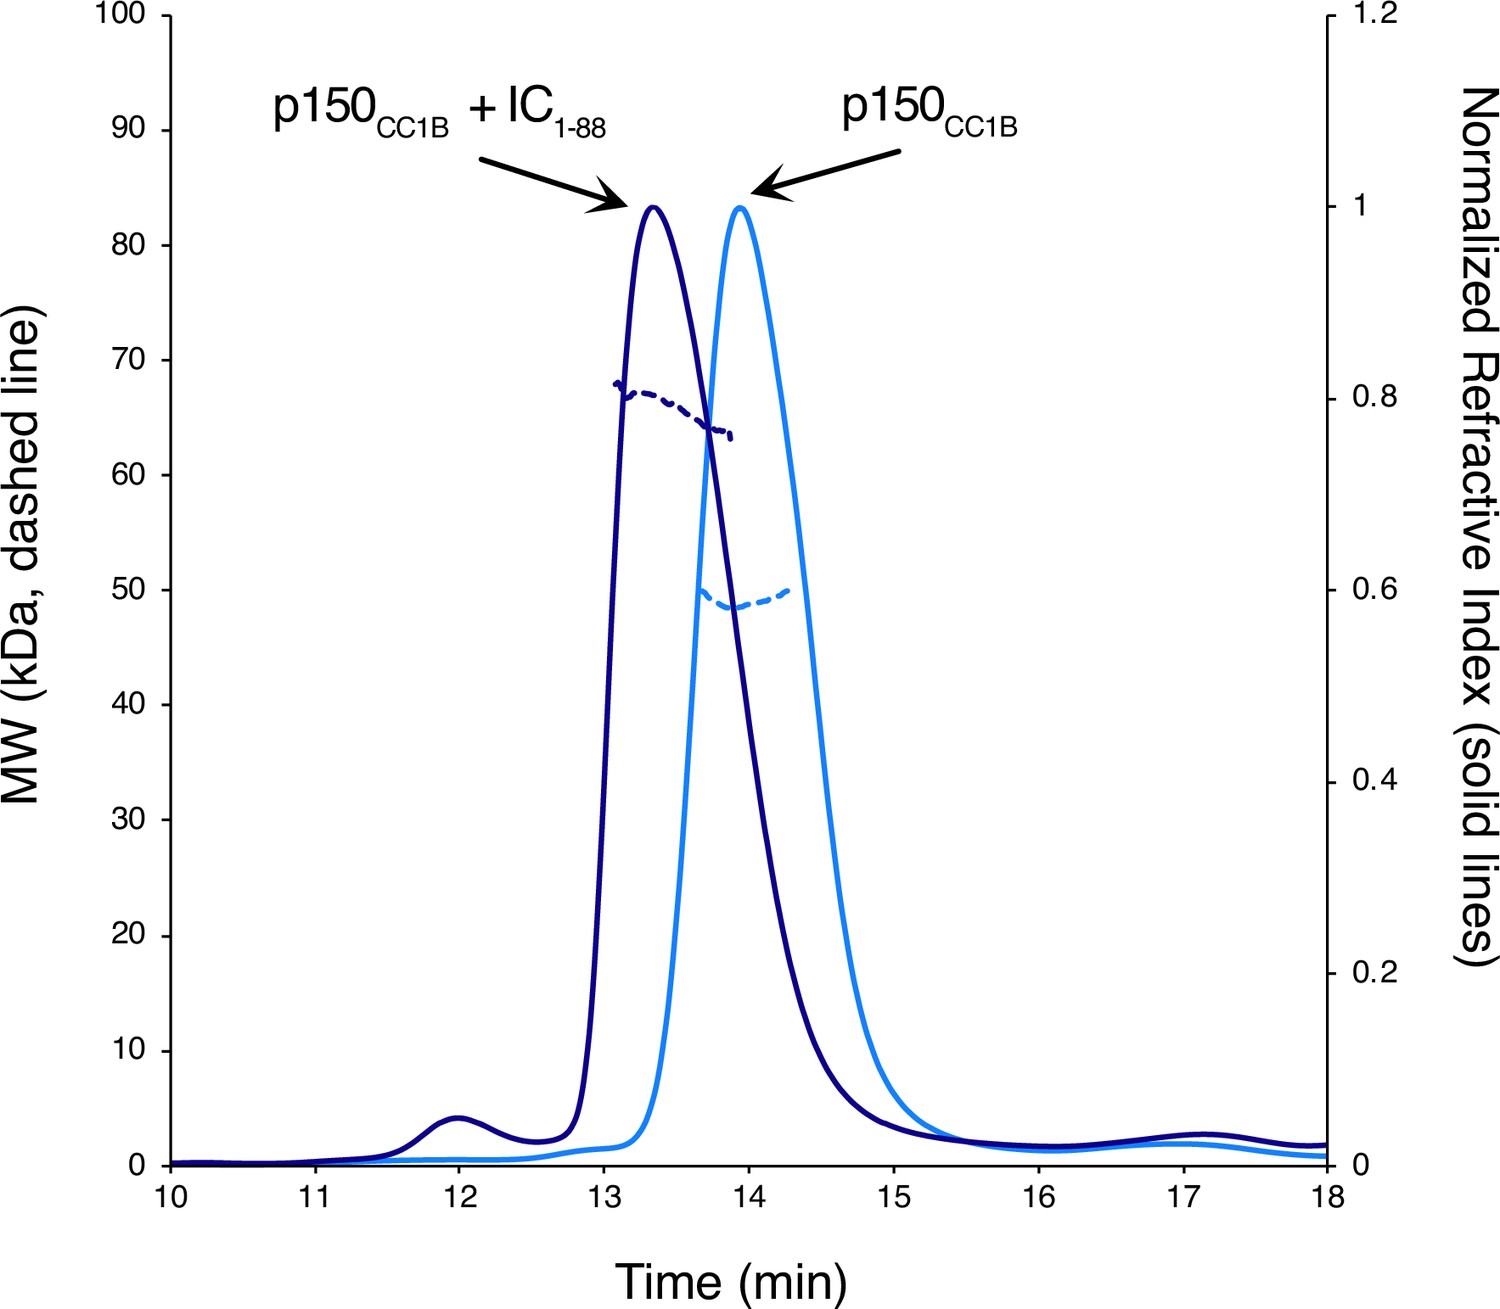
Size exclusion chromatography with multi-angle light scattering (SEC-MALS) of IC1-88 and p150CC1B.
The estimated mass of p150CC1B from MALS is 49 kDa (light blue) while the addition of IC1-88 increases the mass to 66 kDa (dark blue) indicating a complex containing a p150CC1B dimer and two IC1-88 chains.
-
Figure 6—figure supplement 1—source data 1
This Excel workbook contains the data plotted for the size exclusion chromatography with multi-angle light scattering data shown in Figure 6—figure supplement 1.
Data were plotted using gnuplot.
- https://cdn.elifesciences.org/articles/80217/elife-80217-fig6-figsupp1-data1-v2.zip
Figure 6—figure supplement 2
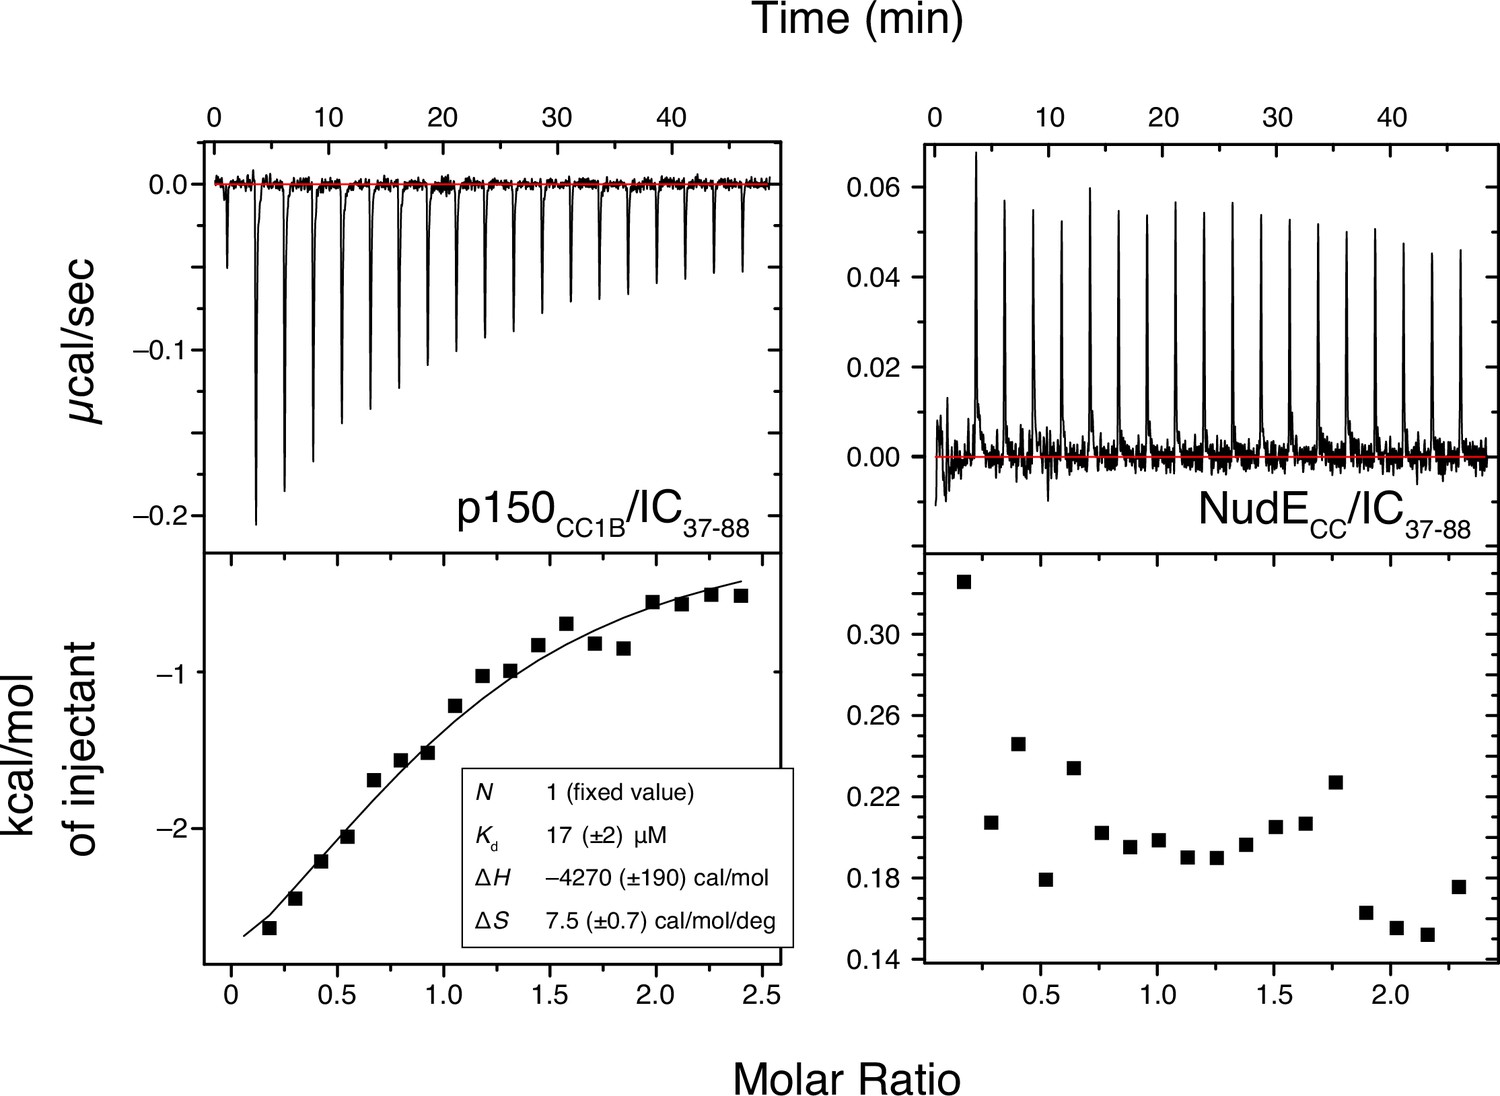
Binding interactions of Chaetomium thermophilum IC37-88 to p150CC1B and NudECC.
ITC thermograms for p150CC1B titrated with IC37-88 (left) and NudECC titrated with IC37-88 (right), collected at 25°C (pH 7.5). IC37-88 contains the H2 region of intermediate chain (IC) and binds weakly (Kd ~20 µM) to p150CC1B while no binding is detected for NudECC.
Figure 7
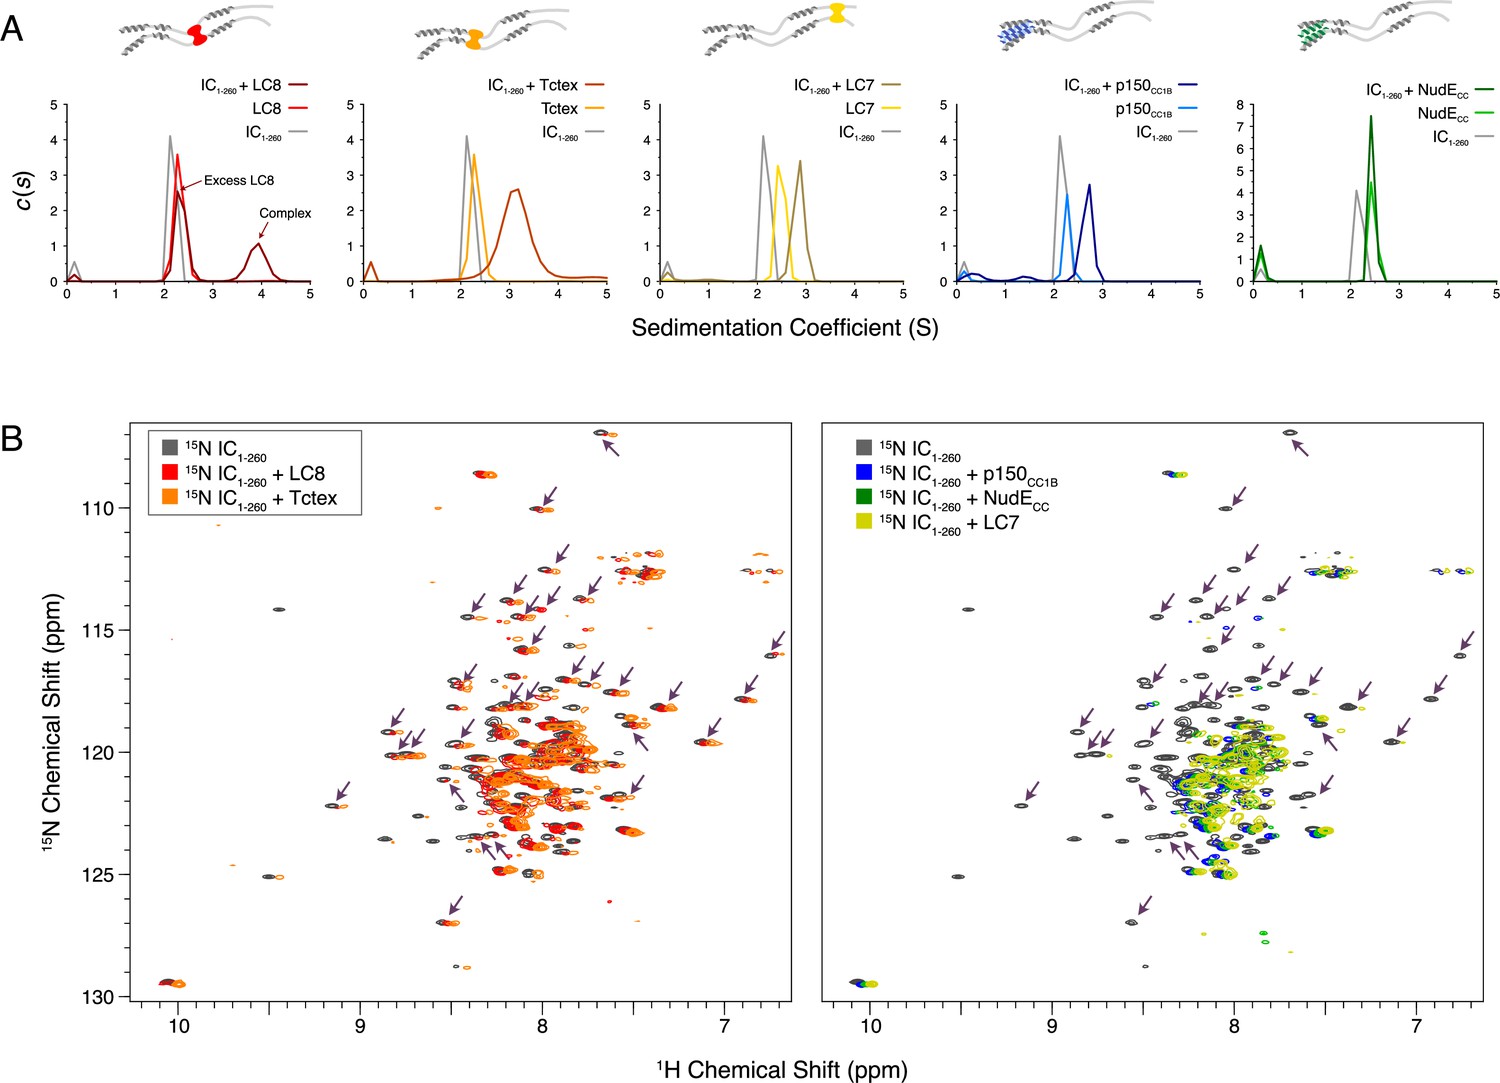
Binding characterization of binary complexes of IC1-260.
(A) Sedimentation velocity analytical ultracentrifugation of IC1-260/LC8, IC1-260/Tctex, IC1-260/LC7, IC1-260/p150CC1B, and IC1-260/NudECC. Data for the binary complexes is overlayed with data for each protein individually to better see shifts in the sedimentation coefficient of the binary complexes. (B) 1H-15N TROSY overlays of free 15N-labeled IC1-260 (black) and 15N-labeled IC1-260 bound to unlabeled binding partners in a 1:1.5 molar ratio. The spectra were offset by 0.03 ppm in the 1H dimension to help illustrate changes in peak intensities. Changes in peak appearances/shifts/disappearances seem to be similar for LC8 (red) and Tctex (orange) versus changes seen for p150CC1B (blue), NudECC (green), and LC7 (yellow). Arrows indicate peaks that remain when LC8 and Tctex are added to IC1-260, but disappear when p150CC1B, NudECC, and LC7 are added.
-
Figure 7—source data 1
Source files for sedimentation velocity analytical ultracentrifugation (SV-AUC) binding studies of IC1-260.
This Excel workbook contains the data plotted for the SV-AUC experiments shown in Figure 7. Additional information regarding data collection can be found in the corresponding Methods section. Data were plotted using gnuplot.
- https://cdn.elifesciences.org/articles/80217/elife-80217-fig7-data1-v2.zip
Figure 8
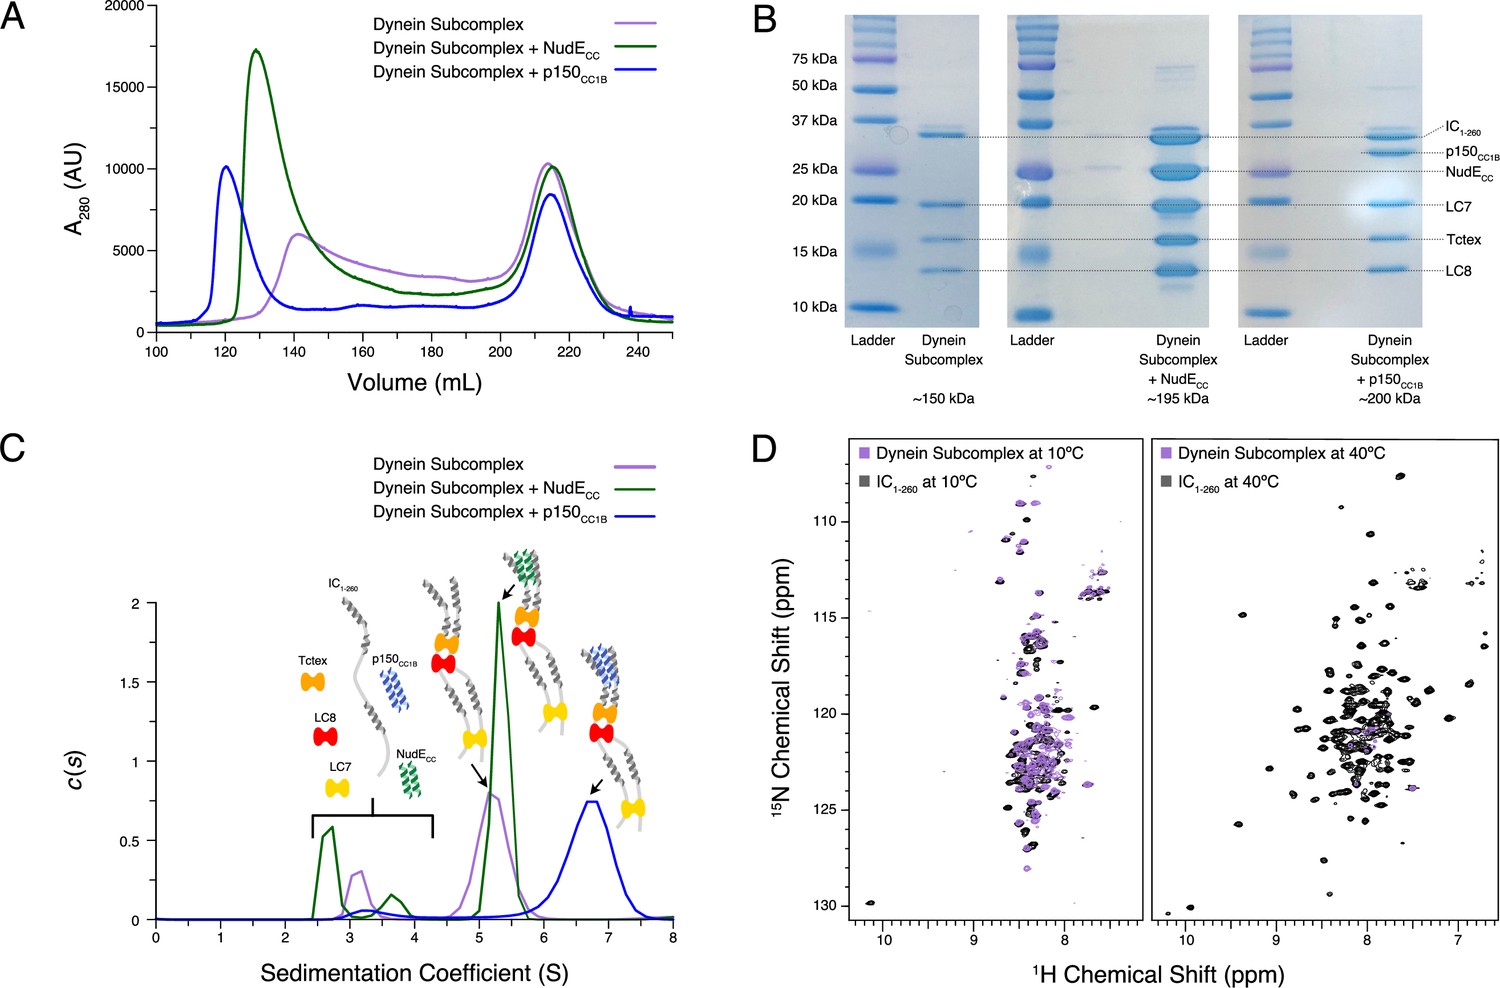
Reconstitution and characterization of dynein subcomplexes.
(A) Size exclusion chromatography (SEC) traces of the dynein subcomplex (IC/light chains) (purple) and the dynein subcomplex with the addition of either p150CC1B (blue) or NudECC (green). (B) Sodium dodecyl sulphate–polyacrylamide gel electrophoresis gels of fractions collected from SEC for all complexes showing all expected proteins. (C) SV-AUC profiles of the dynein subcomplex (purple) bound to p150CC1B (blue) or NudECC (green). (D) 1H-15N TROSY overlays of free IC1-260 (black) and the dynein subcomplex (purple). At 10°C, many peaks are still of high intensity in the 153 kDa complex, indicating that some regions remain disordered. The very few peaks at 40°C of the bound are most likely due to the size and tumbling of the subcomplex and consistent with the fact that the majority of the peaks at this temperature are from ordered regions.
-
Figure 8—source data 1
Source files for size exclusion chromatography (SEC) and sedimentation velocity analytical ultracentrifugation (SV-AUC) of reconstituted IC1-260 subcomplexes.
This Excel workbook contains the data plotted for the SEC and SV-AUC experiments shown in Figure 8 with individual sheets corresponding to panels within the figure. Additional information regarding data collection can be found in the corresponding Methods section. Data were plotted using gnuplot.
- https://cdn.elifesciences.org/articles/80217/elife-80217-fig8-data1-v2.zip
-
Figure 8—source data 2
Original sodium dodecyl sulphate–polyacrylamide gel electrophoresis gel images.
This zipped folder contains the original files of the full raw unedited gel images for the size exclusion chromatography purification of each IC1-260 subcomplex. There is also a combined image with the uncropped gels with the relevant bands clearly labeled.
- https://cdn.elifesciences.org/articles/80217/elife-80217-fig8-data2-v2.zip
Figure 9

Binding characterization of Chaetomium thermophilum ICFL subcomplexes.
(A) The estimated mass of ICFL from multi-angle light scattering is 75.4 kDa, which indicates that ICFL is a monomer in the absence of binding partners. (B) Sedimentation velocity analytical ultracentrifugation profiles of ICFL (black), ICFL mixed with p150CC1B (blue) or NudECC (green), and the subcomplexes: ICFL/Tctex/LC8/LC7 (gray), ICFL/Tctex/LC8/LC7/p150CC1B (blue), ICFL/Tctex/LC8/LC7/NudECC (green), ICFL/Tctex/LC8 (orange), ICFL/Tctex/LC8/p150CC1B (blue), ICFL/Tctex/LC8/NudECC (green), ICFL/LC7 (yellow), ICFL/LC7/p150CC1B (blue), and ICFL/LC7/NudECC (green). The black, dashed line is centered on unbound ICFL to help guide the eye. (C) Sodium dodecyl sulphate–polyacrylamide gel electrophoresis gel of immobilized metal affinity chromatography fractions (left to right: wash, elution, and final wash) with a band for ICFL migrating in accordance with the expected mass of ~79 kDa.
-
Figure 9—source data 1
Source files for size exclusion chromatography with multi-angle light scattering (SEC-MALS) and sedimentation velocity analytical ultracentrifugation (SV-AUC) of ICFL.
This Excel workbook contains the data plotted for the SEC-MALS experiment of ICFL and the SV-AUC binding experiments shown in Figure 9 with individual sheets corresponding to panels within the figure. Additional information regarding data collection can be found in the corresponding Methods section. Data were plotted using gnuplot.
- https://cdn.elifesciences.org/articles/80217/elife-80217-fig9-data1-v2.zip
-
Figure 9—source data 2
Original sodium dodecyl sulphate–polyacrylamide gel electrophoresis gel image.
This zipped folder contains the original file of the full raw unedited gel image for the IMAC fractions of ICFL. There is also an image with the uncropped gel with the relevant bands clearly labeled. Notice, two batches of ICFL were purified in tandem.
- https://cdn.elifesciences.org/articles/80217/elife-80217-fig9-data2-v2.zip
Figure 10
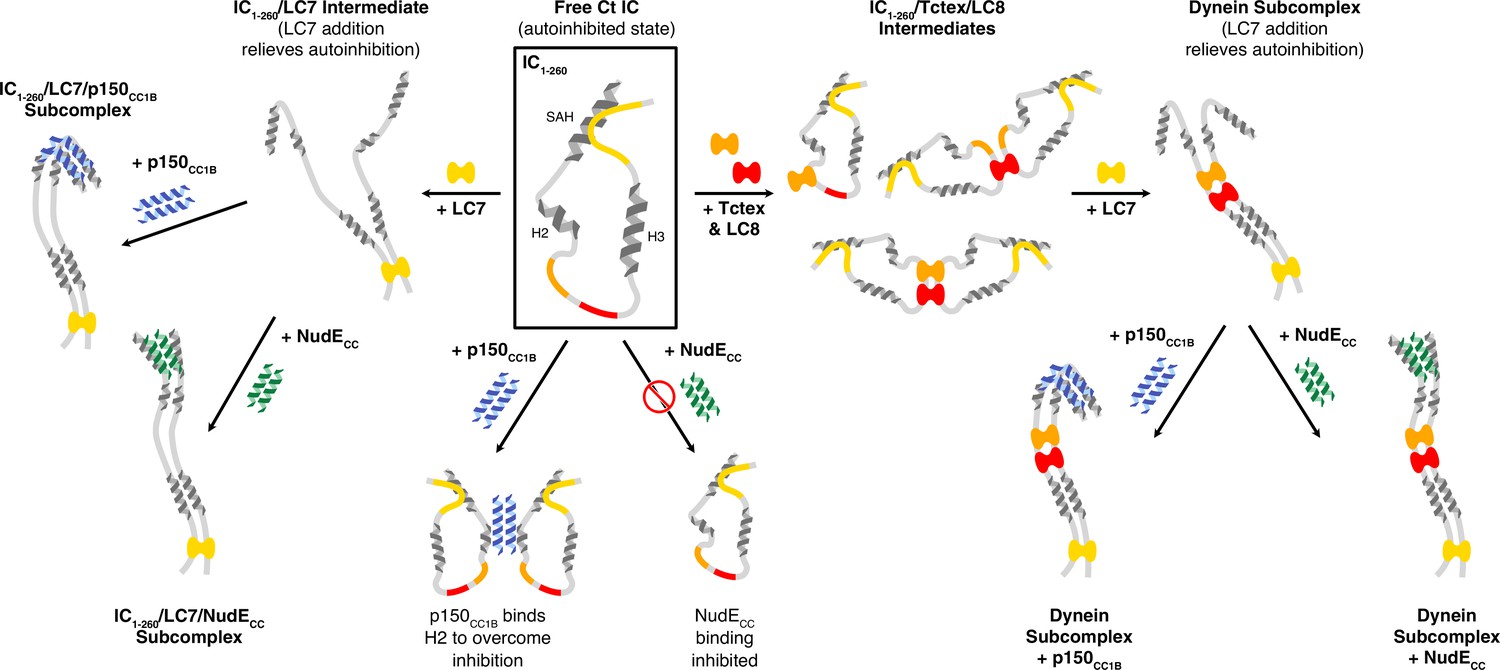
A model of Chaetomium thermophilum IC1-260 binding interactions and subcomplex assemblies.
Free IC1-260 is compact and in autoinhibited state (Boxed in black), with the single α-helix (SAH), H2, and H3 regions depicted as helices and with colors indicating the LC8 (red), Tctex (orange), and LC7 (yellow) binding sites. When LC7 is added (left arrow) LC7 outcompetes autoinhibition to bind IC1-260, exposing the SAH domain for p150CC1B and NudE binding. When p150CC1B or NudECC is added (down arrows) to free IC1-260, autoinhibition prevents NudECC from binding and reduces the binding affinity of p150CC1B. However, as p150CC1B is able to bind to the H2 region of IC1-260, binding is not completely prevented. Addition of Tctex and/or LC8 (right arrow) leads to a number of possible binary and ternary intermediates. LC8’s role of driving IC dimerization is depicted and, in all intermediates, we predict that IC autoinhibition remains based on very limited changes in nuclear magnetic resonance spectra. Continuing to the right, the addition of LC7 leads to formation of the dynein subcomplex and the release of SAH autoinhibition. The free SAH is now able to resume transient interactions with H2 prior to binding with either p150CC1B or NudECC. Finally, addition of p150CC1B or NudECC leads to the formation of the p150 and NudE subcomplexes (bottom right). Our sedimentation velocity analytical ultracentrifugation data suggest that the NudE subcomplex adopts a more elongated conformation.
Tables
Key resources table
| Reagent type (species) or resource | Designation | Source or reference | Identifiers | Additional information |
|---|---|---|---|---|
| Gene (Chaetomium thermophilum) | Ct IC | NA | UniProt: G0SCF1-1 | |
| Strain, strain background (Escherichia coli) | Rosetta (DE3) | Sigma-Aldrich | Catalog number: 70954 | |
| Cell line (Insect) | Sf9 | ThermoFisher | Catalog number: 11496015 | Used within 1 yr of purchase |
| Strain, strain background (E. coli) | DH10EMBacY | Geneva Biotech | DH10EMBacY | Used within 1 yr of purchase |
| Peptide, recombinant protein | Ct IC full length protein | GenScript | pFastbac1 vector | |
| Peptide, recombinant protein | IC1-88 | Ref. 32 | ||
| Peptide, recombinant protein | IC37-88 | GenScript | ||
| Peptide, recombinant protein | IC160-240 | GenScript | ||
| Peptide, recombinant protein | IC216-260 | Azenta Life Sciences | ||
| Chemical compound, drug | Ammonium- 15N chloride | Sigma Aldrich | Catalog number: 299251 | |
| Chemical compound, drug | D-glucose 13C6 | Sigma Aldrich | Catalog number: 389374 | |
| Software, algorithm | Origin 7.0 | OriginLab | ||
| Software, algorithm | SEDFIT | Open-source | ||
| Software, algorithm | TopSpin 3.6 | Bruker Biospin Corporation | RRID:SCR_014227 | |
| Software, algorithm | CcpNmr analysis (CCPN) | Ref. 80 | RRID:SCR_016984 | |
| Software, algorithm | NMRPipe | Ref. 78 |
Additional files
-
Supplementary file 1
ITC results for intermediate chain interactions with p150CC1B and NudECC at 25°C.
aFor the p150CC1B experiments, a two-site binding model was used as it provided much better fits when compared to a single site model. bFitting of this experiment was done with set N values due to the amount of extra noise in the data and thus the N values are reported without error. cThis experiment did not show evidence of binding and thus the data was not fit to a binding model.
- https://cdn.elifesciences.org/articles/80217/elife-80217-supp1-v2.docx
-
MDAR checklist
- https://cdn.elifesciences.org/articles/80217/elife-80217-mdarchecklist1-v2.docx
Download links
A two-part list of links to download the article, or parts of the article, in various formats.
Downloads (link to download the article as PDF)
Open citations (links to open the citations from this article in various online reference manager services)
Cite this article (links to download the citations from this article in formats compatible with various reference manager tools)
Multivalency, autoinhibition, and protein disorder in the regulation of interactions of dynein intermediate chain with dynactin and the nuclear distribution protein
eLife 11:e80217.
https://doi.org/10.7554/eLife.80217


