Antibiotic-induced accumulation of lipid II synergizes with antimicrobial fatty acids to eradicate bacterial populations
- Department of Microbiology and Immunology, University of North Carolina at Chapel Hill, United States
- Department of Genetics, University of North Carolina at Chapel Hill, United States
- Bioinformatics and Analytics Research Collaborative, University of North Carolina at Chapel Hill, United States
- Institute for Pharmaceutical Microbiology, University of Bonn, Germany
- Division of Infectious Diseases, Duke University, United States
- Marsico Lung Institute, University of North Carolina at Chapel Hill, United States
Figures
Figure 1 with 3 supplements
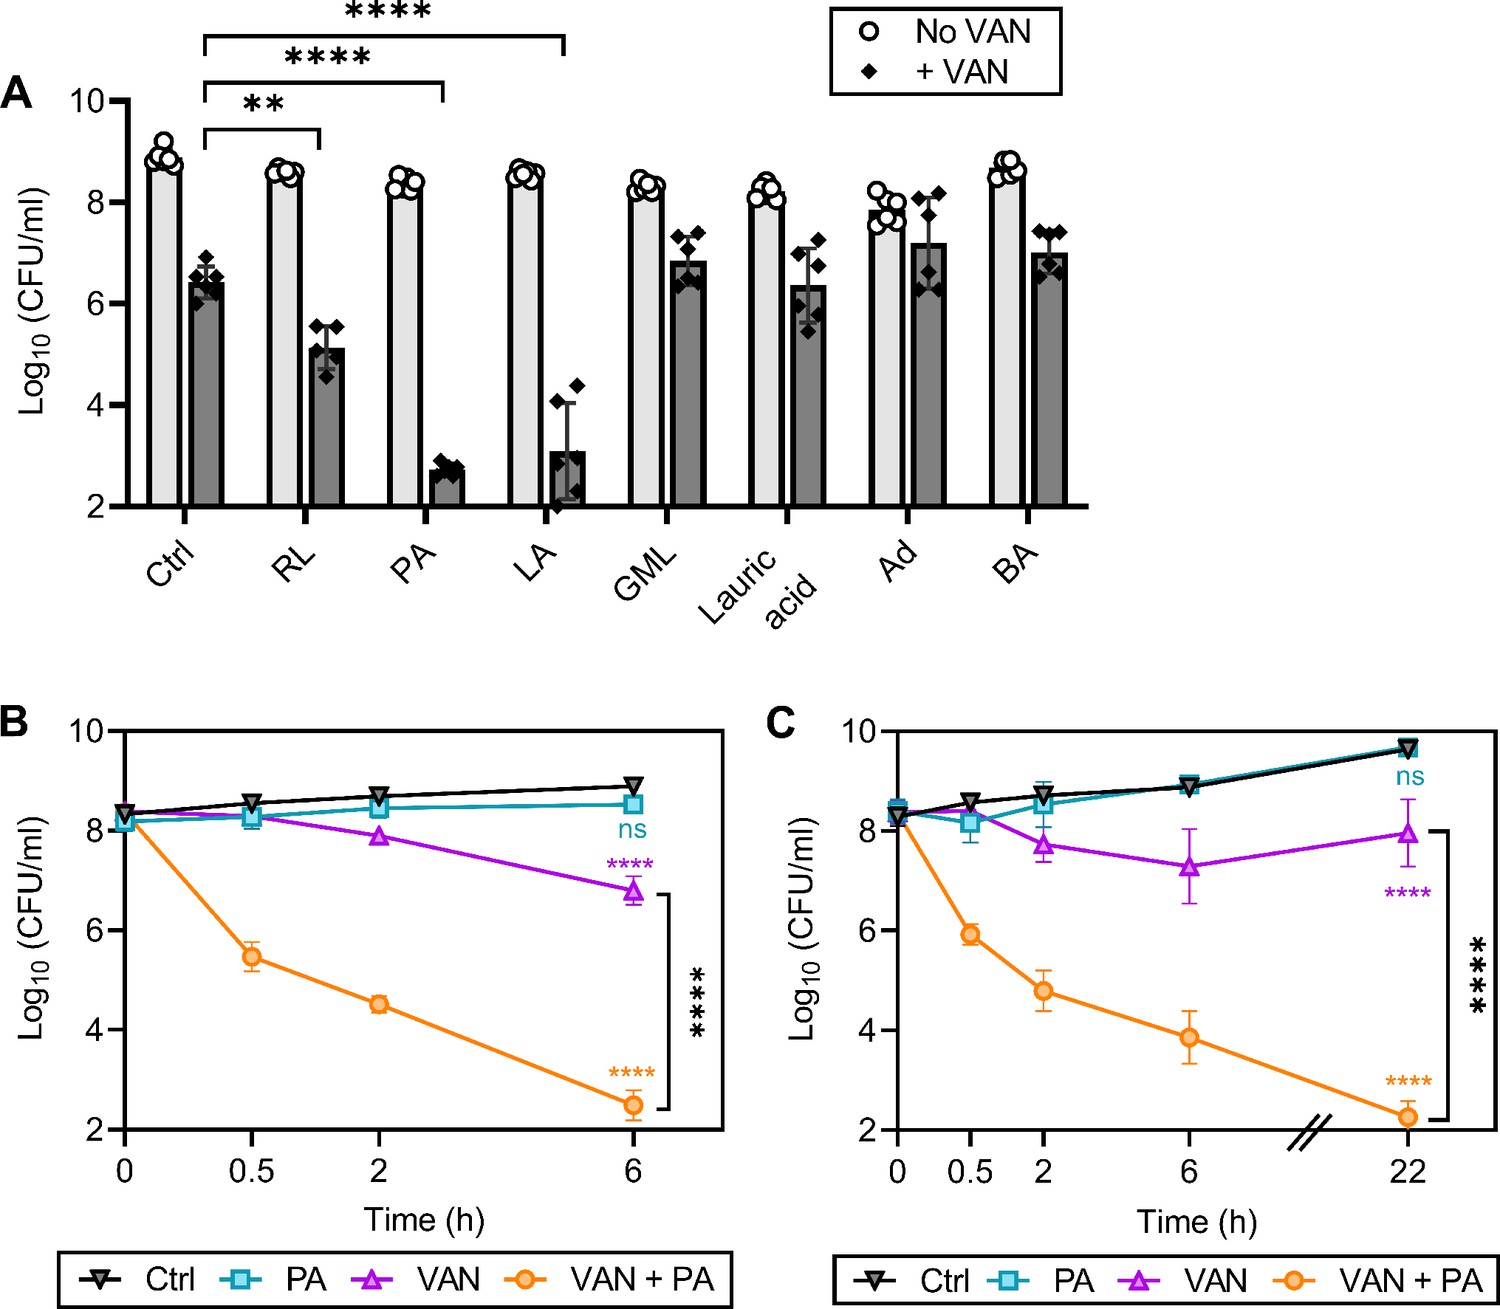
Palmitoleic acid rapidly potentiates vancomycin killing of S. aureus.
(A) S. aureus HG003 cultures were grown to exponential phase and subsequently treated with CMAAs ± vancomycin (20 μg/ml, 20 X MIC of HG003). Colony forming units (CFUs) were enumerated after 6 hr. CMAAs tested include rhamnolipids (30 μg/ml), palmitoleic acid (11 μg/ml), linoleic acid (12 μg/ml), glycerol monolaurate (30 μg/ml), lauric acid (30 μg/ml), adarotene (3.2 μg/ml), and benzyl alcohol (40 mM). The statistical significance was determined using one-way ANOVA with Dunnett’s multiple comparison test comparing dual treated conditions to vancomycin alone. Unless indicated, comparisons were not significant. Data represent n=6 biologically independent replicates. (B) Methicillin-sensitive S. aureus (MSSA) strain HG003 (C) or community-acquired methicillin-resistant S. aureus (MRSA) strain LAC was challenged with DMSO (Ctrl), palmitoleic acid (11 μg/ml), vancomycin (20 μg/ml), orcombination therapy. CFU was enumerated at indicated time points. Data represent the mean values from n=6 biologically independent replicates ± SD. Statistical significance was determined using a two-way ANOVA with Dunnett’s multiple comparison test on the final time point evaluated (B and C). Comparisons made between the control and experimental conditions are indicated in the associated line color. ** and **** denote p<0.01 and p<0.0001, respectively. VAN, vancomycin; RL, rhamnolipids; PA, palmitoleic acid; LA, linoleic acid; GML, glycerol monolaurate; Ad, adarotene; BA, benzyl alcohol.
-
Figure 1—source data 1
Related to Figure 1A–C.
- https://cdn.elifesciences.org/articles/80246/elife-80246-fig1-data1-v2.xlsx
Figure 1—figure supplement 1
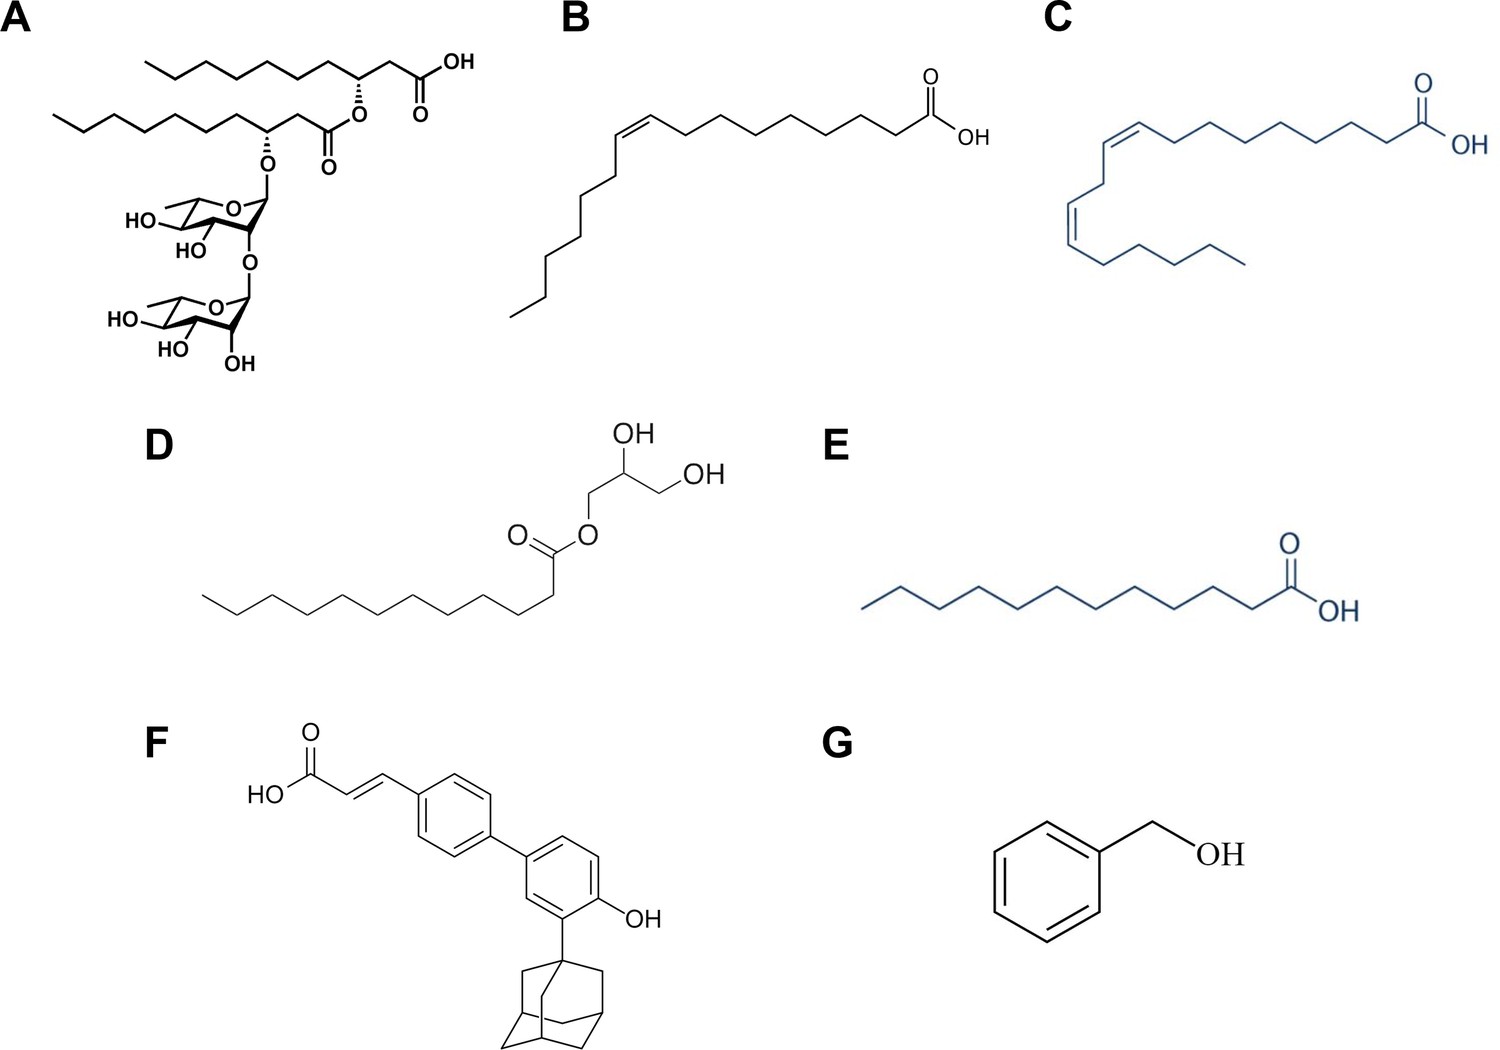
Structures of CMAAs evaluated for synergy with vancomycin.
(A) Rhamnolipid, a biosurfactant produced by Pseudomonas aeruginosa; (B) palmitoleic acid, a monounsaturated fatty acid; (C) linoleic acid, a polyunsaturated fatty acid; (D) glycerol monolaurate, a monoglyceride; (E) lauric acid, a saturated fatty acid; (F) adarotene, a synthetic retinoid; (G) benzyl alcohol, a general membrane fluidizer.
Figure 1—figure supplement 2
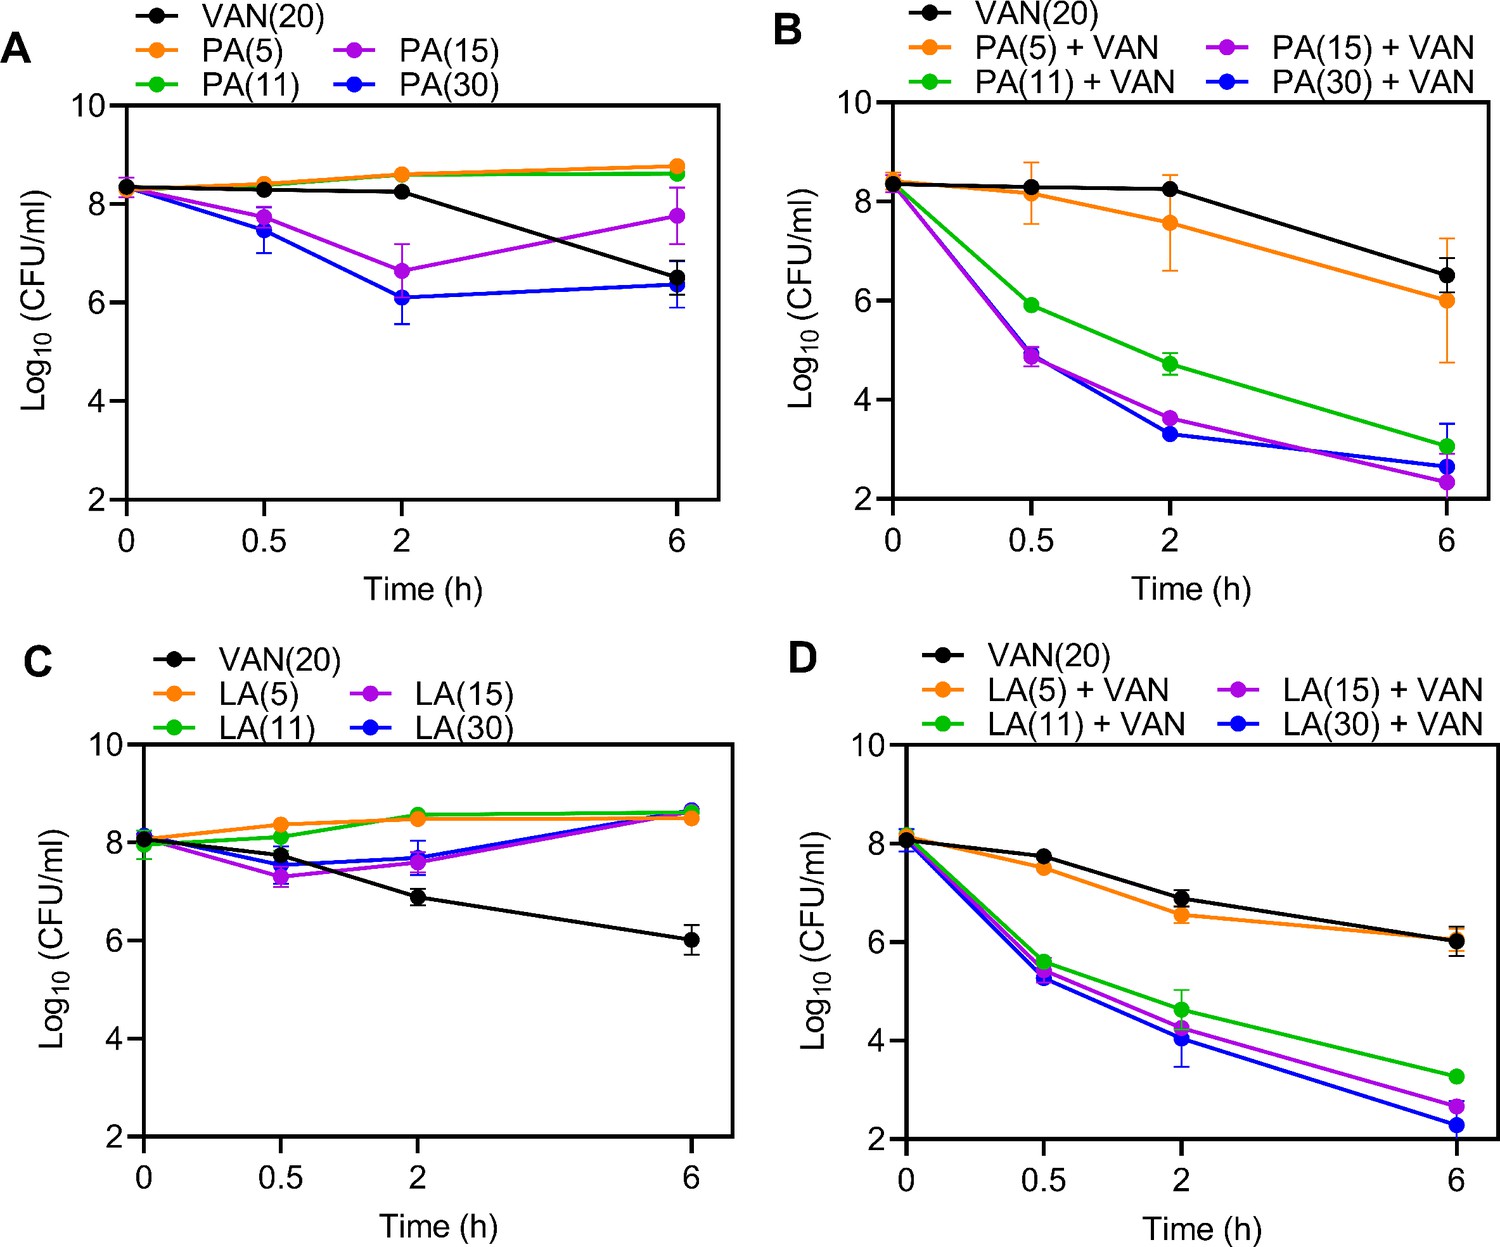
Identification of sublethal concentration of UFAs.
HG003 was grown to exponential phase prior to challenge with 5, 11, 15, or 30 μg/ml of (A) PA alone, (B) PA +VAN (20 μg/ml), (C) LA alone, or (D) LA + VAN. An aliquot of cells was removed at the indicated time point, washed, and plated for colony forming unit (CFU). Data represent the mean values from n=3 biologically independent replicates ± SD. PA, palmitoleic acid; LA, linoleic acid; VAN, vancomycin.
-
Figure 1—figure supplement 2—source data 1
Related to Figure 1—figure supplement 2A–D.
- https://cdn.elifesciences.org/articles/80246/elife-80246-fig1-figsupp2-data1-v2.xlsx
Figure 1—figure supplement 3
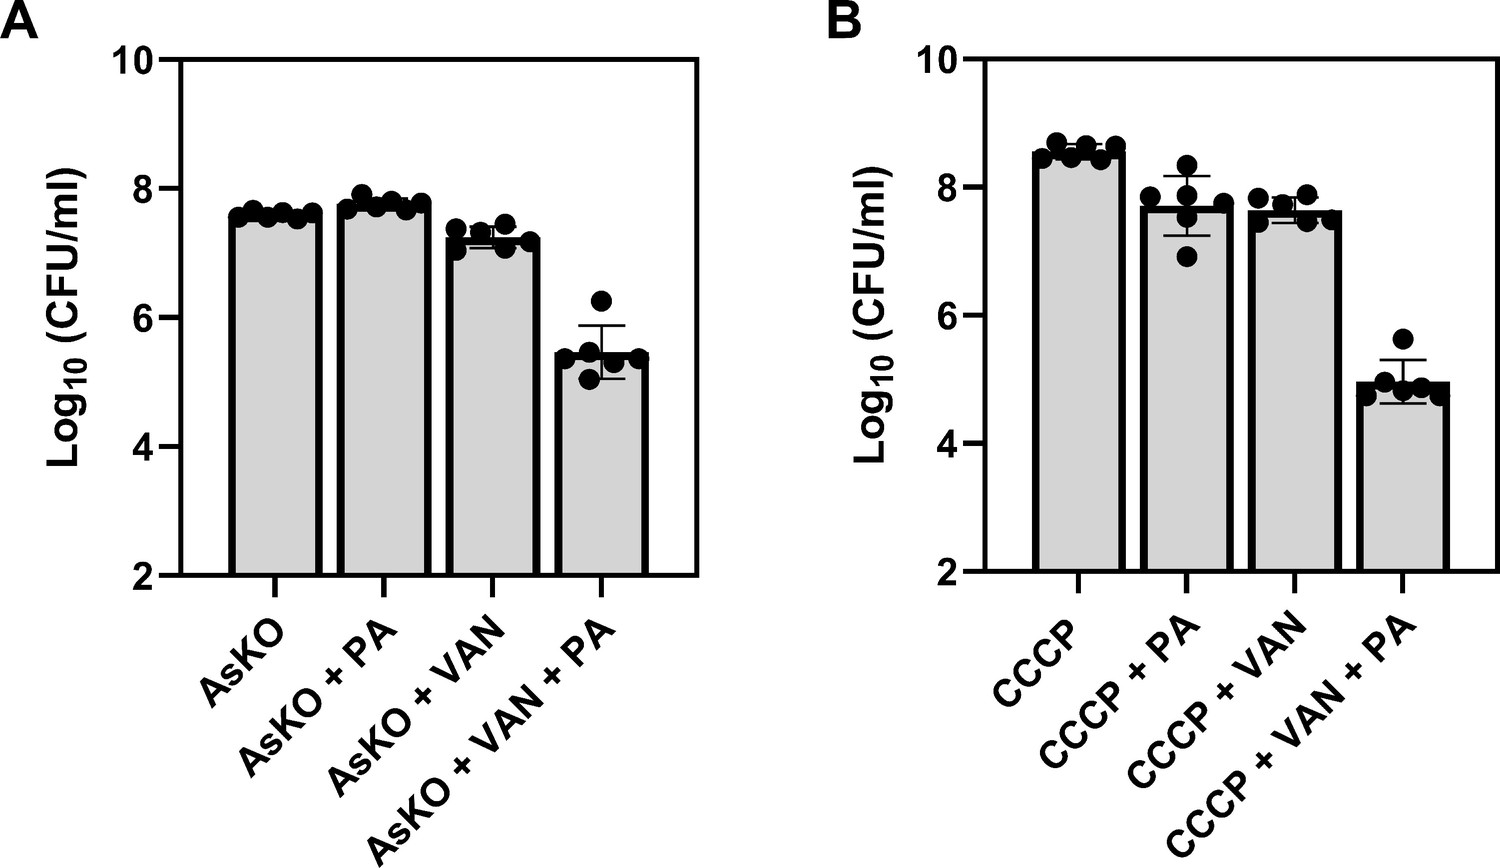
Palmitoleic acid potentiates vancomycin killing against chemically induced tolerance.
HG003 was grown to exponential phase and treated for 30 min with (A) Arsenate (AsKO, 5 mM), or (B) carbonyl cyanide m-chlorophenyl hydrazone (CCCP; 1 μM) prior to the addition of antibiotics. After 2 hr, an aliquot of cells was removed, washed, and plated to enumerate survivors. Data represent the mean values from n=6 biologically independent replicates ± SD. PA, palmitoleic acid; VAN, vancomycin.
-
Figure 1—figure supplement 3—source data 1
Related to Figure 1—figure supplement 3A–B.
- https://cdn.elifesciences.org/articles/80246/elife-80246-fig1-figsupp3-data1-v2.xlsx
Figure 2
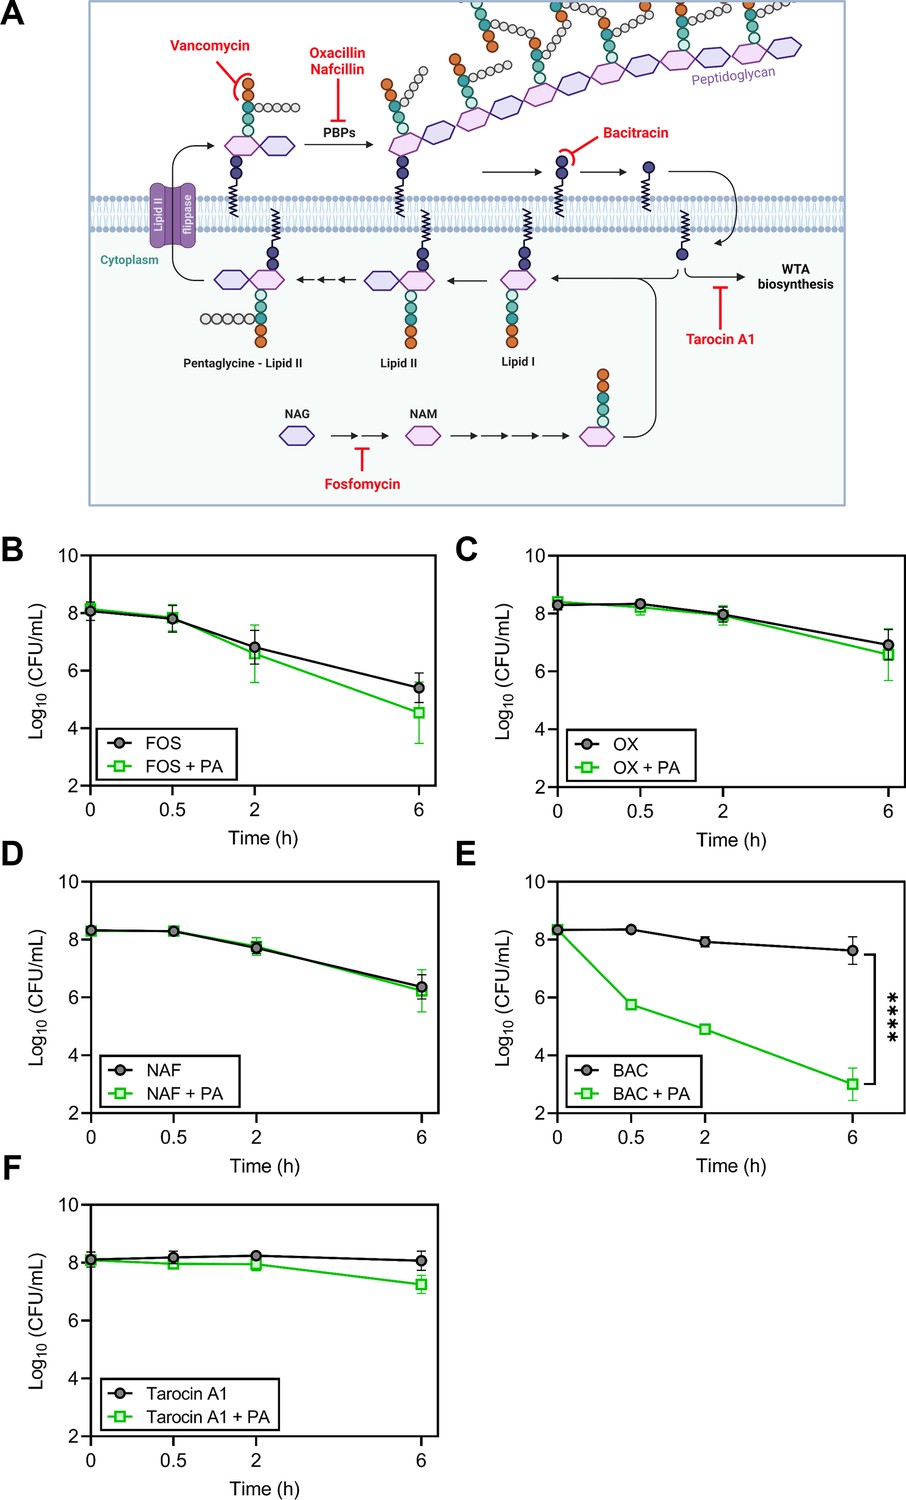
Accumulation of bactoprenol is necessary for palmitoleic acid potentiation of antibiotics.
(A) Schematic depicting cell wall biosynthesis, with each arrow in between intermediates indicating an enzymatic step. The cell wall is composed mainly of peptidoglycan, a polymer consisting of N-acetyl-glucosamine (NAG) and N-acetylmuramic acid (NAM) residues, the latter affixed with a short pentapeptide. NAM is attached to a lipid anchor known as bactoprenol and further modified to generate lipid II. Lipid II is flipped to the outer leaflet of the membrane and incorporated into the growing peptidoglycan layer. Bactoprenol is recycled and reused in a cyclic process. The targets inhibited by the antibiotics tested in (B–F) are indicated in red. Schematic created with BioRender.com. (B–F) Survival of HG003 challenged with indicated antibiotic monotherapy (black circles) or the antibiotic combined with PA (11 μg/ml, green square). Colony forming units (CFUs) were enumerated at indicated time points. Antibiotics tested include (B): fosfomycin (250 μg/ml)±PA, (C): the PBP2 inhibitor, oxacillin (OX, 5 X MIC, 5 μg/ml)±PA, (D): the PBP1-4 inhibitor, nafcillin (NAF, 5 X MIC, 2.5 μg/ml)±PA, (E): bacitracin (BAC, 250 μg/ml)±PA, and (F): tarocin A1 (8 μg/ml)±PA. Data represent the mean values from n=6 biologically independent replicates ± SD. Statistical analysis was evaluated at the end point by a two-tailed unpaired Student’s t-test with a 95% CI; conditions with significance are indicated on the graph, ****p<0.0001, otherwise comparisons were not significant.
-
Figure 2—source data 1
Related to Figure 2B–F.
- https://cdn.elifesciences.org/articles/80246/elife-80246-fig2-data1-v2.xlsx
Figure 3
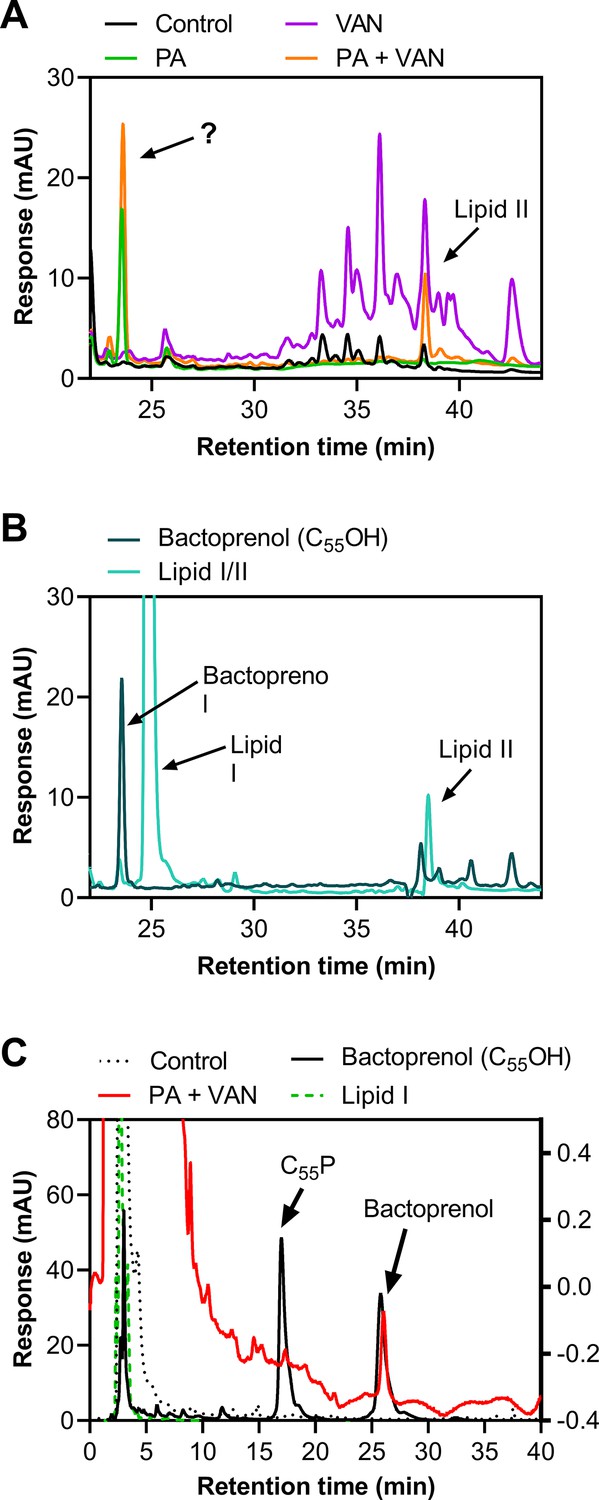
Treatment with palmitoleic acid induces accumulation of bactoprenol.
(A) S. aureus was grown to exponential phase and treated with DMSO (Control), PA monotherapy (11 μg/ml), VAN monotherapy (20 μg/ml), or PA +VAN combination therapy for 30 min. The membrane fraction was extracted and run on a C4 column. The question mark indicates an unknown peak. Additional peaks in VAN monotherapy may be glycinylated versions of lipid II. (B) High-performance liquid chromatography (HPLC) of a combined lipid I and lipid II, as well as a bactoprenol standard run alongside samples in A. (C) Samples run in A were subsequently run with a different method to yield better separation of bactoprenol and lipid I. PA +VAN samples align with the bactoprenol standard. Right Y-axis refers to PA +VAN samples due to lower concentrations of sample after sequential use in two different columns. Chromatograms are examples of n=3 biological replicates. PA, palmitoleic acid; VAN, vancomycin.
-
Figure 3—source data 1
Related to Figure 3A–C.
- https://cdn.elifesciences.org/articles/80246/elife-80246-fig3-data1-v2.xlsx
Figure 4 with 5 supplements
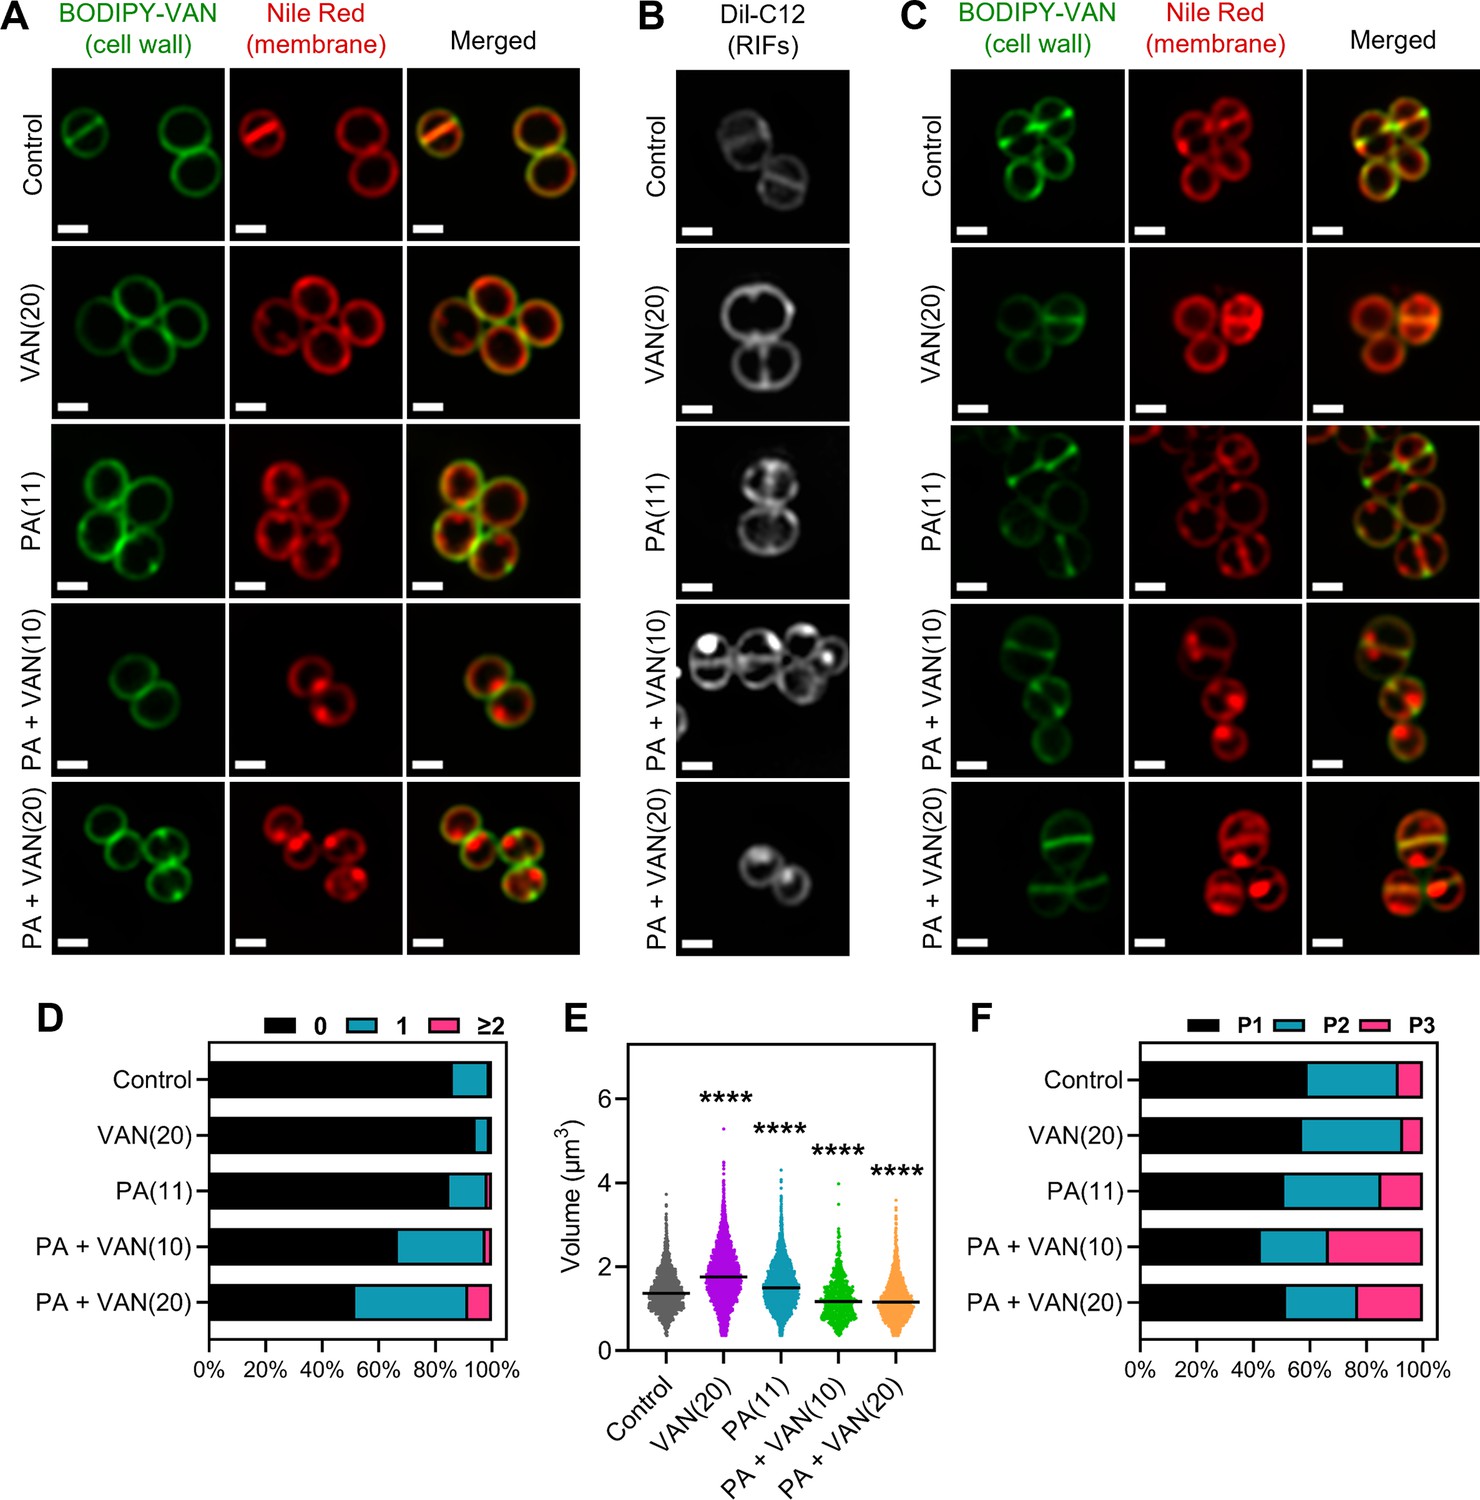
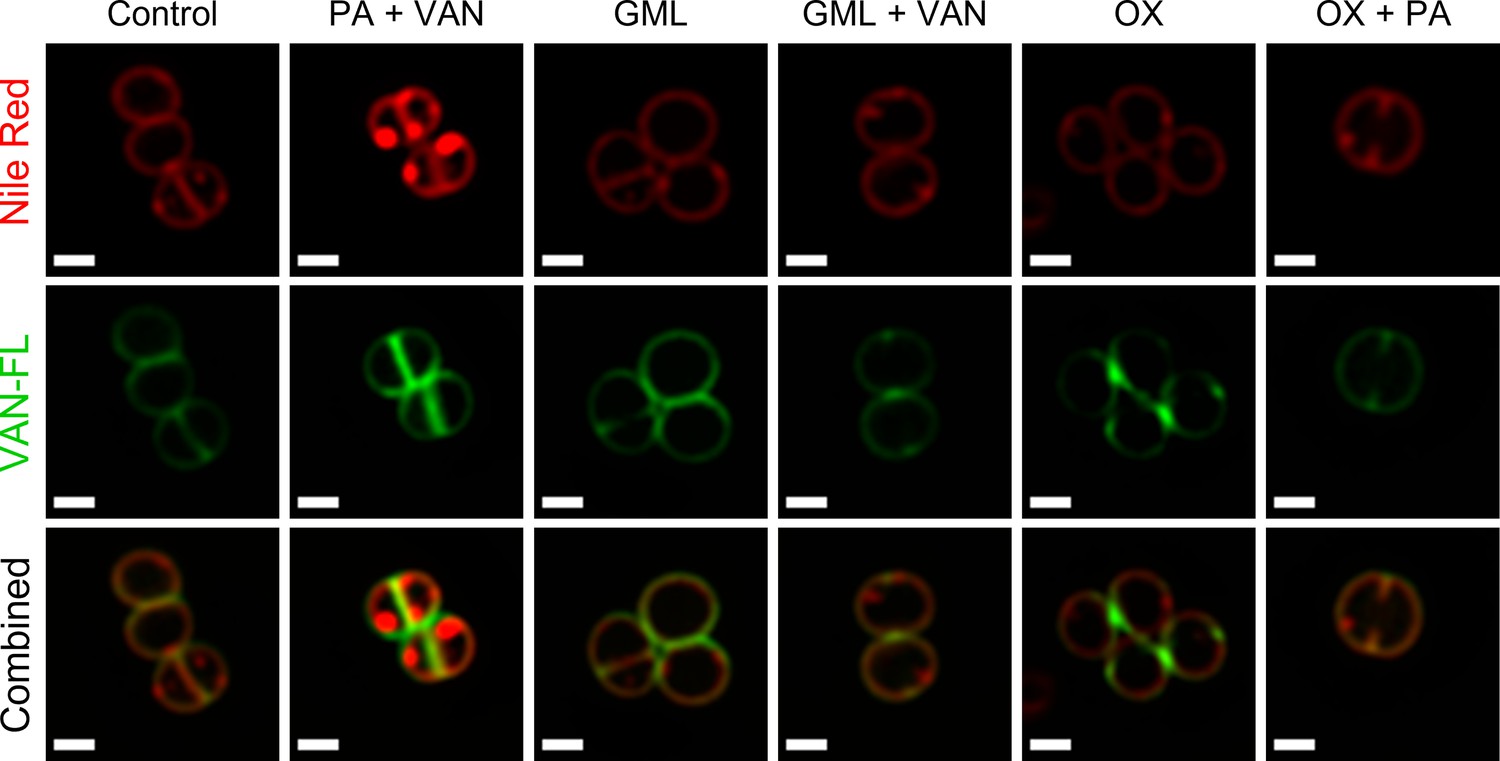
Dual treatment generates distinct fluid membrane patches.
S. aureus (HG003) treated with DMSO, PA (11 μg/ml), VAN (20 μg/ml), PA +VAN (10 μg/ml), or PA +VAN (20 μg/ml) for (A and B) 10 min or (C) 30 min. (A and C) HG003 was stained with fluorescent BODIPY-labeled VAN and nile red for 5 min. (B) Regions of increased fluidity (RIFs) in HG003 were visualized by DiI-C12. Cells were fixed prior to imaging on an agarose pad. Images are representative of the population. Scale bar, 1 μm. (D–F) Bioinformatic analysis of all cells treated for 30 min and imaged, n=2 or 3 separate biological replicates. (D) The number of nile red foci in each cell was quantified for each treatment group and represented as a percent of the total population. (E) Scatter plot of cell size of each cell in the indicated treatment group. The black line represents the median. Statistical significance was determined by one-way ANOVA with Dunnett’s multiple comparisons test, and all conditions had a p<0.0001, ****, compared to the control. (F) The cell cycle was determined for each cell in a given treatment group and illustrated as a percent of the total population; phase 1 (P1), phase 2 (P2), and phase 3 (P3).
-
Figure 4—source data 1
Related to Figure 4D–F.
- https://cdn.elifesciences.org/articles/80246/elife-80246-fig4-data1-v2.xlsx
Figure 4—figure supplement 1
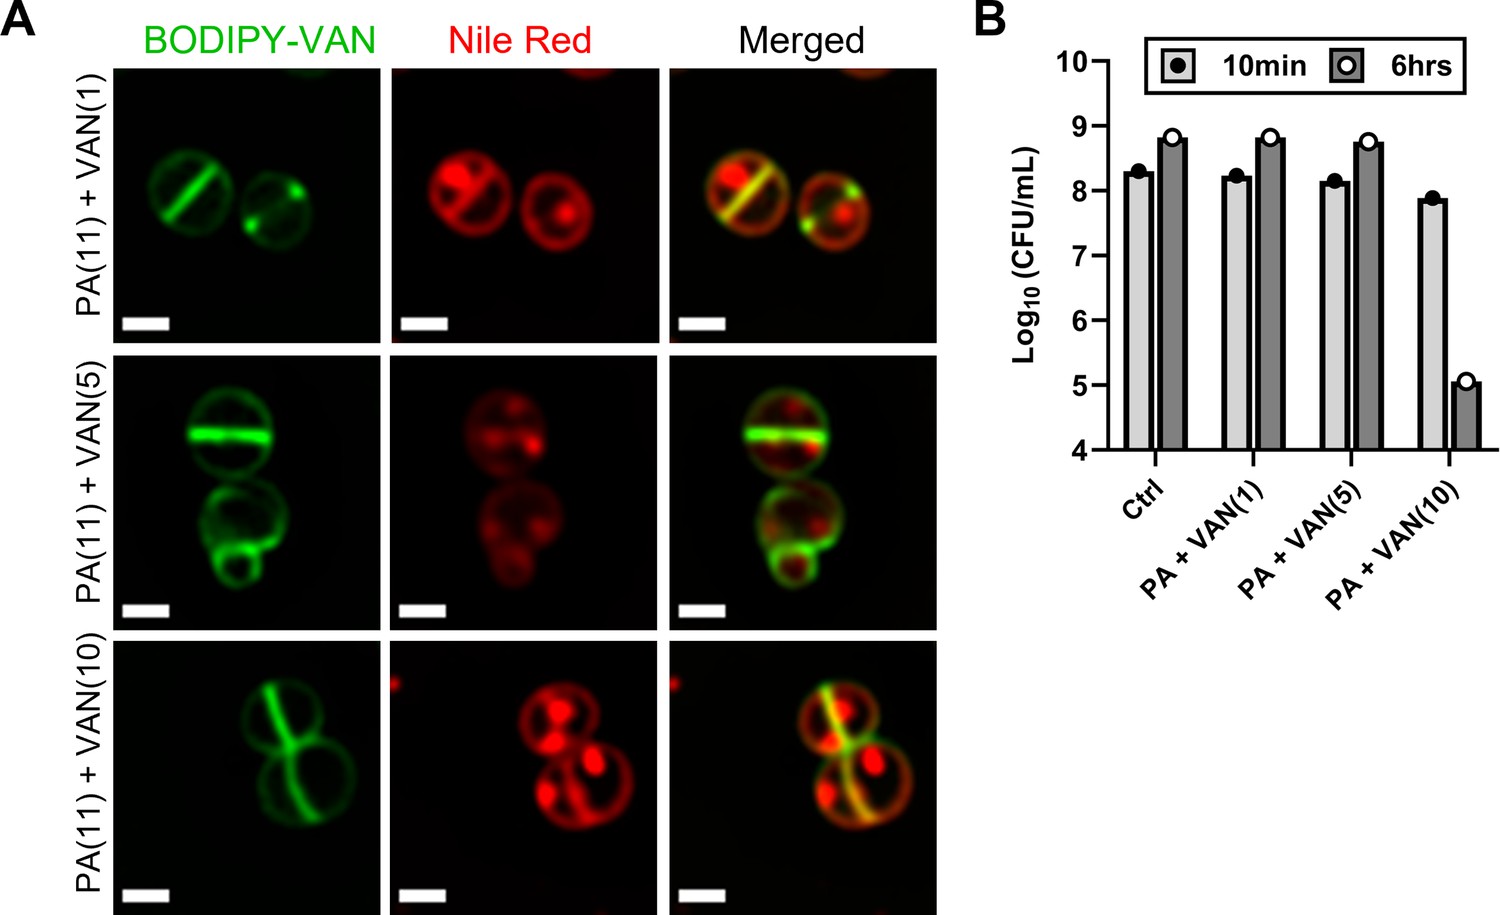
Sublethal concentrations of vancomycin with palmitoleic acid result in regions of increased fluidity.
(A) HG003 was grown to exponential phase prior to the addition of palmitoleic acid (11 μg/ml) combined with vancomycin at 1, 5, or 10 μg/ml. After 10 min, antibiotics were removed, and cells were stained with nile red and fluorescently labeled vancomycin for 5 min. Cells were fixed prior to imaging on an agarose pad. Images are representative of the population. Scale bar, 1 μm. (B) In one replicate, an aliquot of cells was removed prior to fixation, washed, and plated for colony forming unit (CFU) to evaluate whether the combination was sublethal in the images taken.
Figure 4—figure supplement 2
Regions of increased fluidity are not microscopically visible in the absence of synergy.
HG003 was grown to exponential phase prior to challenge with DMSO (control), palmitoleic acid (11 μg/ml), vancomycin (10 μg/ml), glycerol monolaurate (30 μg/ml), oxacillin (5 μg/ml), or a combination of these compounds as indicated in the figure. After 10 min, antibiotics were removed, and cells were stained with nile red and fluorescently labeled vancomycin for 5 min. Cells were fixed prior to imaging on an agarose pad. Images are representative of the population. Scale bar, 1 μm. PA, palmitoleic acid; VAN, vancomycin; GML, glycerol monolaurate; OX, oxacillin.
Figure 4—figure supplement 3
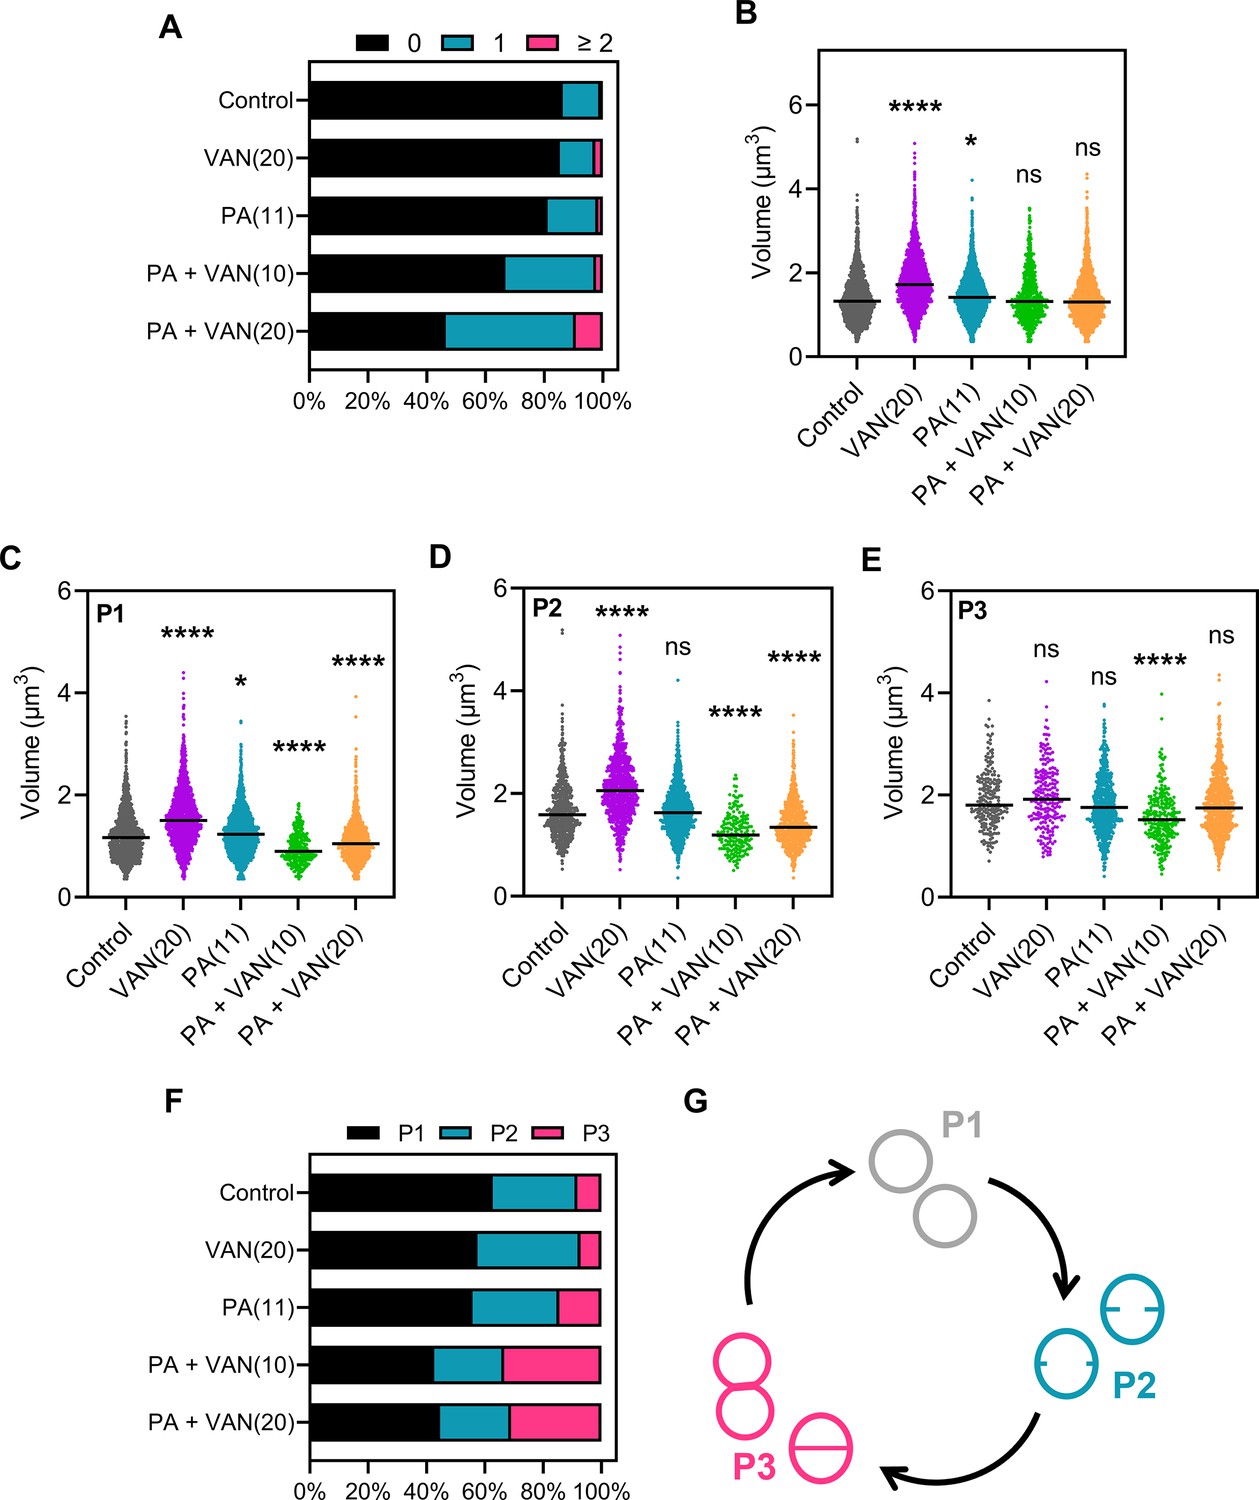
Image analysis of cells treated for 10 min.
Bioinformatic analysis of the total population imaged after 10 min of antibiotic treatment. Representative images can be found in Figure 4A. (A) Number of nile red labeled foci per cell in each treatment group was quantified and represented as a percent of the total population. (B) Scatter plot of cell volume per cell in each treatment group overall (i.e. P1–P3). Analysis of cell volume is further broken down by (C) cells only in P1, (D) cells only in P2, or (E) cells only in P3. Black line represents the median. Statistical significance was determined by one-way ANOVA with Dunnett’s multiple comparisons test comparing each condition to the control. n.s., *, **** denotes, not significant, p<0.05, and p<0.0001, respectively. (F) The cell cycle was determined for each cell in each treatment group and represented as a percent of the total population. (G) Schematic of the cell cycle and representative examples of cells classified in each phase. VAN, vancomycin; PA, palmitoleic acid; P1, phase 1; P2, phase 2; P3, phase 3.
-
Figure 4—figure supplement 3—source data 1
Related to Figure 4—figure supplement 3A–F.
- https://cdn.elifesciences.org/articles/80246/elife-80246-fig4-figsupp3-data1-v2.xlsx
Figure 4—figure supplement 4
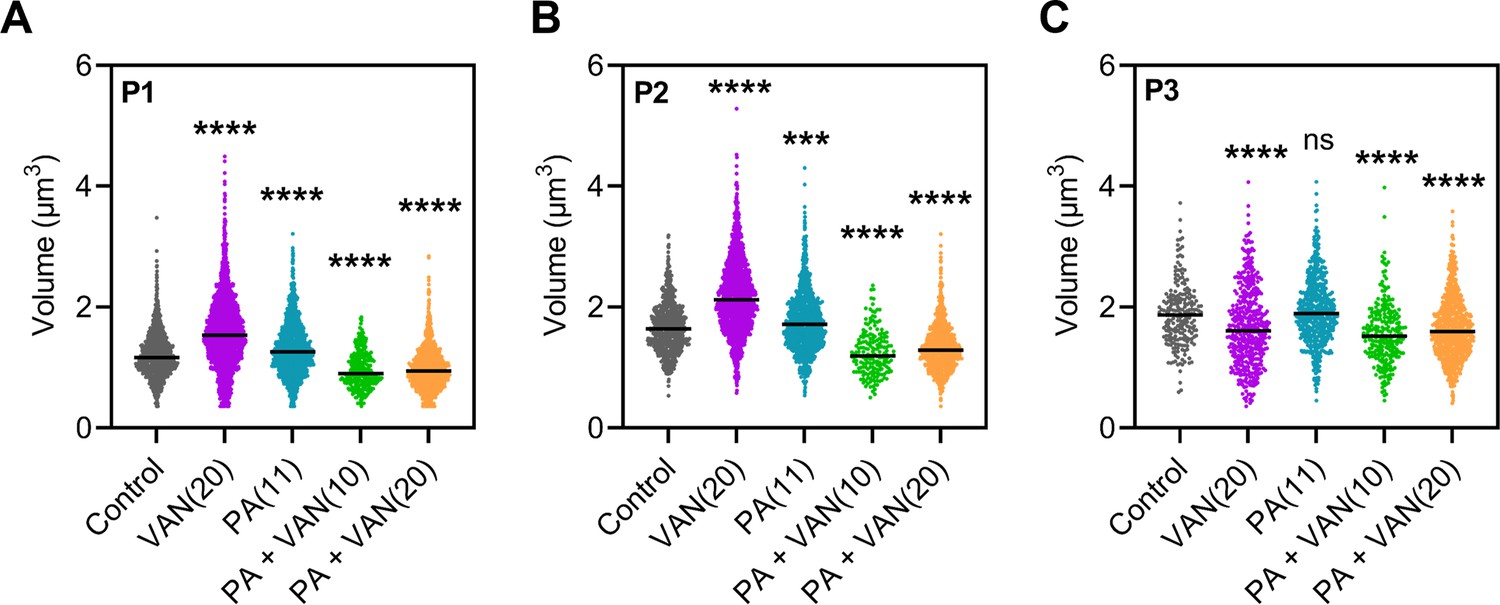
Dual treatment leads to a significant reduction in cell size compared to control cells regardless of cell cycle phase.
Bioinformatic analysis of cell volume based on cell cycle phase after 30 min of treatment. Representative images can be found in Figure 4C, and the overall cell volume of the population by treatment group can be found in Figure 4E. (A–C) Scatter plots of cell volume per cell in each treatment group broken down by (A) cells only in P1, (B) cells only in P2, or (C) cells only in P3. Black line represents the median. Statistical significance was determined by one-way ANOVA with Dunnett’s multiple comparisons test comparing each condition to the control. n.s., ***, **** denotes, not significant, p=0.0005, and p<0.0001, respectively. For representative examples of cells in each phase see Figure 4—figure supplement 3G. VAN, vancomycin; PA, palmitoleic acid; P1, phase 1; P2, phase 2; P3, phase 3.
-
Figure 4—figure supplement 4—source data 1
Related to Figure 4—figure supplement 4A–C.
- https://cdn.elifesciences.org/articles/80246/elife-80246-fig4-figsupp4-data1-v2.xlsx
Figure 4—figure supplement 5
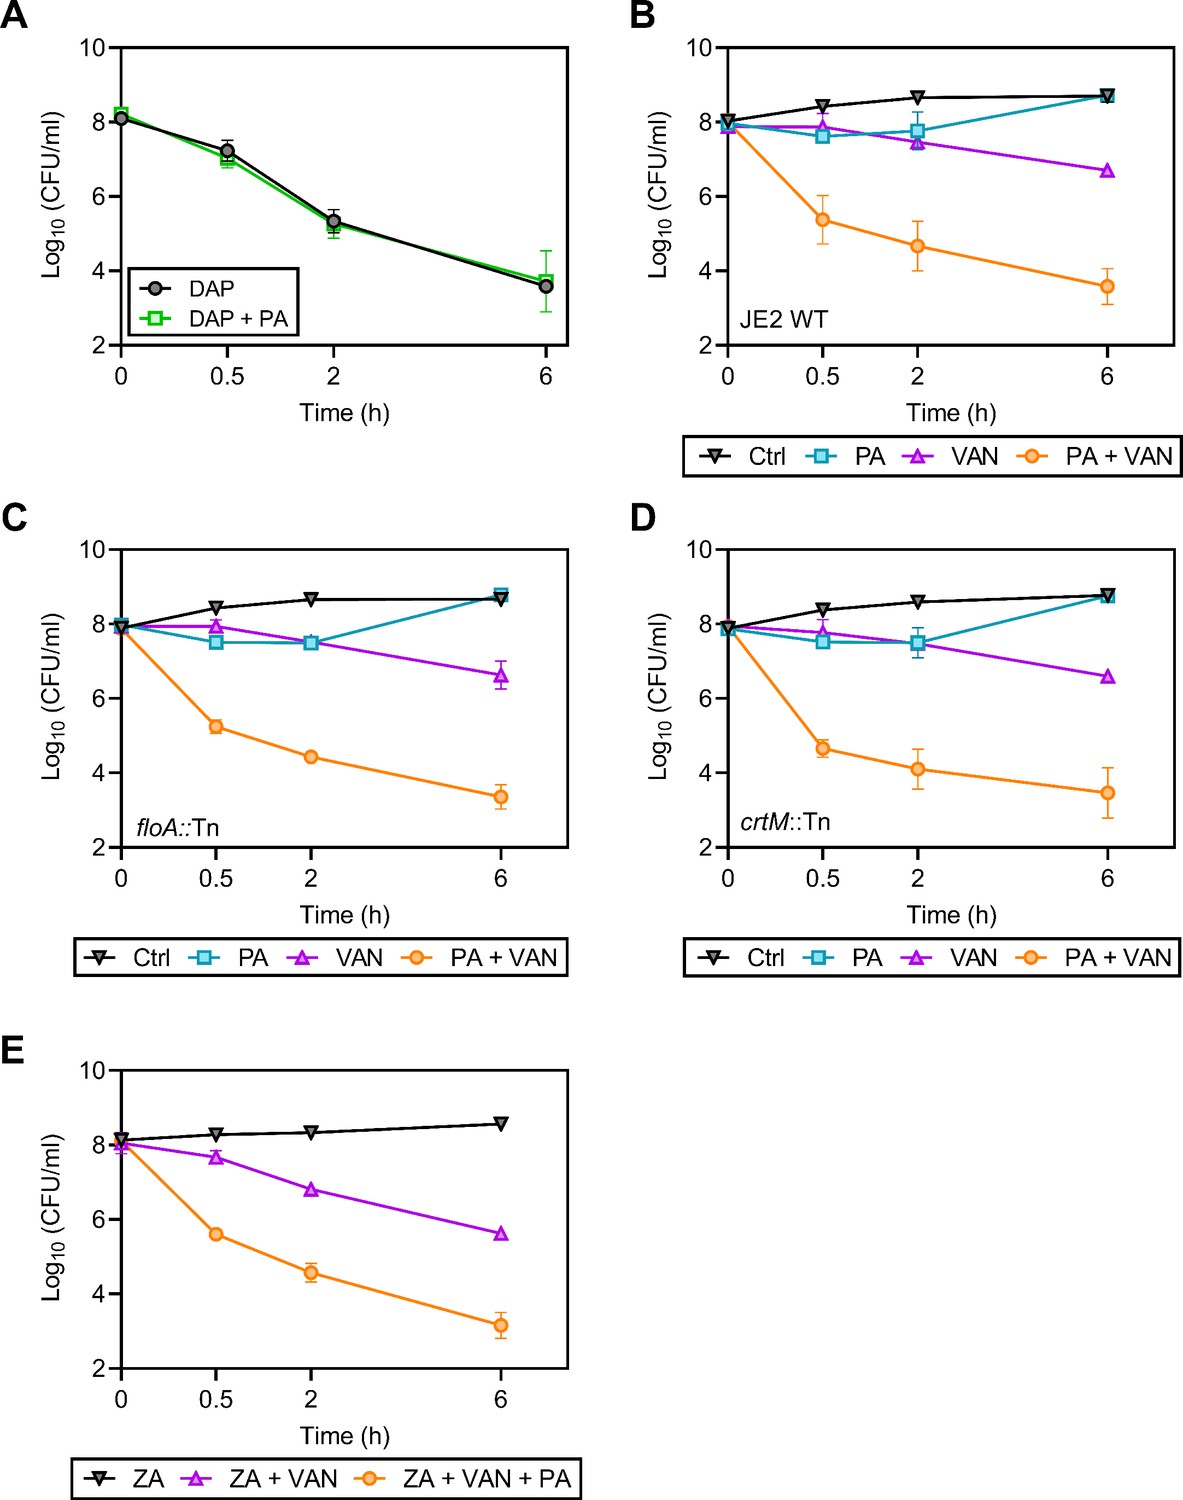
PA-VAN synergy is unaffected by proteins associated with flotillin microdomains.
All S. aureus strains were grown to exponential phase prior to the indicated treatment. An aliquot of cells was removed at the indicated time points, washed, and plated for colony forming unit (CFU) to enumerate survivors. (A) HG003 was treated with DAP (10 μg/ml)±PA (11 μg/ml). (B–D) JE2 wild-type, JE2 floA::Tn, and JE2 crtM::Tn were treated with DMSO (ctrl), PA (11 μg/ml), VAN (20 μg/ml), or PA and VAN. (E) HG003 cultures were treated with ZA for 30 min prior to the addition of VAN (20 μg/ml)±PA (11 μg/ml). Data represents n=6 biologically independent replicates with error bars as SD. DAP, daptomycin; PA, palmitoleic acid; WT, wild-type; VAN, vancomycin; ZA, zaragozic acid.
-
Figure 4—figure supplement 5—source data 1
Related to Figure 4—figure supplement 5A–E.
- https://cdn.elifesciences.org/articles/80246/elife-80246-fig4-figsupp5-data1-v2.xlsx
Figure 5
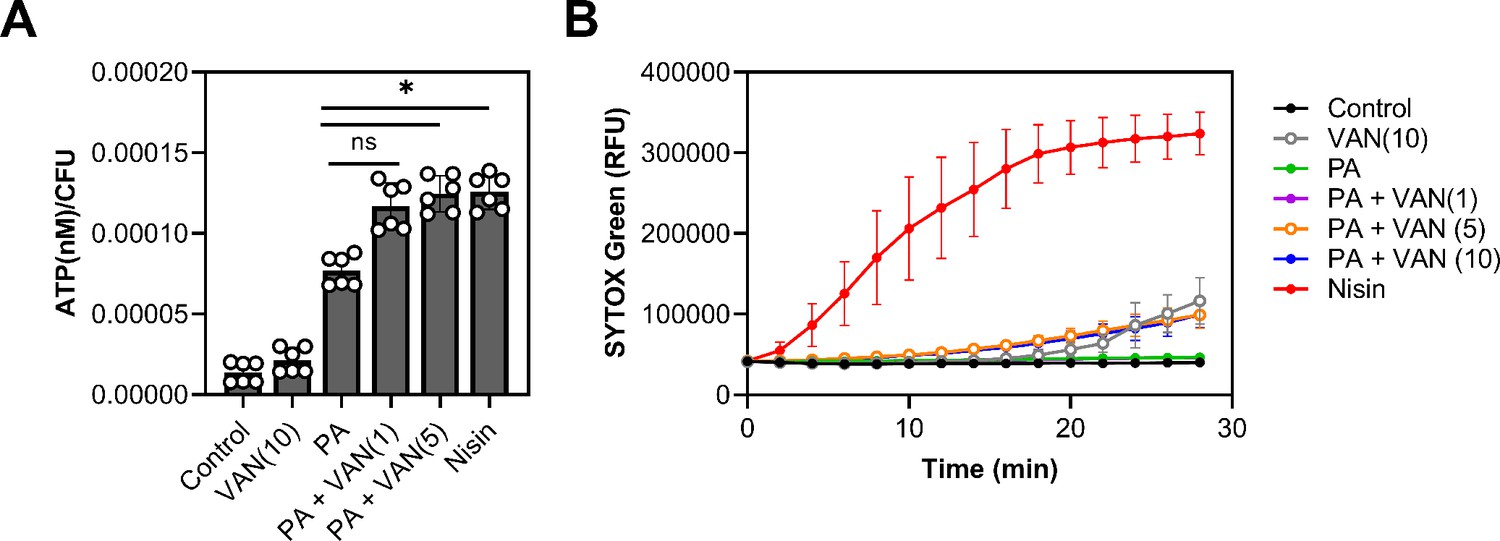
Dual treatment causes ATP leakage but not pore formation.
(A) S. aureus grown to exponential phase was treated with the indicated compounds for 10 min prior to separating the supernatant from the pellet. ATP measurements were taken using a plate reader and normalized to colony forming unit (CFU). (B) S. aureus grown to exponential phase was loaded with 8 μM of SYTOX Green and aliquoted into a microtiter plate prior to treatment. Membrane permeability was measured (485/522 nm) on a plate reader every 2 min for 28 min. (A–B) Cells were challenged with DMSO (control), nisin (200 IU/ml), or PA (11 μg/ml)±VAN (1, 5, or 10 μg/ml) were added as indicated on the graph. Data represent the mean values from n=2 or 3 biologically independent replicates with three technical replicates each ± SD. Statistical significance was determined by one-way ANOVA with Dunnett’s multiple comparisons test comparing the means of the technical replicates of each condition to PA alone. n.s. and * denote, not significant and p<0.0332, respectively.
-
Figure 5—source data 1
Related to Figure 5A–B.
- https://cdn.elifesciences.org/articles/80246/elife-80246-fig5-data1-v2.xlsx
Figure 6 with 1 supplement

Dual treated cells display septal aberrations.
The ultrastructure of S. aureus cells treated for 30 min was visualized by TEM. (A–H)S. aureus HG003 grown to mid-exponential phase was treated with DMSO (A and E), 11 μg/ml PA (B and F), 20 μg/ml VAN, (C and G) and PA +VAN (D, H). (A–C and E–G) Micrographs of cells with a cross wall at mid-cell, while (D and H) show cells treated with PA +VAN have deformed septa (yellow arrows) and membrane invaginations (red arrows). Magnification of 50,000× with a 0.5 μm scale bar (A–D) or magnification of 150,000× with a 200 nm scale bar (E–H). (E) (1) Electron-dense midline of the septum, (2) electron-dense intermediate layer, located between the (3) cell membrane and the (4) cell wall. The white holes in the cytoplasm of imaged cells are artifacts that occur during sample preparation (Tizro et al., 1897). PA, palmitoleic acid; VAN, vancomycin.
Figure 6—figure supplement 1
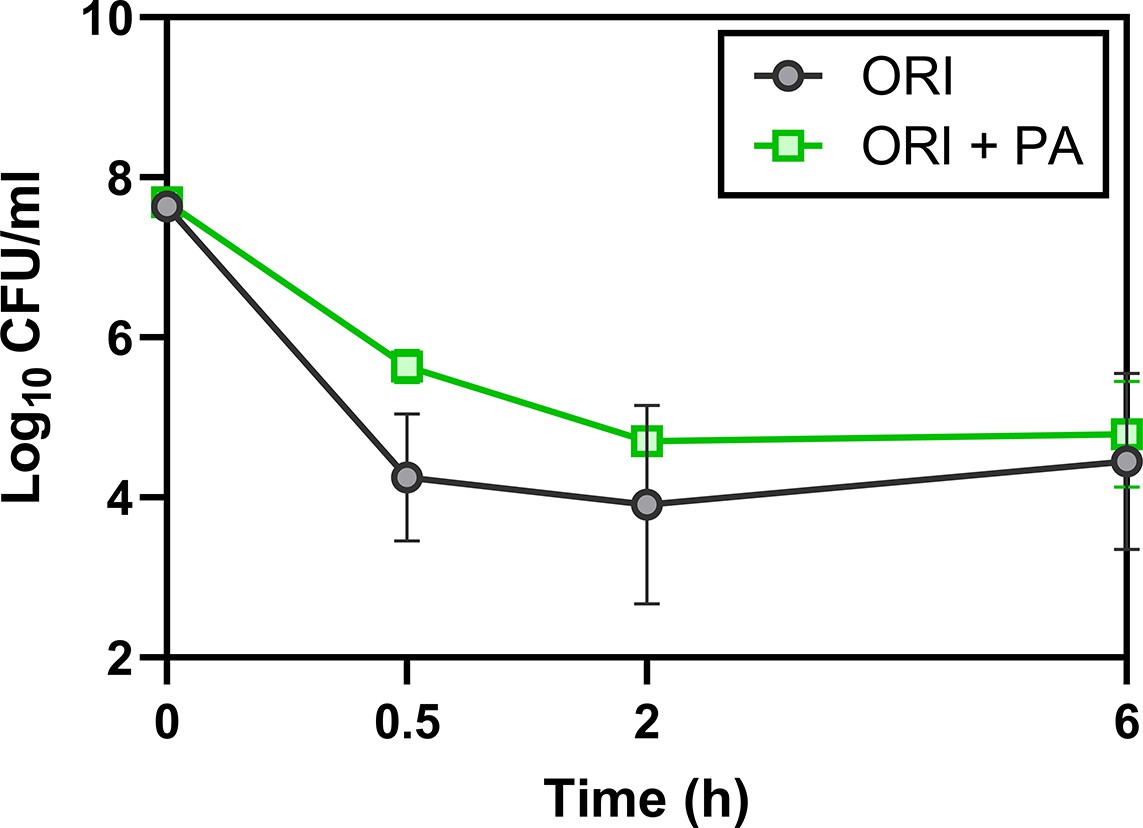
Lipoglycopeptides do not synergize with palmitoleic acid.
HG003 was grown to exponential phase prior to treatment with oritavancin (10 μg/ml)±palmitoleic acid (11 μg/ml). Aliquots of cells were taken at indicated time points, washed, and plated to enumerate survivors. Data represents n=3 biological replicates and error bars as SD. ORI, oritavancin; PA, palmitoleic acid.
-
Figure 6—figure supplement 1—source data 1
Related to Figure 6—figure supplement 1.
- https://cdn.elifesciences.org/articles/80246/elife-80246-fig6-figsupp1-data1-v2.xlsx
Figure 7 with 1 supplement
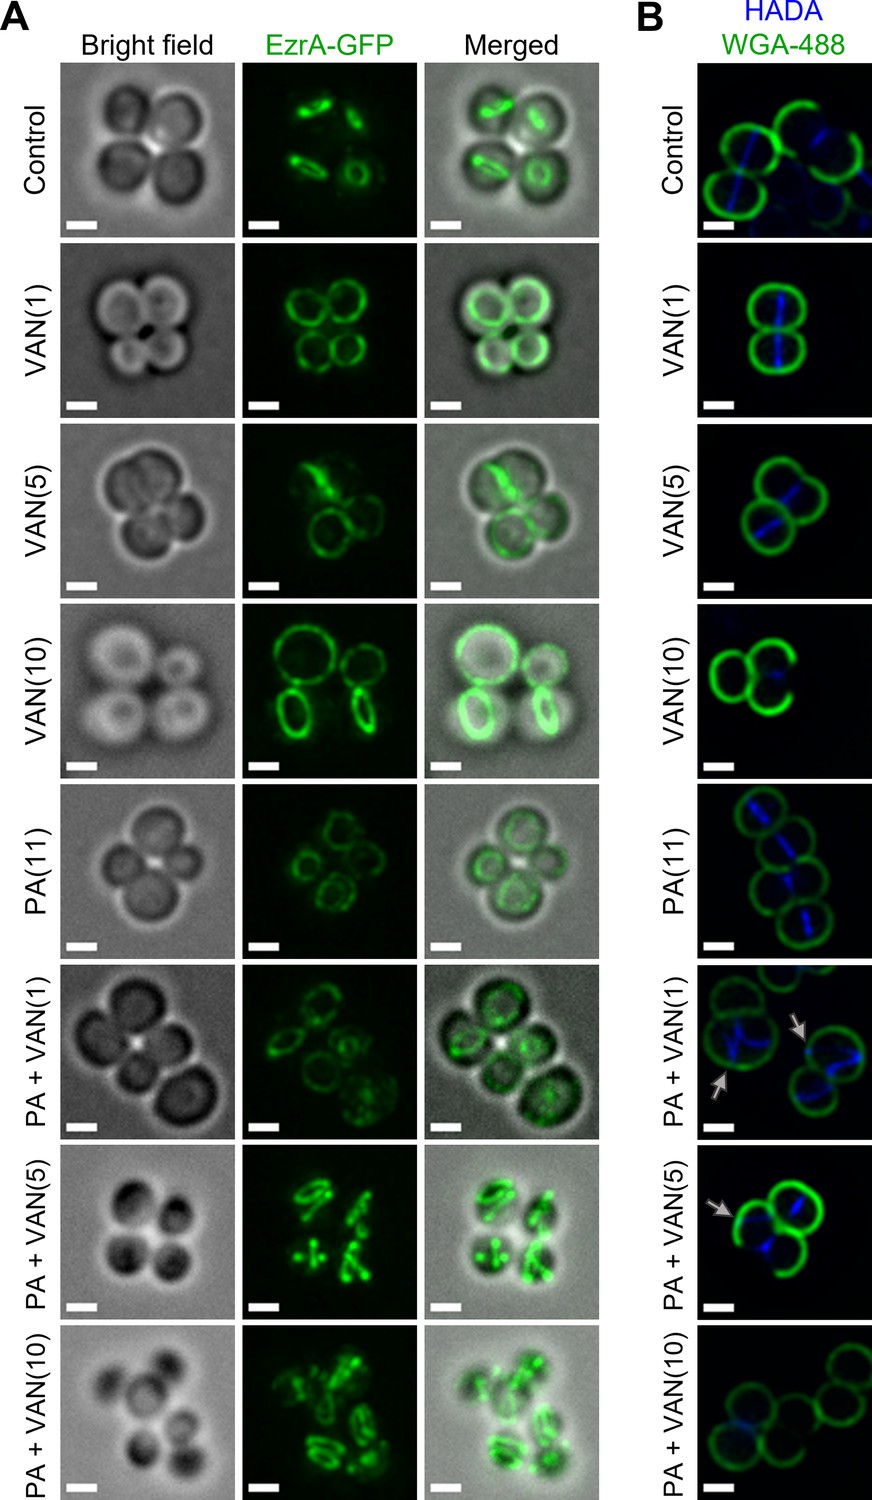
Dual treatment with vancomycin and palmitoleic acid causes septal protein delocalization.
Localization of cell division and peptidoglycan biosynthesis machinery after 10 min. (A) HG003 with chromosomal ezrA-gfp was grown to exponential phase prior to treatment with DMSO (control), VAN (1, 5, or 10 μg/ml), PA (11 μg/ml), or PA +VAN at indicated concentrations in parentheses. (B) HG003 was grown to exponential phase and treated for a total of 10 min as indicated, and HADA (blue) was added after 5 min. The compounds and HADA dye were washed from the cells and stained with wheat germ agglutinin (WGA; green) for 5 min and then fixed. Gray arrows illustrated aberrant localization of peptidoglycan synthesis. (A–B) After treatment, cells were fixed prior to imaging on an agarose pad. Scale bars,1 μm. n=2 biological replicates.
Figure 7—figure supplement 1
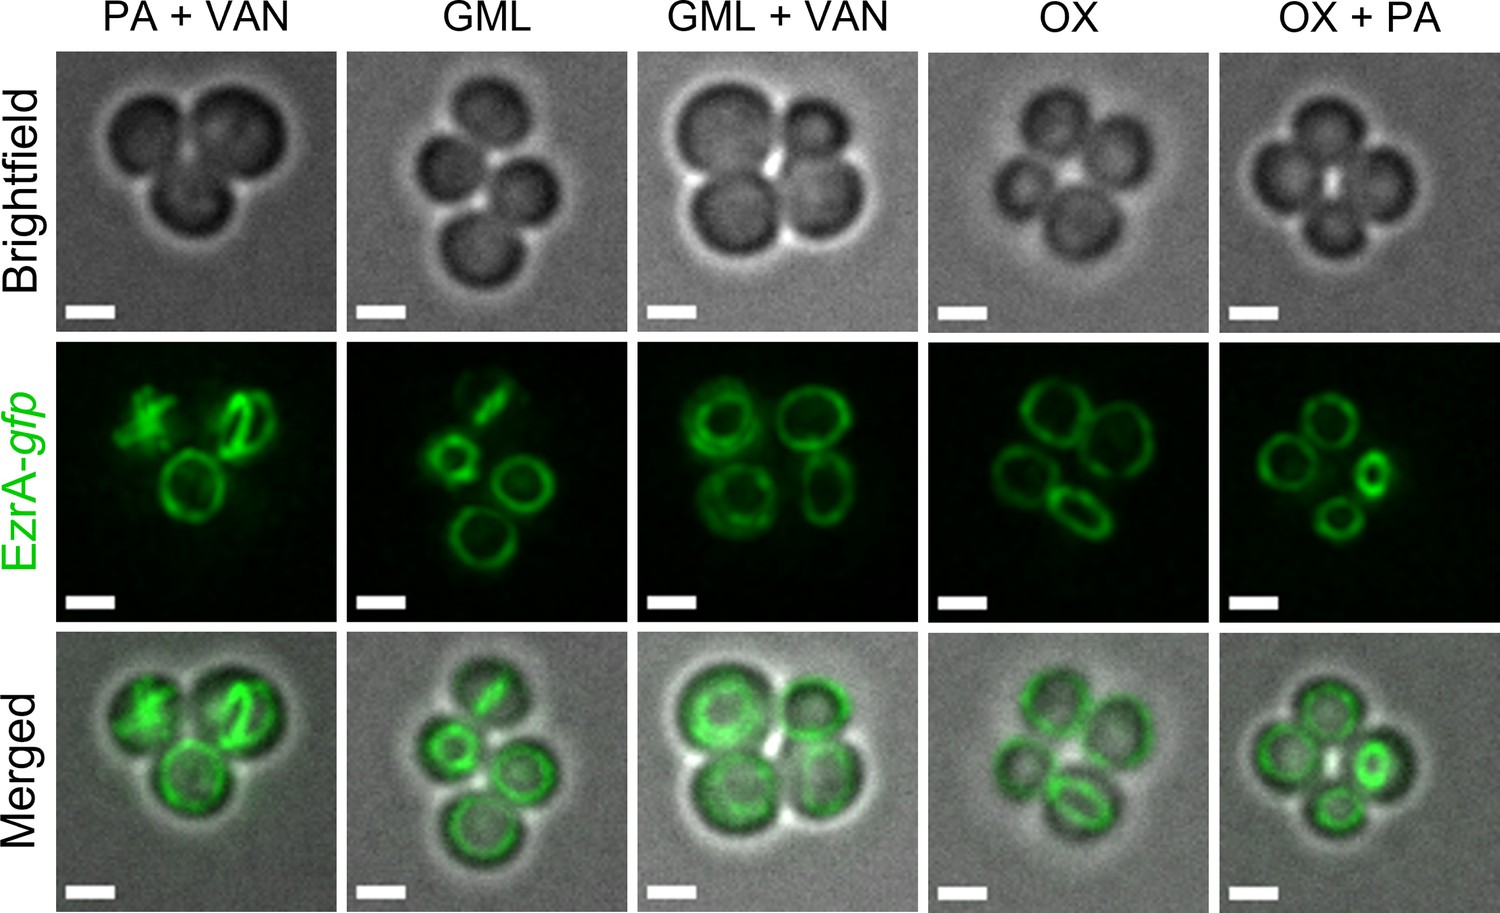
Protein delocalization is absent when S. aureus is treated compounds that lack synergy with palmitoleic acid or vancomycin.
Localization of cell division machinery after 10 min was monitored using HG003 with a chromosomal ezrA-gfp. Cells were grown to exponential phase prior to treatment with vancomycin (10 μg/ml), palmitoleic acid (11 μg/ml), glycerol monolaurate (30 μg/ml), oxacillin (5 μg/ml), or in combination with palmitoleic acid or vancomycin as indicated. After treatment, cells were fixed prior to imaging on an agarose pad. Images are representative of the population. Scale bar, 1 μm. PA, palmitoleic acid; VAN, vancomycin; GML, glycerol monolaurate; OX, oxacillin.
Figure 8
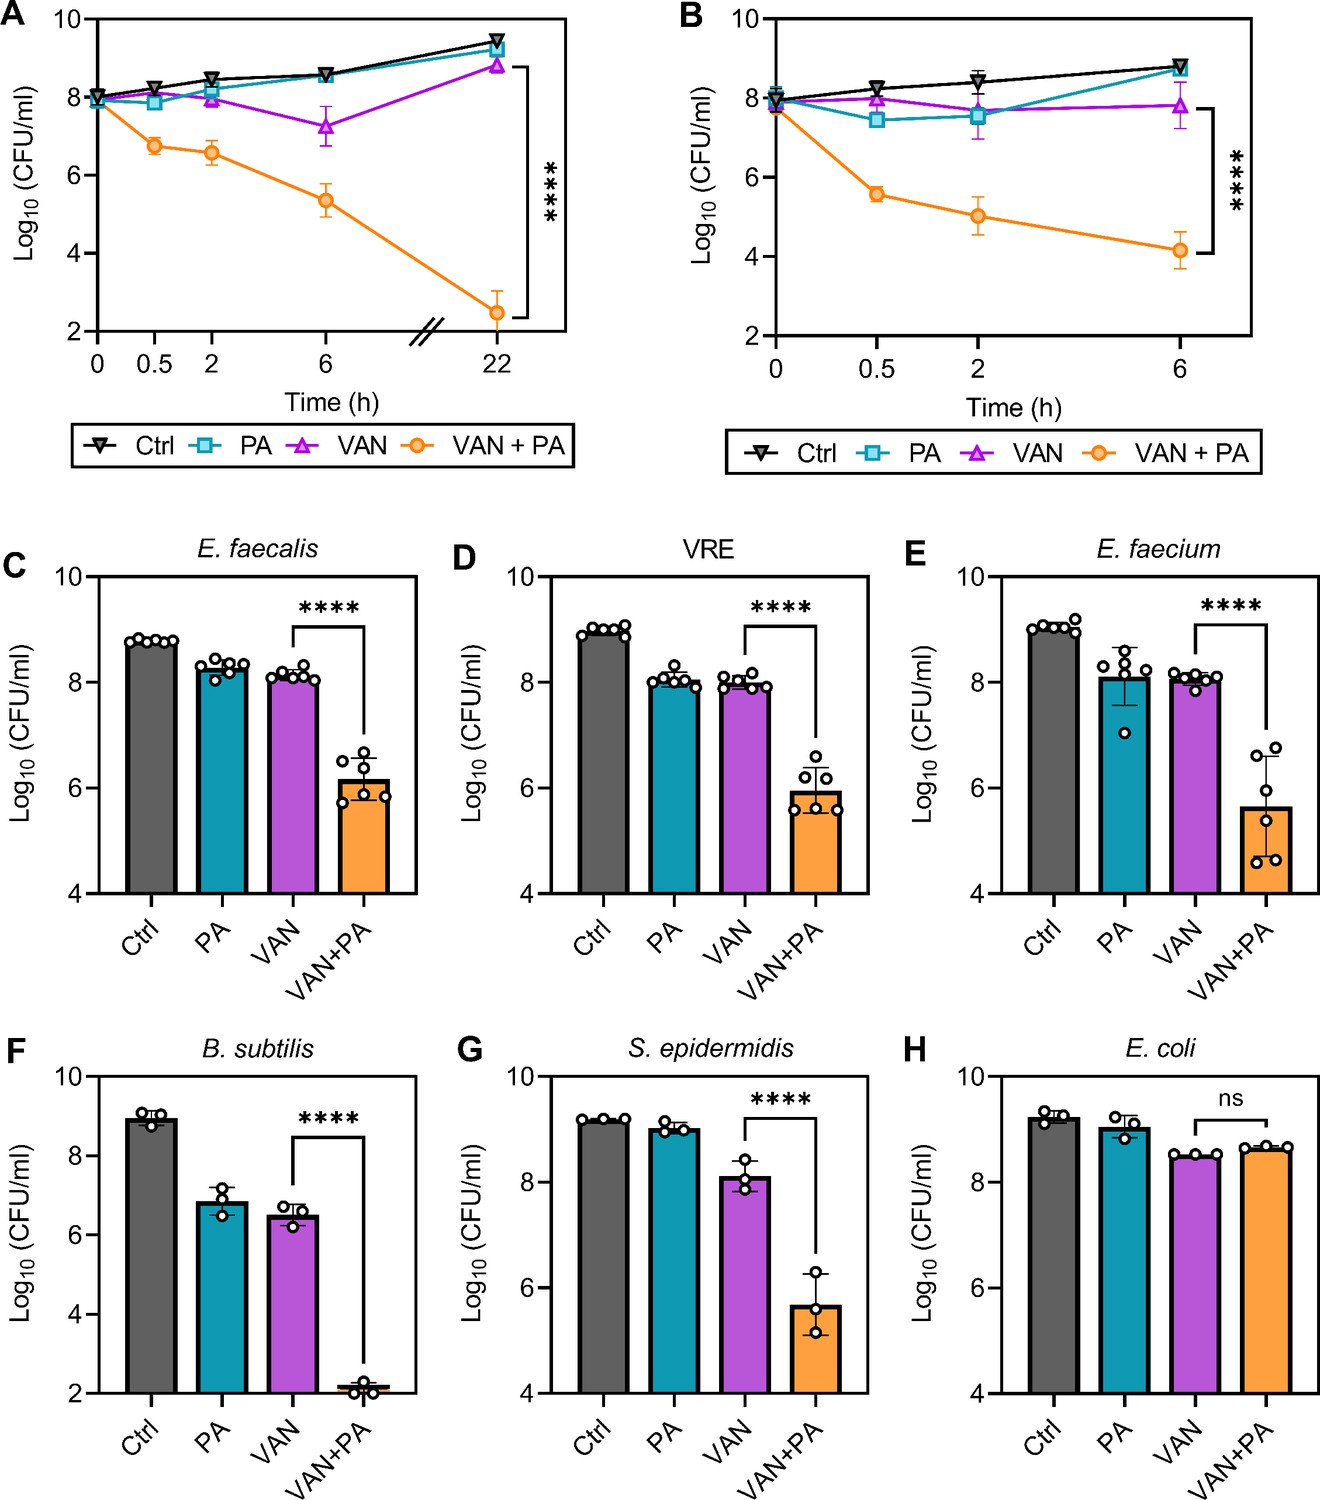
Palmitoleic acid re-sensitizes vancomycin resistant isolates.
(A) Vancomycin-intermediate S. aureus (VISA) strain SA770 (Kosowska-Shick et al., 2008) and (B) vancomycin-resistant S. aureus (VRSA) strain VRS2 (Kosowska-Shick et al., 2008) were grown to exponential phase prior challenge with DMSO (Ctrl), PA (11 μg/ml), VAN (20 μg/ml), or VAN + PA. At the indicated time points, an aliquot was removed and plated to enumerate survivors. PA potentiation of other Gram-positive bacteria was determined using (C) E. faecalis, (D) vancomycin-resistant E. faecalis (VRE), (E) E. faecium, (F) B. subtilis, (G) S. epidermidis, and Gram-negative bacterial species (H) E. coli. Strains were grown to exponential phase prior to challenge with concentrations of PA ± VAN indicated in Figure 8—source data 1. After 2 hr, an aliquot was removed and plated for colony forming unit (CFU) enumeration. Data represents n=6 or 3 biologically independent replicates with error bars as SD. Significance was evaluated using Student’s two-tailed unpaired t-test between VAN and VAN + PA conditions.
-
Figure 8—source data 1
Related to Figure 8A–H.
- https://cdn.elifesciences.org/articles/80246/elife-80246-fig8-data1-v2.xlsx
Tables
Key resources table
| Reagent type (species) or resource | Designation | Source or reference | Identifiers | Additional information |
|---|---|---|---|---|
| Strain and strain background (Staphylococcus aureus) | HG003; MSSA | doi:10.1128/IAI.00088-10 | BC1561 | |
| Strain and strain background (S. aureus) | LAC; CA-MRSA | doi:10.1073/pnas.0710217105 | BC1684 | |
| Strain and strain background (S. aureus) | JE2 wild-type | doi:10.1128/mBio.00537-12. | BC9 | |
| Strain and strain background (S. aureus) | JE2 floA::Tn | doi:10.1128/mBio.00537-12. | BC1758 | SAUSA300_1533; From NTML, strain NE184 |
| Strain and strain background (S. aureus) | JE2 crtM::Tn | doi:10.1128/mBio.00537-12. | BC440 | SAUSA300_2499; From NTML, strain NE1444 |
| Strain and strain background (S. aureus) | HG003 ezrA-gfp | doi:10.1038/nature25506 | BC1552 | ezrA-gfp was transduced from ColpSGEzrA-GFP into HG003 background for this work |
| Strain and strain background (S. aureus) | VISA | doi:10.1128/AAC.01073-08 | SA770; BC1477 | |
| Strain and strain background (S. aureus) | VRSA | doi:10.1128/AAC.01073-08 | VRS2; BC1479 | Vancomycin-resistant |
| Strain and strain background (Enterococcus faecalis) | VRE | doi:10.1128/iai.00425- 15 | V583; BC231 | Vancomycin-resistant |
| Strain and strain background (E. faecalis) | OG1 | ATCC | BC524 | ATCC 47077 |
| Strain and strain background (Enterococcus faecium) | Clinical isolate | doi:10.1038/s41564-021-00966-0 | BC1540 | |
| Strain and strain background (Bacillus subtilis) | BS49 | doi:10.1371/journal.pgen.1006701 | BC209 | |
| Strain and strain background (Escherichia coli) | MG1655 | ATCC | BC15 | ATCC 47076 |
| Strain and strain background (Staphylococcus epidermidis) | CSF41498 | doi:10.1128/jb.0194 6-14 | BC17 | |
| Chemical compound and drug | Rhamnolipids | AGAE Technologies | Cat#R90 | |
| Chemical compound and drug | Palmitoleic acid | Cayman Chemical | Cat. #10009871 | |
| Chemical compound and drug | Linoleic acid | Cayman Chemical | Cat. #90150 | |
| Chemical compound and drug | Glycerol monolaurate | Cayman Chemical | Cat.#28170 | |
| Chemical compound and drug | Lauric acid | Cayman Chemical | Cat.#10006626 | |
| Chemical compound and drug | Adarotene | Sigma-Aldrich | Cat.#SML2061 | |
| Chemical compound and drug | Benzyl alcohol | ThermoFisher | Cat.#A396500 | |
| Chemical compound and drug | Vancomycin | ThermoFisher | Cat.#AAJ6279003 | |
| Chemical compound and drug | Fosfomycin | Sigma-Aldrich | Cat.#P5396 | |
| Chemical compound and drug | Oxacillin | ThermoFisher | Cat.#AC45544005 | |
| Chemical compound and drug | Nafcillin | ThermoFisher | Cat.#AC46138001 | |
| Chemical compound and drug | Bacitracin | ThermoFisher | Cat.#BP29501 | |
| Chemical compound and drug | Tarocin A1 | Sigma-Aldrich | Cat.#SML1677 | |
| Chemical compound and drug | Daptomycin | MedChem Express | Cat.#HY-B0108 | |
| Chemical compound and drug | zaragozic acid | Sigma-Aldrich | Cat.#z2626 | |
| Chemical compound and drug | Oritavancin | Cayman Chemical | Cat.#24091 | |
| Chemical compound and drug | AsKO | Sigma-Aldrich | Cat.#A6756 | |
| Chemical compound and drug | CCCP | Cayman Chemical | Cat.#25458 | |
| Other | BODIPY-VAN | Invitrogen | Cat.#V34850 | Fluorescently labeled vancomycin, labeling cell wall, Figure 4 |
| Other | Nile red | Sigma-Aldrich | Cat.#72485 | Cell membrane dye, Figure 4 |
| Other | DiI-C12 | ThermoFisher | Cat.#D383 | RIF specific dye, Figure 4 |
| Other | HADA | ThermoFisher | Cat.#66475 | Dye that stains new cell wall, Figure 7 |
| Other | WGA-488 | ThermoFisher | Cat.#W11261 | Dye that stains mature cell wall, Figure 7 |
| Other | Sytox green | ThermoFisher | Cat.#S7020 | Cell viability dye, Figure 5 |
| Commercial assay or kit | BacTiter-Glo Microbial Viability Kit | Promega | Cat.#G8232 | |
| Software and algorithm | Graphpad Prism | Graphpad.com | Prism 9 | |
| Software and algorithm | Biorender | Biorender.com | ||
| Software and algorithm | Metamorph 7.10 | Molecular Devices | Acquisition software | |
| Software and algorithm | Autoquant | Media cybernetics | Version 3.1.3 | Deconvolution software |
| Software and algorithm | FIJI | ImageJ | v1.53q |
Additional files
Download links
A two-part list of links to download the article, or parts of the article, in various formats.
Downloads (link to download the article as PDF)
Open citations (links to open the citations from this article in various online reference manager services)
Cite this article (links to download the citations from this article in formats compatible with various reference manager tools)
Antibiotic-induced accumulation of lipid II synergizes with antimicrobial fatty acids to eradicate bacterial populations
eLife 12:e80246.
https://doi.org/10.7554/eLife.80246


