Adult-born granule cells improve stimulus encoding and discrimination in the dentate gyrus
- Instituto de Investigacion en Biomedicina de Buenos Aires (IBioBA) – CONICET/Partner Institute of the Max Planck Society, Polo Cientifico Tecnologico, Argentina
- Departamento de Fisica, FCEyN UBA, Ciudad Universitaria, Argentina
- Max Planck Institute for Molecular Physiology, Department of Systemic Cell Biology, Germany
Figures
Figure 1 with 2 supplements
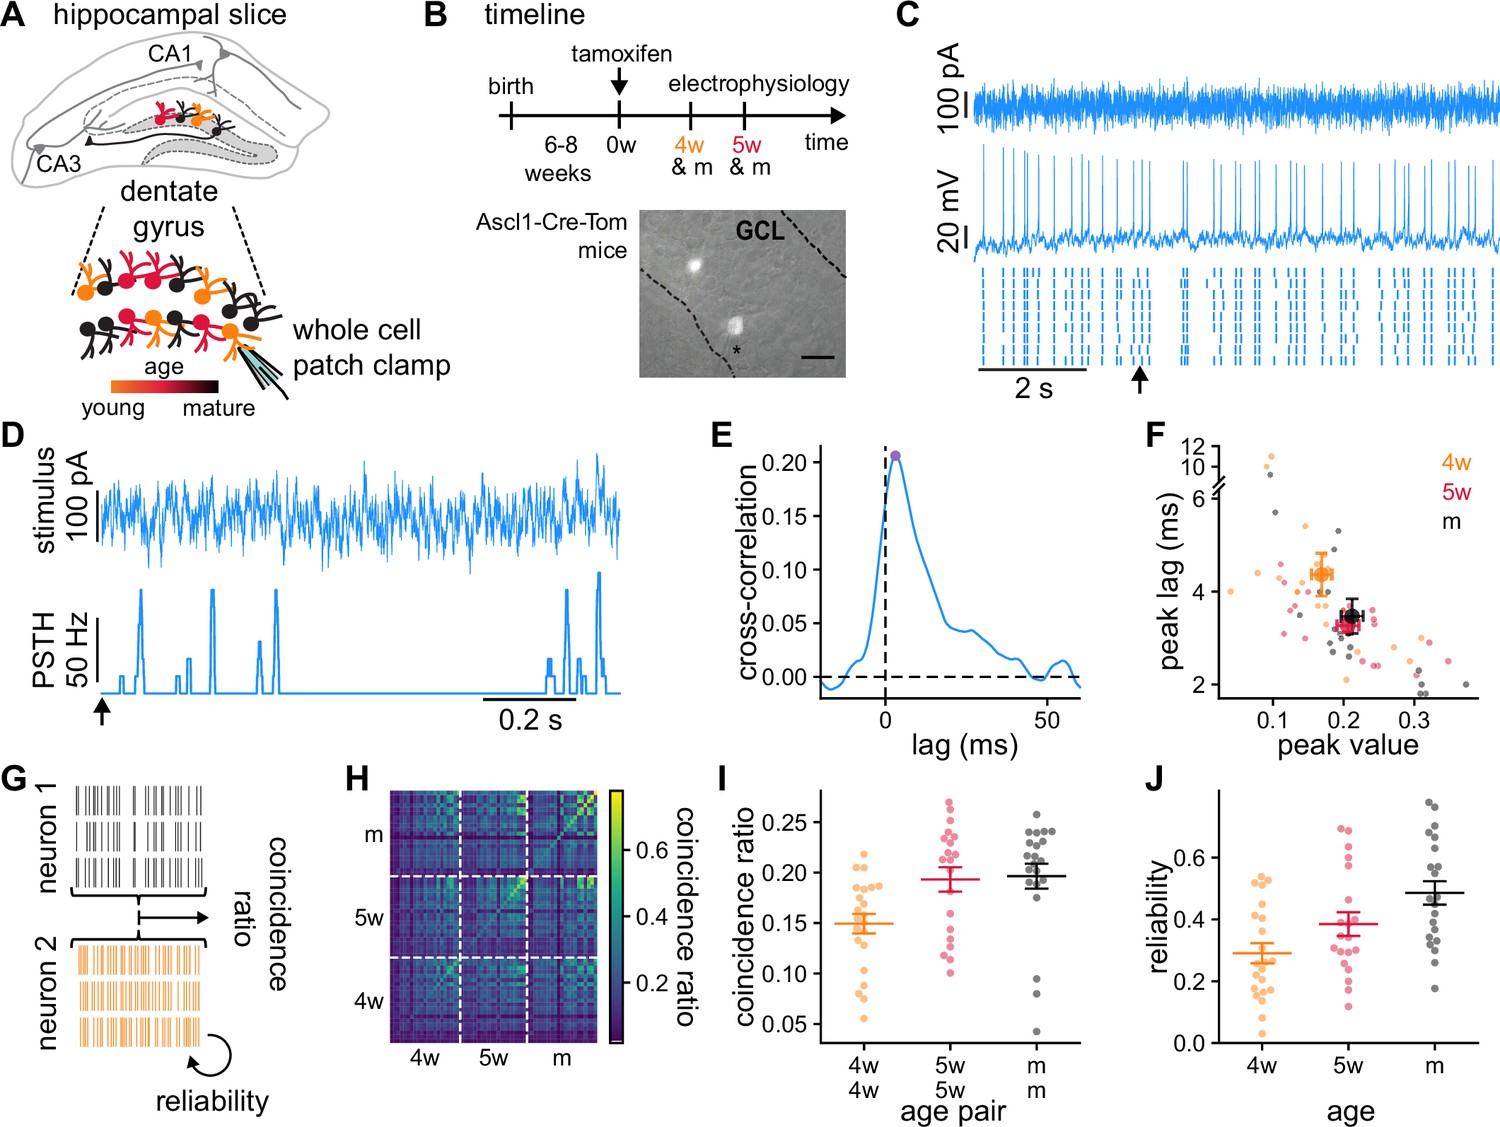
Granule cells (GCs) recordings and analysis of the temporal structure of the responses to the same stimulus.
(A) Schematics of the experimental setup showing a hippocampal slice with the dentate gyrus highlighted in gray, and a blow-up of the dentate gyrus GCs. Colors indicate GCs’ age: 4-week-old GCs (4wGCs) (orange), 5-week-old GCs (5wGCs) (red), and mature GCs (mGCs) (black). (B) Top: Experimental timeline. Tamoxifen is injected 6–8 weeks after mouse birth and slices are obtained 4 and 5 weeks after injection. Bottom: Hippocampal slice showing labeled immature GCs (bright spots) in the granule cell layer (GCL). Asterisk marks the electrode. Scale bar: 20 μm. (C) Recording of a mGC. Top: Fluctuating current stimulation. Middle: Recorded membrane potential from a single trial. Bottom: Spike raster plot showing nine trials obtained with the same stimulus. Arrow marks the starting time for panel (D). (D) Stimulus (top) and resulting peri-stimulus time histogram (PSTH) (bottom) from (C). (E) Cross-correlation between the stimulus and the PSTH of the mGC in (C, D). Cross-correlation peak (dot) is characterized by its peak value and lag. (F) Cross-correlation lag and peak value for all GCs recorded (small dots) and age group averages (large dots). Bars indicate mean ± 1 s.e.m. Spearman’s correlation: , between age and lag and , between age and peak value. (G) The average fraction of coincident spikes defines (i) a reliability between different trials from a single GC and (ii) a coincidence ratio between all trials from different GCs. (H) Coincidence ratio matrix for all pairs of GCs. The diagonal is the reliability. (I) Average coincidence ratio between each GC and all other GCs of the same age (dots). Spearman’s correlation with age of the pair: , . (J) Reliability of individual GCs (dots). Spearman’s correlation with age: , . In (I, J) bars indicate mean ± 1 s.e.m. for each age group.
Figure 1—figure supplement 1
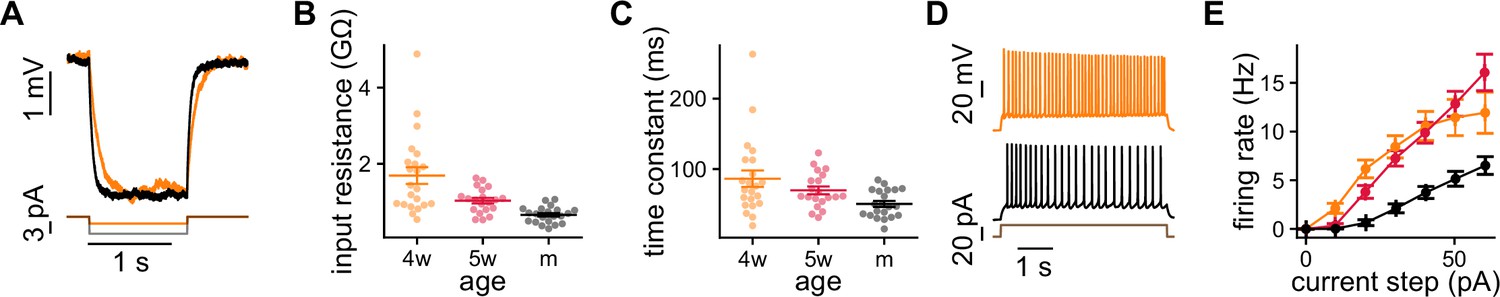
Intrinsic properties of granule cells (GCs) measured with current steps.
(A) Negative step in a 4-week-old GC (4wGC) (orange) and a mature GC (mGC) (black). (B, C) Passive properties obtained with negative steps. Spearman’s correlation between age and input resistance: , ; Spearman’s correlation between age and time constant: , . (D) Positive step in a 4wGC (orange) and an mGC (black). (E) Firing rate vs. amplitude of the step for the different age groups.
Figure 1—figure supplement 2

Adjusting the baseline and amplitude of the stimulus to granule cells (GCs) of different ages while keeping the same time structure.
(A) Immature GCs have larger input resistances, hence they need smaller currents to produce similar firing rates. (B) Resulting firing rates for the recorded GCs. There was no significant difference between the groups. Kruskal-Wallis H test: . (C) Average coincidence ratio between each GC and all other GCs of different age (dots). Mann-Whitney U test 4w-5w vs. 4w-m , 4w-5w vs. 5w-m , 4w-m vs. 5w-m . (D) Reliabilities obtained after shuffling the spike times. Spearman’s correlation between reliability and age was reduced in the shuffled data (). was calculated by boostrapping GCs of all ages, computing Spearman’s correlation with age of the reliability and the shuffled reliability and taking the fraction of realizations in which the correlations were larger in the shuffled data.
Figure 2 with 2 supplements
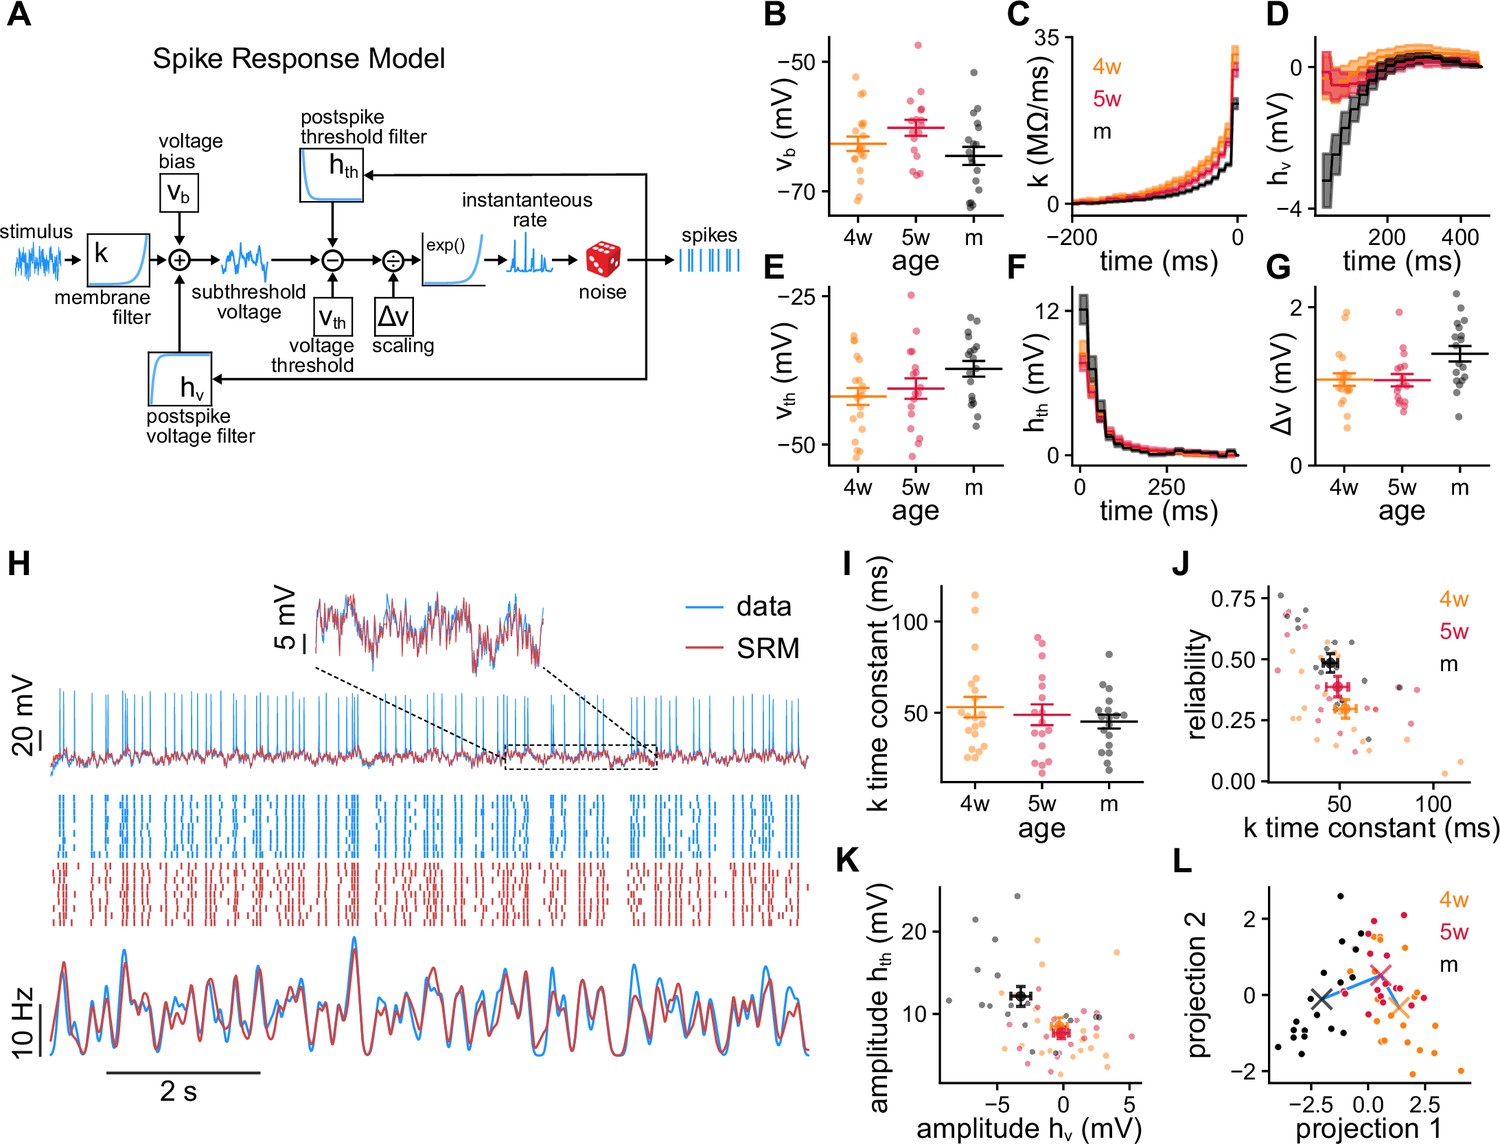
Spike response model (SRM) fits to recorded granule cells (GCs).
(A) Schematics of the SRM. Free model parameters are highlighted within boxes. (B–G) SRM parameters obtained for all GCs of different ages: (B) voltage bias vb, (C) membrane filter , (D) postspike membrane potential deflection , (E) static voltage threshold , (F) postspike threshold deflection , and (G) voltage scaling factor . (H) Validation data (blue) and SRM prediction (red). Top: Subthreshold membrane potential. Middle: Spike raster plots of the recorded responses and SRM simulations. Bottom: Peri-stimulus time histogram (PSTHs) of the spike trains. (I) Time constants extracted from the tail of filter . Spearman’s correlation between age and population time constant (bootstrapped): , . (J) GC reliability vs. time constant of the filter . Spearman’s correlation: , . (K) Amplitudes of the filters and . Spearman’s correlation: , between age and , and , between age and . (L) GCs’ parameters projected on the linear discriminant analysis components subspace. The crosses represent the means of the age groups, connected by a blue line. In (B, E, G, I–L) small dots represent single neurons. In (B, E, G, I) long bars indicate means and short bars means ± 1 s.e.m. In (J, K) large dots and bars indicate means ± 1 s.e.m. In (C, D, F), lines with shaded areas indicate means ± 1 s.e.m.
Figure 2—figure supplement 1
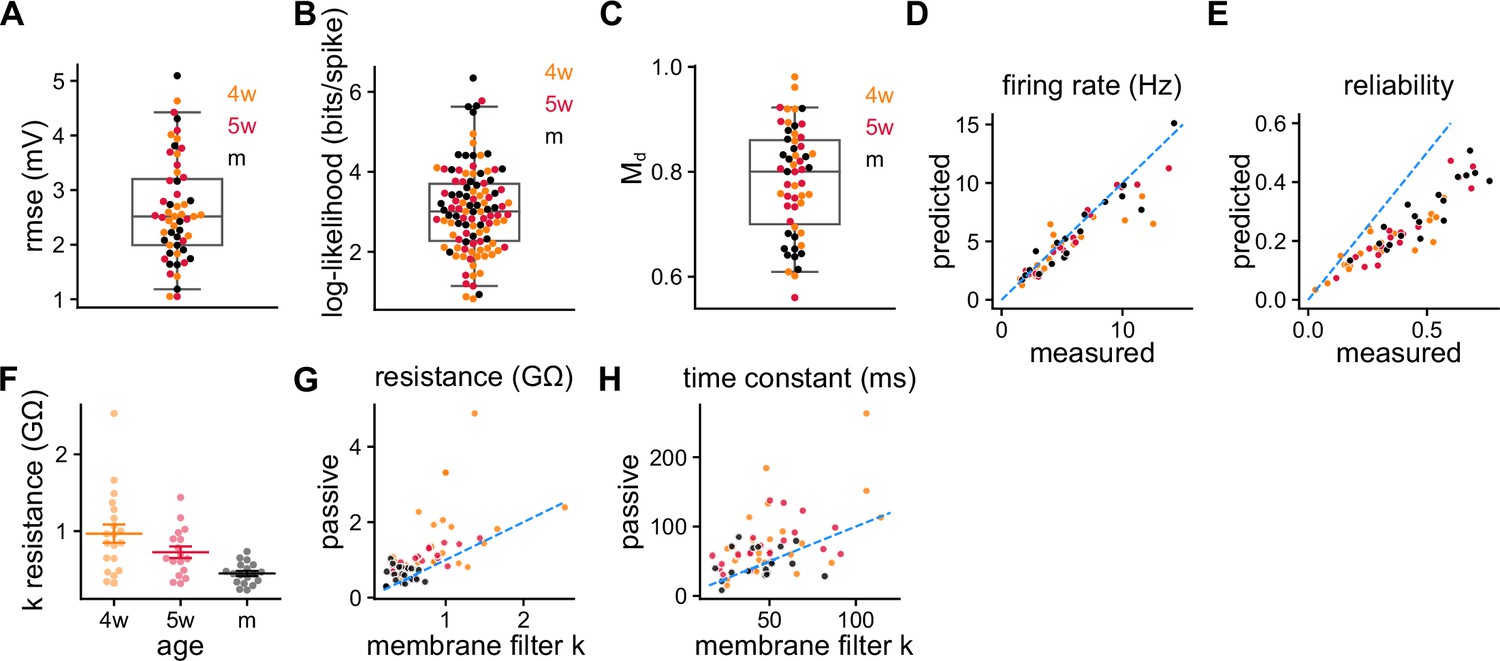
SRM fitting validations.
(A) Root mean squared error of the subthreshold membrane potential prediction using the validation data. (B) Log-likelihood per spike relative to the likelihood of a Poisson process of the same rate measured on the validation data. (C) between recorded validation data and model-generated spike trains. (D) Firing rate and (E) reliability recorded and obtained by generating spike trains with the spike response model (SRM). Pearson’s correlation between predicted and measured reliability: , . (F) Electrical resistance obtained from the membrane filter (Figure 2C). Spearman’s correlation between age and resistance: , . (G) Passive resistance and (H) time constant vs. the ones obtained from the membrane filter . Wilcoxon signed-rank test between passive and resistance: ; Spearman’s correlation between age and resistance after subtracting age groups: , . Wilcoxon signed-rank test between passive and time constant: .
Figure 2—figure supplement 2
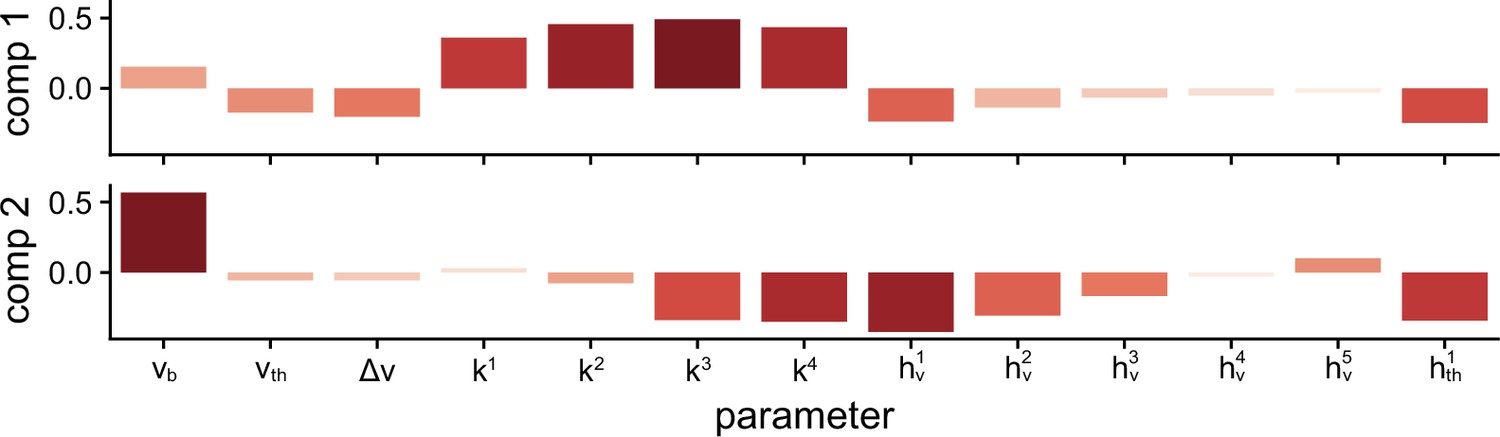
Linear discriminant analysis components as determined by the scalings of each parameter used.
Figure 3 with 3 supplements
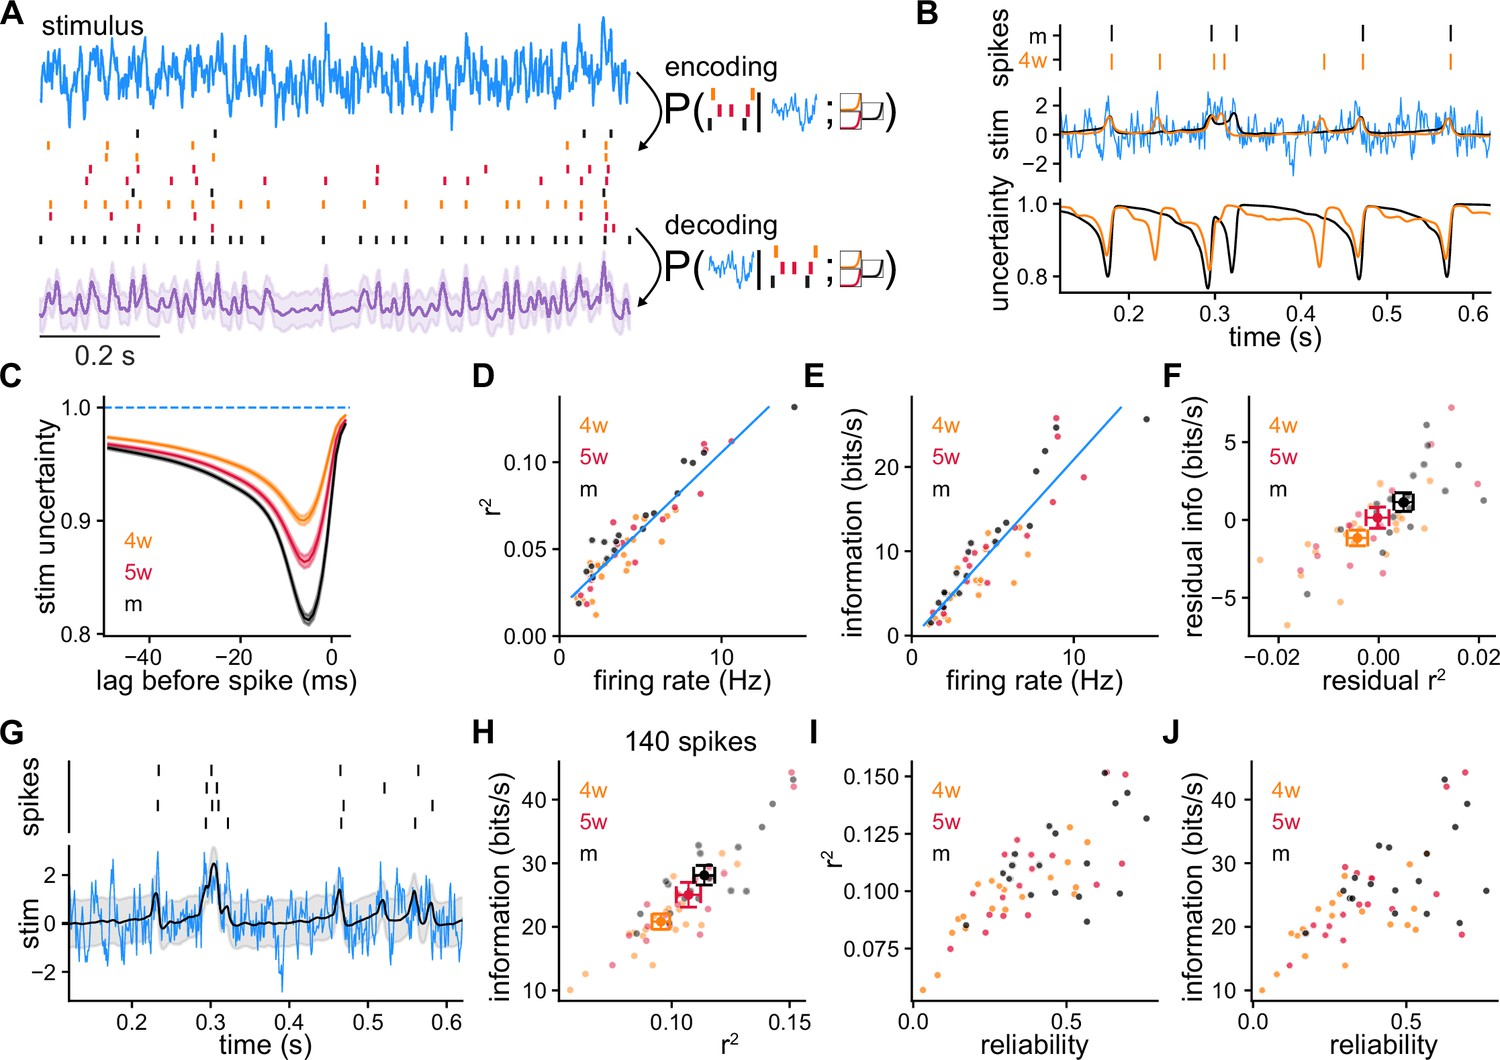
Model-based Bayesian decoding of the stimulus using recordings of single granule cells (GCs) and simulated GCs (SGCs).
(A) Model-based Bayesian decoding scheme, illustrating how CGs or SGCs encode a stimulus in spike trains that can be used to estimate the stimulus that produced them. (B) Spike trains from recorded GCs (top) used separately to obtain two stimulus estimations (middle) and their respective uncertainties (bottom) about the stimulus. Mature GC (mGC) decoding in black (), 4-week-old GC (4wGC) decoding in orange (), true stimulus in blue. (C) Average uncertainty about the stimulus before a spike at lag 0, for recorded GCs. Spearman’s correlation between minimum uncertainty and age: , . (D) Coefficient of determination obtained by decoding with individual spike trains vs. firing rate, from SGCs. Pearson’s correlation: , . The blue line is the linear fit using all SGCs. (E) Estimated mutual information between the stimulus and SGCs’ responses vs. firing rate. Pearson’s correlation: , . The blue line is the linear fit using all SGCs. (F) Residual information vs. residual after subtracting the linear relationships of (D, E). Spearman’s correlation between age and residual , ; Spearman’s correlation between age and residual information: , . (G) Decoding example using spike trains from a single SGC produced by multiple trials of the same stimulus (). (H) Information vs. obtained by decoding with 140 spikes on average using a different number of trials for each SGC to compensate for firing rate differences. Spearman’s correlation between age and , ; Spearman’s correlation between age and information: , . (I) from (H) vs. SGC reliability. Spearman’s correlation: , . (J) Information from (H) vs. SGC reliability. Spearman’s correlation: , .
Figure 3—figure supplement 1

Decoding the experimentally used stimulus from the recorded spike trains.
(A) and (B) conditional entropy from Figure 3D and E vs. the and reduction in uncertainty obtained by decoding the experimentally used stimulus from the recorded spike trains.
Figure 3—figure supplement 2
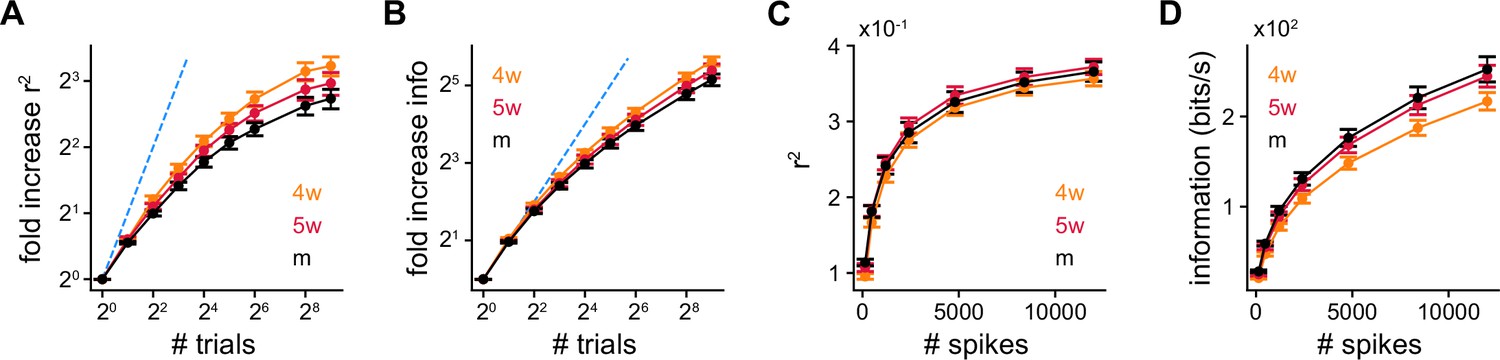
Decoding performance with increasing number of trials.
Fold increase in (A) and (B) information with number of trials from single simulated granule cells (SGCs). Spearman’s correlation between age and at 26 trials: , ; Spearman’s correlation between age and information at 26 trials: , . (C) and (D) information using multiple trials from single SGCs while using on average the same number of spikes from each one of them. Kruskal-Wallis H test between age and for all number of spikes: ; Spearman’s correlation between age and information at 140 spikes: , ; Spearman’s correlation between age and information at 12,000 spikes: , .
Figure 3—figure supplement 3
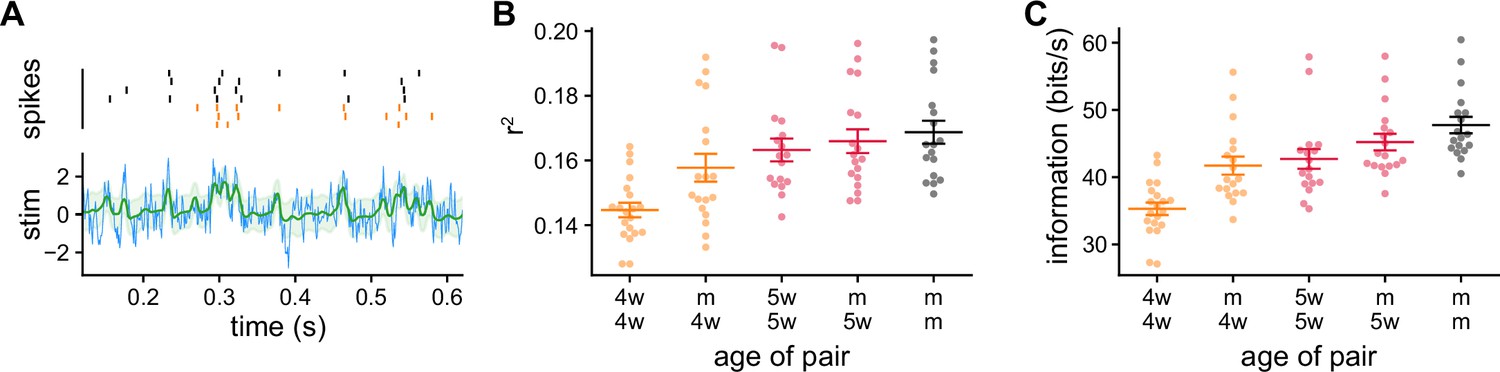
Decoding with pairs of SGCs of different age groups.
(A) Decoding example using approximately 140 spikes from a g5-week-old granule cell (5wGC) and a mature GC (mGC) to get a single stimulus reconstruction. (B) obtained by using pairs of simulated granule cells (SGCs) to decode. Spearman’s correlation between same age pair and , ; Spearman’s correlation for pairs with a mature SGC between age of the second SGC and , . (C) Information obtained by using pairs of SGCs to decode. Spearman’s correlation between same age pair and information: , ; Spearman’s correlation for pairs with a mature SGC between age of the second SGC and information: , .
Figure 4 with 3 supplements
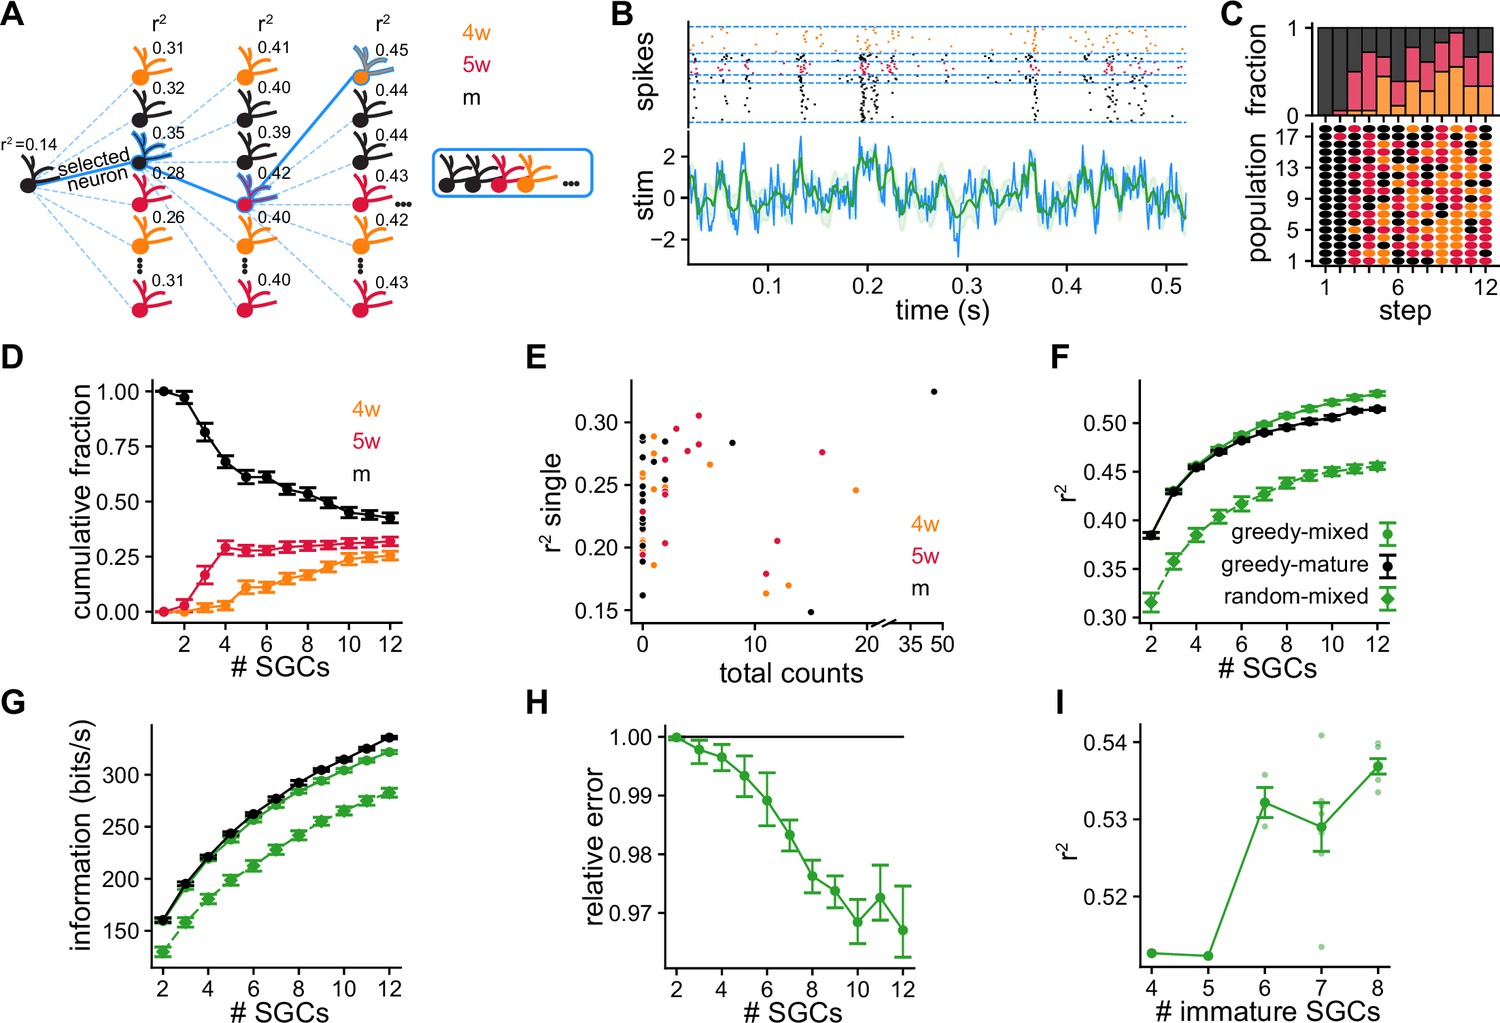
Greedy procedure used to build populations of simulated granule cells (SGCs) optimized for stimulus reconstruction.
(A) Greedy procedure diagram: at each step, the SGC that optimizes stimulus reconstruction measured by average is chosen. (B) Decoding example using a population of five SGCs of different ages. Top: Raster plot showing the spike timings of each SGC separated by blue dashed lines. Each SGC contributes a different number of trials to equalize the total number of spikes. Bottom: The original stimulus (blue line) is shown together with the reconstructed stimulus (green line) and its uncertainty (shaded green) (). (C) Bottom: Selected SGCs at each step. Rows are populations of SGCs selected with the greedy procedure. Dot color represents SGCs’ ages. Top: Age fractions of selected SGCs at each step. (D) Average cumulative fraction for each age for increasing number of SGCs in the populations. Error bars indicate ±1 s.e.m. (E) Average value achieved by single SGCs vs. total number of times the SGC was selected. (F, G) Average over populations of (F) and (G) mutual information for increasing number of SGCs in the populations. Error bars indicate ±1 s.e.m. (H) Reconstruction mean squared error of greedy mixed-age populations relative to greedy mature populations computed by bootstrapping populations from both groups. Error bars indicate symmetric 95% c.i. (I) Average vs. number the of immature SGCs for populations of 12 SGCs. Spearman’s correlation: , . Darker dots indicate averages and error bars indicate ±1 s.e.m.
Figure 4—figure supplement 1

Statistics of SGC selection.
(A) Total number of times each simulated granule cell (SGC) was selected by the greedy procedure after 12 steps. SGC index was sorted according to counts. (B) Average value achieved by each SGC when paired with every other possible SGC vs. total number of times the SGC was selected. Each SGC in the pair used approximately 1200 spikes.
Figure 4—figure supplement 2
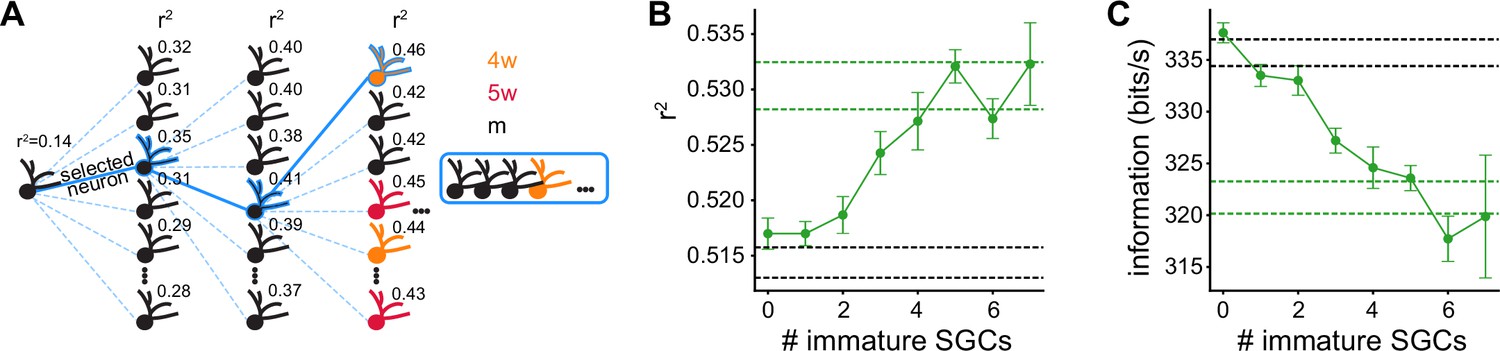
Greedy procedure with restricted mSGC selection in the first steps.
(A) Greedy procedure diagram restricting the selection to mature simulated granule cells (mSGCs) in the first steps: at each step, the SGC that optimizes stimulus reconstruction measured by average is chosen. Over the first steps we only allow mSGCs to be selected, and after steps we select SGCs from the whole pool of mSGCs and immature SGCs. (B) and (C) information vs. number of immature SGCs in each population. The populations were built restricting the first 11, 10, 9, 8, 7, 6, 5, and 4 steps of the greedy procedure, to select mSGCs. Solid lines indicate averages and error bars indicate ±1 s.e.m. Dashed green lines indicate the performance obtained with 12 SGCs’ populations built without restrictions. Dashed black lines indicate the performance obtained with 12 SGCs’ populations built with exclusively mSGCs.
Figure 4—figure supplement 3

Decoding stimuli with underlying theta oscillations.
(A) Validation data (blue) generated using a stimulus exhibiting a theta rhythm together with its spike response model (SRM) prediction (red). Top: Stimulus with theta rhythm. Middle: Spike raster plots of the recorded responses and SRM simulations. Bottom: Peri-stimulus time histograms (PSTHs) of the spike trains. (B) Quantitative evaluation of the prediction of the SRM for theta rhythm data. Left: Root mean squared error (rmse) of the subthreshold membrane potential prediction. Middle: Log-likelihood per spike relative to the likelihood of a Poisson process of the same rate. Right: Md between recorded validation data and model-generated spike trains. (C) Coefficient of determination vs. firing rate, from theta rhythm stimulus decoding with individual spike trains from simulated granule cells (SGCs). Spearman’s correlation: , . Blue line is a logarithmic fit using all SGCs. (D) Estimated mutual information between the stimulus and SGCs’ responses vs. firing rate. Spearman’s correlation: , . Blue line is a logarithmic fit using all SGCs. (E) Residual information vs. residual after subtracting the logarithmic relationships of (C) and (D). Spearman’s correlation between age and residual , ; Spearman’s correlation between age and residual information: ,. (F) obtained by decoding stimuli with theta rhythm using the final 12 SGCs’ populations of Figure 4 obtained with the greedy procedure. Mann-Whitney U test p=2.7×10⁻⁴. Small dots represent the populations. Long bars indicate means and short bars means ± 1 s.e.m. (G) Information obtained by decoding stimuli with theta rhythm using the final 12 SGCs’ populations of Figure 4 obtained with the greedy procedure. Mann-Whitney U test p=2.7×10⁻⁷. Small dots represent the populations. Long bars indicate means and short bars means ± 1 s.e.m.
Figure 5
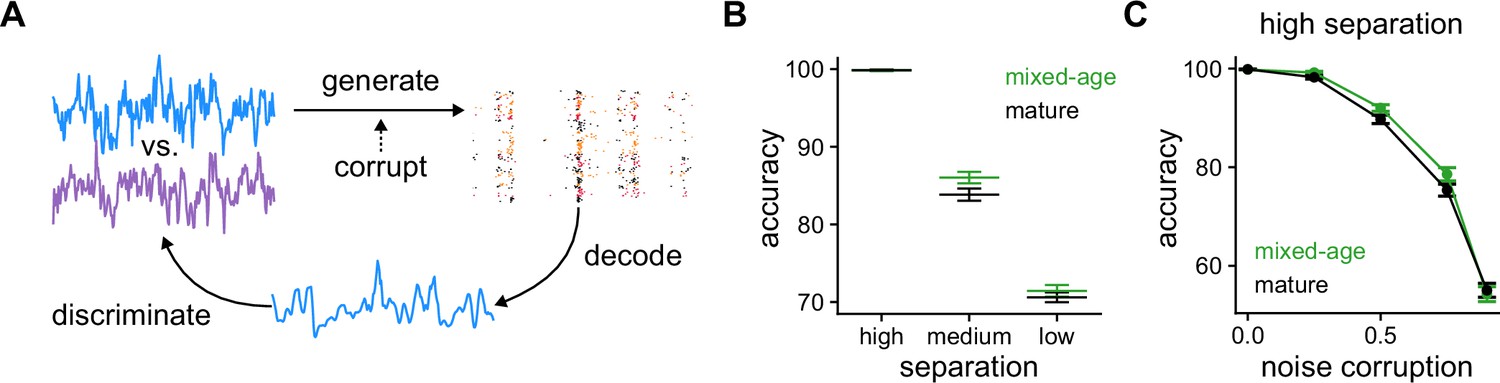
Pattern discrimination between pairs of fluctuating stimuli.
(A) Diagram of the pattern discrimination procedure. (B) Discrimination accuracy achieved by mixed and exclusively mature populations for different degrees of separation between the two stimuli. Mann-Whitney U test high separation: , medium: , and low: . (C) Discrimination accuracy vs. level of noise corruption in the stimuli for high degree of separation. Mann-Whitney U test 0.25: noise , 0.5: , 0.75: , and 0.9: .
Additional files
Download links
A two-part list of links to download the article, or parts of the article, in various formats.
Downloads (link to download the article as PDF)
Open citations (links to open the citations from this article in various online reference manager services)
Cite this article (links to download the citations from this article in formats compatible with various reference manager tools)
Adult-born granule cells improve stimulus encoding and discrimination in the dentate gyrus
eLife 12:e80250.
https://doi.org/10.7554/eLife.80250


