Robust cone-mediated signaling persists late into rod photoreceptor degeneration
- Department of Neurobiology, Duke University School of Medicine, United States
- Department of Statistical Science, Duke University, United States
- Jules Stein Eye Institute, University of California, Los Angeles, United States
- Zilkha Neurogenetics Institute, Keck School of Medicine, University of Southern California, United States
Figures
Figure 1 with 1 supplement

Cone morphology and density change with rod degeneration.
(A) Estimated fraction of surviving rods (black) and cones (cyan) relative to wild-type (WT) densities from 1 to 7 months of age in Cngb1neo/neo mice. (B) Immunofluorescence of retinal cross sections in WT and Cngb1neo/neo mice (1–7 months). Cones (mCar) in cyan, bipolar cells (PCP2) in red, and nuclei (DAPI) in blue. (C) one morphologies imaged with cone arrestin (mCar) labeling from WT and Cngb1neo/neo retinas. (D) whole-mount view of cone density and morphology in WT and Cngb1neo/neo retinas. Scale bars: 50 µm. ONL: outer nuclear layer; INL: inner nuclear layer; OS: outer segments. Source files for (A) are available in Figure 1—source data 1.
-
Figure 1—source data 1
Contains quantifications of rod and cone densities for Figure 1A.
- https://cdn.elifesciences.org/articles/80271/elife-80271-fig1-data1-v3.xlsx
Figure 1—figure supplement 1

Nine-month Cngb1neo/neo exhibit little-to-no immunolabeling for M-opsin.
(A) Immunofluorescence of retinal cross section from 9-month Cngb1neo/neo mouse: cone arrestin labeling (mCar) in cyan; nuclei (DAPI) in white. (B) Whole-mount view of cone density and morphology in 9-month Cngb1neo/neo mouse. (C) Immunofluorescence of retinal cross section from wild-type (WT) mouse: M-opsin in green and nuclei (DAPI) in white. (D) M-opsin immunofluorescence from 9-month Cngb1neo/neo retina. Scale bars: 50 µm. Source files are available in Figure 1—source data 1.
Figure 2 with 1 supplement
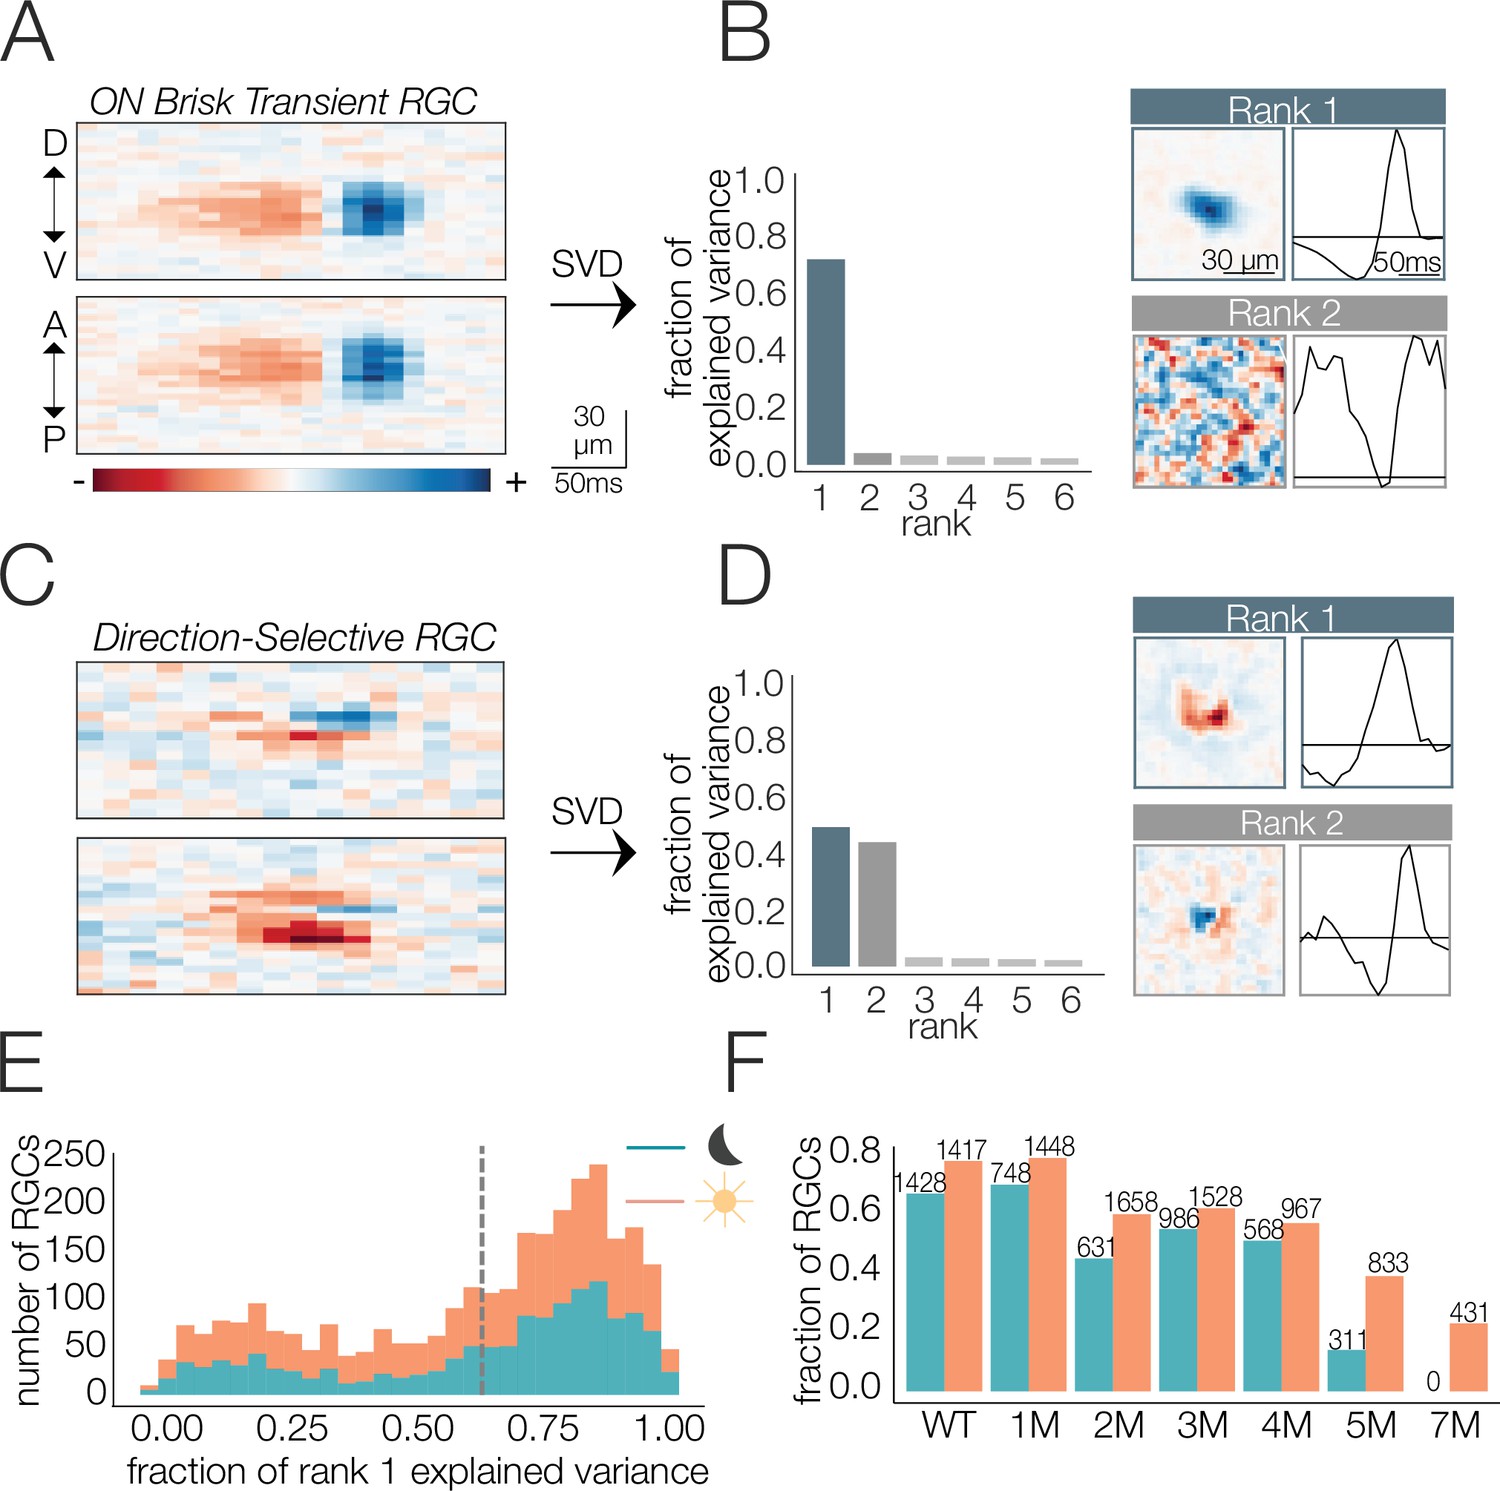
Identifying spatial and temporal receptive field (RF) components.
(A) Example retinal ganglion cell (RGC) spike-triggered average stimulus (STA) that is space-time-separable. Top and bottom are space-time plots along orthogonal spatial dimensions: D, V, A, and P indicate dorsal, ventral, anterior, and posterior directions. (B) Singular value decomposition (SVD) of STA in (A); (left) distribution of variance explained by first six space-time vector pairs; (top right: rank 1) spatial (left) and temporal (right) filters from the rank 1 decomposition; (bottom right; rank 2) spatial and temporal filters associated with the second singular value. (C) Example RGC STA that was not space-time-separable. (D) SVD of STA in (C); (left) distribution of variance explained by first six space-time vector pairs; (top right; rank 1) spatial and temporal filters from the rank 1 decomposition; (bottom right; rank 2) spatial and temporal filters associated with the second singular value. (E) Distribution of variance explained by the rank 1 decomposition for all wild-type (WT) RGCs (1654 cells from five mice) under mesopic (teal) and photopic (orange) conditions. Vertical line shows threshold for classifying cells as space-time-separable. (F) Fraction and quantity of RGCs measured at mesopic (teal) and photopic (orange) light levels that were classified as exhibiting space-time-separable RFs. Source files for (E) and (F) are available in Figure 2—source data 1.
-
Figure 2—source data 1
Contains counts of RGCs with space-time separable RFs.
- https://cdn.elifesciences.org/articles/80271/elife-80271-fig2-data1-v3.csv
Figure 2—figure supplement 1
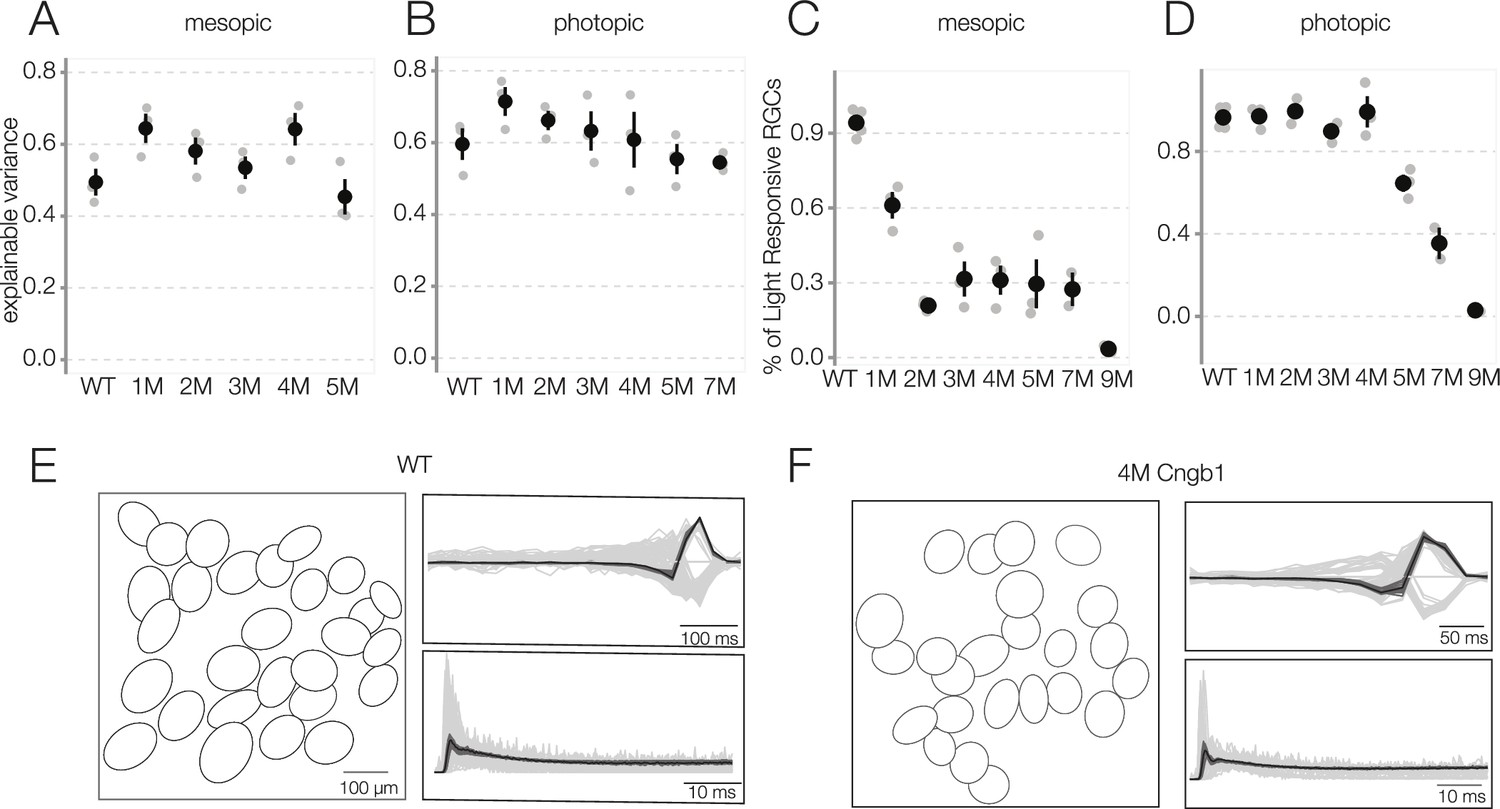
Linear–nonlinear (LN) model performance and fraction of light-responsive retinal ganglion cells (RGCs) as a function of rod death.
(A, B) LN model performance quantified by fraction of explainable variance among RGCs with space-time-separable receptive fields (RFs) at mesopic (A) and photopic light (B) levels across conditions: wild-type (WT) and Cngb1neo/neo retinas. (C, D) Percentage of light-responsive RGCs at mesopic and photopic light levels across conditions. Each gray point represents mean from one retina, black points are mean and SE across retinas. (E) Spatial RFs (left), temporal RFs (top right), and spike train autocorrelation functions (bottom right) of ON brisk-sustained RGCs in WT retina. Spatial RFs are summarized as a contour of a two-dimensional Gaussian fit plotted at 1 standard deviation. For temporal RFs and autocorrelation functions, each black line corresponds to one ON brisk-sustained RGC, gray lines are for all other RGCs with space-time-separable RFs. ON brisk-sustained RGCs have distinctive and tightly clustered temporal RFs and spike train autocorrelation functions. (F) Same as (E), but for a 4-month Cngb1neo/neo retina. Source files are available in Figure 2—source data 1.
Figure 3 with 1 supplement
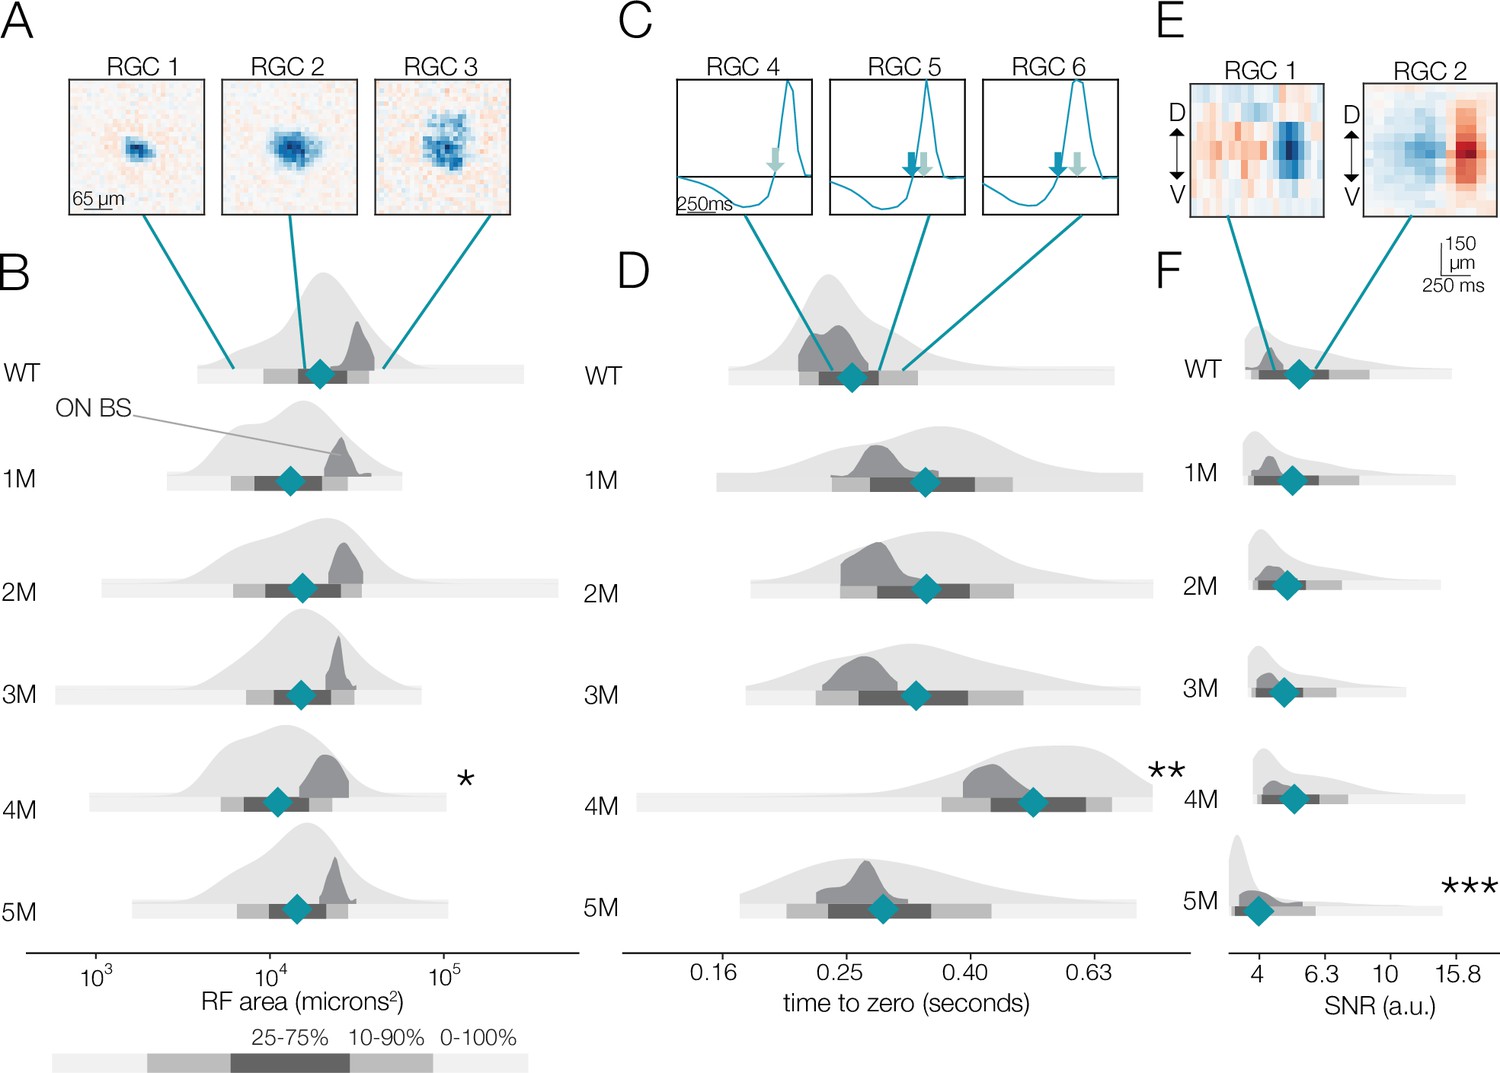
Changes in receptive field (RF) structure under mesopic conditions induced by rod death.
(A) Example spatial RFs at mesopic light levels showing smaller to larger RFs (left to right). (B) Distributions of spatial RF center areas comparing wild-type (WT) and Cngb1neo/neo mice from 1 to 5 months of degeneration for all retinal ganglion cells (RGCs) with space-time-separable RFs (light gray) and ON brisk-sustained RGCs (dark gray). Blue diamonds indicate the mean of each light gray distribution. (C) Example temporal RFs showing briefer to longer integration. Light blue arrows indicate the time to zero for RGC 4; dark blue arrows show time to zero for RGCs 5 and 6. (D) Same as (B) but showing distributions of the temporal RF times-to-peak. (E) Example spike-triggered average stimulus (STAs) with lower (left) and higher (right) signal-to-noise ratios (SNRs). (F) Same as (B) but showing distribution of STA SNRs. Grayscale legend indicates percentile ranges of distributions in (B), (D), and (F) for comparing dispersion across distributions. Stars indicate significant changes in the mean from WT for population data (light gray distributions): *, **, and *** are p<0.1, 0.01, and 0.001, respectively. Source files for (B), (D), and (F) are available in Figure 3—source data 1.
-
Figure 3—source data 1
Contains values for distributions shown in panels B, D, and F.
- https://cdn.elifesciences.org/articles/80271/elife-80271-fig3-data1-v3.csv
Figure 3—figure supplement 1
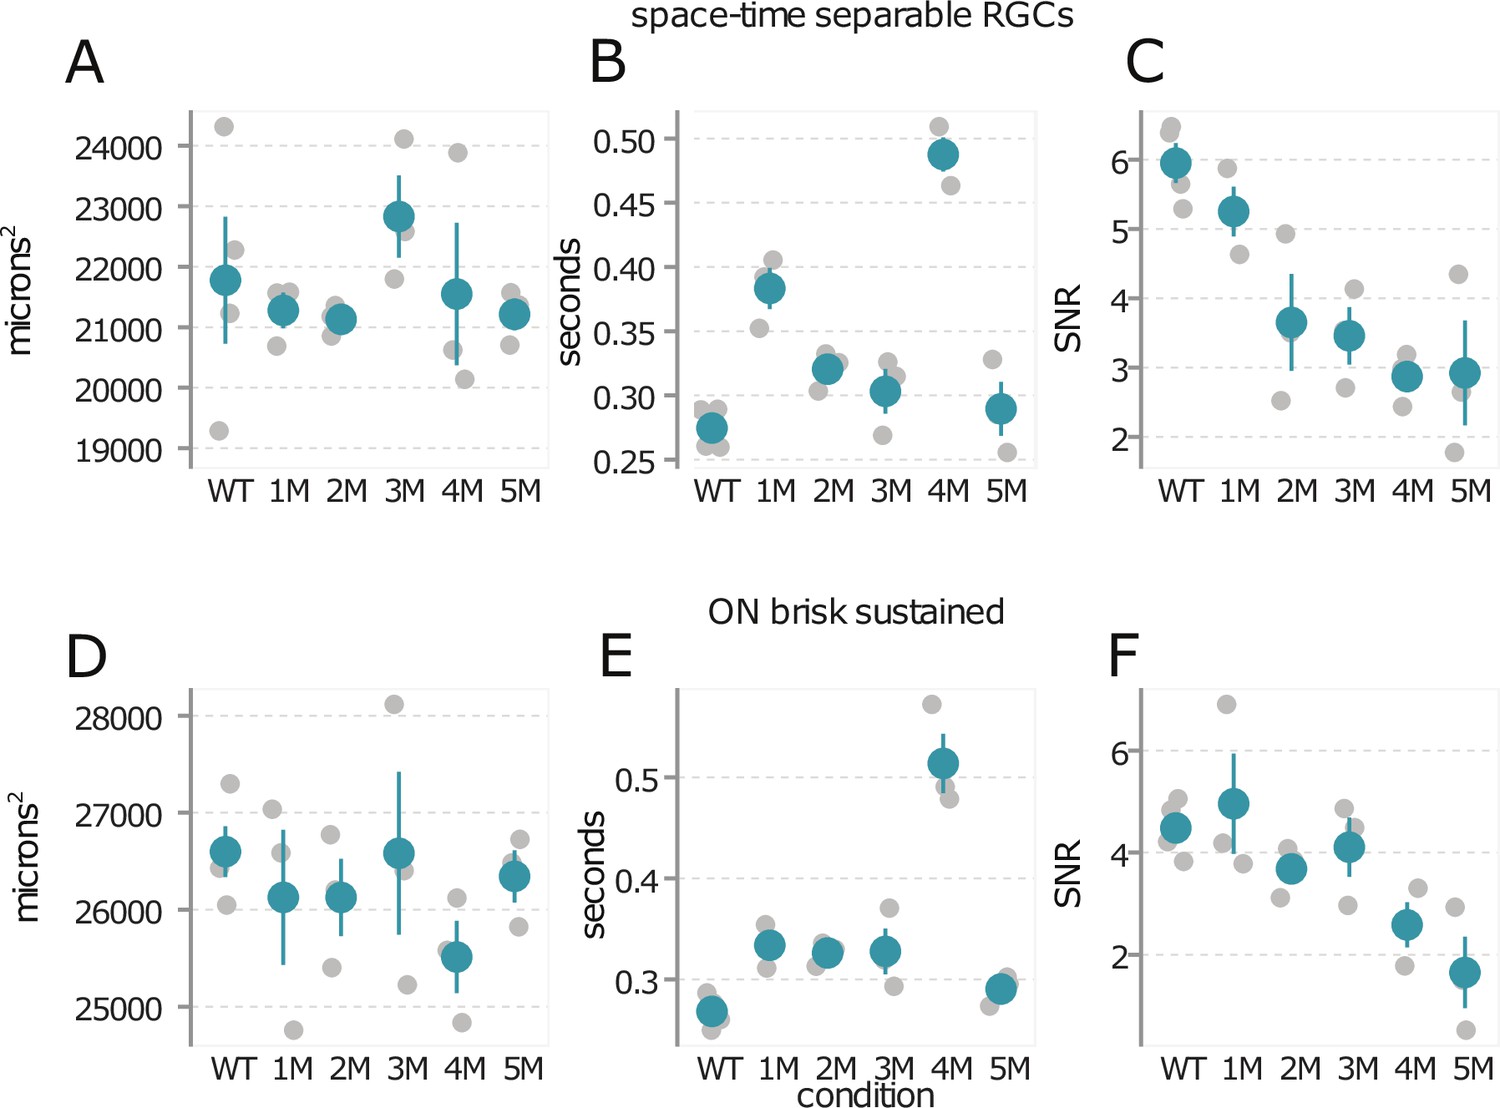
Trends in mesopic receptive field (RF) structure during rod death are consistent across experiments.
(A) Mean mesopic spatial RF areas for all space-time-separable retinal ganglion cell (RGC) for wild-type (WT) and across degeneration: each gray point is one retina, color points are mean across retinas, error bars are 2× SE. (B) Mean time to zero of mesopic temporal RFs. (C) Mean signal-to-noise ratio (SNR) in spatiotemporal spike-triggered average stimulus (STA) at the mesopic light level. (D–F) Same as (A–C), but with the analyses restricted to ON brisk-sustained RGCs. Source files are available in Figure 3—source data 1.
Figure 4 with 1 supplement
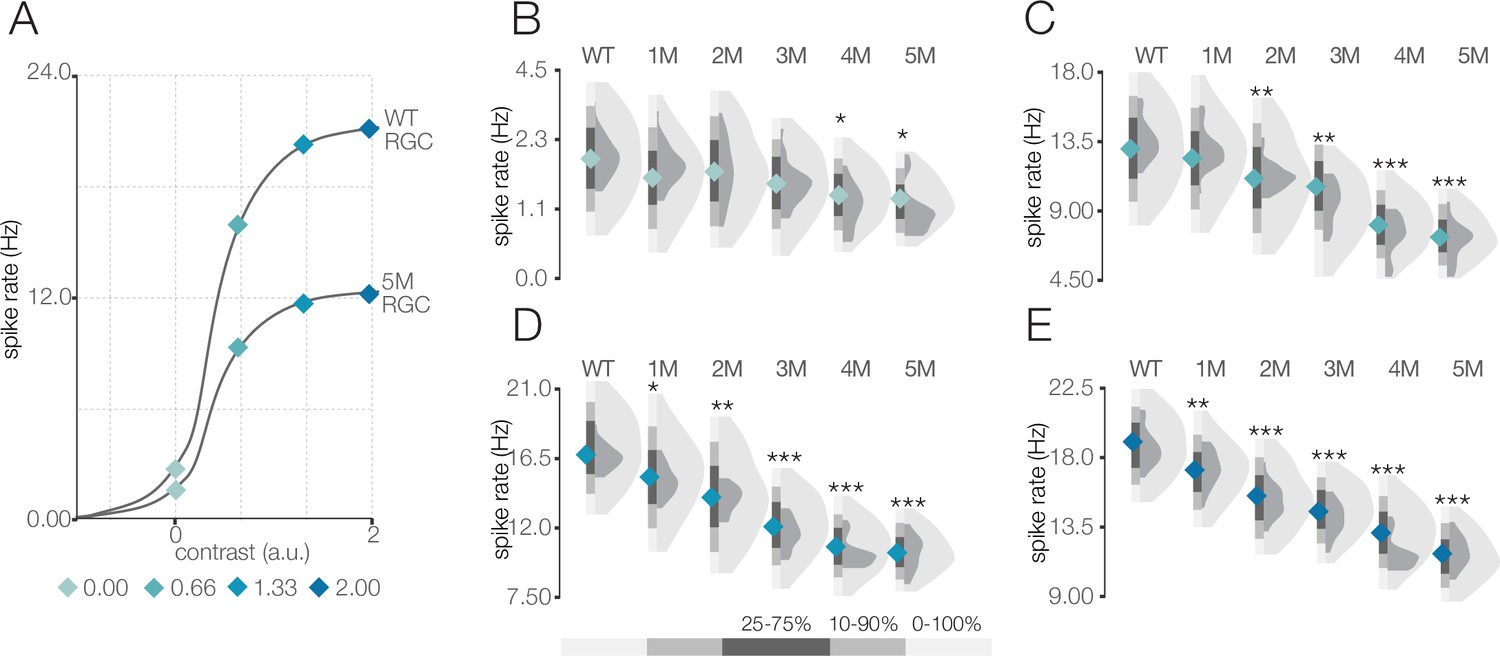
Response gain steadily decreases during rod death under mesopic conditions.
(A) Mean cumulative Gaussian fit to contrast response functions across retinal ganglion cells (RGCs) from wild-type (WT) and 5-month Cngb1neo/neo mice. Four locations along the contrast response functions are highlighted by blue diamonds. (B–E) Distributions of contrast response function values at contrasts indicated by blue diamonds in (A) for WT and Cngb1neo/neo 1- to 5-month retinas. Light and dark gray distribution are all RGCs and ON brisk-sustained RGCs, respectively. Diamond at the base of each distribution indicates mean of all RGCs (light gray distribution). Grayscale legend indicates percentile ranges of distributions for comparing dispersion across distributions. Source files for (B–E) are available in Figure 4—source data 1.
-
Figure 4—source data 1
Contains values for distributions in panels B, C, D and E.
- https://cdn.elifesciences.org/articles/80271/elife-80271-fig4-data1-v3.csv
Figure 4—figure supplement 1
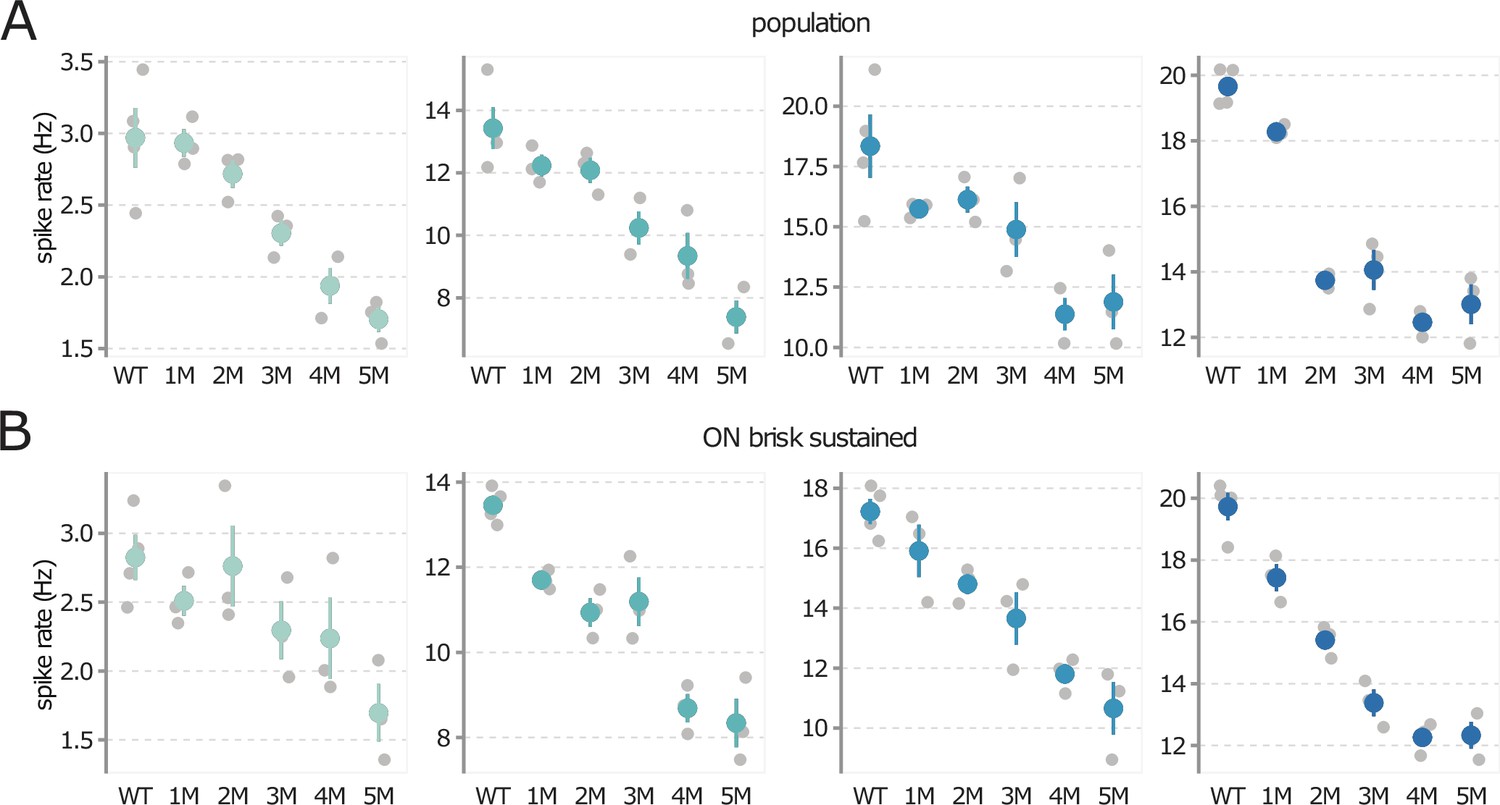
Trends in mesopic contrast response functions during rod death are consistent across experiments.
(A) Mean mesopic contrast response function outputs at input values of 0, 0.66, 1.33, and 2.0 (a.u., from left to right), following the diamond markers in Figure 4. Each gray point is one retina, color points are mean across retinas, error bars are 2× SE. (B) Same as (A), but the analysis is restricted to ON brisk-sustained retinal ganglion cells (RGCs). Source files are available in Figure 4—source data 1.
Figure 5 with 1 supplement
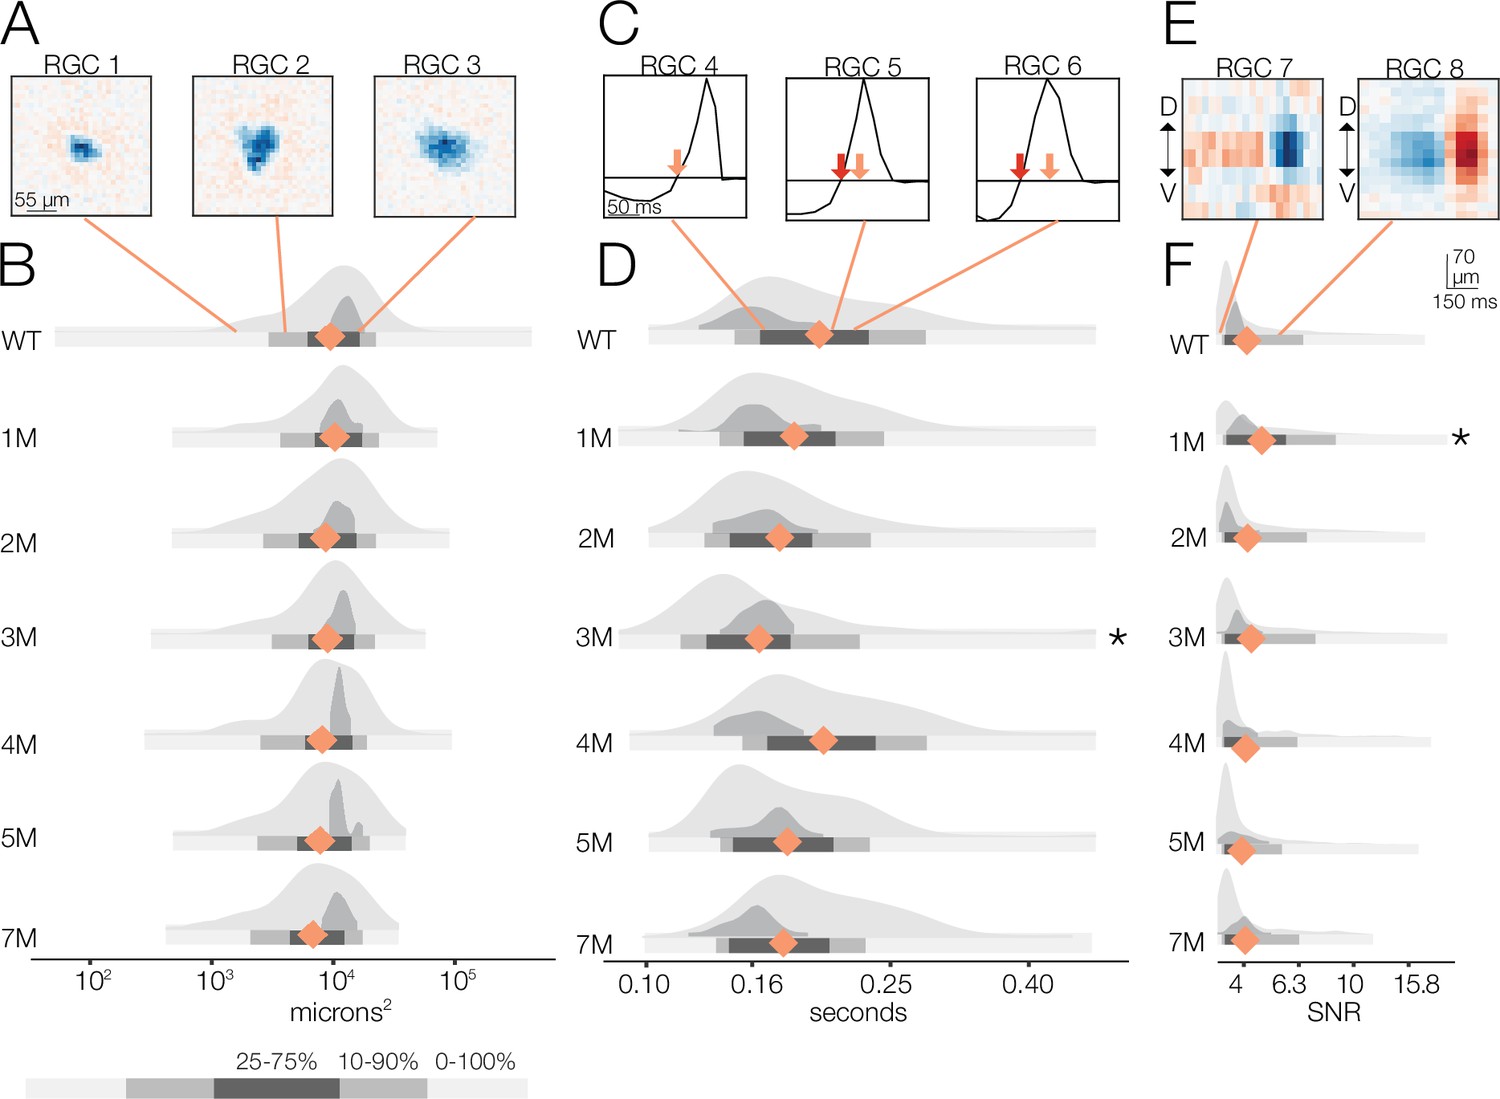
Changes in receptive field (RF) structure under photopic conditions induced by rod death.
(A) Example spatial RFs at the photopic light level showing small to large RF areas (left to right). (B) Distributions of spatial RFs comparing wild-type (WT) and Cngb1neo/neo retinas from 1 to 7 months of degeneration for all retinal ganglion cells (RGCs) with space-time-separable RFs (light gray) and ON brisk-sustained (dark gray). Orange diamonds indicate the mean of each light gray distribution. (C) Example temporal RFs at the photopic light level. Orange arrows indicate the time to zero for RGC 4; red arrows show time to zero for RGCs 5 and 6. (D) Distributions of temporal RFs comparing WT and Cngb1neo/neo retinas from 1 to 7 months of degeneration. (E) Example spike-triggered average stimulus (STAs) with lower and higher signal-to-noise ratios (SNRs). (F) Distribution of SNRs comparing WT and Cngb1neo/neo mice. Grayscale legend indicates percentile ranges of distributions in (B), (D), and (F) for comparing dispersion across distributions. Source files for (B), (D), and (F) are available in Figure 5—source data 1.
-
Figure 5—source data 1
Contains values for distributions shown in panels B, D, and F.
- https://cdn.elifesciences.org/articles/80271/elife-80271-fig5-data1-v3.csv
Figure 5—figure supplement 1
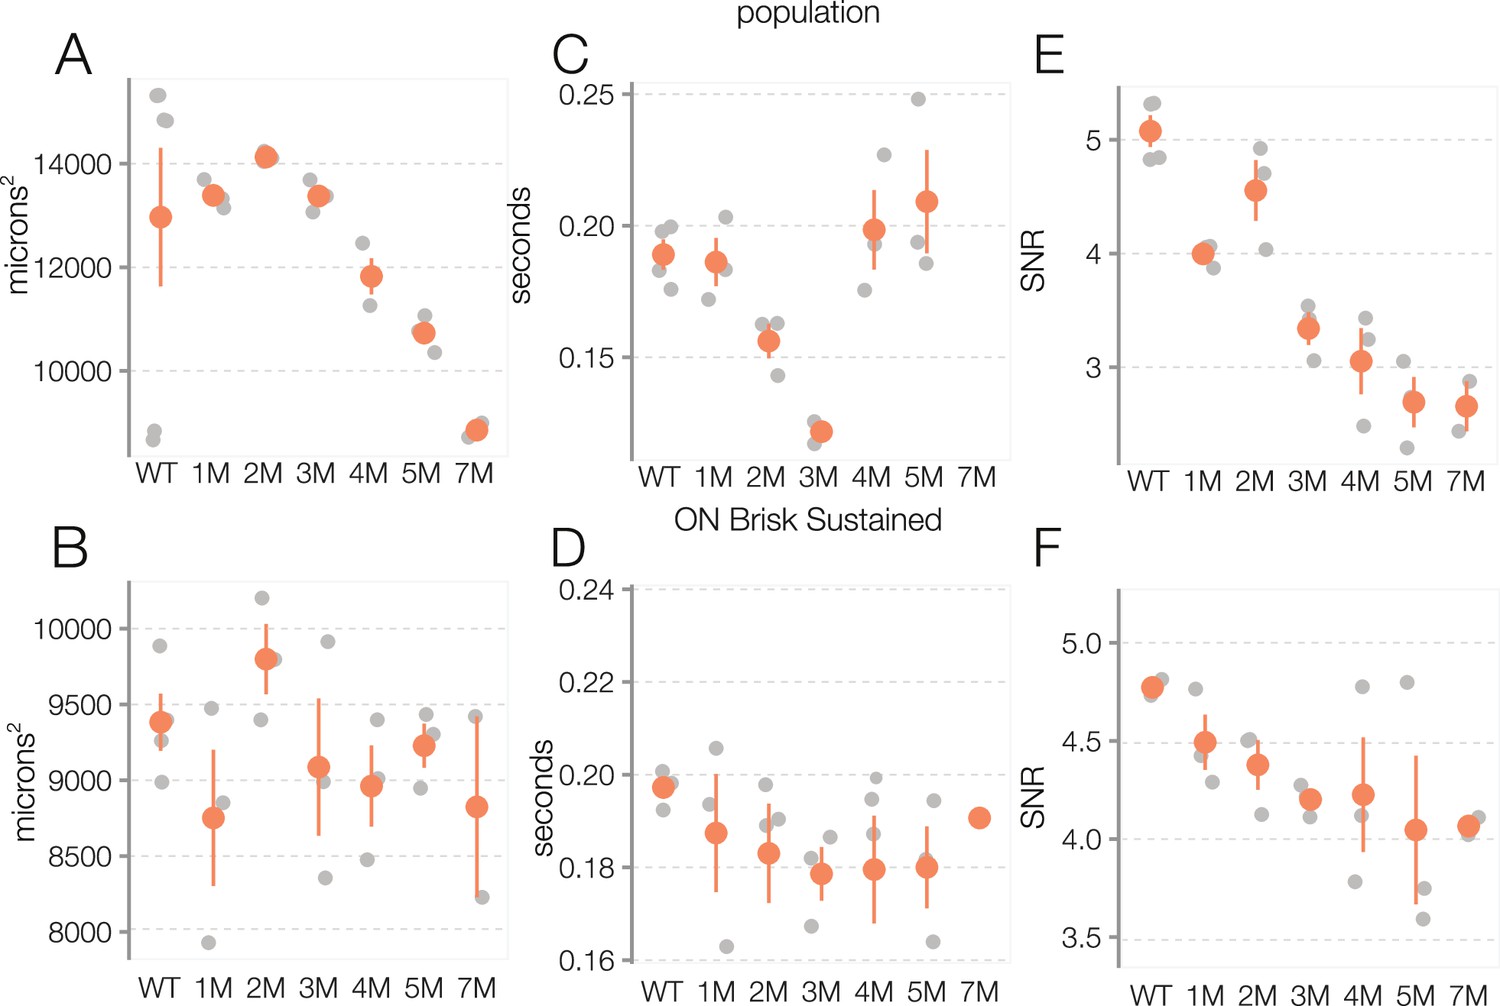
Trends in photopic receptive field (RF) structure during rod death are consistent across experiments.
(A) Mean photopic spatial RF areas for all space-time-separable retinal ganglion cell (RGC) for wild-type (WT) and across degeneration: each gray point is one retina, color points are mean across retinas, error bars are 2× SE. (B) Mean time to zero of photopic temporal RFs. (C) Mean signal-to-noise ratio (SNR) in spatiotemporal spike-triggered average stimulus (STA) at the photopic light level. (D–F) Same as (A–C), but with the analyses restricted to ON brisk-sustained RGCs. Source files are available in Figure 5—source data 1.
Figure 6 with 1 supplement
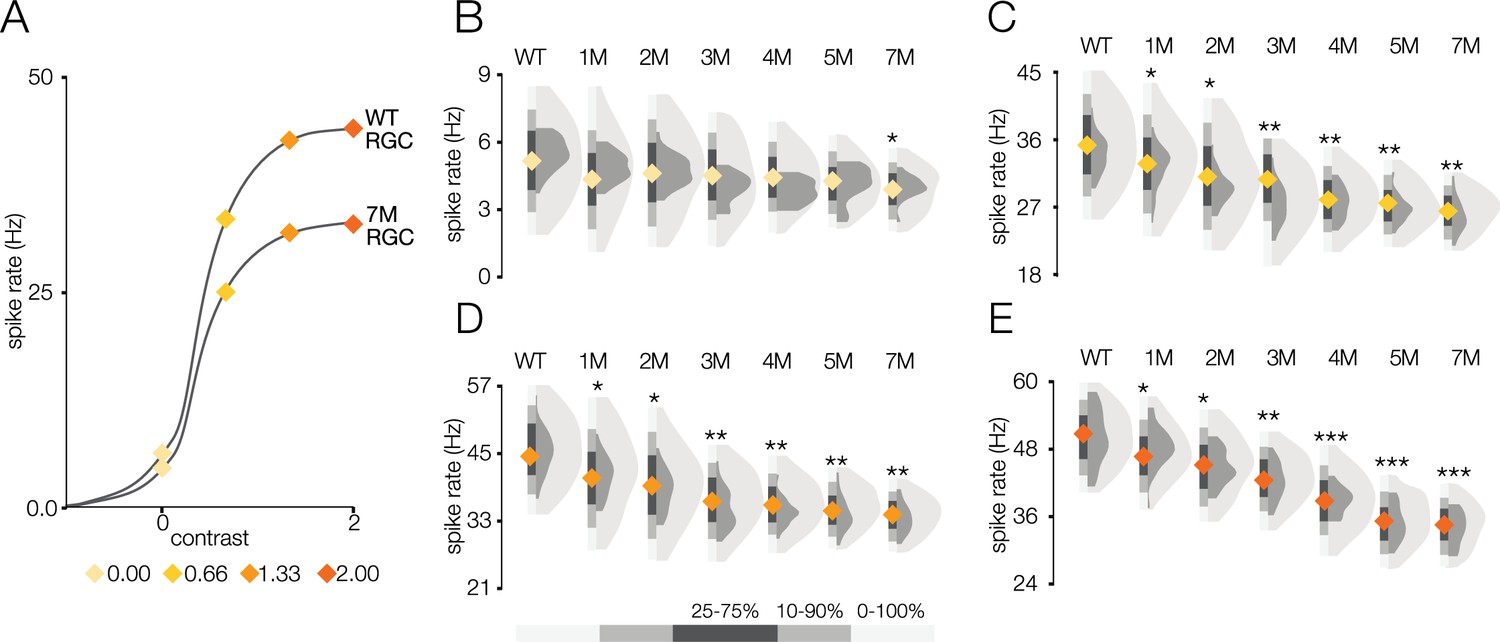
Response gain steadily decreases during rod death under photopic conditions.
(A) Mean cumulative Gaussian fit to contrast response functions across retinal ganglion cells (RGCs) from wild-type (WT) and 7-month Cngb1neo/neo mice. Four locations along the contrast response functions are highlighted by diamonds. (B–E) Distribution of contrast response function values at contrast values indicated in (A) for WT and 1- to 7-month retinas. Light and dark gray distribution are all RGCs and ON brisk-sustained RGCs, respectively. Diamond at the base of each distribution indicates mean of all RGCs with space-time-separable receptive fields (RFs) (light gray distribution). Grayscale legend indicates percentile ranges of distributions for comparing dispersion across distributions. Source files for (B–E) are available in Figure 6—source data 1.
-
Figure 6—source data 1
Contains values for distributions shown in panels B, C, D, and E.
- https://cdn.elifesciences.org/articles/80271/elife-80271-fig6-data1-v3.csv
Figure 6—figure supplement 1
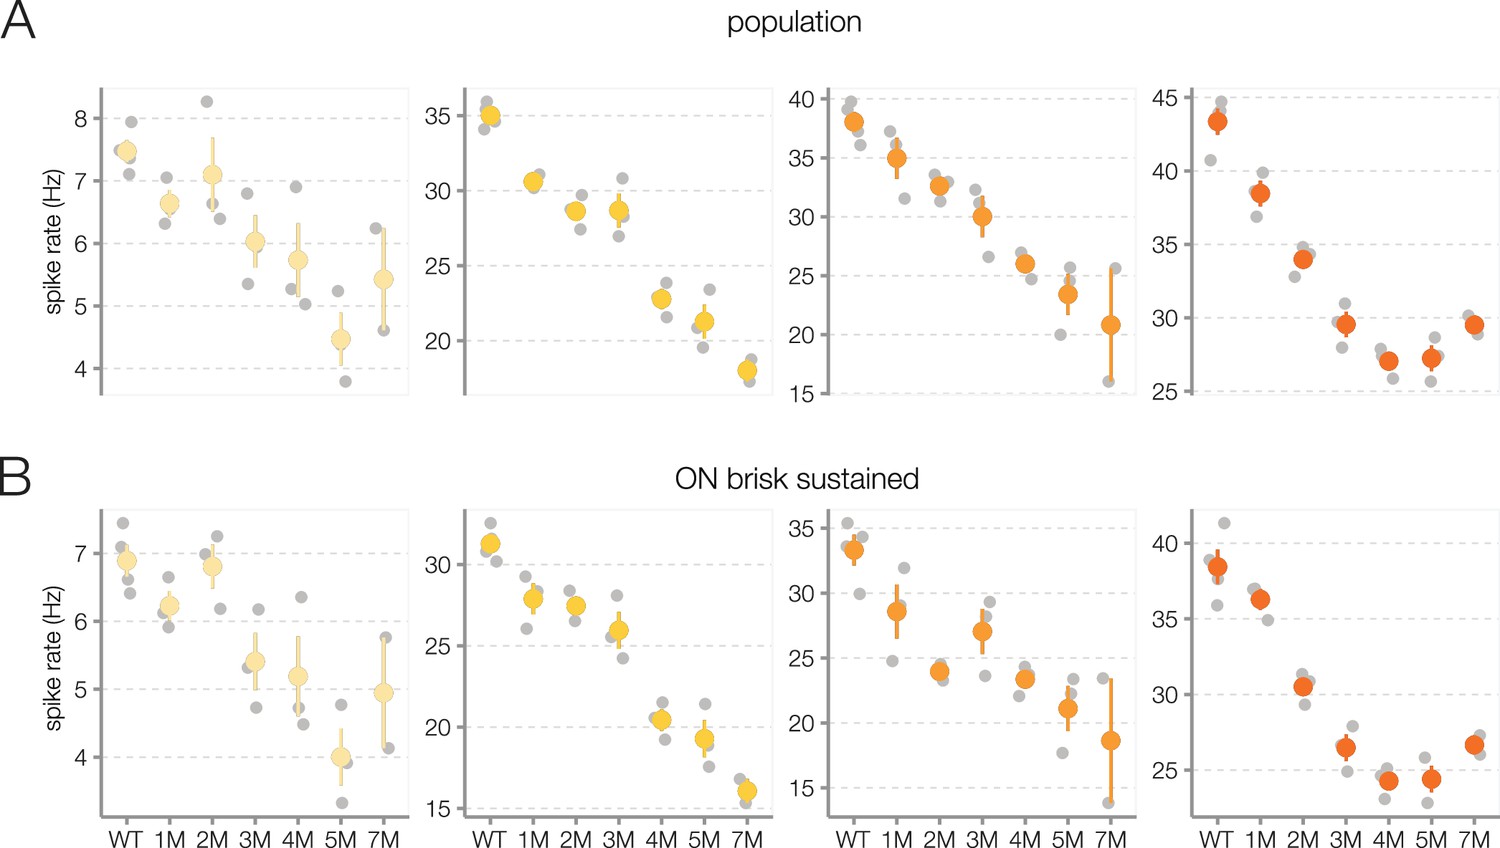
Trends in photopic contrast response functions during rod death are consistent across experiments.
(A) Mean photopic contrast response function outputs at input values of 0, 0.66, 1.33, and 2.0 (a.u., from left to right), following the diamond markers in Figure 6. Each gray point is one retina, color points are mean across retinas, error bars are 2× SE. (B) Same as (A), but the analysis is restricted to ON brisk-sustained retinal ganglion cells (RGCs). Source files are available in Figure 6—source data 1.
Figure 7
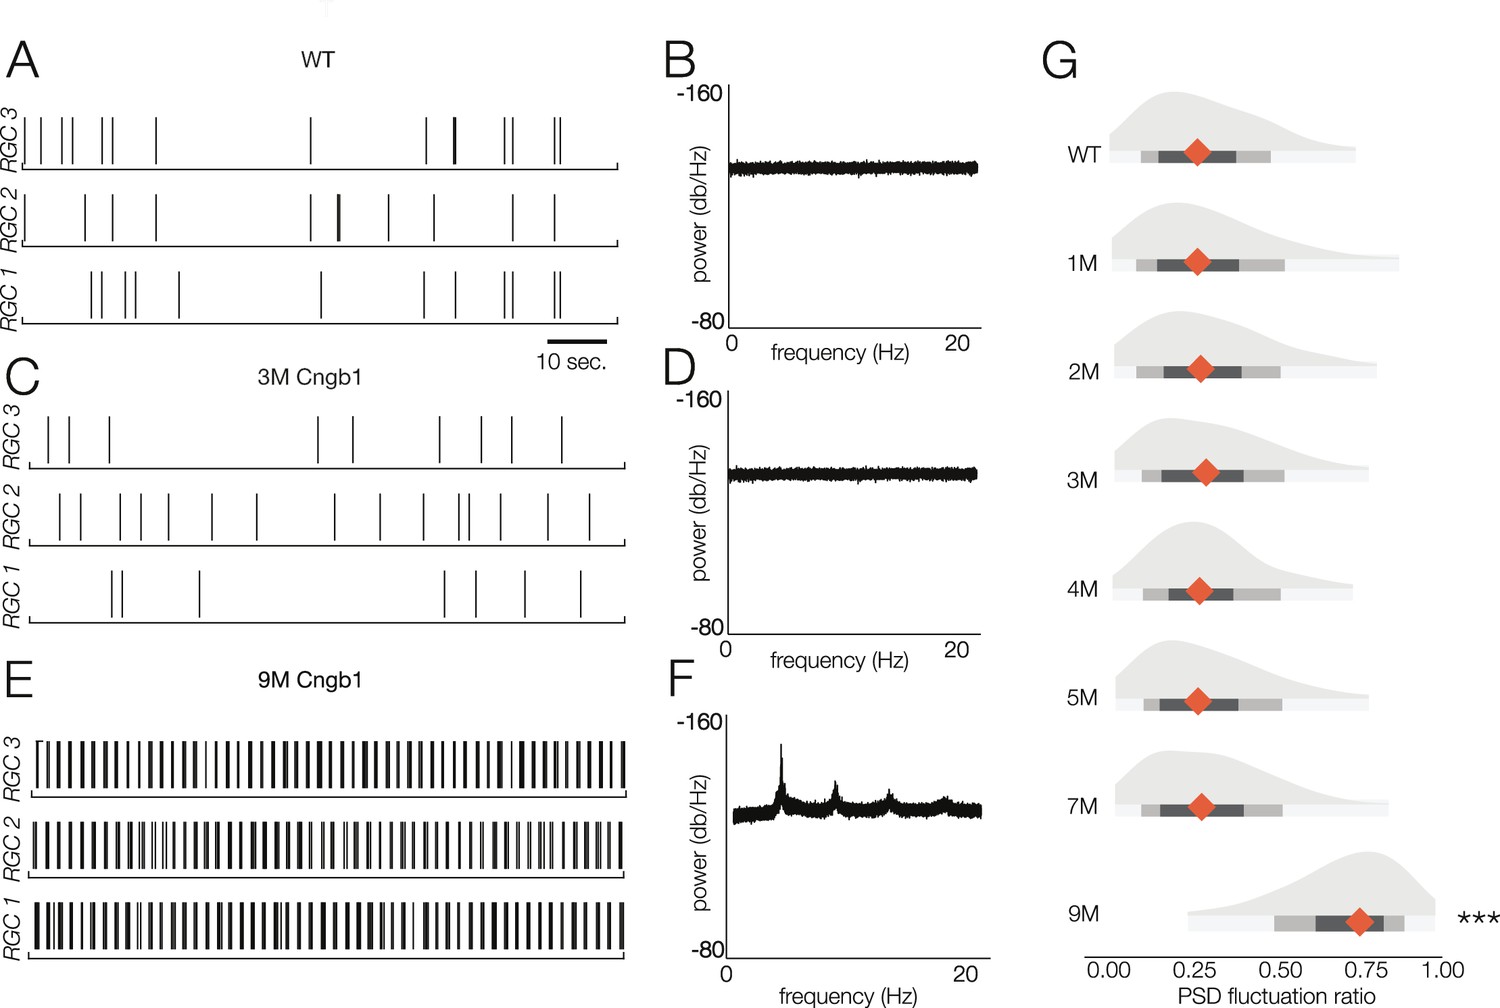
Retinal oscillations occur after photoreceptor loss in Cngb1neo/neo retinas.
(A) Spontaneous activity of three representative wild-type (WT) retinal ganglion cells (RGCs) in total darkness. (B) The power spectral density (PSD) of one example RGC. (C, D) Example rasters (C) and PSD (D) of a representative 3-month Cngb1neo/neo RGC. (E, F) Example rasters and the PSD of a representative 9-month Cngb1neo/neo RGC. (G) Distributions of the PSD fluctuation ratios, defined as the maximum of PSD divided by the baseline PSD (see ‘Materials and methods’). Mean indicated by orange diamond, gray bars indicate 100% (light), 80% (medium), and 50% (dark) percentile ranges. Source files for (G) are available in Figure 7—source data 1.
-
Figure 7—source data 1
Contains values for distributions shown in panel G.
- https://cdn.elifesciences.org/articles/80271/elife-80271-fig7-data1-v3.csv
Figure 8 with 1 supplement
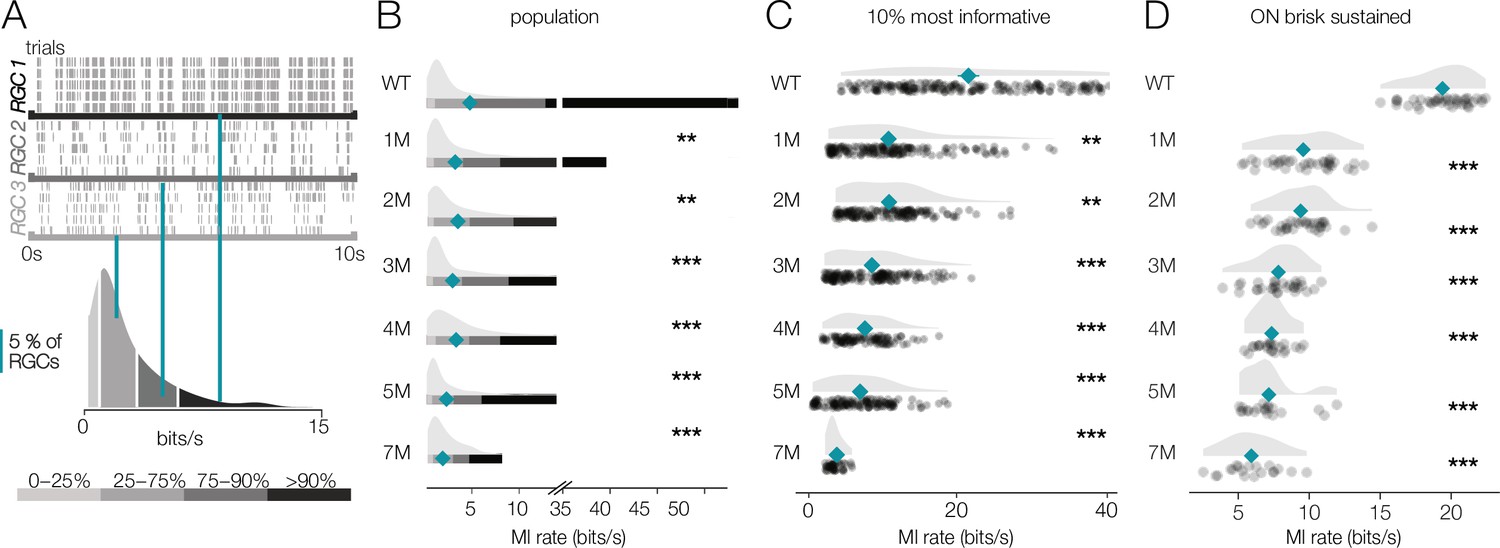
Retinal ganglion cell (RGC) signaling fidelity at mesopic condition decreases with rod death.
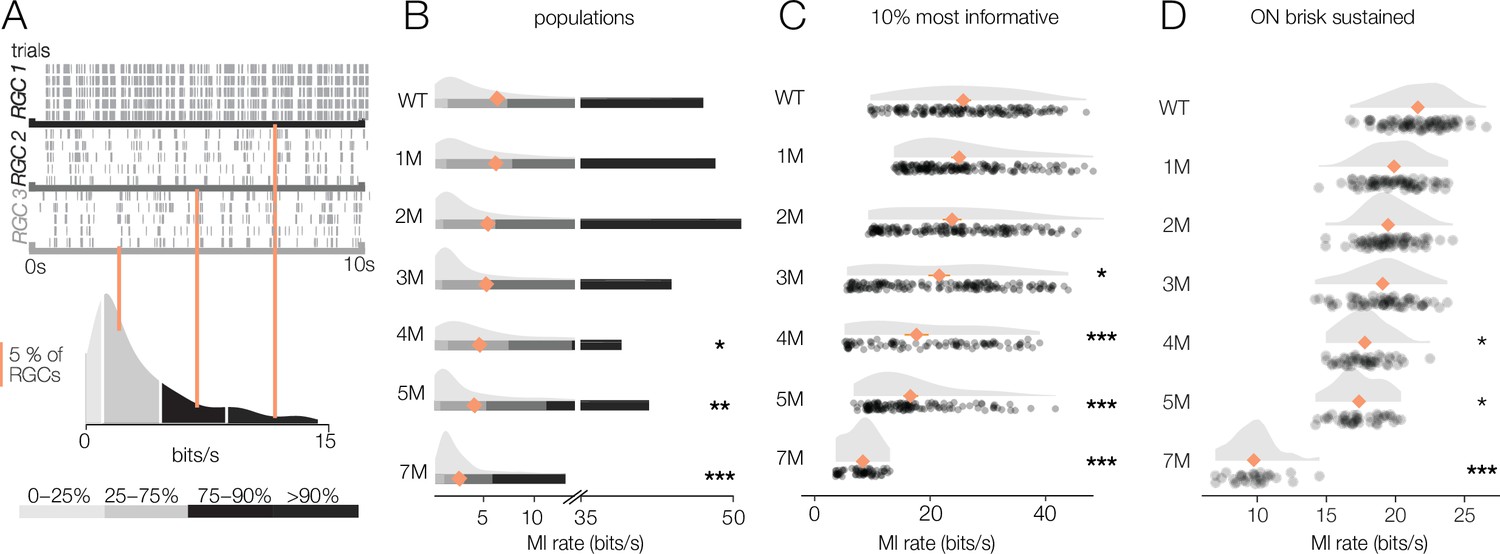
(A) (Top) Rasters from three example RGCs responding to a repeated mesopic checkerboard stimulus. (Bottom) Distribution of information rates across all RGCs from one experiment; teal lines show where each example RGC lies in the distribution. (B) Distributions of information rates for all RGCs in each condition: wild-type (WT) and Cngb1neo/neo retinas. Mean shown by teal diamonds, stars indicate significant changes from WT: *, **, and *** are p<0.1, 0.01, and 0.001, respectively. (C) Distributions of information rates of 10% most informative RGCs across conditions. (D) Distributions of information rates for ON brisk-sustained RGCs across conditions. Source files for (B–D) are available in Figure 8—source data 1.
-
Figure 8—source data 1
Contains values for distributions shown in panels B, C, and D.
- https://cdn.elifesciences.org/articles/80271/elife-80271-fig8-data1-v3.csv
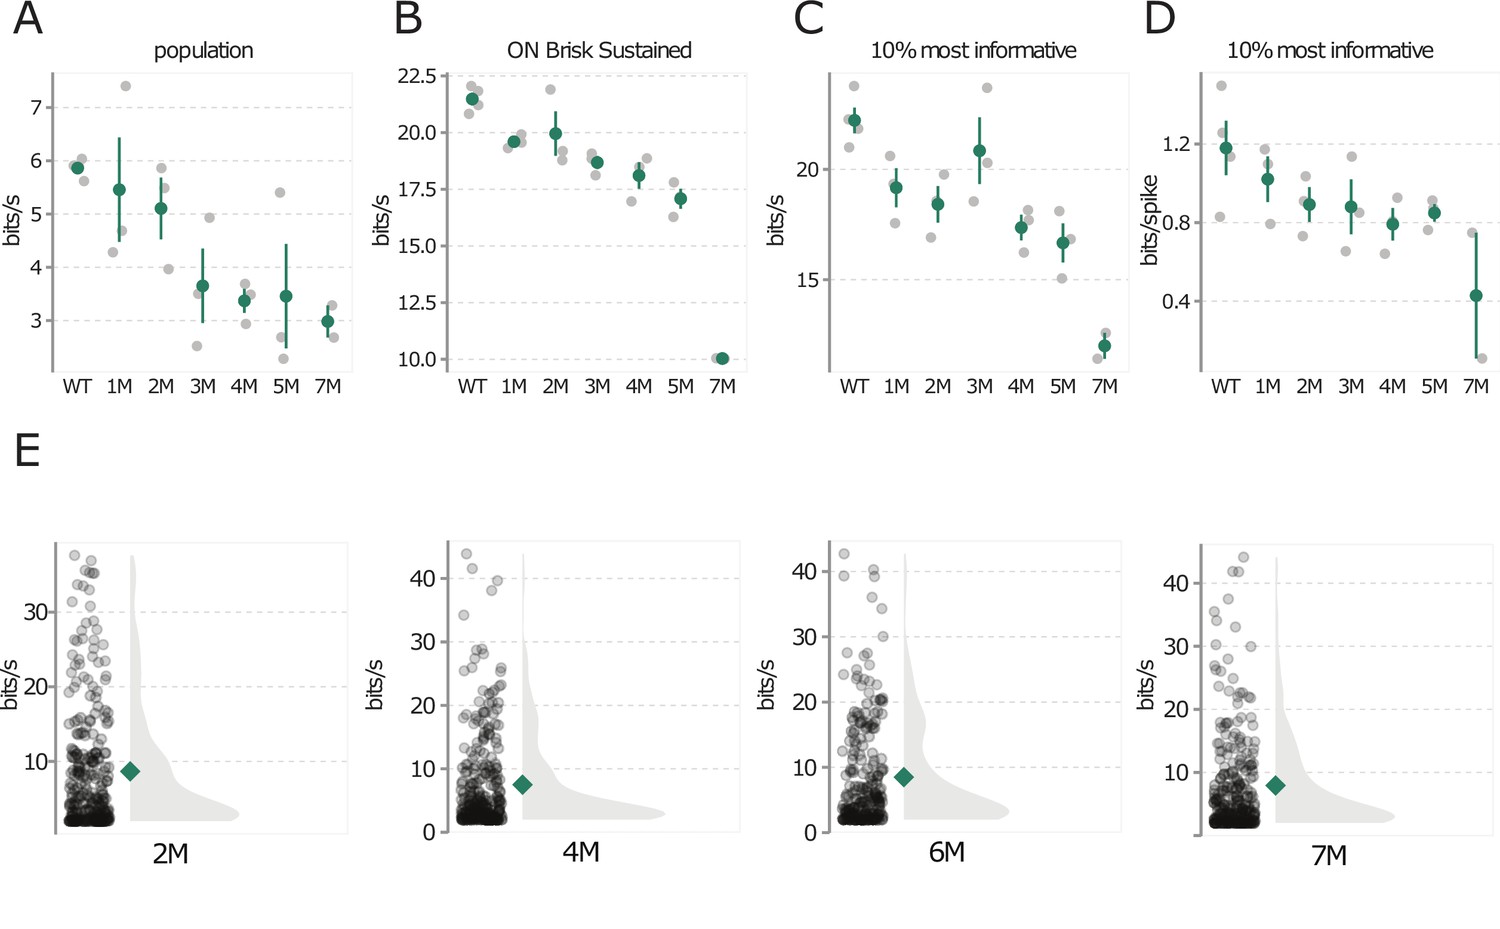
Figure 8—figure supplement 1
Mesopic information rate changes are not driven by experiment-to-experiment variability.
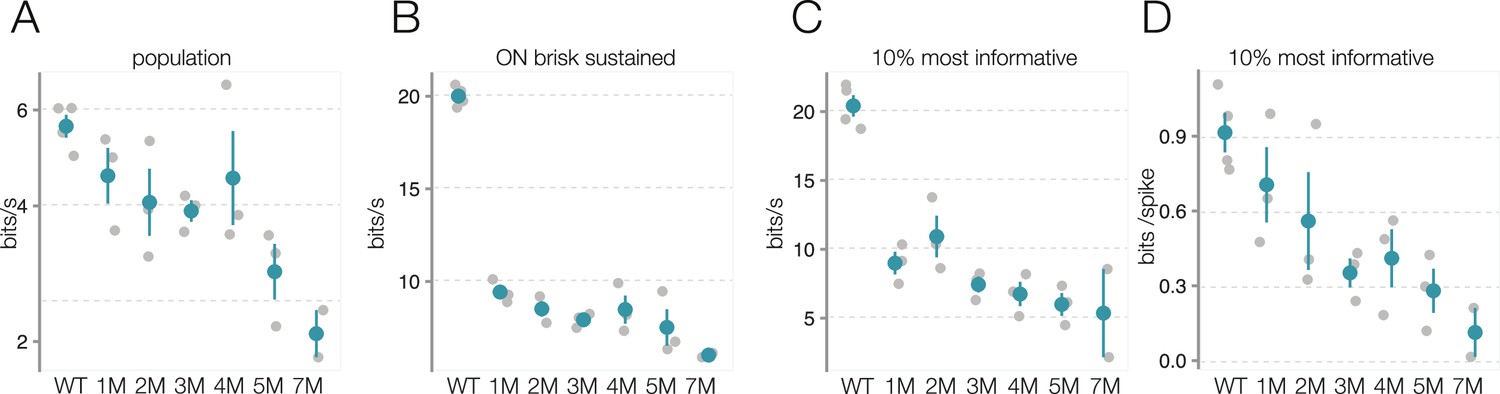
(A) Change in mesopic information rates for checkerboard noise during rod death: each gray point is one retina, color points are mean across retinas, error bars are 2× SE. (B) Same as (A), but analysis is restricted to ON brisk-sustained retinal ganglion cells (RGCs). (C) Change in information rates during rod death for top 10% most informative RGCs. (D) Same as (C), but information rate is divided by number of spikes to highlight changes in bits/spike. Source files are available in Figure 8—source data 1.
Figure 9 with 1 supplement
Retinal ganglion cell (RGC) signaling fidelity at photopic condition is relatively stable with rod death.
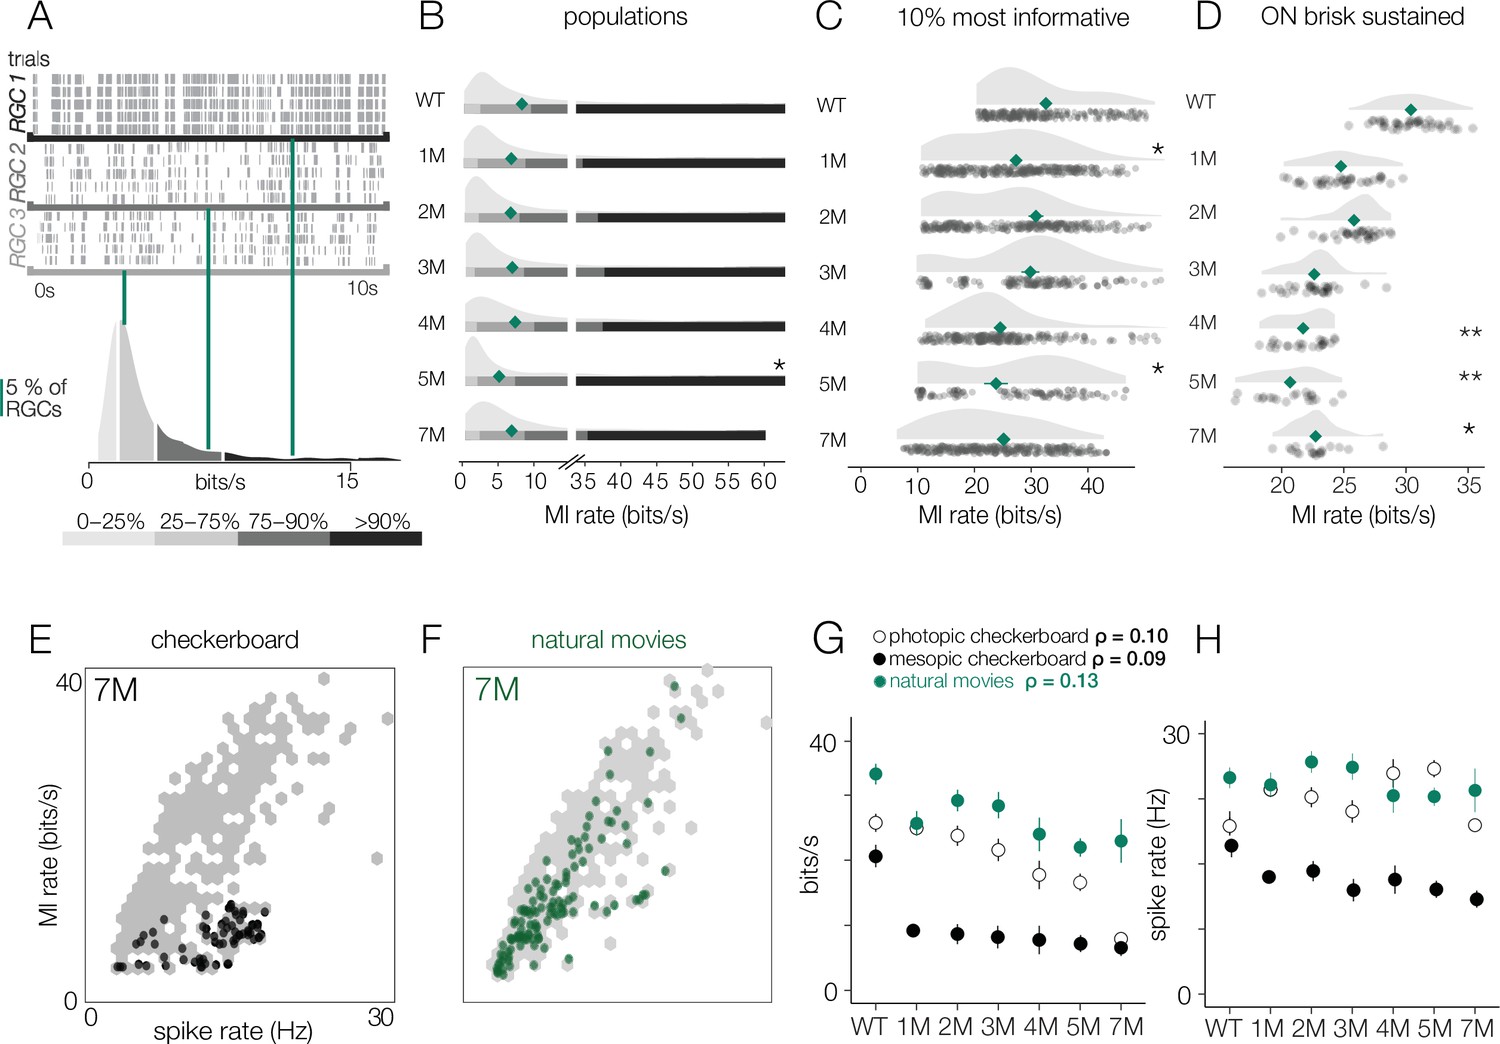
(A) (Top) Rasters from three example RGC responding to a repeated photopic checkerboard stimulus. (Bottom) Distribution of information rates across all RGCs from one experiment; orange lines show where each example RGC lies in the distribution. (B) Distributions of information rates of for all RGCs in each condition: wild-type (WT) and Cngb1neo/neo retinas. Means shown by orange diamonds. (C) Distribution of information rates of 10% most informative RGCs across conditions. (D) Distribution of information rates for ON brisk-sustained RGCs across conditions. Source files for (B–D) are available in Figure 9—source data 1.
-
Figure 9—source data 1
Contains values for distributions shown in panels B, C, and D.
- https://cdn.elifesciences.org/articles/80271/elife-80271-fig9-data1-v3.csv
Figure 9—figure supplement 1
Photopic information rate changes are not driven by experiment-to-experiment variability.
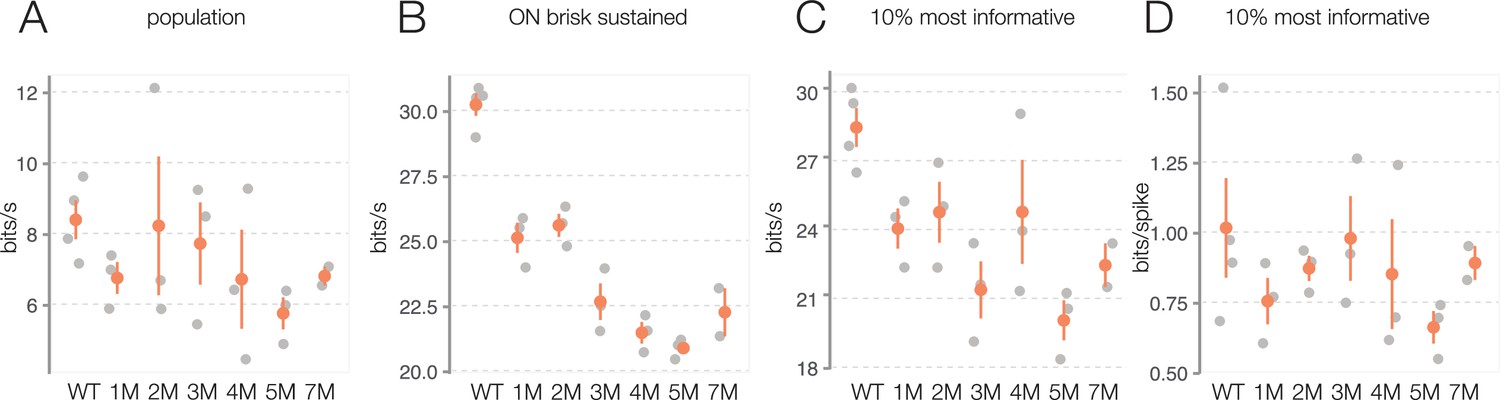
(A) Change in photopic information rates for checkerboard noise during rod death: each gray point is one retina, color points are mean across retinas, error bars are 2× SE. (B) Same as (A), but analysis is restricted to ON brisk-sustained retinal ganglion cells (RGCs). (C) Change in information rates for top 10% most informative RGCs. (D) Same as (C), but information rate is divided by number of spikes to highlight changes in bits/spike. Source files are available in Figure 9—source data 1.
Figure 10 with 1 supplement
Retinal ganglion cell (RGC) signal fidelity is higher for natural movies than checkerboard noise late into degeneration.
(A) (Top) Rasters from three example RGCs responding to a repeated photopic natural movie stimulus. (Bottom) Distribution of information rates across all RGCs from one experiment; green lines show where each example RGC lies in the distribution. (B) Distributions of information rates to a natural movie for all RGCs in each condition for wild-type (WT) and Cngb1neo/neo retinas. Mean shown by green diamonds. (C) Distribution of information rates to a natural movie for the 10% most informative RGCs across conditions. (D) Distribution of information rates to a natural movie for ON brisk-sustained RGCs across conditions. (E, F) Scatter plot of information rates and spike rates from RGC responses to photopic checkerboard stimulus (E) or a natural movie (F). Gray dots are RGC responses from the total population (all conditions). Black (E) and green (F) dots are from 7-month Cngb1neo/neo. (G) Mean information rates of RGC responses to natural movies (green), photopic checkerboard (open), and mesopic checkerboard (black) across WT and Cngb1neo/neo retinas. Error bars are 2× SE. (H) Mean spike rates of RGC responses to natural movies (green), photopic checkerboard movies (open), and mesopic checkerboard (black) across WT and Cngb1neo/neo retinas. ρ is the linear correlation between the mean information rate and the mean firing rate across retinas. Source files for (B–H) are available in Figure 10—source data 1.
-
Figure 10—source data 1
Contains values for distributions shown in panels B - H.
- https://cdn.elifesciences.org/articles/80271/elife-80271-fig10-data1-v3.csv
Figure 10—figure supplement 1
Natural movie information rate changes are not driven by experiment-to-experiment variability.
(A) Change in photopic information rates for natural movie 1 during rod death: each gray point is one retina, color points are mean across retinas, error bars are 2× SE. (B) Same as (A), but analysis is restricted to ON brisk-sustained retinal ganglion cells (RGCs). (C) Change in information rates for top 10% most informative RGCs. (D) Same as (C), but information rate is divided by number of spikes to highlight changes in bits/spike. (E) Distribution of information rates for natural movie 1 from wild-type (WT) animals measured at four ages (2–7 months, left to right). Structure of distributions changes negligibly during this period in WT animals, thus these data were pooled across ages. Similar results were obtained for natural movie 2 and checkerboard noise at the photopic and mesopic light levels. Source files are available in Figure 10—source data 1.
Figure 11

Stability of estimated information rates to trial number and trial duration.
(A) Example rasters illustrating the subsampling for fewer trials. (B) Information rates (mean ± 2× SE) of four retinal ganglion cells (RGCs) from separate cohorts as a function of number of repeated stimuli. Information rates stabilized at ~60 trials (repeats). (C) Example rasters illustrating the subsampling of trial duration. (D) Information rates (mean ± 2× SE) of three RGCs from separate degeneration cohorts by subsampling briefer stimulus durations. The stimulus used in this analysis was movie 1 (see ‘Materials and methods’). Similar results were obtained for the other stimuli (movie 2 and checkerboard noise). Source files for (B) and (D) are available in Figure 11—source data 1.
-
Figure 11—source data 1
Contains values for panels B and D.
- https://cdn.elifesciences.org/articles/80271/elife-80271-fig11-data1-v3.csv
Additional files
Download links
A two-part list of links to download the article, or parts of the article, in various formats.
Downloads (link to download the article as PDF)
Open citations (links to open the citations from this article in various online reference manager services)
Cite this article (links to download the citations from this article in formats compatible with various reference manager tools)
Robust cone-mediated signaling persists late into rod photoreceptor degeneration
eLife 11:e80271.
https://doi.org/10.7554/eLife.80271


