Transient cell-in-cell formation underlies tumor relapse and resistance to immunotherapy
- Department of Pathology, Sackler School of Medicine, Tel Aviv University, Israel
- Cell and Developmental Biology, Sackler School of Medicine, Tel Aviv University, Israel
- Human Molecular Genetics and Biochemistry, Sackler School of Medicine, Tel Aviv University, Israel
- Institute of Pathology, Rabin Medical Center- Beilinson Hospital, Israel
- Institute of Pathology, Tel Aviv Sourasky Medical Center, Israel
- Department of General Surgery, Rabin Medical Center- Beilinson Campus, Israel
- Department of Biology, Institute of Microbiology, Switzerland
- Department of Medical Oncology, Erasmus MC Cancer Institute, Netherlands
- School of Medicine, Department of Pathology, Stanford University, United States
Figures
Figure 1 with 1 supplement
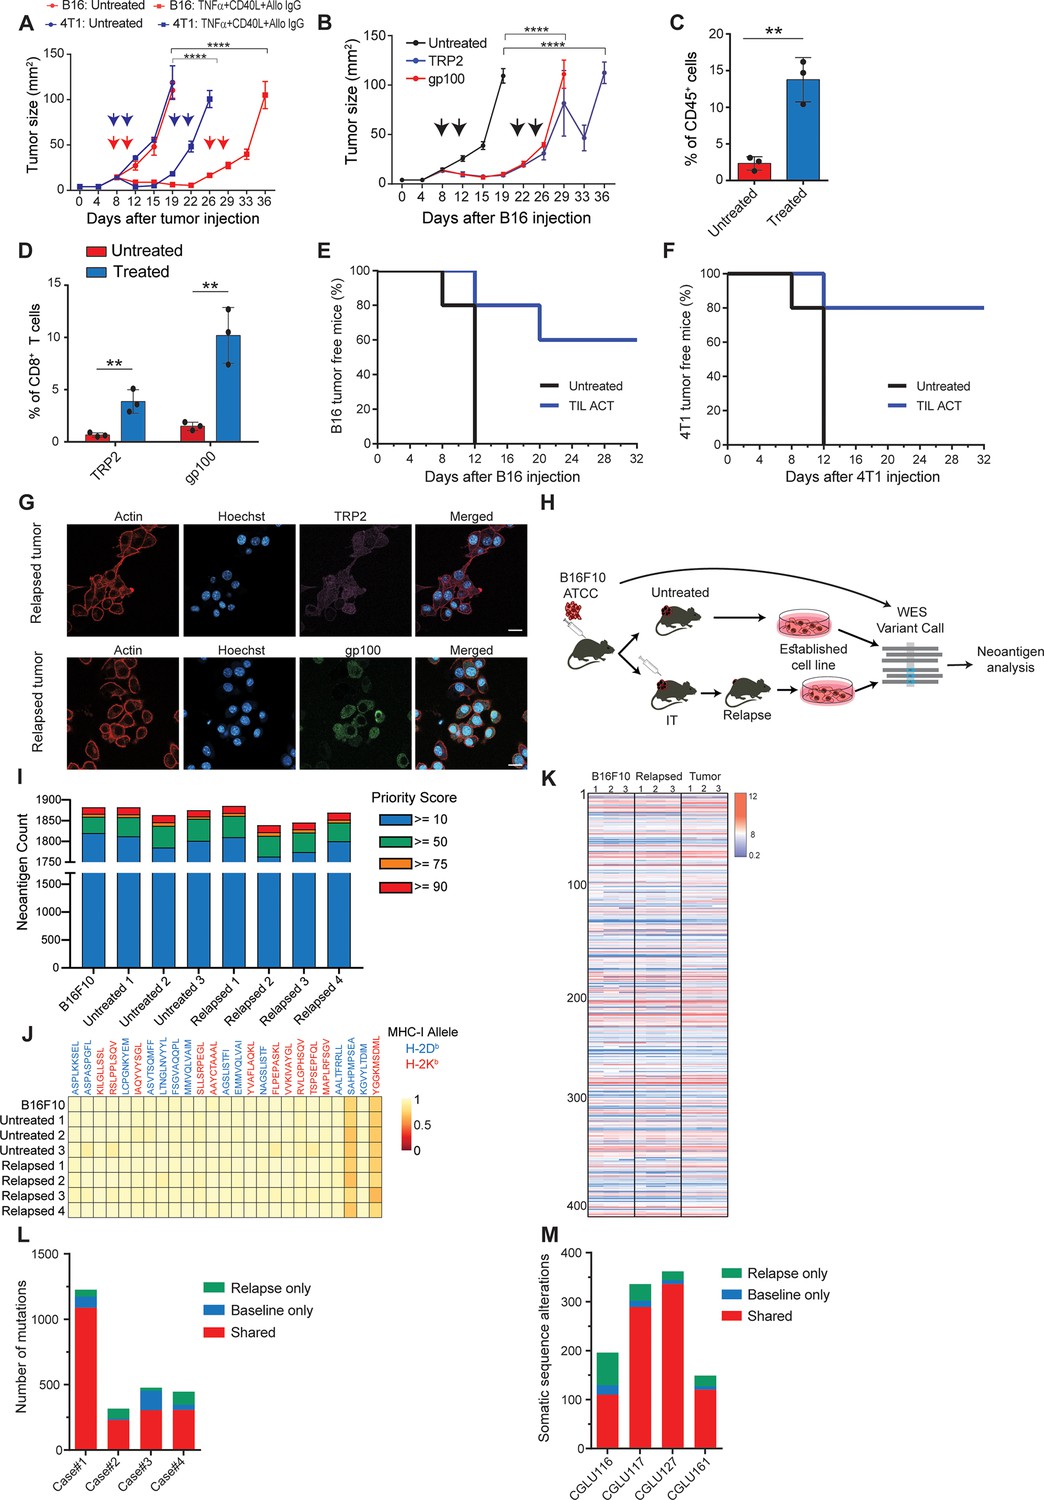
Immunotherapy-relapsed tumor cells share neoantigens with primary tumors.
(A) Tumor size (in mm2) following treatments with anti-CD40, TNFα(i.e. (DC) adjuvant) and tumor-binding antibodies (n=5). Arrowheads indicate treatment. (B) Tumor size (in mm2) following adoptive transfer of gp100-reactive or TRP2-reactive CD8+ T cells (n=5). Arrowheads indicate treatment (C) Mean percentages of T cells out of CD45+ cells in B16F10 tumors treated with DC adjuvant and tumor-binding antibodies (n=3). (D) Mean percentage of TRP2- and gp100-reactive T-cell clones in tumors treated with DC adjuvant and tumor-binding antibodies (n=3). (E) Percentage of tumor-free mice injected with CD8+ T cells from immunotherapy-treated B16 tumors (ACT), and subsequently challenged with B16F10 cells (n=5). (F) Percentage of tumor-free mice injected with CD8+ T cells from immunotherapy-treated 4T1 tumors (ACT), and subsequently challenged with 4T1 cells (n=5). (G) Representative staining of TRP2 and gp100 in immunotherapy- relapsed B16F10 cells. (H) Illustration of neoantigen discovery pipeline. (I) Neoantigen burden in B16F10 cells isolated from untreated tumors, or following immunotherapy-treated B16F10 tumors (IT). (J) Allele frequency comparison of 25 neoantigens with the highest MHC-I affinity. (K) RNAseq expression level of B16F10-known neoantigens. (L) Primary and relapsed tumors non-synonymous mutation load in melanoma patients (n=4). (M) Somatic sequence alterations in NSCLC Patients (n=4). Experiments were repeated independently at least three times. Statistical significance was calculated using ANOVA with Tukey’s correction for multiple comparisons (** denotes p<0.01, **** denotes p<0.0001). Error bars represent standard error. Scale bars = 20 μm.
-
Figure 1—source data 1
Log2 expression of B16F10 neoantigens, related to Figure 1.
- https://cdn.elifesciences.org/articles/80315/elife-80315-fig1-data1-v1.xlsx
Figure 1—figure supplement 1
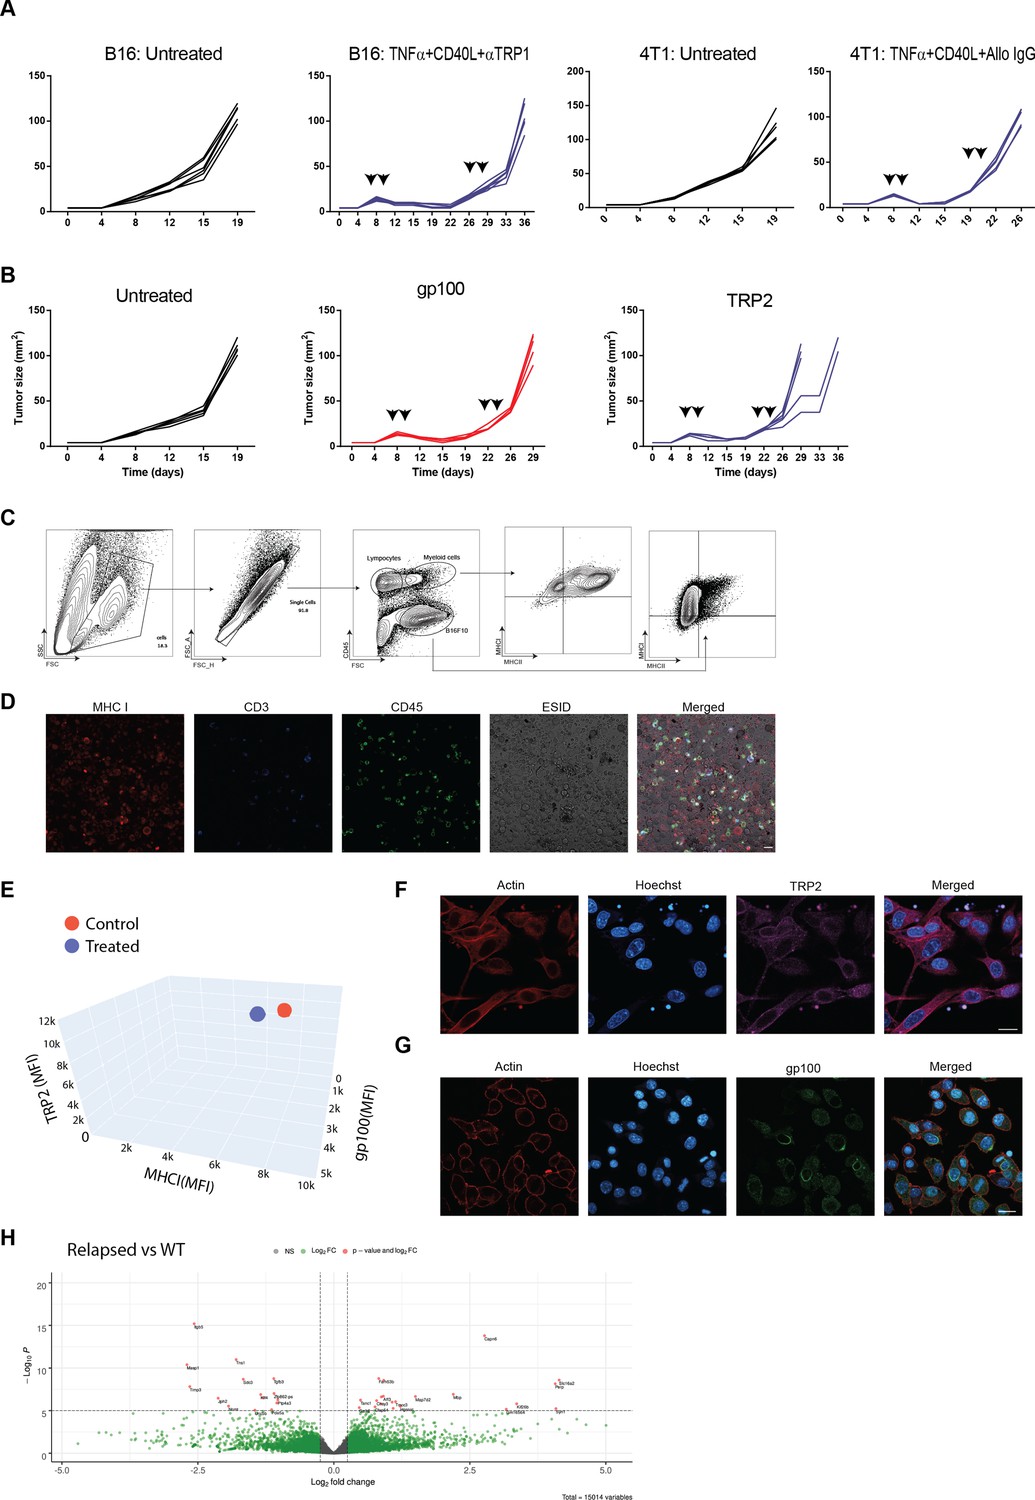
Comparing the immunogenicity of primary and relapsed tumors, Related to Figure 1.
(A) Individual mice tumor growth curves from Figure 1. (B) Individual mice tumor growth curves from Figure 1B. (C) Gating strategy and MHC expression on immune and tumor cells following a second treatment with tumor-binding antibodies, TNFα, and anti-CD40 agonist. (D) Immunofluorescence of total single cells obtained from tumors treated twice with tumor-binding antibodies, TNFα, and anti-CD40 agonist. (E) Mean fluorescence intensity of MHCI, TRP2 and gp100 antigens on B16F10 tumor cells isolated from treated or untreated tumors. (F) Immunostaining of untreated B16F10 for melanoma antigen TRP2. (G) Immunostaining of untreated B16F10 for melanoma antigen gp-100. (H) Volcano plots comparing gene expression in B16F10 tumor cells sorted from relapsed tumors in vivo and B16F10 cell lines established from relapsed tumors following immunotherapy. Scale bar = 20 μm.
Figure 2 with 3 supplements
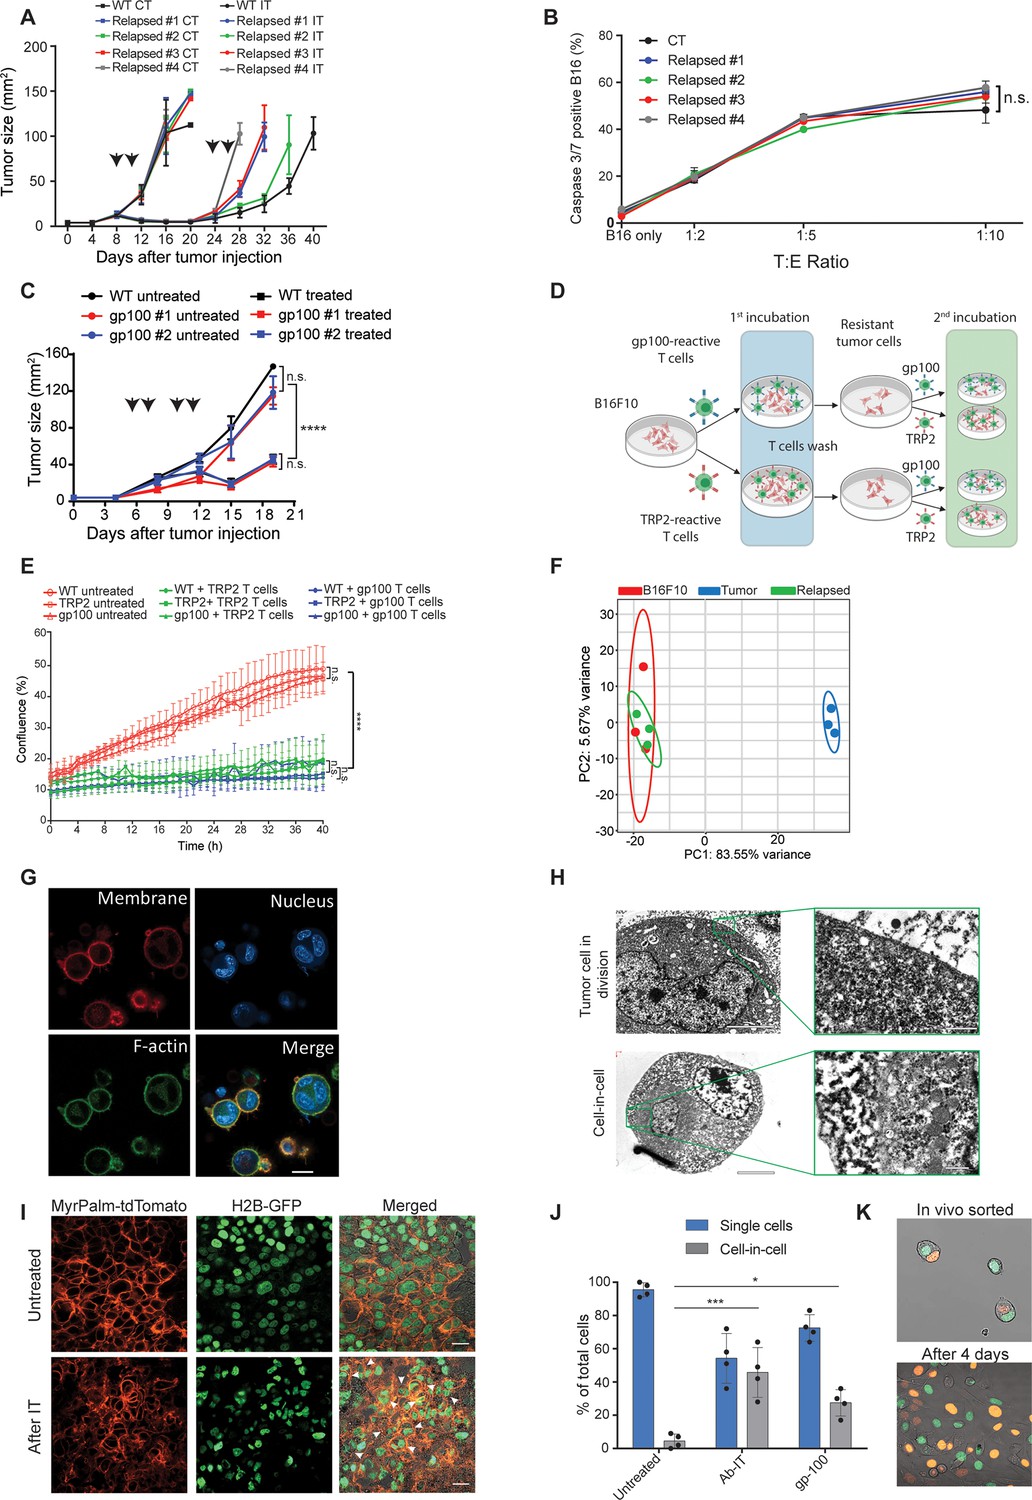
Tumor cells surviving immunotherapy organize in a transient cell-in-cell formation.
(A) Tumor size (in mm2) of B16F10 control (WT) and cell-lines established from relapsed B16F10 tumors following re-treatments with DC adjuvant and anti-TRP1 tumor-binding antibodies (n=5). (B) Mean percentages of apoptotic tumor cells after incubation overnight with gp100-reactive CD8+ T cells (n=4). (C) Tumor size (in mm2) of B16F10 control (WT) and cell-lines established from relapsed B16 tumors following additional treatment with gp100-reactive T cell (n=4). Arrowheads indicate treatment. (D) Illustration of experimental design. (E) Confluence percentage of B16F10 following one or two incubations with gp100-reactive or TRP2-reactive CD8+ T cells. (F) Principal Component Analysis (PCA) of B16F10 tumor cell lines freshly isolated from treated mice. (G) Representative images of B16F10 tumor cells sorted from tumors relapsed after immunotherapy. (H) Transmitting electron microscopy images of immunotherapy-relapsed B16F10 tumor cells. (I) Representative histological sections of untreated B16F10 tumors, and 5 days following immunotherapy. Arrowheads indicate cell-in-cell formation. (J) Mean percentage of cell-in-cell and single cells in B16F10 tumor-bearing mice, left untreated, treated with DC adjuvant and anti-TRP1 (Ab-IT), and treated with gp100-reactive T cells (gp100 ACT) (n=4). (K) Representative images of B16F10 labeled with H2B-tdTomato and H2B-GFP immediately after isolation from tumor-bearing mice treated with DC adjuvant and anti-TRP1, and after 4 days in culture. Experiments were repeated independently at least three times. Statistical significance was calculated using ANOVA with Tukey’s correction for multiple comparisons (* denotes p<0.05, *** denotes p<0.001, and **** denotes p<0.0001). Error bars represent standard error. Scale bars = 20 μm (G, I), 5 μm (H left), 500 nm (H right).
Figure 2—figure supplement 1
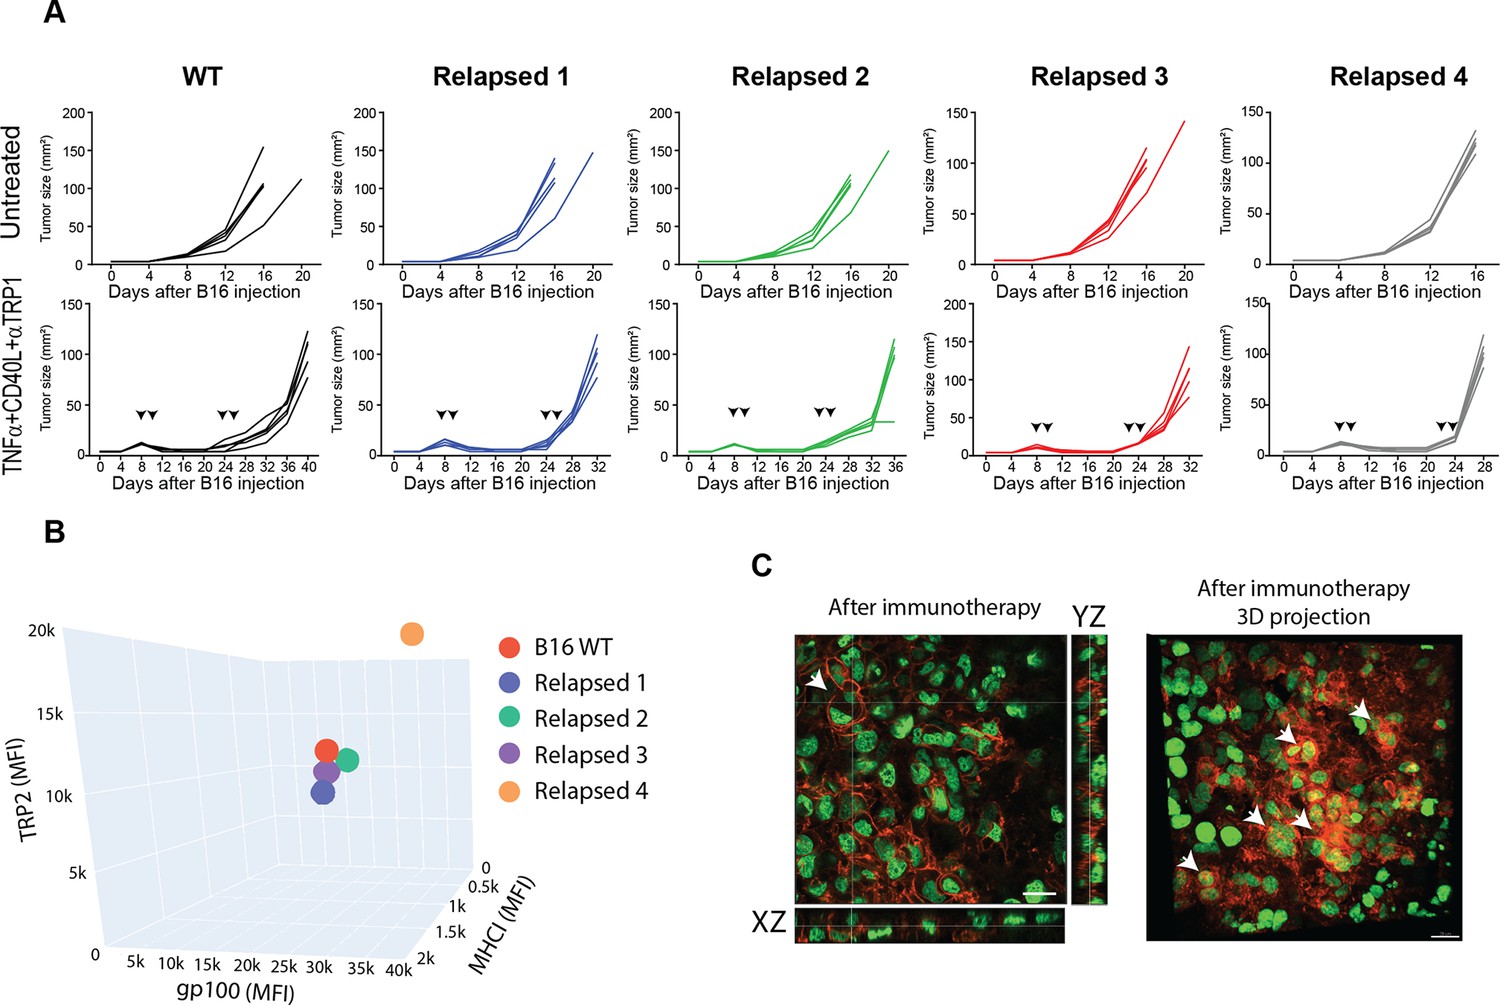
The immunogenicity of tumor cell that relapsed following immunotherapy does not inherently alter, compared to their parental cells.
Relates to Figure 2. (A). Individual mice tumor growth curves from Figure 2A (n=5). (B) Mean fluorescence intensity of MHCI, TRP2 antigen and gp100 antigen on B16F10 and cell-lines established from relapsed B16 tumors. (C) Extended confocal section and 3D projection of histological sections of B16F10 tumors 5 days after immunotherapy.
Figure 2—video 1
Spontaneous induction of cell-in-cell formation following sorting of single cells from tumors treated with immunotherapy, related to Figure 2.
Figure 2—video 2
Spontaneous dissemination of cell-in-cell sorted directly from tumors following treatment with immunotherapy, related to Figure 2.
Figure 3 with 4 supplements
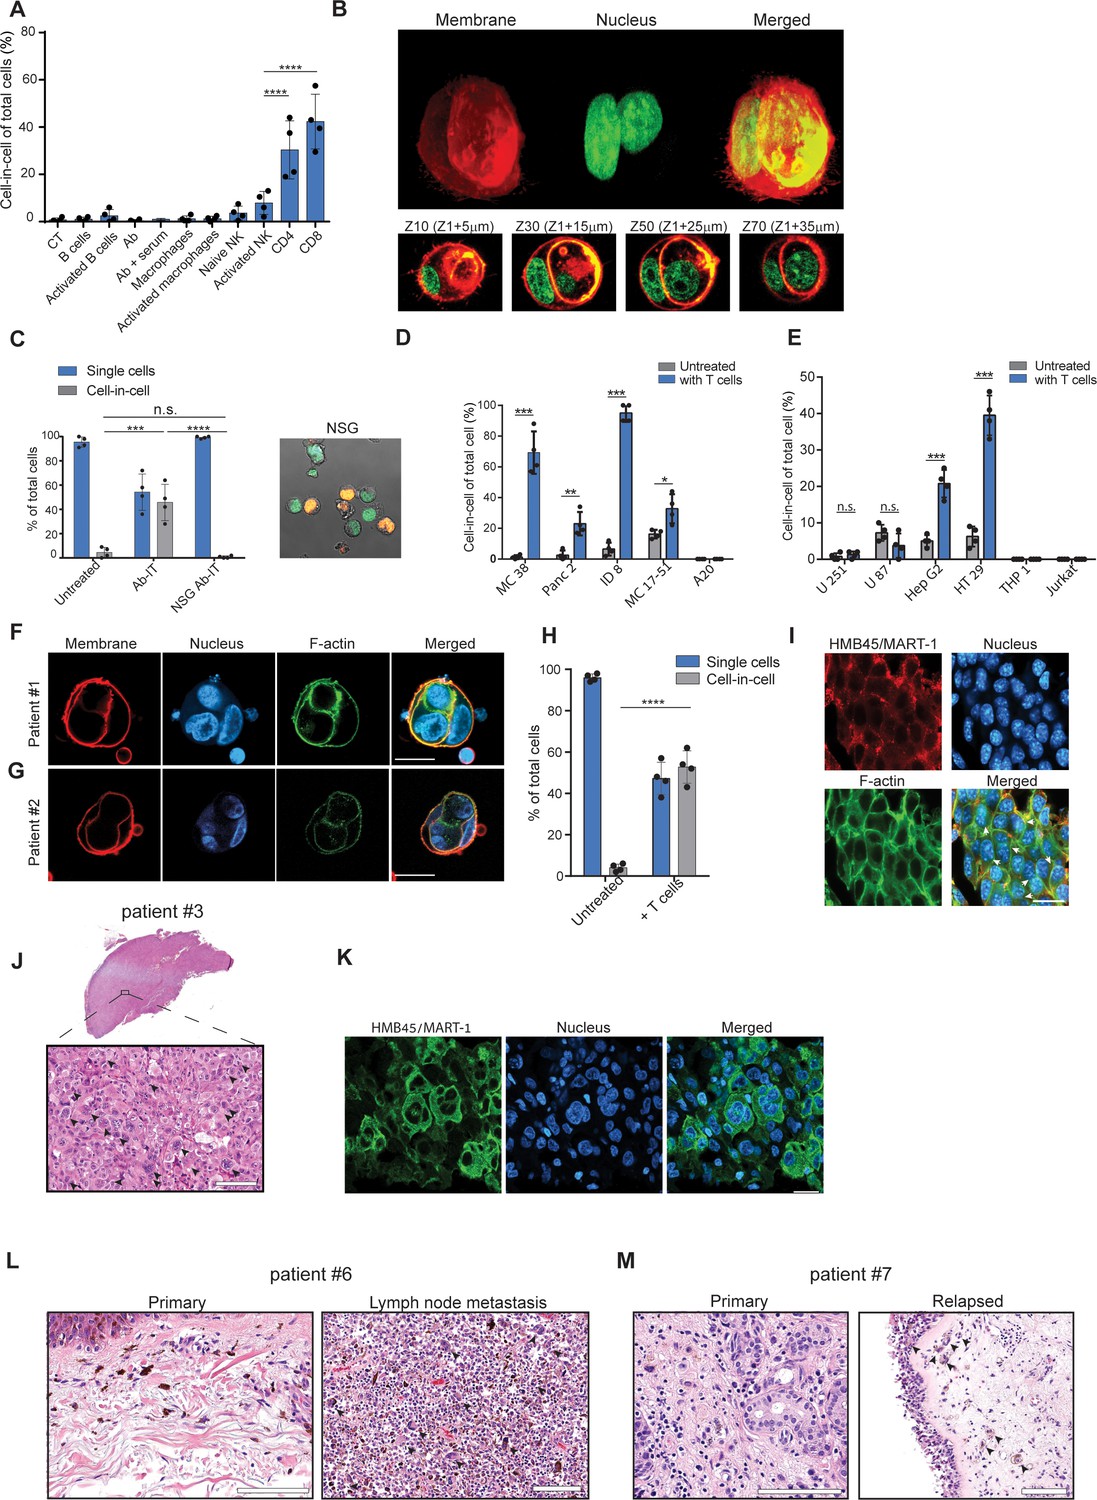
Tumor-reactive T cells induce transient cell-in-cell structure.
(A) Mean percentage of cell-in-cell tumor formations following incubation of B16F10 cells with immune cells (n=4). (B) Representative 3D projection and horizontal sections (Z-stack) of B16F10 cells incubated with gp100-reactive CD8+ T cells. (C) Mean percentage of cell-in-cell tumor formations and single cells in tumor-bearing NSG-/- mice treated with DC adjuvant and anti-TRP1 antibodies (n=4). (D) Mean counts of cell-in-cell tumor formations in mouse cancer cell lines cultured overnight with activated CD8+ T cells (n=4). (E) Mean counts of cell-in-cell tumor formations in human cancer cell lines cultured overnight with activated allogeneic CD8+ T cells (n=4). (F–G) Representative images of freshly-isolated human melanoma cells incubated overnight with autologous tumor-reactive T cells. (H) Mean percentage of cell-in-cell tumor formations following incubation of tumor cells isolated from melanoma patient with autologous tumor-reactive T cells (four technical replicates). (I) Histological section of human melanoma in NSG-/- mice 7 days after treatment with patient autologous TIL and high-dose IL-2. (J) H&E staining of histological sections of involved lymph node from metastatic melanoma patient. (K) Immunostaining of involved lymph nodes from metastatic melanoma patient. (L) H&E staining of histological sections of primary and sentinel lymph nodes from untreated stage IV melanoma patients. (M) H&E staining of histological sections of untreated primary and relapsed melanoma patient. Statistical significance was calculated using ANOVA with Tukey’s correction for multiple comparisons (* denotes p<0.05, ** denotes p<0.01 *** denotes p<0.001, and **** denotes p<0.0001). Error bars represent standard error. Scale bars = 20 μm.
Figure 3—figure supplement 1
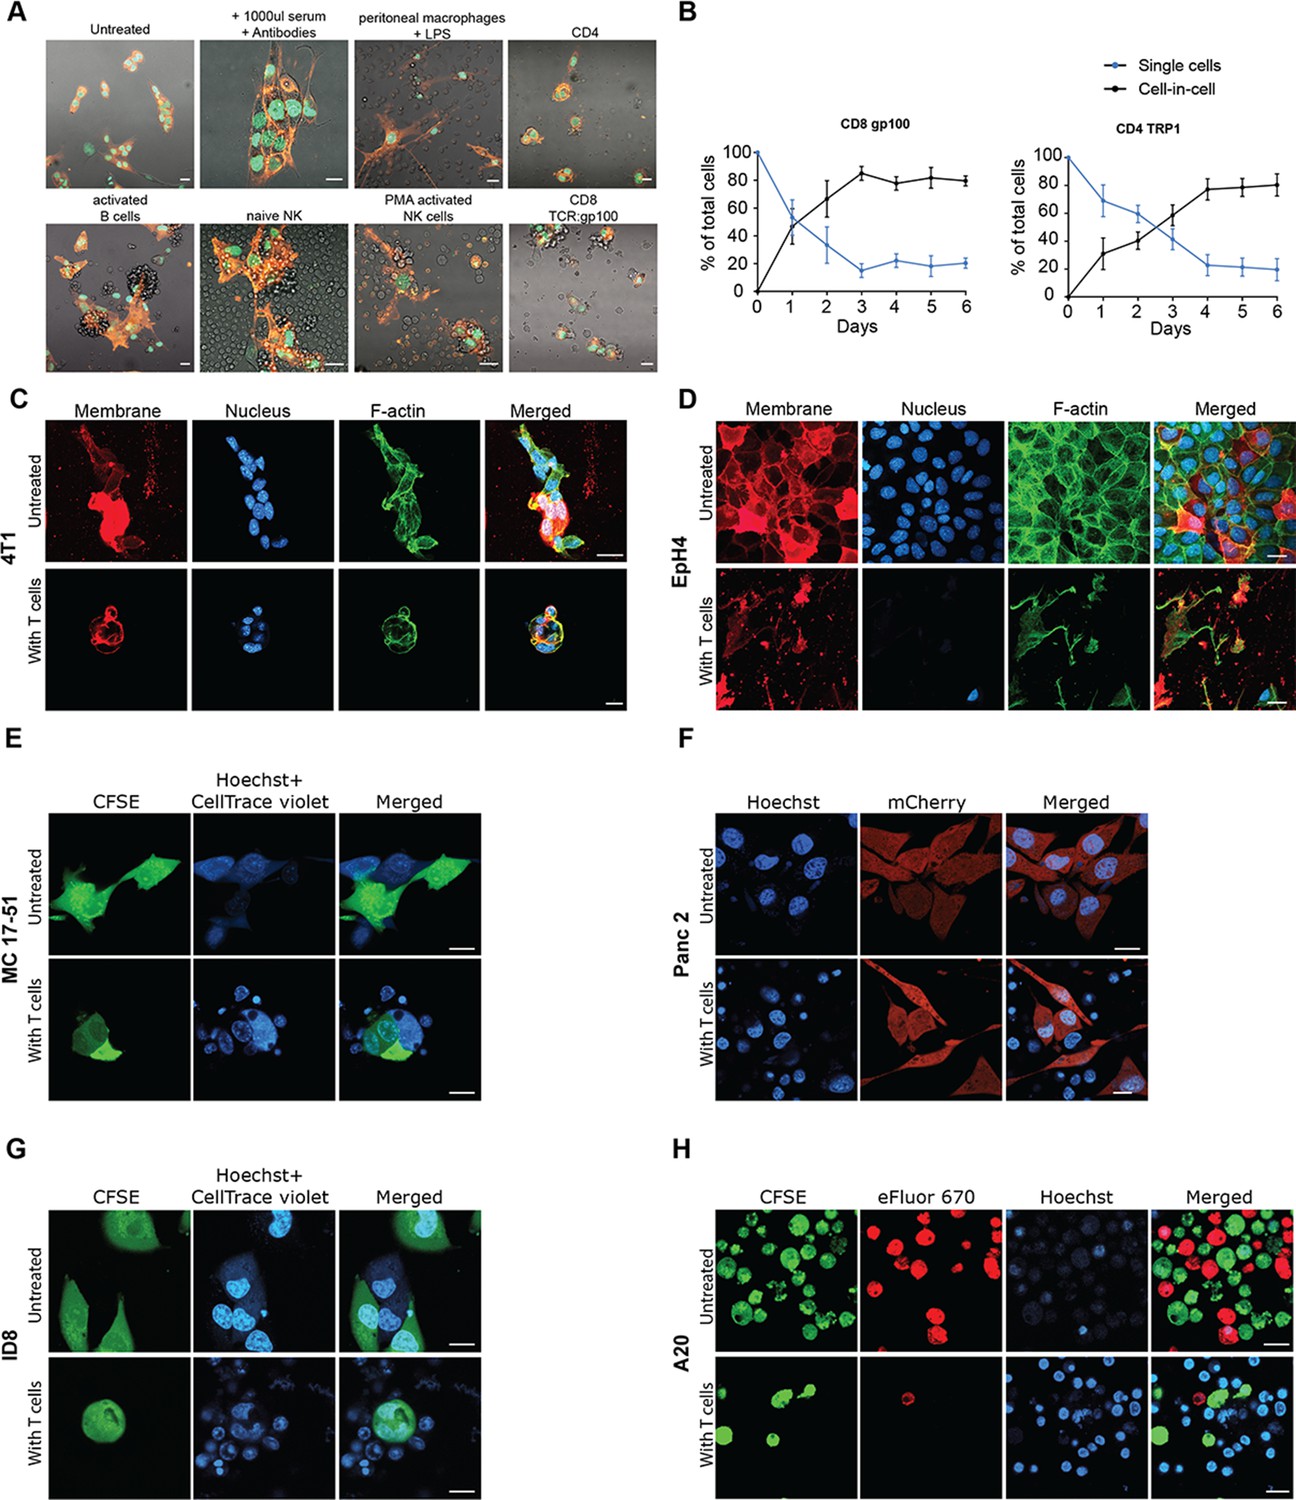
Murine tumor cell lines undergo cell-in-cell formation incubation with reactive T cells, Related to Figure 2 and Figure 3.
(A) Representative images of B16F10 cells following incubation with different immune cell subsets from naïve mice. (B) Mean percentage over time of cell-in-cell and simple cells from B16F10 tumor incubated with gp100-reactive CD8+ or TRP1-reactive CD4+ T cells (n=4). (C) Representative images of breast epithelial cancer cells (4T1) incubated with allogeneic T cells (D). Representative images of breast epithelial non-transformed cells (EPH4) incubated with allogeneic T cells. (E) Representative confocal images of B16F10 and 4T1 incubated overnight with gp100-reactive or allogenic CD8+ T cells, respectively. (E-H). Representative images of murine cancer cell lines incubated overnight with activated allogeneic splenic CD8+ T cells. All experiments were repeated at least three times. Scale bars = 20 μm.
Figure 3—figure supplement 2
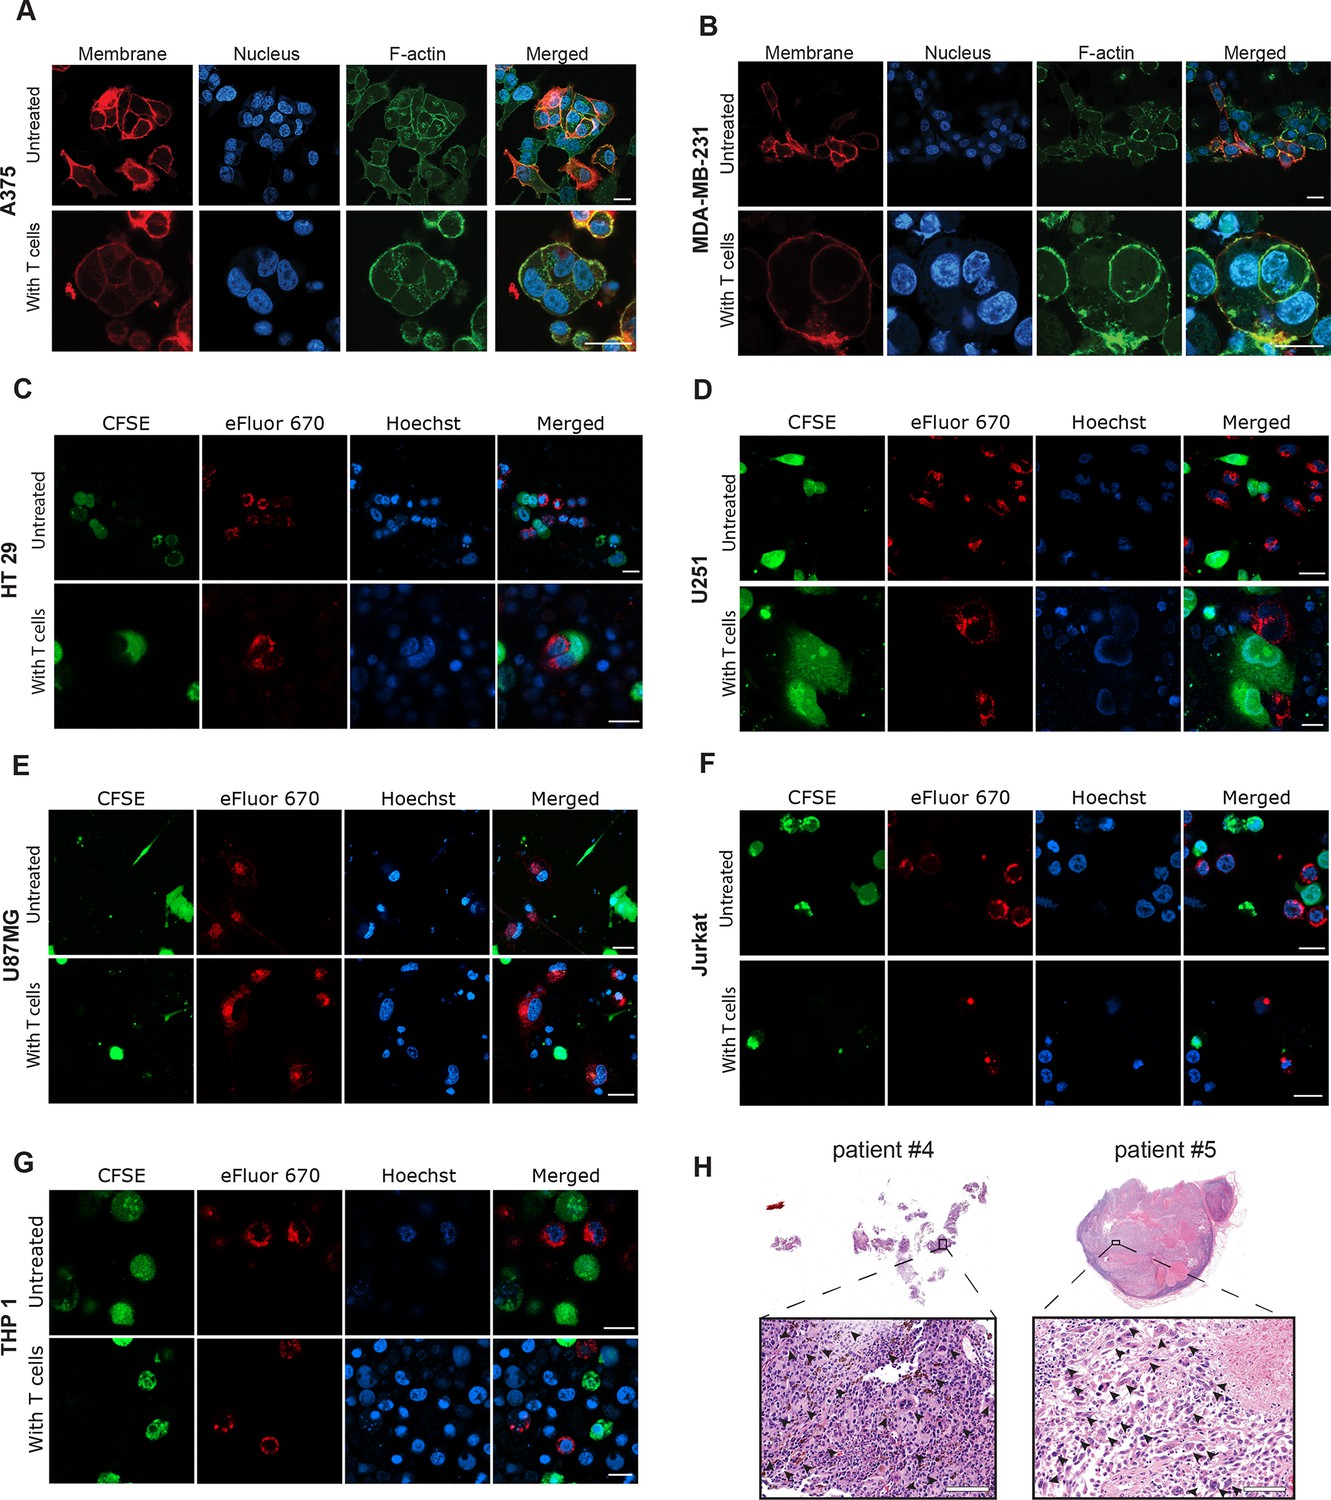
Human tumor cells undergo cell-in-cell formation following incubation with reactive T cells, Related to Figure 2 and Figure 3.
(A-G) Representative images of human cancer cell lines incubated overnight with allogeneic T cells from healthy donors. (H) H&E staining of involved lymph nodes from metastatic melanoma patients. All experiments were repeated at least three times. Scale bars = 20 μm.
Figure 3—video 1
B16 cell-in-cell induction in vitro following incubation with gp100-reactive T cells, related to Figure 3.
Figure 3—video 2
HT29 cell-in-cell induction in vitro following incubation with allogeneic T cells, related to Figure 3.
Figure 4 with 1 supplement
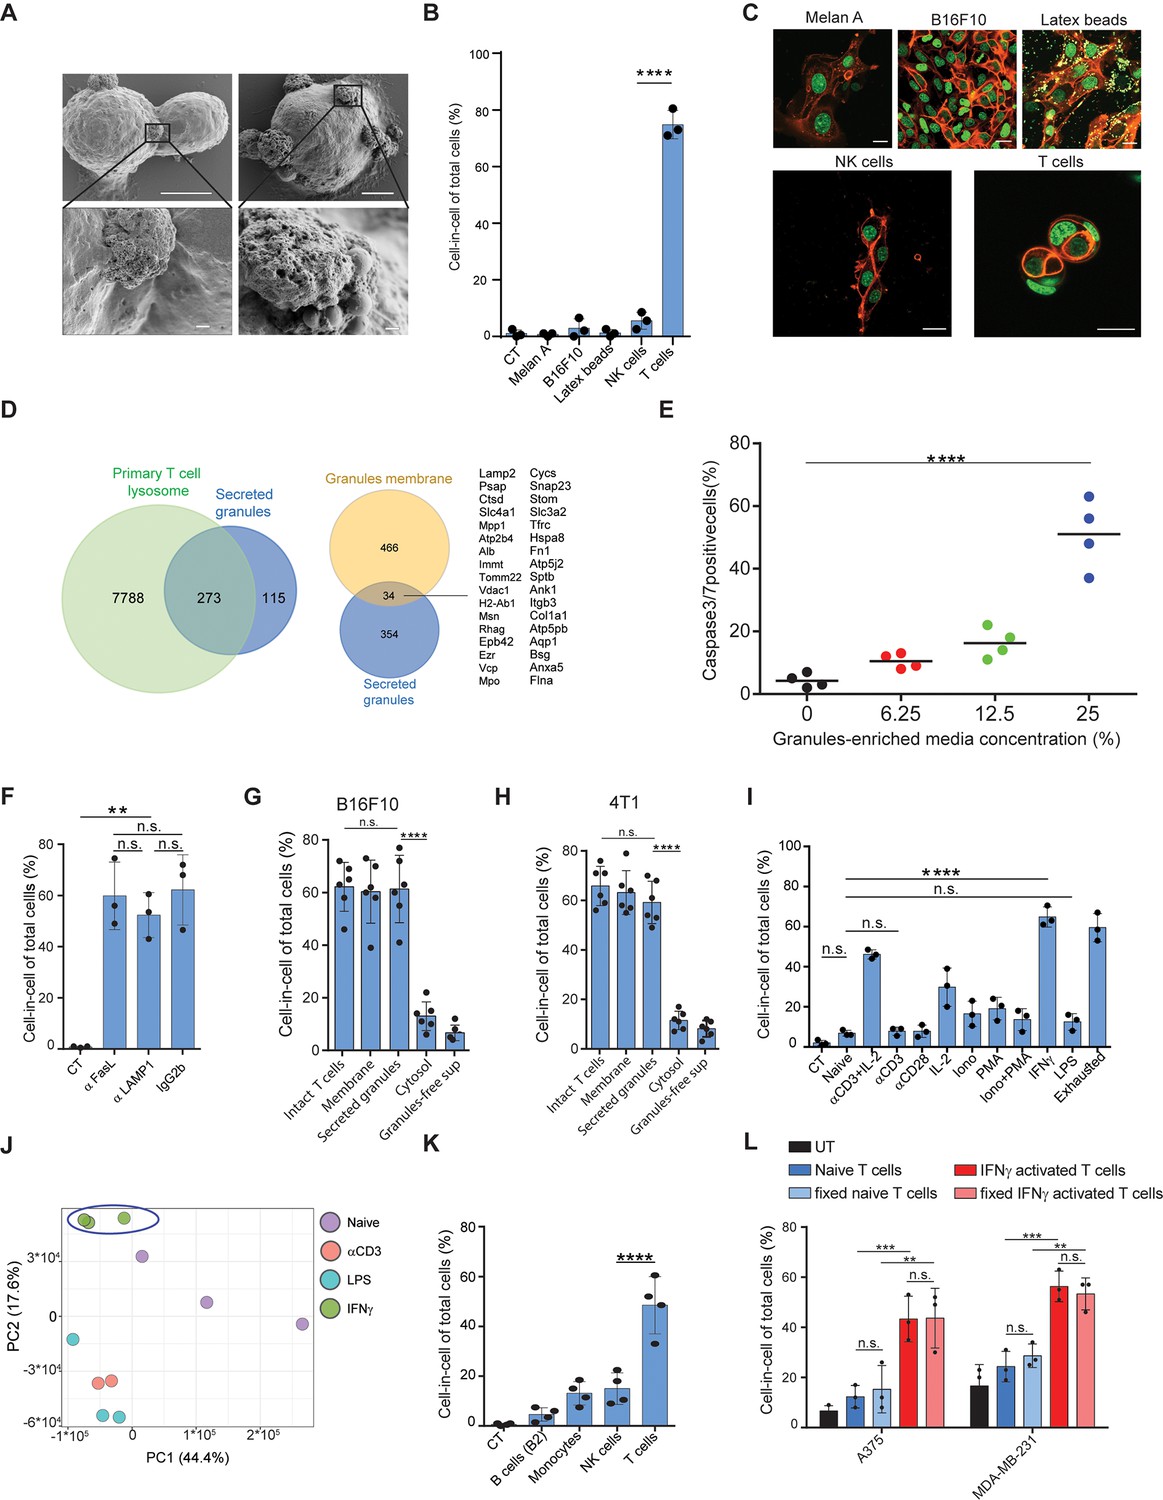
IFNγ induces membrane-associated proteins on T cells that mediate tumor cell-in-cell formation.
(A) SEM analysis of B16F10 incubated overnight with gp100-reactive CD8+ T cells. (B) Mean percentage of cell-in-cell formation of B16F10 incubated overnight with latex beads, B16F10 and Melan A melanosomes, NK- and T cell-derived granules (n=3). (C) Representative images of B16F10 incubated overnight with latex beads, B16F10 and Melan A melanosomes, NK- and T cell-derived granules. (D) Overlap of the total genes, detected by mass-spectrometry of T cell secreted granules and genes related to primary human T cell granules (left diagram) or granules-membrane related genes (right diagram). (E) Mean percentages of apoptotic tumor cells following overnight incubation with T cell-derived granules. (F) Mean percentage of cell-in-cell formation following overnight incubation with granules-blocking antibodies (n=3). (G) Mean percentage of B16F10 cell-in-cell formations following overnight incubation with T cells compartments (n=6). (H) Mean percentage of 4T1 cell-in-cell formations following overnight incubation with T cells compartments (n=6). (I) Mean percentage of cell-in-cell formation following incubation with T cells pre-activated with different stimulators (n=3). (J) PCA of expression profiles of naïve and activated CD8+ T cells (K) Mean percentage of cell-in-cell formations following overnight incubation with IFNγ-activated immune cells. (n=4). (L) Mean percentage of human cell-in-cell formations following overnight incubation with IFNγ-activated CD8+ T cells from healthy donors. (n=3). Experiments were repeated independently at least three times. Statistical significance was calculated using ANOVA with Tukey’s correction for multiple comparisons (**denotes p<0.001, *** denotes p<0.0001, **** denotes p<0.0001). Error bars represent standard. Scale bars = 5 μm (A top), 500 nm (A bottom), 20 μm (C).
Figure 4—figure supplement 1
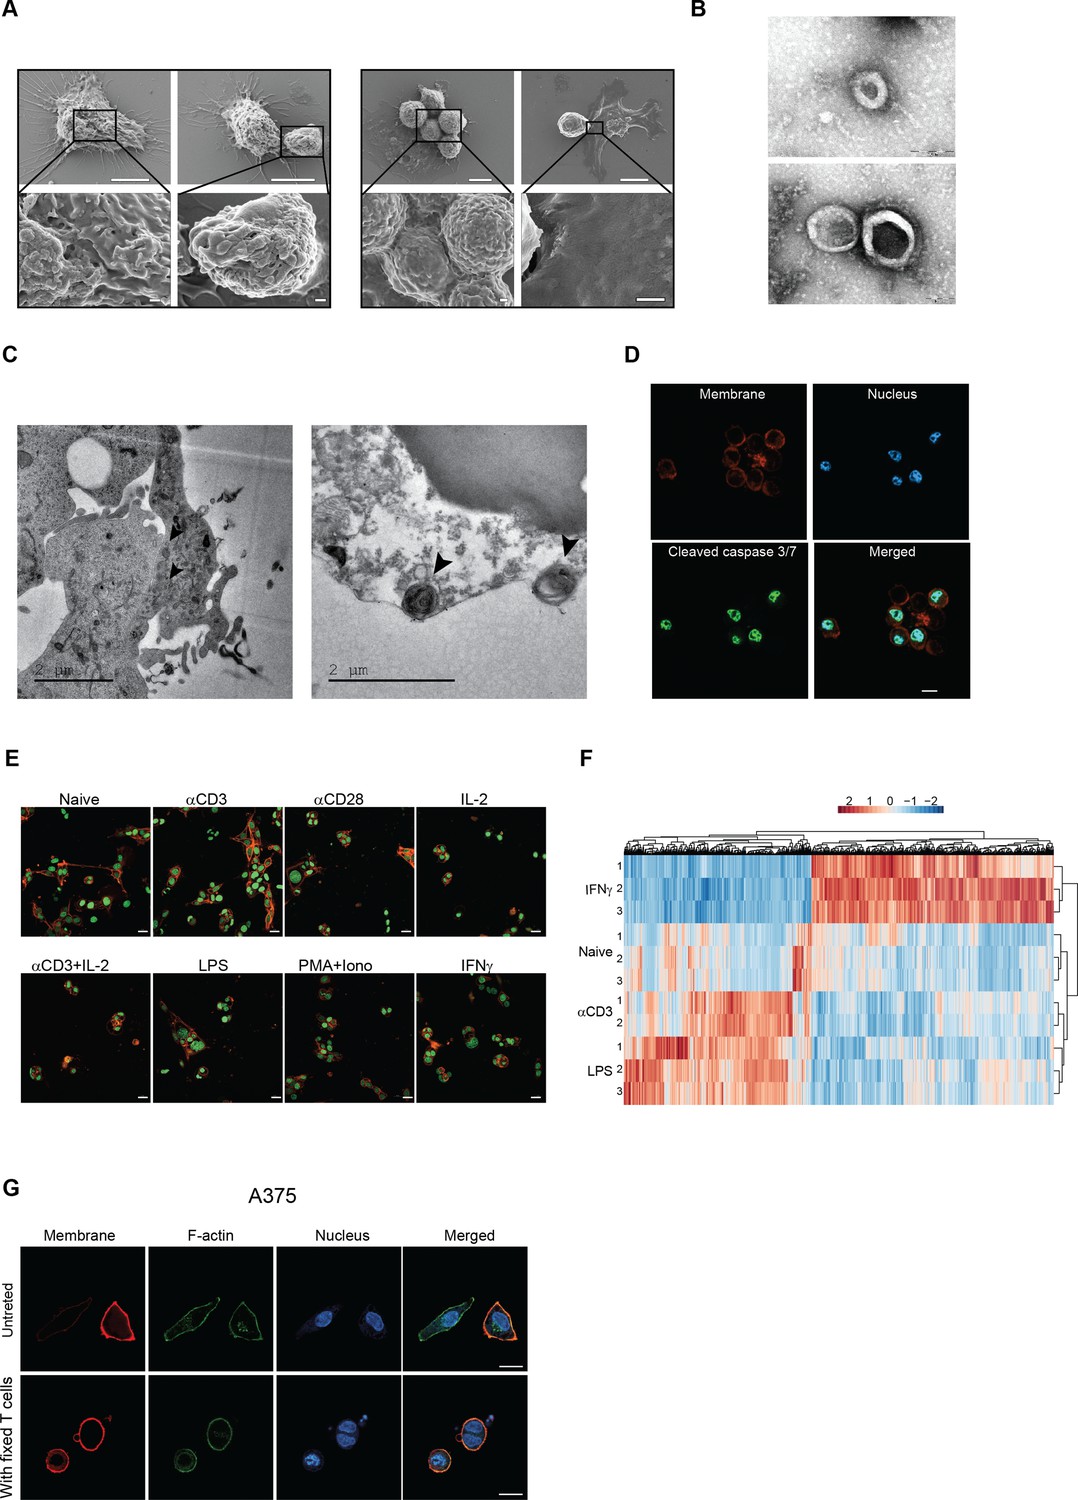
IFNg-activated T cells induce cell-in-cell tumor formation, Related to Figure 4.
(A) SEM analysis of B16F10 incubated with macrophages (left square) or NK cells (right square). (B) Transmission electron microscopy of T cells secreted granules, collected 48 hours after activation with immobilized aCD3/aCD28 antibodies. (C) Representative image of a single-layer transmitting electron microscopy of T cells incubated overnight with B16F10 cells. (D) Representative image of B16F10 incubated overnight with T cell-derived secreted granules containing media. (E) Representative images of B16F10 incubated overnight with activated T cells. (F) Heatmap of gene expression patterns of naïve and activated CD8+ T cells. (G) Confocal microscopy images of human melanoma incubated overnight with allogeneic T cells from healthy donors. Scale bars = 5 μm (A top), 500 nm (A bottom, B), 20 μm (D, E, G).
Figure 5 with 2 supplements
Cell-in-cell formations spatially prevent the penetration of T cell-derived lytic granules to the inner tumor cells.
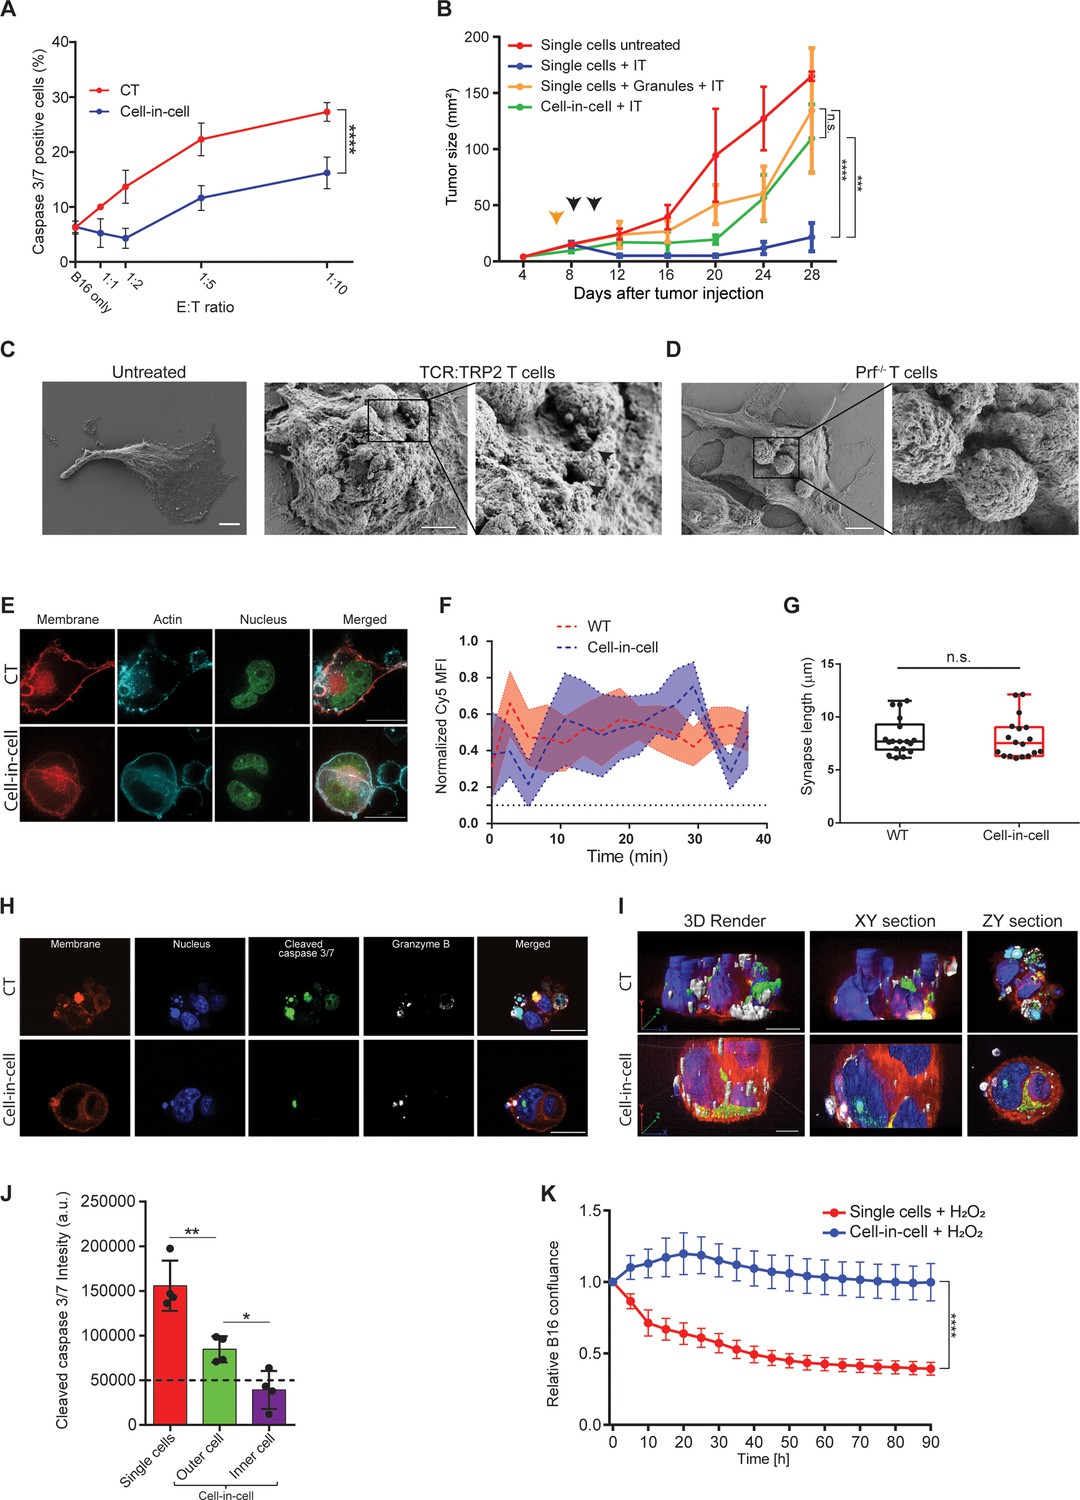
(A) Mean percentages of apoptotic tumor cells following overnight incubation with gp100-reactive CD8+ T cells. (B) B16F10 tumor size following treatment with DC adjuvant and anti-TRP1 antibodies (IT). B16F10 were injected as single cells, with or without injection of T cell-secreted granules (Granules), or as cell-in-cell. Black arrowheads indicate IT, yellow arrowhead indicates granules injection. (C–D) SEM analysis of B16F10 incubated with TRP2-reactive CD8+ T cells from WT (C) or Prf1-/- mice (D). (E) Confocal plane image of B16F10 incubated with tumor-reactive CD8+ T cells. (F) Normalized intensity of T cell’s cortical actin (Cy5) over time at immunological synapses (n=5). (G) Immunological synapse length between B16F10 and tumor-reactive CD8+ T cells (n=18). (H) Confocal plane image of B16F10 incubated with tumor-reactive CD8+ T cells. (I) 3D rendering and surface detection and 3D sections (XY and ZY planes) of B16F10 cells incubated with tumor-reactive CD8+ T cells. (J) Mean fluorescence intensity of cleaved caspase 3/7 in B16F10 tumor cells following incubation with gp100-reactive CD8+ T cells (n=3). (K) Relative confluence over time of B16F10 single cell or cell-in-cell, cultured following incubation with H2O2 (n=3). Experiments were repeated independently at least three times. Statistical significance was calculated using ANOVA with Tukey’s correction for multiple comparisons (* denotes p<0.05, ** denotes p<0.01, *** denotes p<0.001, **** denotes p<0.0001). Error bars represent standard error. Scale bars = 5 μm (C, D), 20 μm (E, H, I).
Figure 5—figure supplement 1
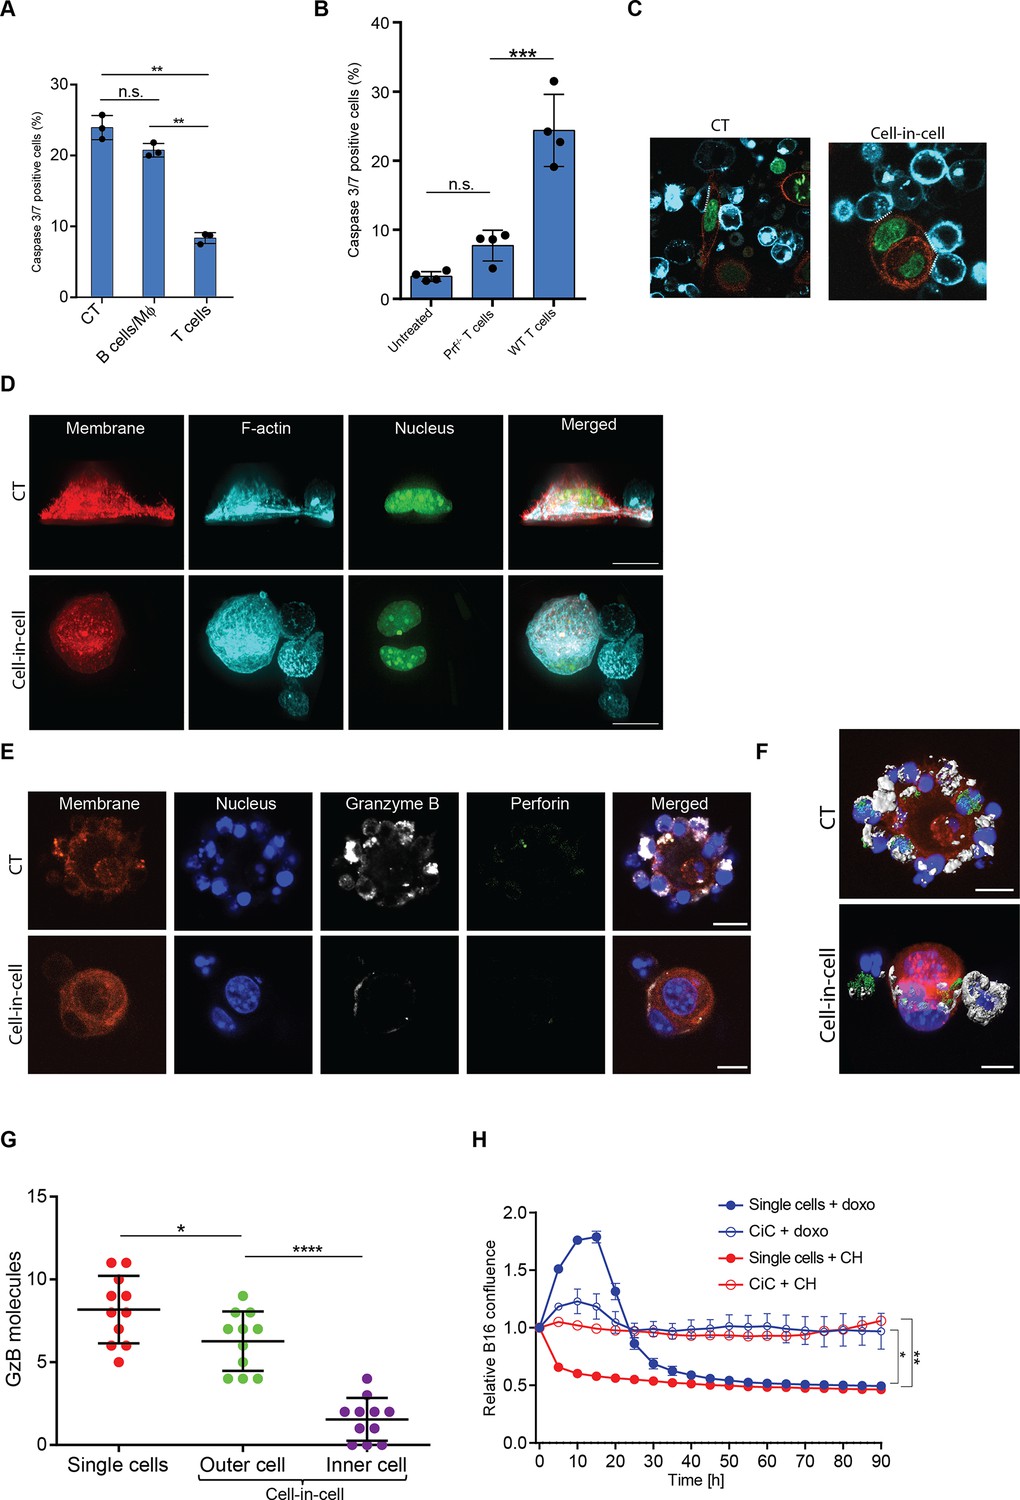
Cell-in-cell tumor formations are recognized but not killed by reactive T cells, related to Figure 5.
(A) Mean percentage of apoptotic B16F10, pre-incubated with secreted granules from activated immune cells, and following overnight incubation with gp100-reactive T cells (n=3). (B) Mean percentage of apoptotic B16F10 following overnight incubation with gp100-reactive T cells (n=4). (C) Representative images of B16 single cells or cell-in-cell culture gp100-reactive T cells. Dashed lines indicate immunological synapses. (D) 3D rendering of B16F10 following incubation with tumor-reactive T cells. (Relates to Figure 5E). (E) Confocal plane image of B16F10 incubated with tumor-reactive CD8+ T cells. (F) 3D rendering of B16F10 following incubation with tumor-reactive T cells. (Relates to Figure S6E). (G). Granzyme B molecules prevalence inside B16F10 cells following incubation with tumor reactive T cells. (H) Relative confluence over time of B16 single cells or cell-in-cell (CiC) culture following incubation with doxorubicin (doxo) or cycloheximide (CH). Experiments were repeated at least three times. Statistical significance was calculated using ANOVA with Tukey’s correction for multiple comparisons (*denotes p<0.05, **denotes p<0.01, *** denotes p<0.001, **** denotes p<0.0001). Error bars represent standard error. Scale bars = 20 μm.
Figure 5—video 1
B16 cell-in-cell interaction with gp100-reactive T cells, related to Figure 5.
Figure 6 with 2 supplements
STAT3 and EGR1 signaling govern T cell-mediated cell-in-cell tumor formation.
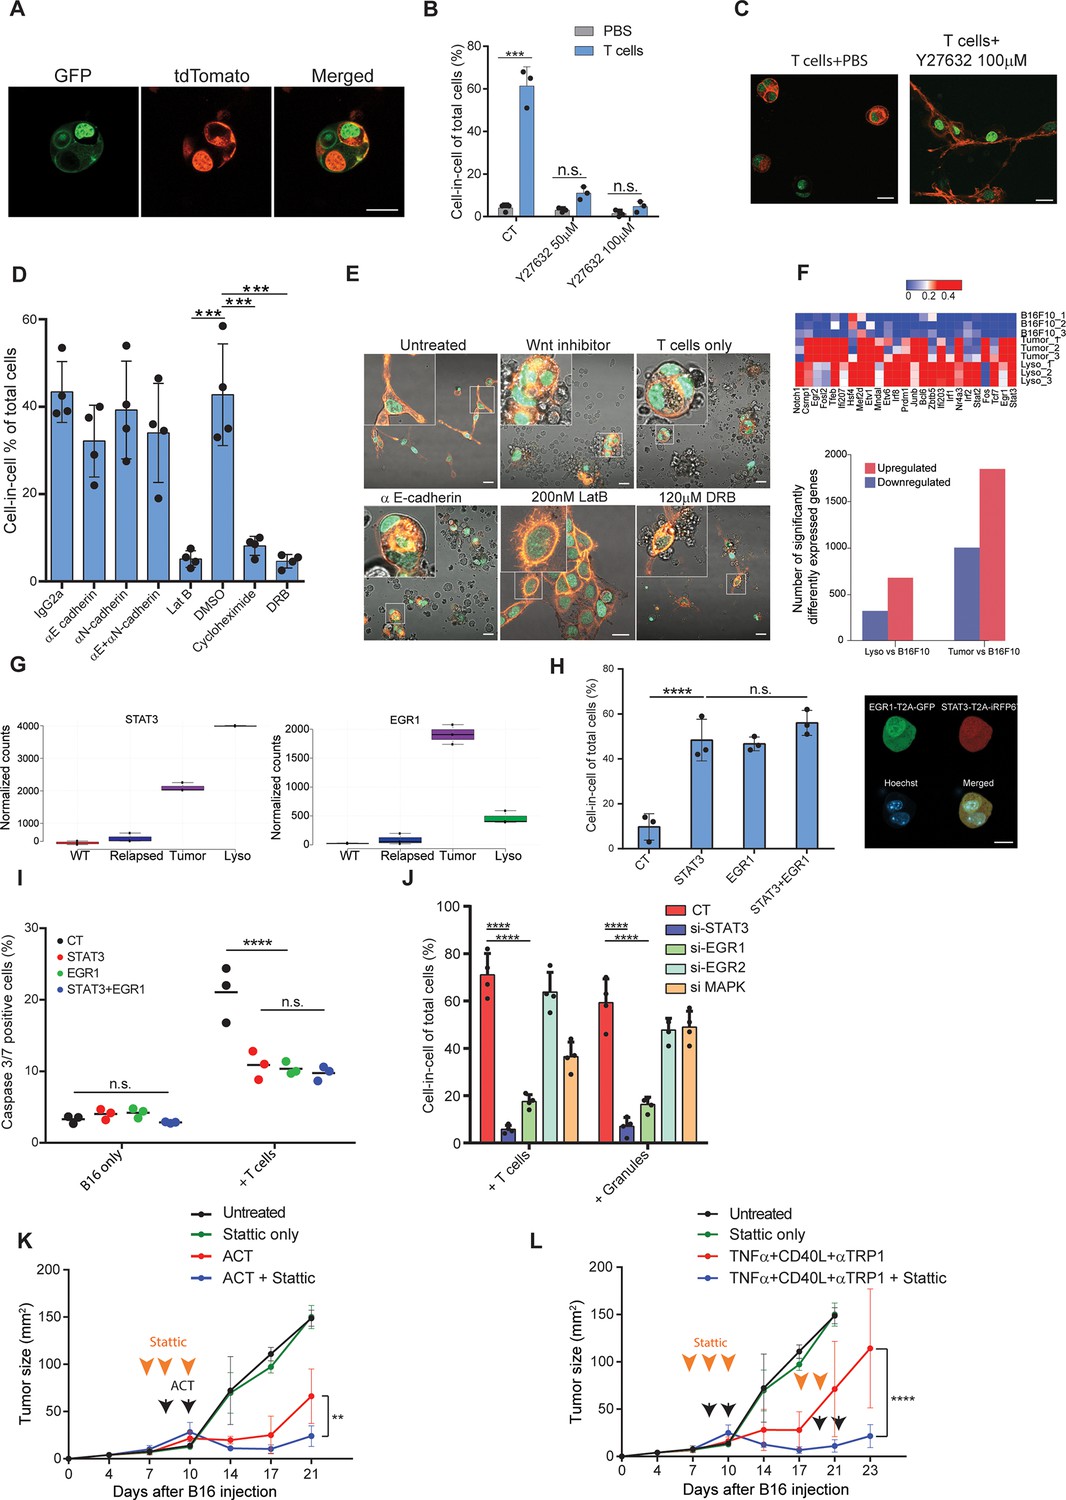
(A) Representative images of B16F10, co-expressing Lifeact-GFP and H2b-tdTomato or MyrPalm-tdTomato and H2b-GFP, following incubation with gp100-reactive T cells. (B) Mean percentage of cell-in-cell tumor formations in B16F10 following overnight incubation with gp100-reactive CD8+ T cells with or without ROCK inhibitor (n=3). (C) Representative images of cell-in-cell tumor formations in B16F10 following overnight incubation with gp100-reactive CD8+ T cells with or without ROCK inhibitor. (D) Mean percentage of cell-in-cell tumor formations in B16F10 cells following overnight incubation with specific inhibitors and reactive CD8+ T cells (n=4). (E) Representative images of B16F10 cells treated with inhibitors and incubated overnight with gp100-reactive CD8+ T cells. (F) Significantly increased genes in B16F10 cells incubated with T cell-derived granules (Lyso) or isolated directly from relapsed tumors (Tumor), compared to B16F10 control cells (WT) (Bottom) and relative expression of the top 25 genes (Top) (n=3). (G) STAT3 and EGR1 expression levels in B16F10 cells isolated directly from relapsed tumors (Tumor) and after incubation with T-cell-derived granules (Lyso) compared to B16F10 control cells (WT) (n=3) (H) Mean percentage and representative images of cell-in-cell tumor formations in B16F10 48 hours after transfection with STAT3-T2A-iRFP670, EGR1-T2A-GFP or both (n=3). (I) Mean percentage of apoptotic B16F10, transfected with STAT3-T2A-iRFP670, EGR1-T2A-GFP or both, following incubation with tumor reactive T cells (n=3). (J) Mean percentage of cell-in-cell tumor formations in B16F10, transfected with siRNA, following incubation with tumor reactive T cells or T cells secreted granules. (K–L) B16F10 tumor size in mice treated with gp100-reactive T cells (ACT) (K) or Dc adjuvant and anti-TRP1 antibodies (L) with or without Stattic (n=4). Orange arrowheads indicate Stattic treatments and black arrowheads indicate injection of immunotherapies. All experiments were repeated independently at least three times. Statistical significance was calculated using ANOVA with Tukey’s correction for multiple comparisons (**denotes p<0.01, *** denotes p<0.001, **** denotes p<0.0001). Error bars represent standard error. Scale bars = 20 μm.
-
Figure 6—source data 1
Significantly elevated genes in both B16F10 cells incubated with T cell secreted granules and tumor cells sorted from treated animals, related to Figure 6.
- https://cdn.elifesciences.org/articles/80315/elife-80315-fig6-data1-v1.xlsx
-
Figure 6—source data 2
STAT3 and EGR1 pathways regulate cell-in-cell tumor formation, related to Figure 6.
- https://cdn.elifesciences.org/articles/80315/elife-80315-fig6-data2-v1.xlsx
-
Figure 6—source data 3
Log2 expression of genes related to cancer pathways in tumor cells sorted from treated animals compared to B16F10 WT, reated to Figure 6.
- https://cdn.elifesciences.org/articles/80315/elife-80315-fig6-data3-v1.xlsx
Figure 6—figure supplement 1
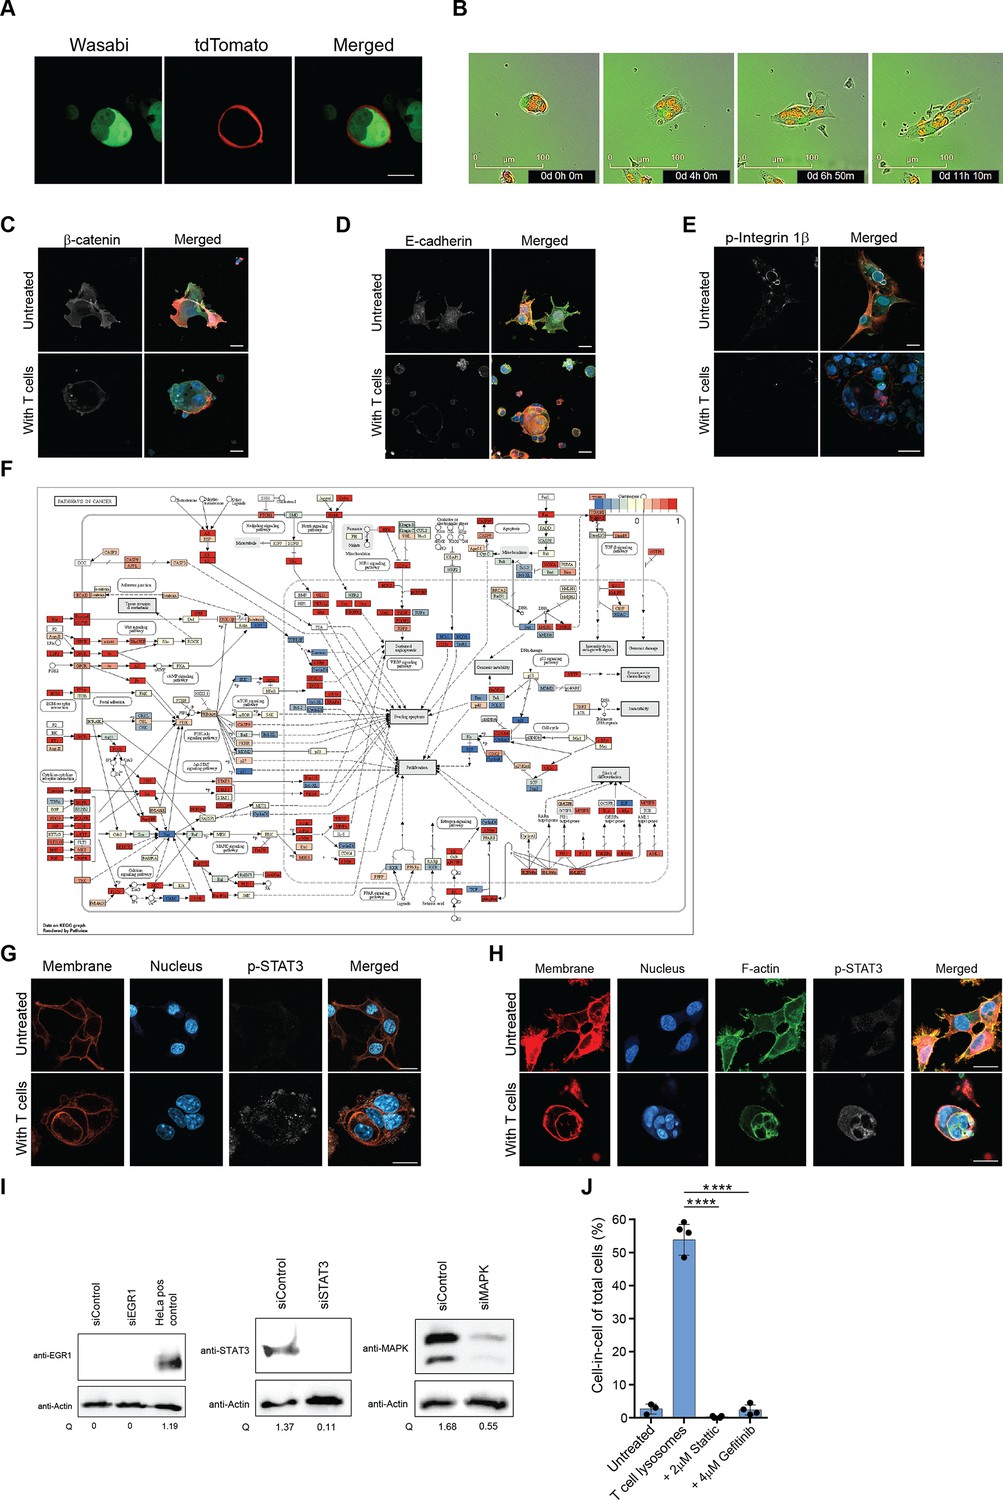
STAT3 and EGR1 pathways regulate cell-in-cell tumor formation, related to Figure 6.
(A) Representative images of B16F10 cell lines, which their cytosol is fluorescently labeled with either wasabi or with tdTomato, following overnight incubation with gp100-reactive T cells. (B) Representative images of B16F10 cells dissemination overtime following removal of gp100-reactive T cells (C-E). Representative images of untreated and cell-in-cell B16F10 cells of β-catenin (C), E-cadherin (D) and phosphorylated integrin 1β (E). (F) KEGG pathway enrichment plot of B16F10 tumor cells sorted from relapsed tumors in vivo following immunotherapy compared to B16F10 cells. (G) Representative images of phospho-STAT3 in B16F10 incubated overnight with gp100-reactive T cells. (H) Representative images of phospho-STAT3 in human breast cancer (MDA-MB-231) incubated overnight with allogenic T cells. (I) Relative quantification of STAT3, MAPK, and EGR1 protein levels in B16F10 cells, following treatment with siRNA. HeLa cells were used as positive control for the EGR1 protein levels. (J) Mean percentage of cell-in-cell of B16F10 cells incubated overnight with reactive T cells in the presence of STAT3 and EGFR inhibitors. Experiments were repeated at least three times. Statistical significance was calculated using ANOVA with Tukey’s correction for multiple comparisons (**** denotes p<0.0001). Error bars represent standard error. Scale bars = 20 mm.
Figure 6—video 1
B16 cell-in-cell dissemination in vitro following T cell wash, related to Figure 6.
Additional files
-
MDAR checklist
- https://cdn.elifesciences.org/articles/80315/elife-80315-mdarchecklist1-v1.pdf
-
Source data 1
Western blot images of phosphorylated genes in cells from cell-in-cell tumor formations, related to Figure 6.
- https://cdn.elifesciences.org/articles/80315/elife-80315-data1-v1.xlsx
Download links
A two-part list of links to download the article, or parts of the article, in various formats.
Downloads (link to download the article as PDF)
Open citations (links to open the citations from this article in various online reference manager services)
Cite this article (links to download the citations from this article in formats compatible with various reference manager tools)
Transient cell-in-cell formation underlies tumor relapse and resistance to immunotherapy
eLife 11:e80315.
https://doi.org/10.7554/eLife.80315


