Individual behavioral trajectories shape whole-brain connectivity in mice
- German Center for Neurodegenerative Diseases (DZNE) Dresden, Germany
- Center for Regenerative Therapies Dresden (CRTD), TU Dresden, Germany
- Division of Psychological and Social Medicine and Developmental Neurosciences, Faculty of Medicine, Germany
- Department of Neuroimaging, Institute of Psychiatry, Psychology and Neuroscience King's College, United Kingdom
- Department of Child and Adolescent Psychiatry, Faculty of Medicine, Eating Disorder Treatment and Research Center, Germany
- Department of Basic and Clinical Neuroscience, Institute of Psychiatry, Psychology and Neuroscience, King's College, United Kingdom
- MRC Centre for Neurodevelopmental Disorders, King's College, United Kingdom
Figures
Figure 1

Emergence of inter-individual differences after environmental enrichment.
Pictures (A) of the “individuality” cage—a custom build RFID cage with 70 interconnected small cages and 115 antennae distributed in the connecting tunnels. Interindividual variance (B) of behavior increased over time. Subgrouping of mice (n = 15) based on the slopes of RE trajectories (C), blue: ‘down’, and red: ‘flat’. Animals living under enriched environment conditions (ENR) showed increased adult hippocampal neurogenesis (as assessed by proxy marker DCX) independent of behavioral trajectories (One-way ANOVA: F(2,37) = 17.3, p < 0.001; Tukey post-hoc: standard vs flat and standard vs down p < 0.01, flat vs down p = 0.46) (D). Correlations between the number of doublecortin positive cells in the dentate gyrus to RE values at time-block four in the enriched group (R2 = 0.20, p = 0.005) (E), down subgroup (R2 = 0.39, p = 0.012) (F), and flat subgroup (R2 = 0.20, p = 0.095) (G). Box and whisker plots: center line - median; upper and lower hinges - first and third quartiles; whiskers - highest and lowest values within 1.5 times the interquartile range outside hinges; dots - individual data points.
Figure 2 with 4 supplements
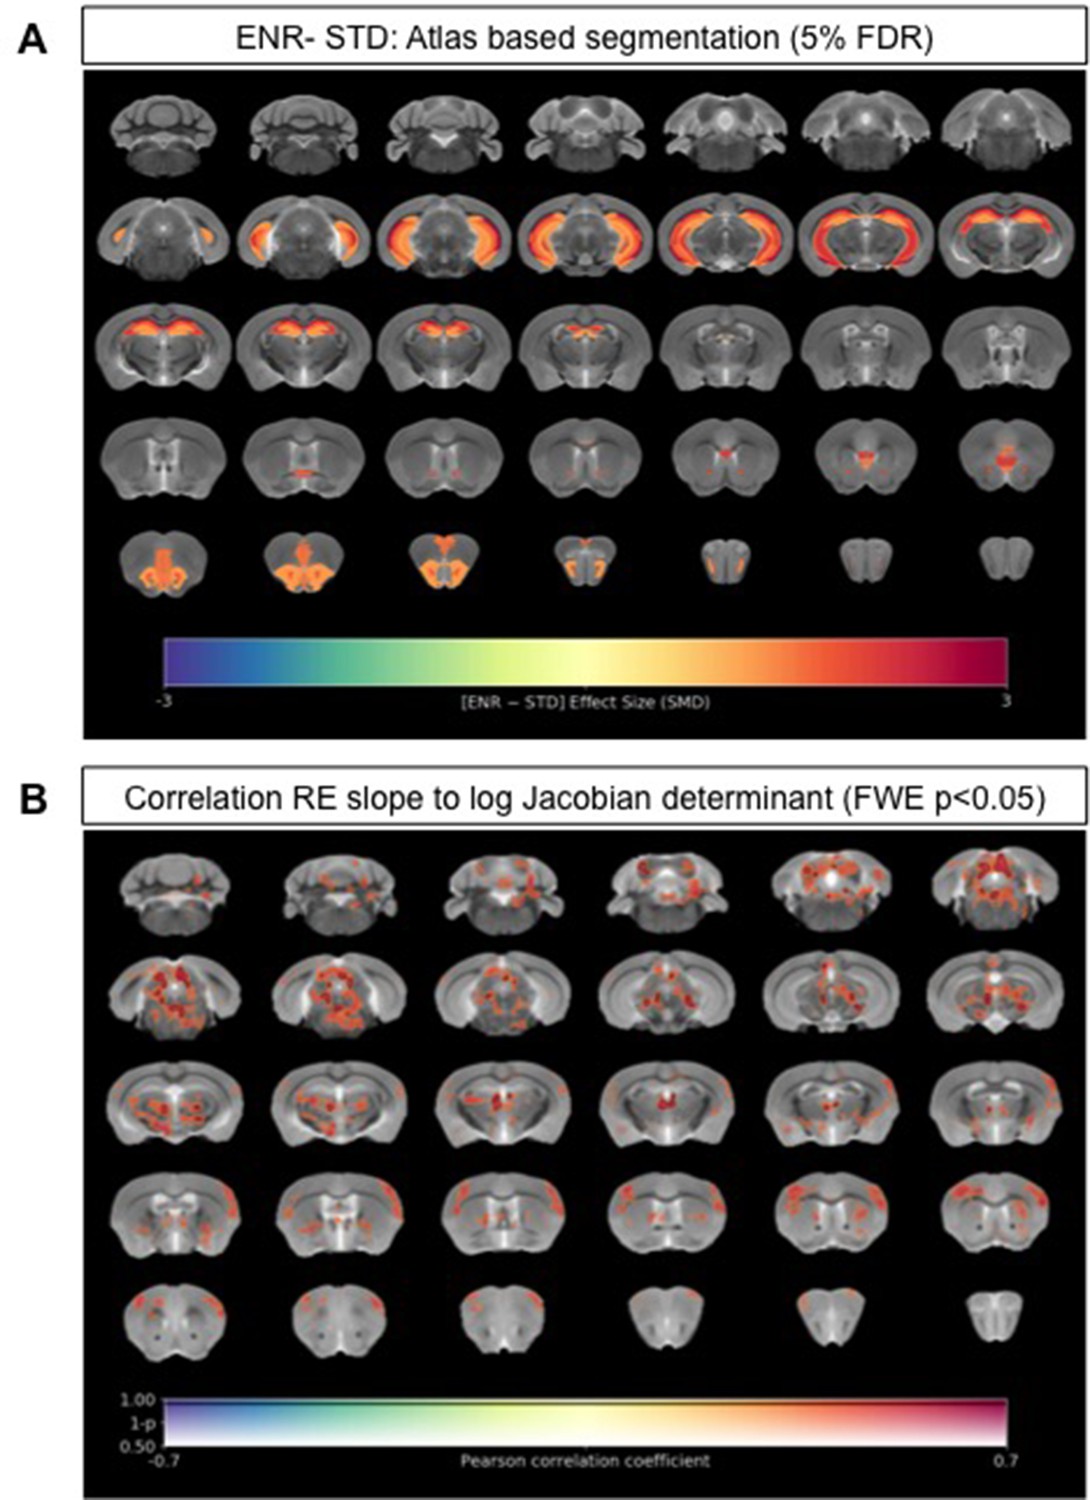
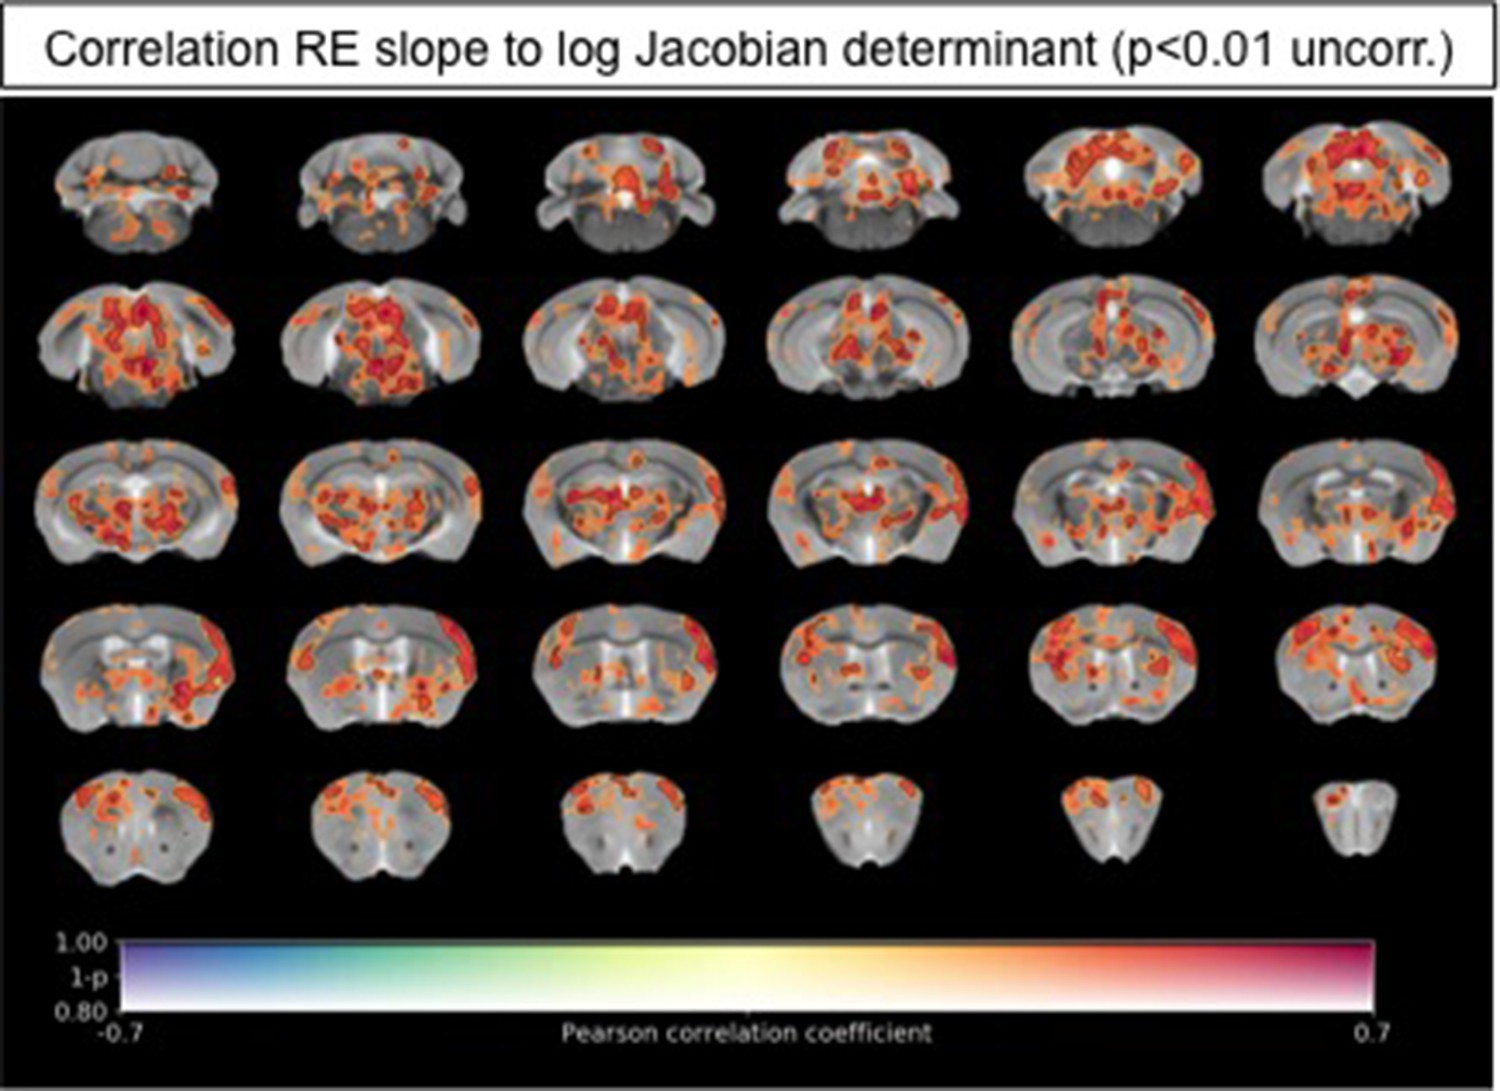
Neuroanatomical differences associated with exposure to an enriched environment and with variation in roaming entropy as measured by ex vivo structural MRI.
(A) Map of regional differences in absolute volume (mm3) extracted using the DSURQE mouse brain atlas comparing ENR mice (N=38) to those in standard (STD) housing (N=10). Only atlas regions of interest (ROI) that survive multiple comparisons correction are shown (False Discovery Rate, 5%). Data shown for each statistically significant ROI is the standardized mean difference (SMD) comparing ENR – STD housed mice. Warm colors indicate regional volume increases, whilst cold colors indicate regional volume decreases in ENR-mice as compared to those in STD housing. (B) Positive correlation (Pearson’s r) between roaming entropy slope across all four time blocks and local brain absolute volume changes (log-scaled Jacobian determinant) for all mice in the ENR group (N=38). Voxel clusters with solid contours are significantly correlated to behavior at threshold of p<0.05 (FWE corrected) and voxels without contours correlate at p<0.001 uncorrected for multiple comparisons. Warm colors indicate positive correlation, such that local volume increases are seen in mice with higher RE scores.
Figure 2—figure supplement 1
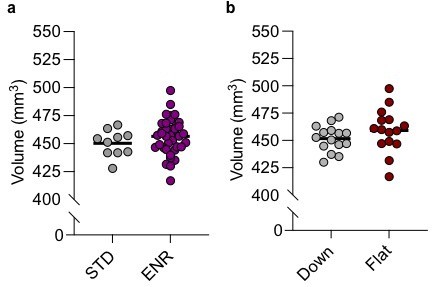
Total brain volumes (as measured by ex vivo structural magnetic resonance imaging [MRI]) do not differ significantly (2-tailed students t-test) when comparing either (a) STD (N=10)- vs. ENR-housed mice (N=38) or (b) Down (N=15) vs. Flat (N=15) subgroups of ENR-housed mice.
Each data point indicates the whole-brain volume (in mm3) for an individual mouse in each group. Solid horizontal line indicates the group mean.
Figure 2—figure supplement 2
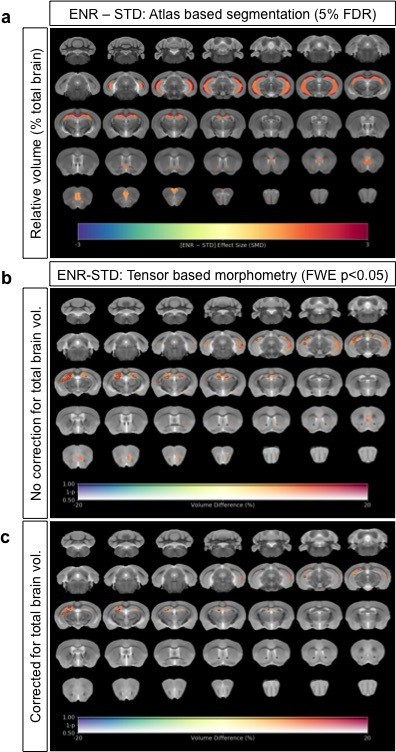
Neuroantomical differences comapring enriched and standard housed mice as measured by ex vivo structural MR.
(a) Map of regional differences in relative volume (% total brain volume) extracted using the DSURQE mouse brain atlas comparing ENR mice (N=38) to those in standard (STD) housing (N=10). Only atlas regions of interest (ROIs) that survive multiple comparisons correction are shown (false discovery rate, 5%). Data shown for each statistically significant ROI are the standardized mean difference (SMD) comparing ENR − STD-housed mice. Warm colors indicate regional volume increases, whilst cold colors indicate regional volume decreases in ENR mice as compared to those in STD housing. (b, c) Complementary voxel-wise tensor-based morphometry (TBM) to map localized neuroanatomical differences between ENR–STD mice. Data shown in (b, c) are the percentage difference in log-scaled Jacobian determinants either without correction for total brain volume (b; absolute volumes) or with correction for total brain volume (c; relative volumes) between ENR- and STD-housed mice. Voxels with solid black contours survive a stringent multiple comparisons correction (family-wise error p < 0.05) all other voxels reflect an exploratory threshold of p < 0.05 uncorrected for multiple comparisons. Warm colors indicate voxels with increased volume comparing ENR to STD mice, whilst cold colors indicate voxels with reduced volume.
Figure 2—figure supplement 3
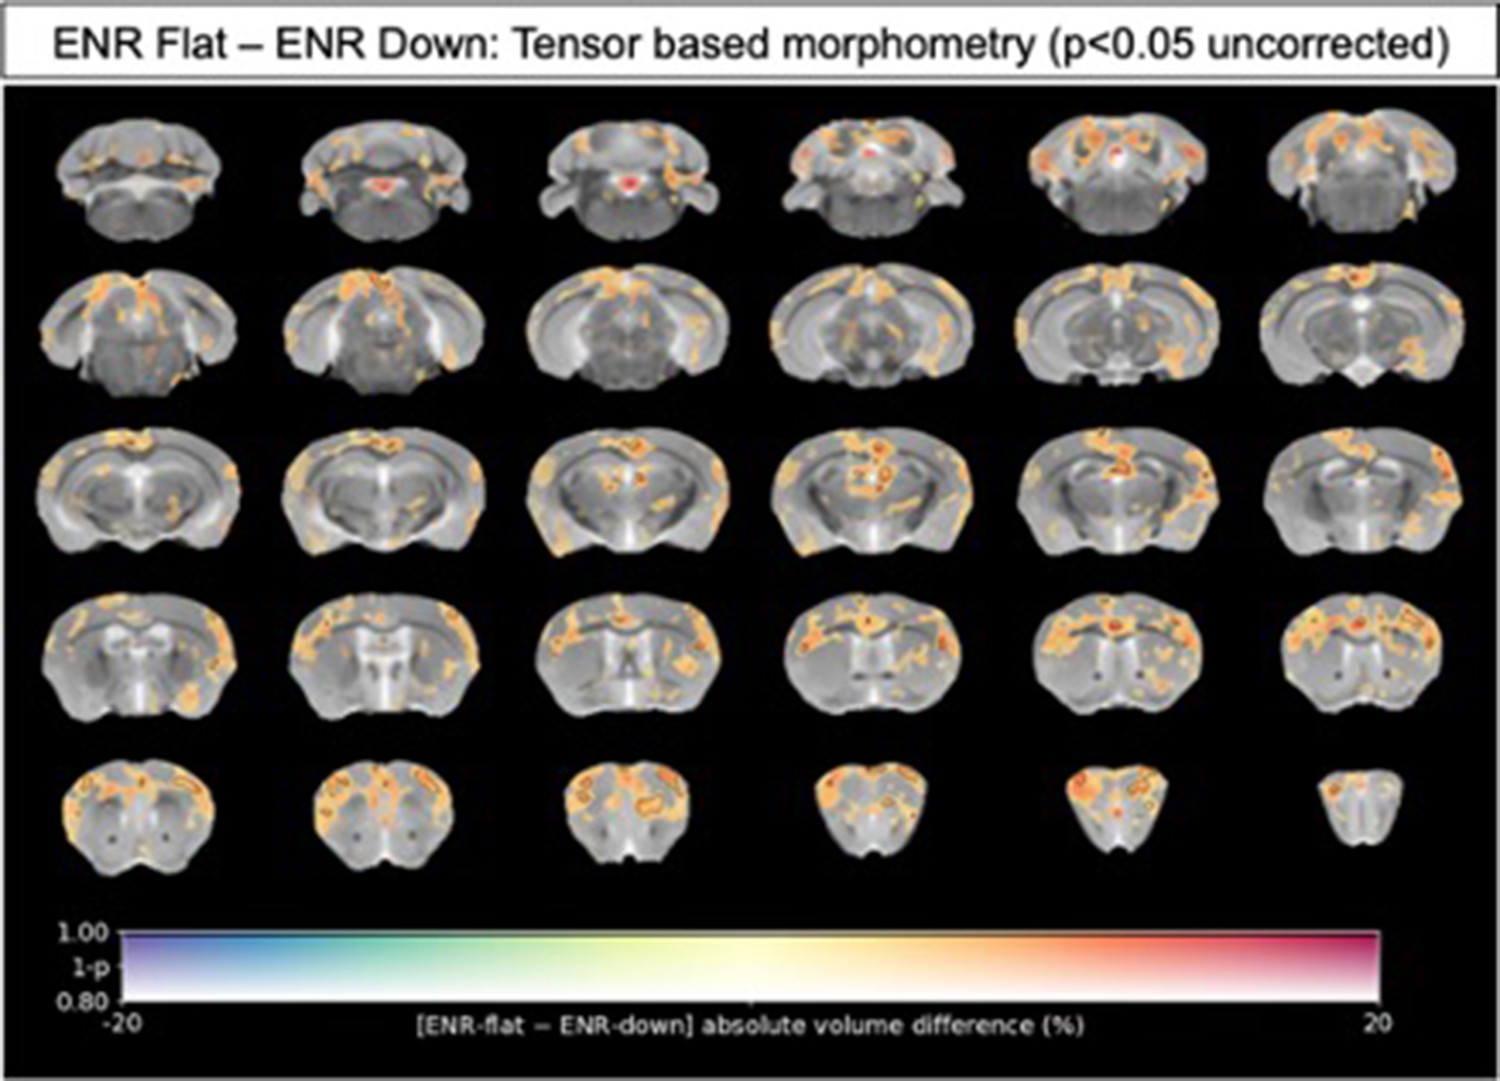
Voxel-wise tensor-based morphometry (TBM) to map localized neuroanatomical differences between Flat and Down subgroups of ENR-housed mice.
Data shown are the percentage difference in log-scaled Jacobian determinants without correction for total brain volume (absolute volumes) between Flat (N=15) and Down (N=15) subgroups of ENR-housed mice. There were no statistically significant localized volume differences between the groups after a stringent correction for multiple comparisons (family-wise error p < 0.05). Voxels with solid black contours therefore represent apparent local volume differences between Flat and Down mice at an exploratory threshold of p < 0.05 uncorrected for multiple comparisons. Warm colors indicate voxels with apparent increases volume comparing Flat to Down mice, whilst cold colors indicate voxels with apparent reductions in volume.
Figure 2—figure supplement 4
Relationship between RE and local volume changes in Down and Flat roaming mice.
Data shown are the correlation (Pearson’s r) between roaming entropy slope across all four time blocks and local brain absolute volume changes (log-scaled Jacobian determinant) for mice clustering into the ‘flat’ and ‘down’ groups. Voxel clusters with solid contours are significantly correlated to behavior at an exploratory threshold of uncorrected p < 0.01. No changes were detected after correction for multiple comparisons (FWE p < 0.05). Warm colors indicate positive correlation, suggesting increased volumes in ‘flat’ as compared to ‘down’ mice.
Figure 3 with 1 supplement
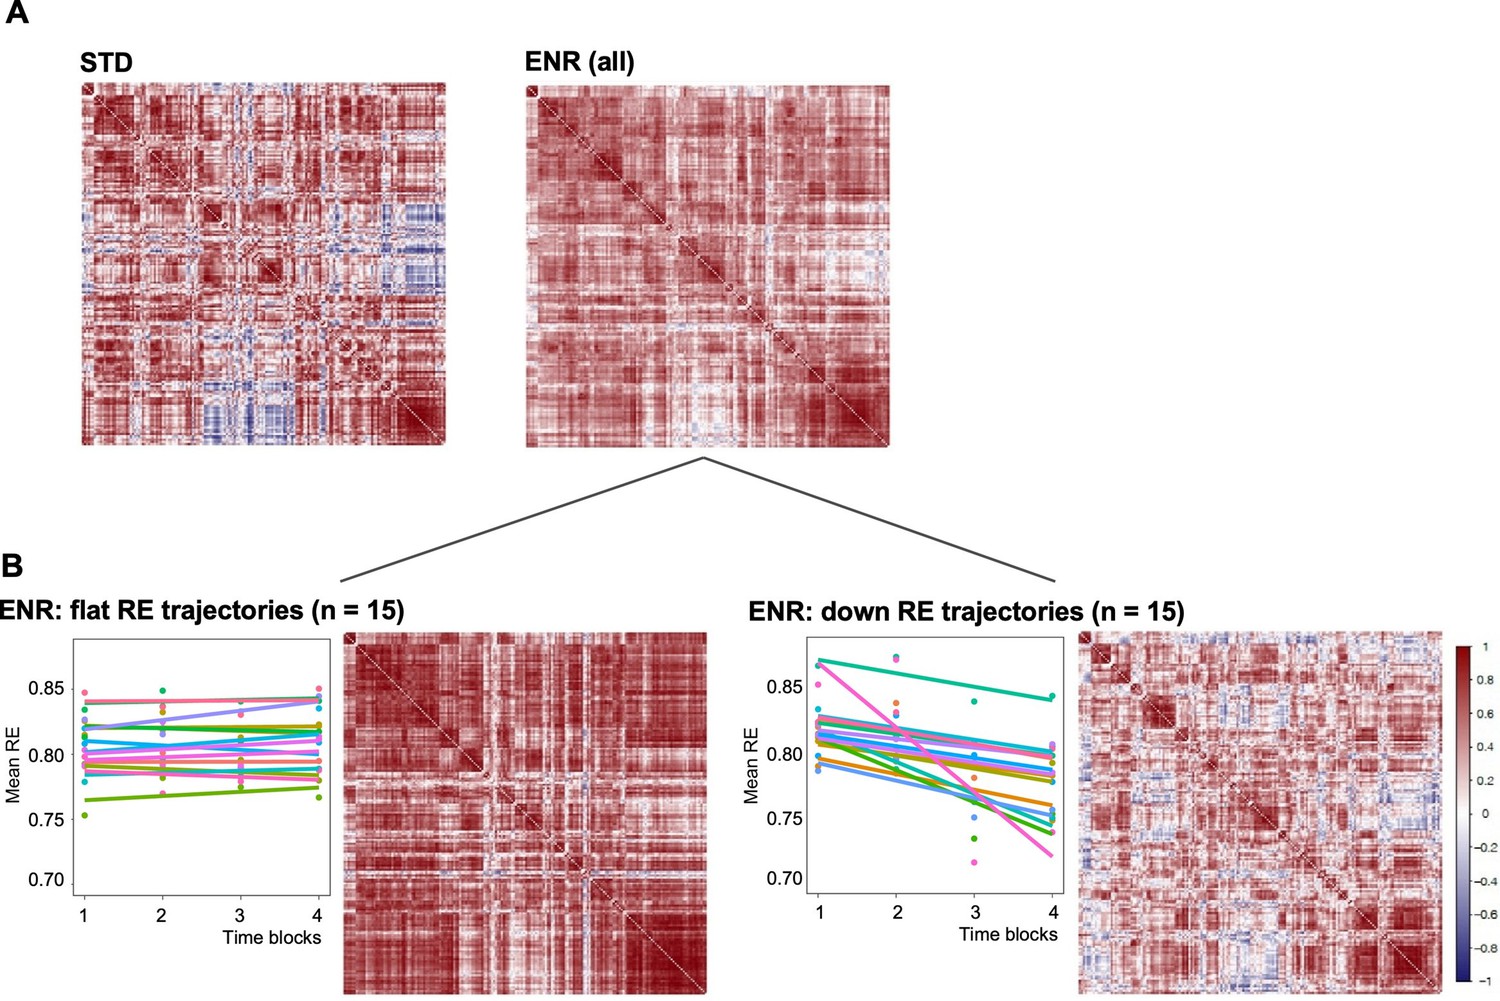
Environmental enrichment distinctively alters brain structural covariance.
Rows and columns of each matrix denote atlas-defined structures, and color intensity the correlation strength (Pearson’s correlation, red = positive, blue = negative). (A) Mice were kept either in STD or ENR conditions. (B) based on patterns of behavior (slope of the RE trajectory), ENR animals were stratified into ‘flat’ and ‘down’ roamers. Six mice with positive slopes and 2 intermediates were not included into this visualization. ‘Correlatedness’ in flat roamers visibly exceeds the ENR (all) pattern, while in ‘down roamers’ it appears weaker than in STD (see text for the Chi Square statistics of the comparisons).
Figure 3—figure supplement 1
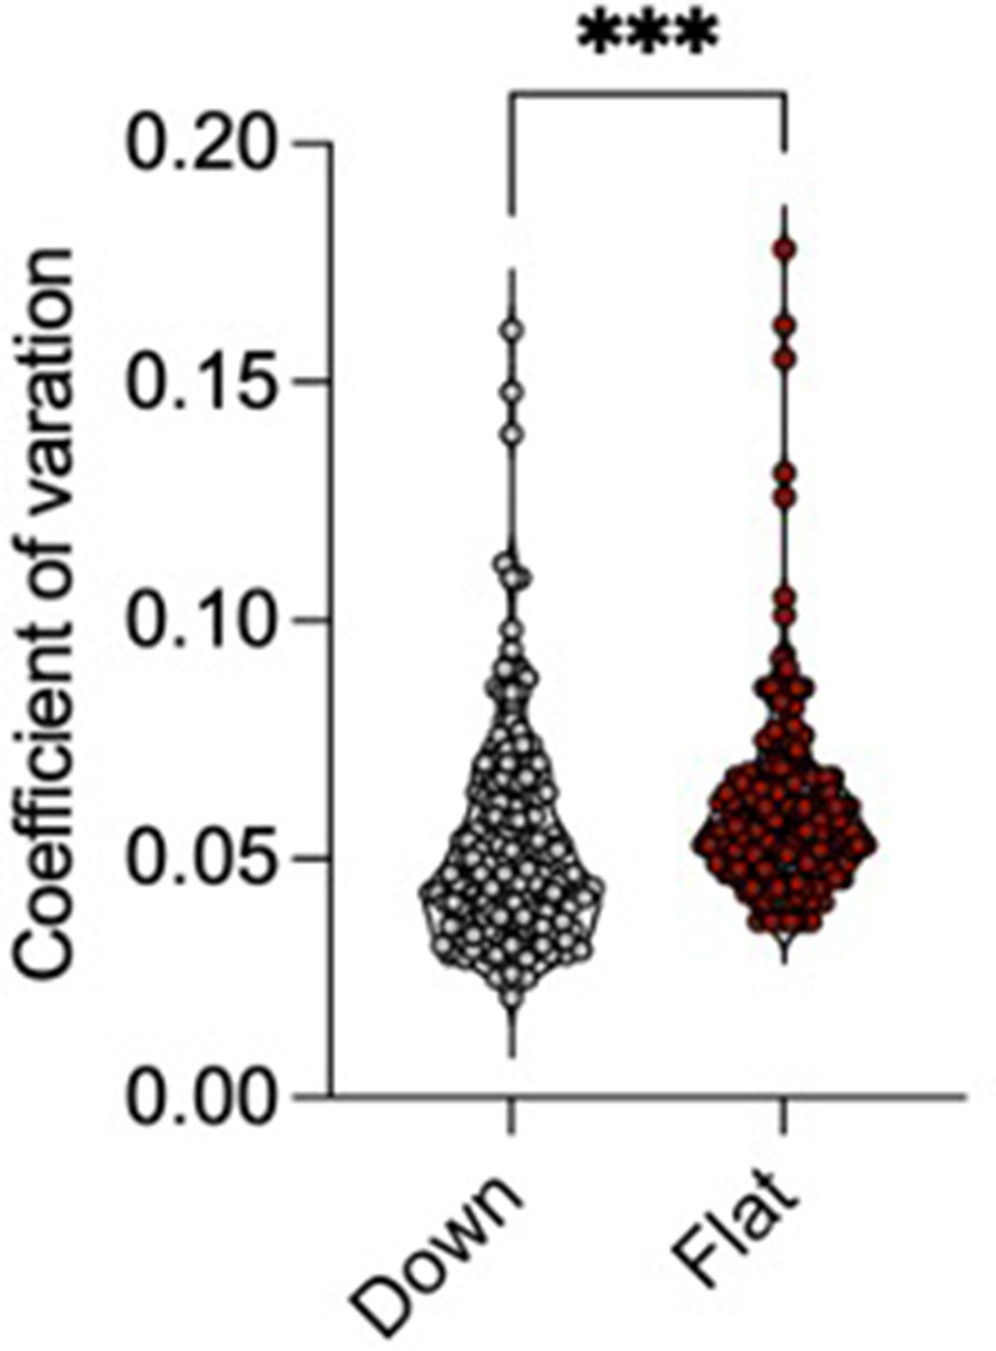
The violin plots with overlaid data points show increased overall coefficient variance in the volume of mouse brain regions in Flat compared to Down subgroups of ENR-housed mice.
Individual data points represent the coefficient of variation (CV) for each of 182 regions of interest (ROIs) in the DSURQE mouse brain atlas. ***p < 0.001 Mann–Whitney U-test comparing the average of the CV across all 182 ROIs in the DSURQE mouse brain atlas, to yield an average variability measure for each group.
Figure 4
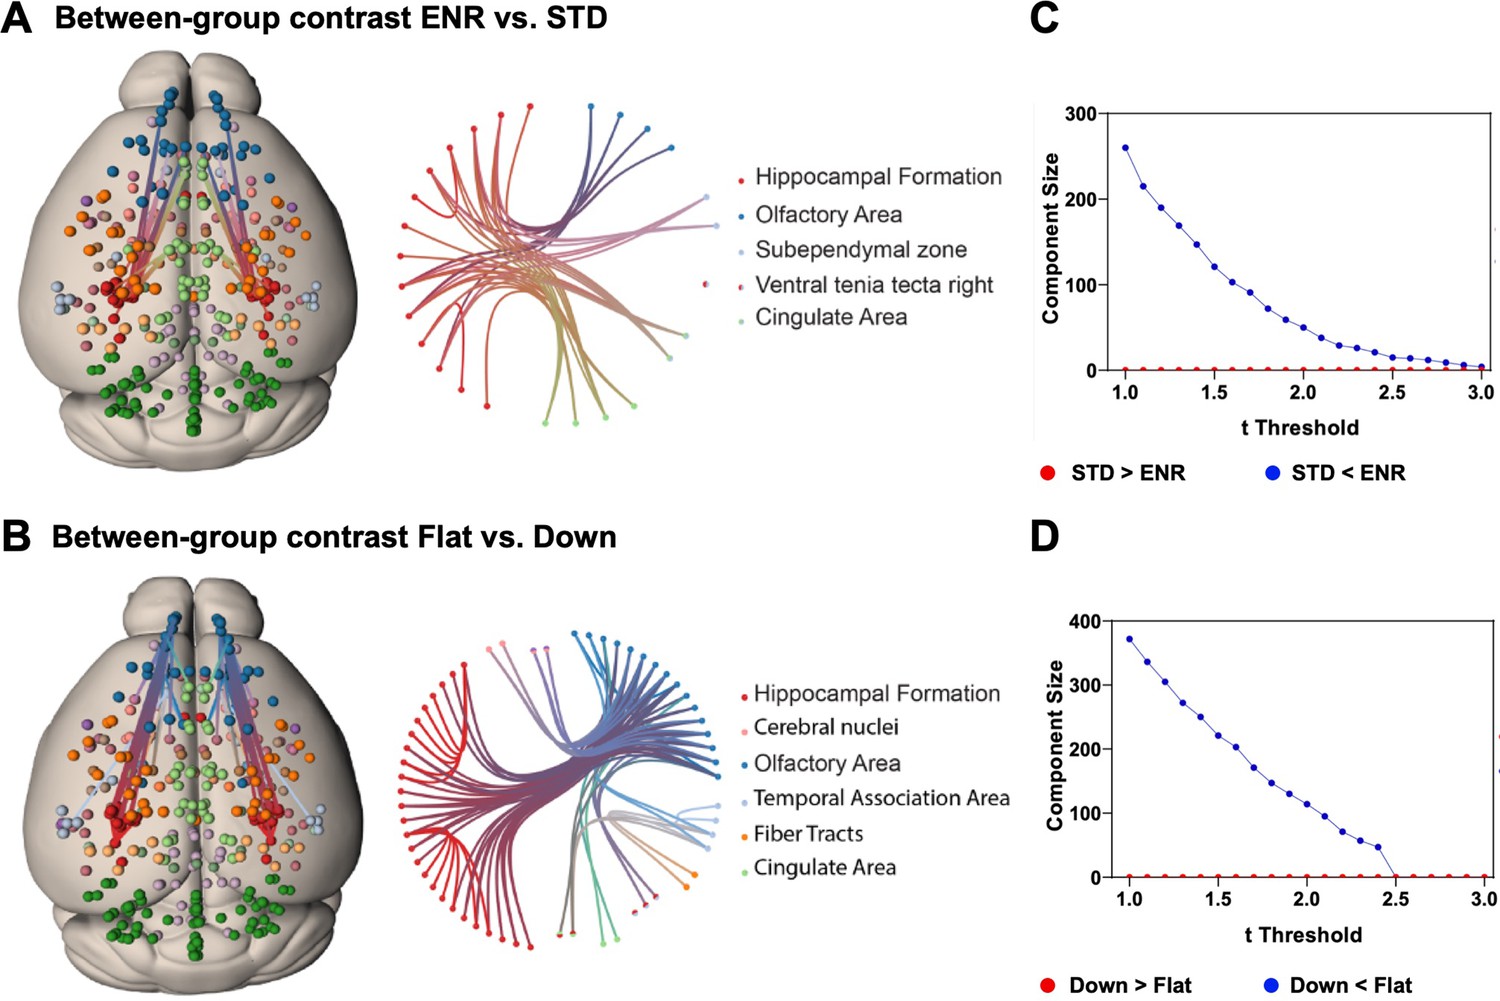
Network based statistics confirms differential structural connectivity patterns.
Visualization of subnetworks in the contrasts (A) ENR > STD and (B) FLAT > DOWN both at a threshold of t = 2.4. In the left panels nodes are projected onto a standard mouse brain template (Allen Mouse Common Coordinate Framework v.3). Edges and nodes are colored according to their anatomical location (Dark Green: Cerebellum, Light Green: Cingulate Area, Red: Hippocampal Formation, Orange: Fiber Tracts, Dark Blue: Olfactory Area, Light Blue: Temporal Association Area, Light Pink: Cerebral nuclei, Purple: Cortical Subplate). Nodes were defined using the DSURQE atlas and restricted to the regions of interest with a significant group difference in brain volumes based on the ENR > STD contrast. Values of bilateral regions were averaged and plotted in both hemispheres. Brain connectivity maps and circular connectogram were generated using NeuroMArVL (http://immersive.erc.monash.edu.au/neuromarvl). C and D: Visualization of the component size of the significant subnetwork depending on the chosen threshold. (C) ENR vs STD and (D) Flat vs Down. Regions of interest were defined with the DSURQE atlas and restricted to the regions of interest with a significant group difference in brain volumes based on the ENR > STD contrast.
Author response image 1
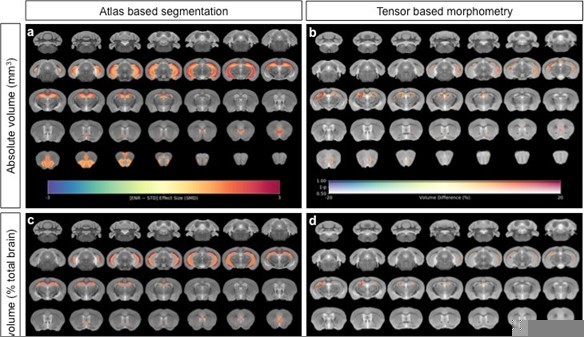
Neuroanatomical differences in absolute volumes between STD-ENR comparing absolute volumes for both atlas based segmentation (a) and voxel-wise tensor based morphometry (b), to the same analyses using relative volumes where inter-individual variance in mouse total brain volume is accounted for (c, d).
In panels (a) and (c), the highlighted regions shown pass statistical significance at a threshold of 5% FDR for multiple comparisons, with the colour bar indicating the effect size as standardized mean difference. In panels (b) and (d) only voxels that pass a threshold of FWE p<0.05 are shown with the colour bar indicating the % volume difference between the groups. In both cases the great majority of effects are conserved with similar effect sizes, particularly for the hippocampus a mouse brain region known to show a high sensitivity to allometric effects.
Additional files
-
Supplementary file 1
Absolute volumes.
- https://cdn.elifesciences.org/articles/80379/elife-80379-supp1-v2.xlsx
-
Supplementary file 2
Relative volumes.
- https://cdn.elifesciences.org/articles/80379/elife-80379-supp2-v2.xlsx
-
MDAR checklist
- https://cdn.elifesciences.org/articles/80379/elife-80379-mdarchecklist1-v2.docx
Download links
A two-part list of links to download the article, or parts of the article, in various formats.
Downloads (link to download the article as PDF)
Open citations (links to open the citations from this article in various online reference manager services)
Cite this article (links to download the citations from this article in formats compatible with various reference manager tools)
Individual behavioral trajectories shape whole-brain connectivity in mice
eLife 12:e80379.
https://doi.org/10.7554/eLife.80379


