Independent regulation of mitochondrial DNA quantity and quality in Caenorhabditis elegans primordial germ cells
- Department of Cell Biology, NYU Grossman School of Medicine, United States
- Skirball Institute of Biomolecular Medicine, NYU Grossman School of Medicine, United States
- Department of Biological Sciences, Vanderbilt University, United States
- Department of Cell and Developmental Biology, Vanderbilt University School of Medicine, United States
- Diabetes Research and Training Center, Vanderbilt University School of Medicine, United States
Figures
Figure 1 with 2 supplements
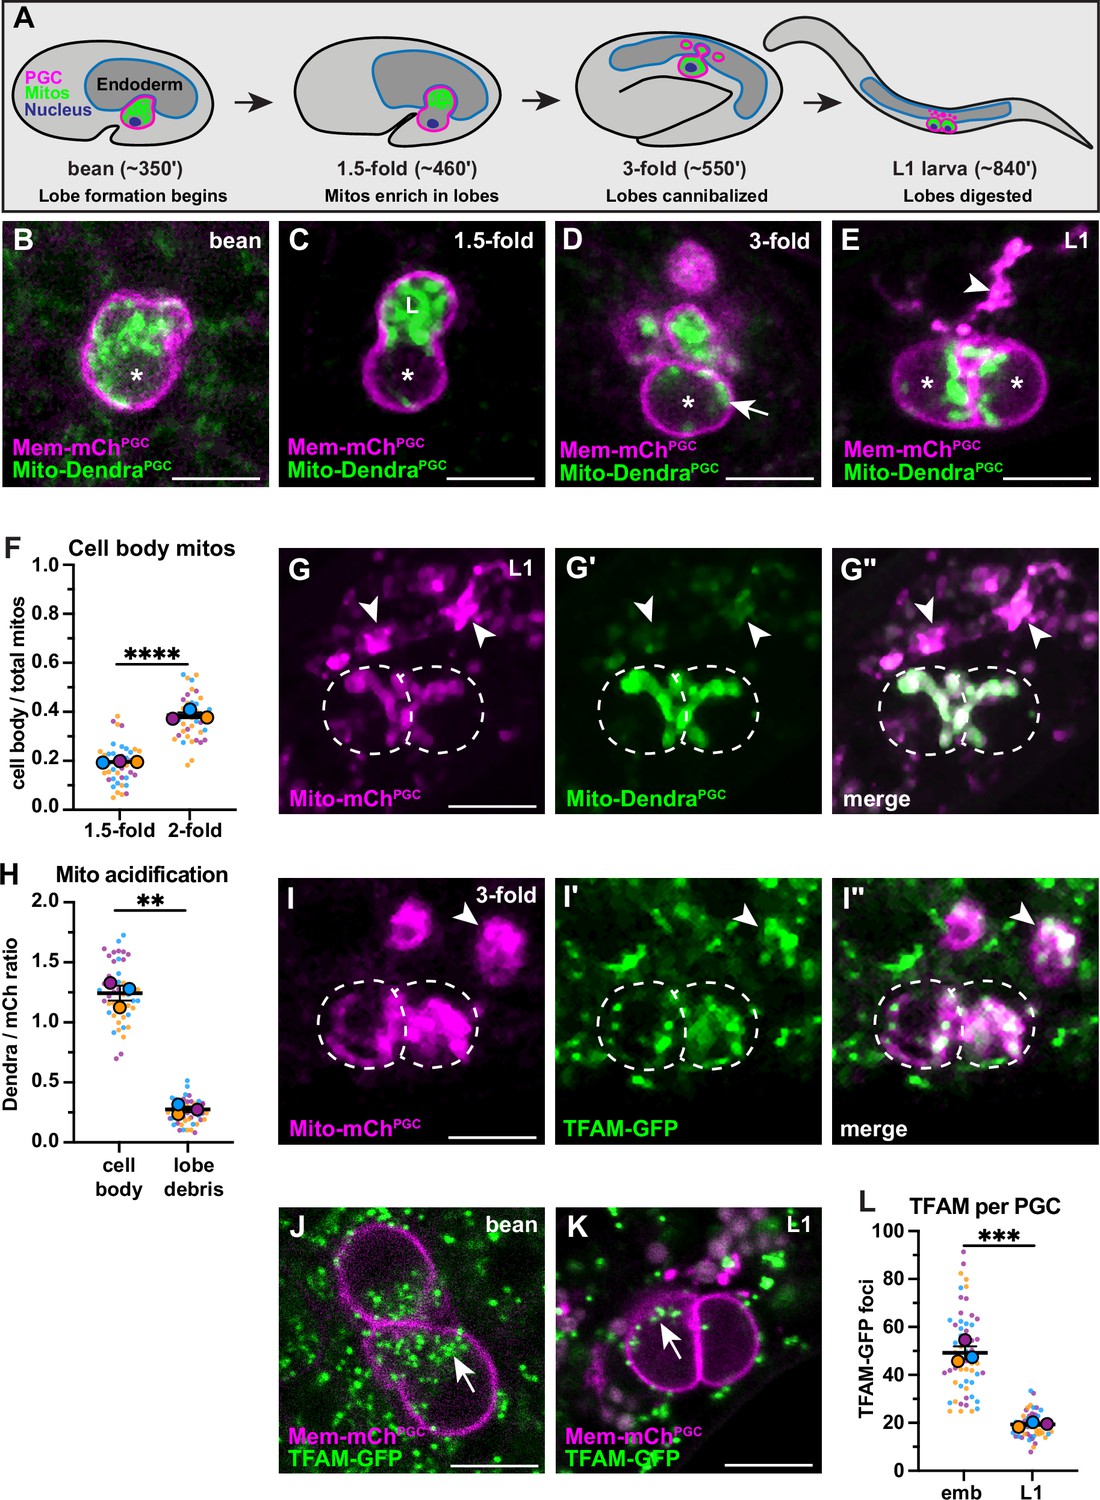
Primordial germ cell (PGC) lobe mitochondria and mitochondrial DNAs (mtDNAs) are cannibalized and digested.
(A) Schematic of PGC lobe formation and cannibalism. Bean stage to threefold embryos, one PGC visible; L1 larva, both PGCs visible. PGCs (magenta), PGC mitochondria (green), and endoderm (blue) are shown. Developmental timepoints are shown as approximate time in minutes post-fertilization at 20–22°C. (B–E) Plasma membranes and mitochondria in embryonic PGCs just as lobes form (B), in PGCs with lobes (C–D), and in L1 larval PGCs after lobes are digested (E; arrowhead, lobe debris in endoderm). *, nucleus; ‘L’, lobe. (F) Quantification of the mitochondrial fraction within the cell body in 1.5-fold and 2-fold stage PGCs. (G-G”) Acidified mitochondria (arrowheads) in digested PGC lobes of L1 larvae. Dashed lines, the outline of PGC cell bodies. (H) Quantification of Mito-DendraPGC over Mito-mChPGC ratio in L1 PGCs revealing acidification in lobe debris relative to the cell body. (I-I”) Mitochondrial transcription factor-A (TFAM)-green fluorescent protein (GFP) puncta within PGC mitochondria, present in both the cell body (dashed outlines) and in recently cannibalized lobes (arrowheads). Due to the movement of threefold embryos within the eggshell, TFAM-GFP appears diffuse. (J–L) TFAM-GFP in embryonic (J) and L1 larval (K) PGCs. (L) Quantification of TFAM-GFP foci in embryonic and L1 PGCs. Data in graphs are shown as a Superplot, with individual data points from three independent color-coded biological replicates shown as small dots, the mean from each experiment shown as a larger circle, the mean of means as a horizontal line, and the SEM as error bars. **p≤0.01, ***p≤0.001, ****p≤0.0001, unpaired two-tailed Student’s t-test (F,L) and paired-ratio Student’s t-test (H). Scale bars, 5 µm.
-
Figure 1—source data 1
Related to Figure 1F, H and L.
- https://cdn.elifesciences.org/articles/80396/elife-80396-fig1-data1-v2.xlsx
Figure 1—figure supplement 1
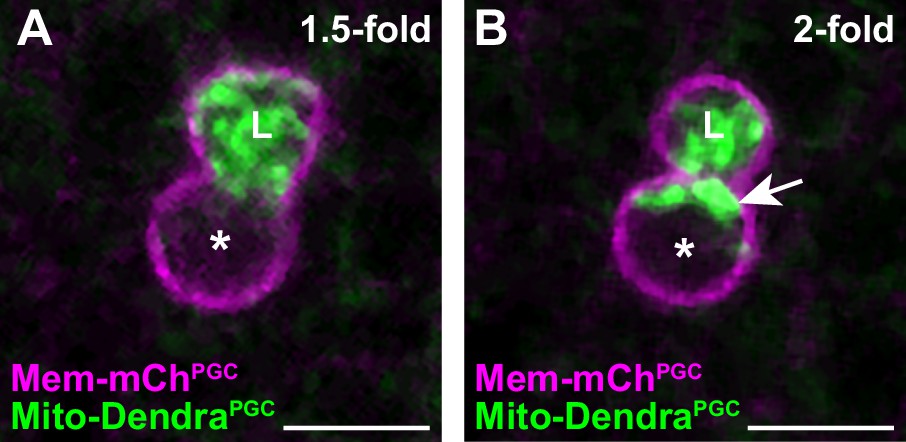
A subset of primordial germ cell (PGC) mitochondria is retained in the cell body prior to lobe digestion.
(A–B) Representative images of plasma membranes and mitochondria in an embryonic PGC as mitochondria localize into lobes (1.5-fold, A) and as lobe cannibalism is initiated (2-fold, B). A subset of mitochondria (arrow, B) is retained in the cell body. *, nucleus; ‘L’, lobe. See Figure 1F for quantification.
Figure 1—figure supplement 2
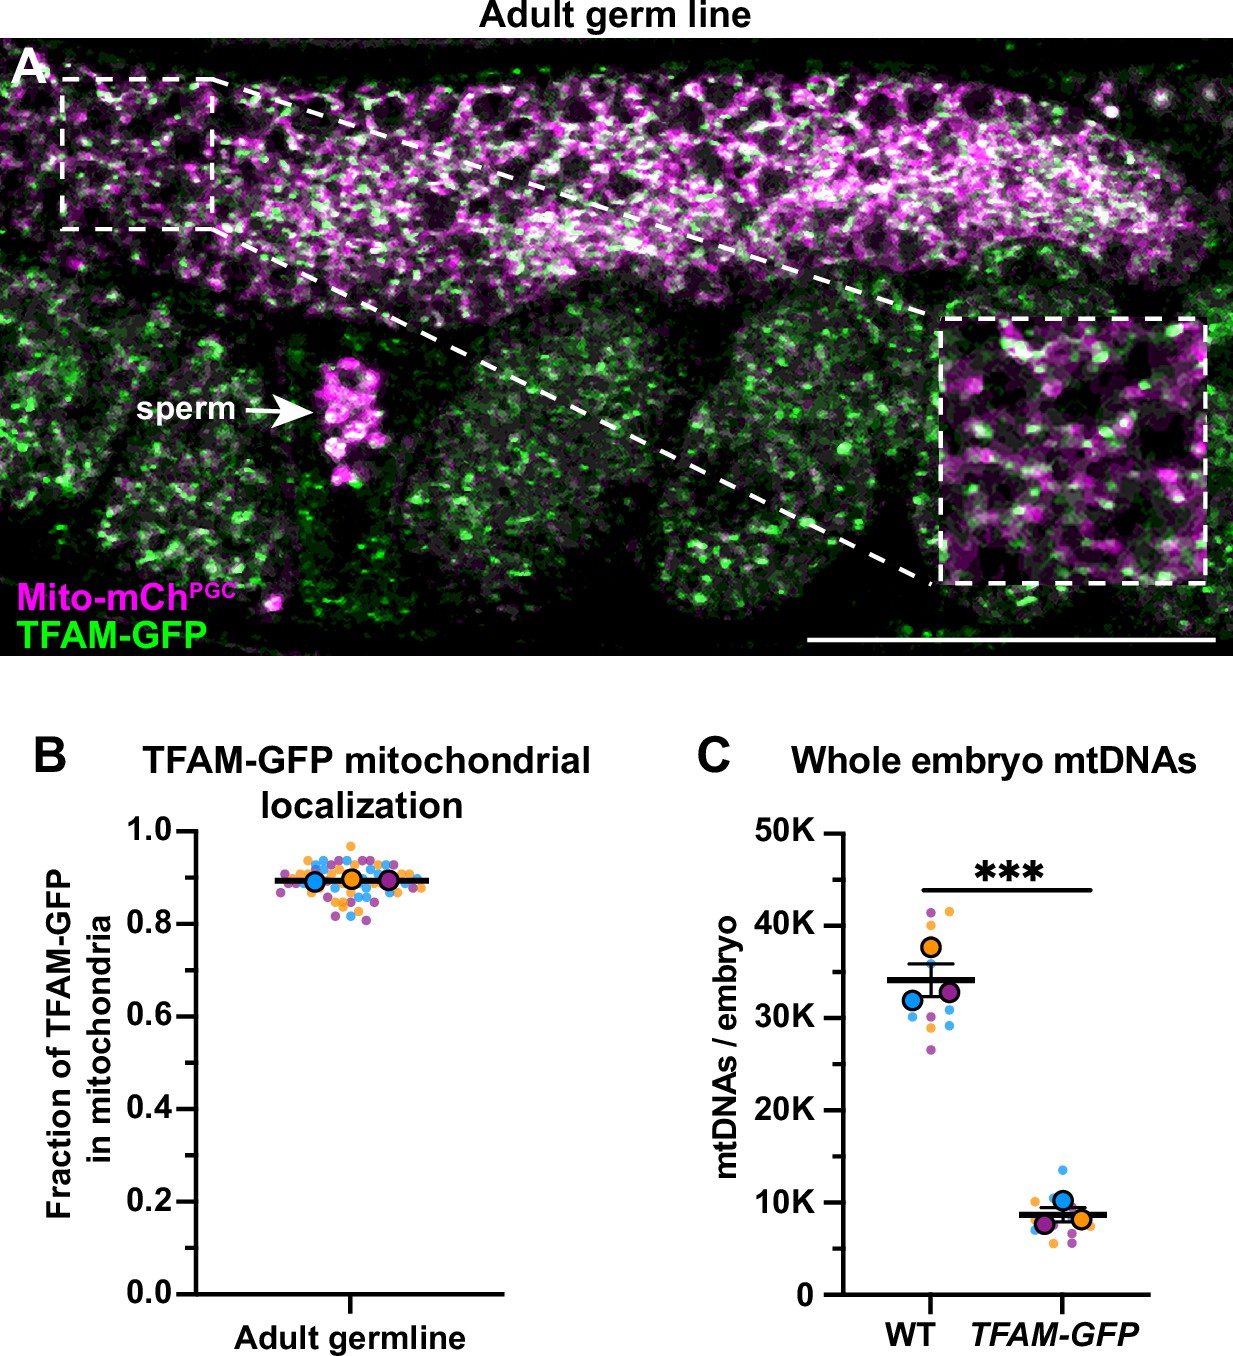
Mitochondrial transcription factor-A (TFAM)-GFP mitochondrial localization and effect on mitochondrial DNA (mtDNA) copy number.
(A) Endogenously tagged TFAM-GFP and mitochondria in the adult germ line; mitochondria and TFAM-GFP also localize to sperm (arrow). (B) Quantification of the fraction of TFAM-GFP overlap with Mito-mChPGC. (C) Quantification of mtDNA copy number in wild type and TFAM-GFP whole early embryos. Data shown: small dots are data points from individual worms (B) or technical replicates of droplet digital PCR (ddPCR) quantification (C) from each of the three color-coded biological replicates; the mean from each biological replicate is shown as a larger circle, the mean of means as a horizontal line, and the SEM as error bars. ***p≤0.001, unpaired two-tailed Student’s t-test (C). Scale bar, 50 µm.
-
Figure 1—figure supplement 2—source data 1
Related to Figure 1—figure supplement 2B-C.
- https://cdn.elifesciences.org/articles/80396/elife-80396-fig1-figsupp2-data1-v2.xlsx
Figure 2 with 4 supplements
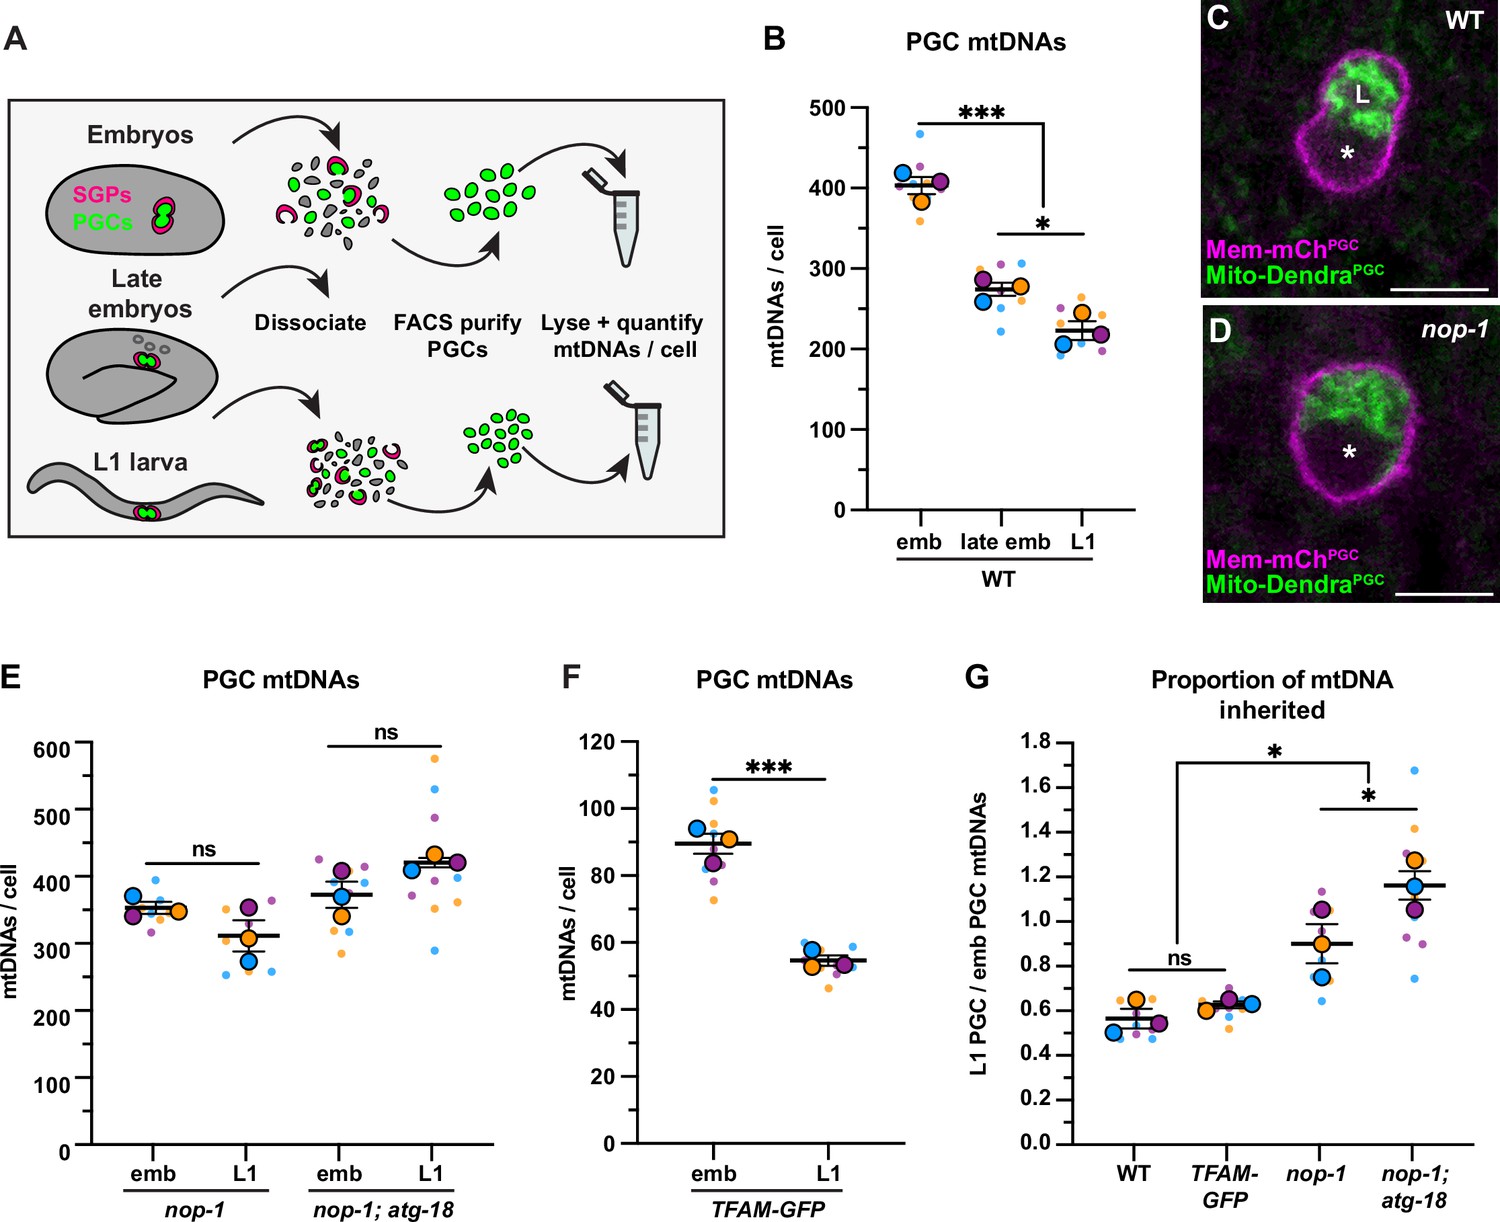
Primordial germ cell (PGC) lobe cannibalism and autophagy eliminate a fixed fraction of mitochondrial DNAs (mtDNAs).
(A) Schematic of fluorescence activated cell sorting (FACS) strategy to isolate PGCs from dissociated embryos and L1 larvae and quantify mtDNAs (see also Figure 2—figure supplements 1 and 2). (B) Quantification of mtDNA copy number per PGC in wild-type embryos, late embryos, and L1 larvae. (C–D) Mitochondria and plasma membrane in wild-type and nop-1 mutant PGCs. (E–F) Quantification of mtDNA copy number per PGC in nop-1 mutant, nop-1; atg-18 mutant, and mitochondrial transcription factor-A (TFAM)-GFP embryos and L1 larvae. (G) The proportion of embryonic PGC mtDNAs inherited by L1 PGCs in wild-type, TFAM-GFP, nop-1 mutants, and nop-1; atg-18 mutants (from data in B,E, and F). Data in graphs: small dots are three technical replicates of droplet digital PCR (ddPCR) quantification from each of three color-coded biological replicates; the technical replicate mean from each experiment is shown as a larger circle, the mean of means as a horizontal line, and the SEM as error bars. n.s., not significant (p>0.05), *p≤0.05, ***p≤0.001, unpaired one-tailed (E,G), and two-tailed (B,E,F,G) Student’s t-tests. Scale bars, 5 µm.
-
Figure 2—source data 1
Related to Figure 2B and E–G.
- https://cdn.elifesciences.org/articles/80396/elife-80396-fig2-data1-v2.xlsx
Figure 2—figure supplement 1
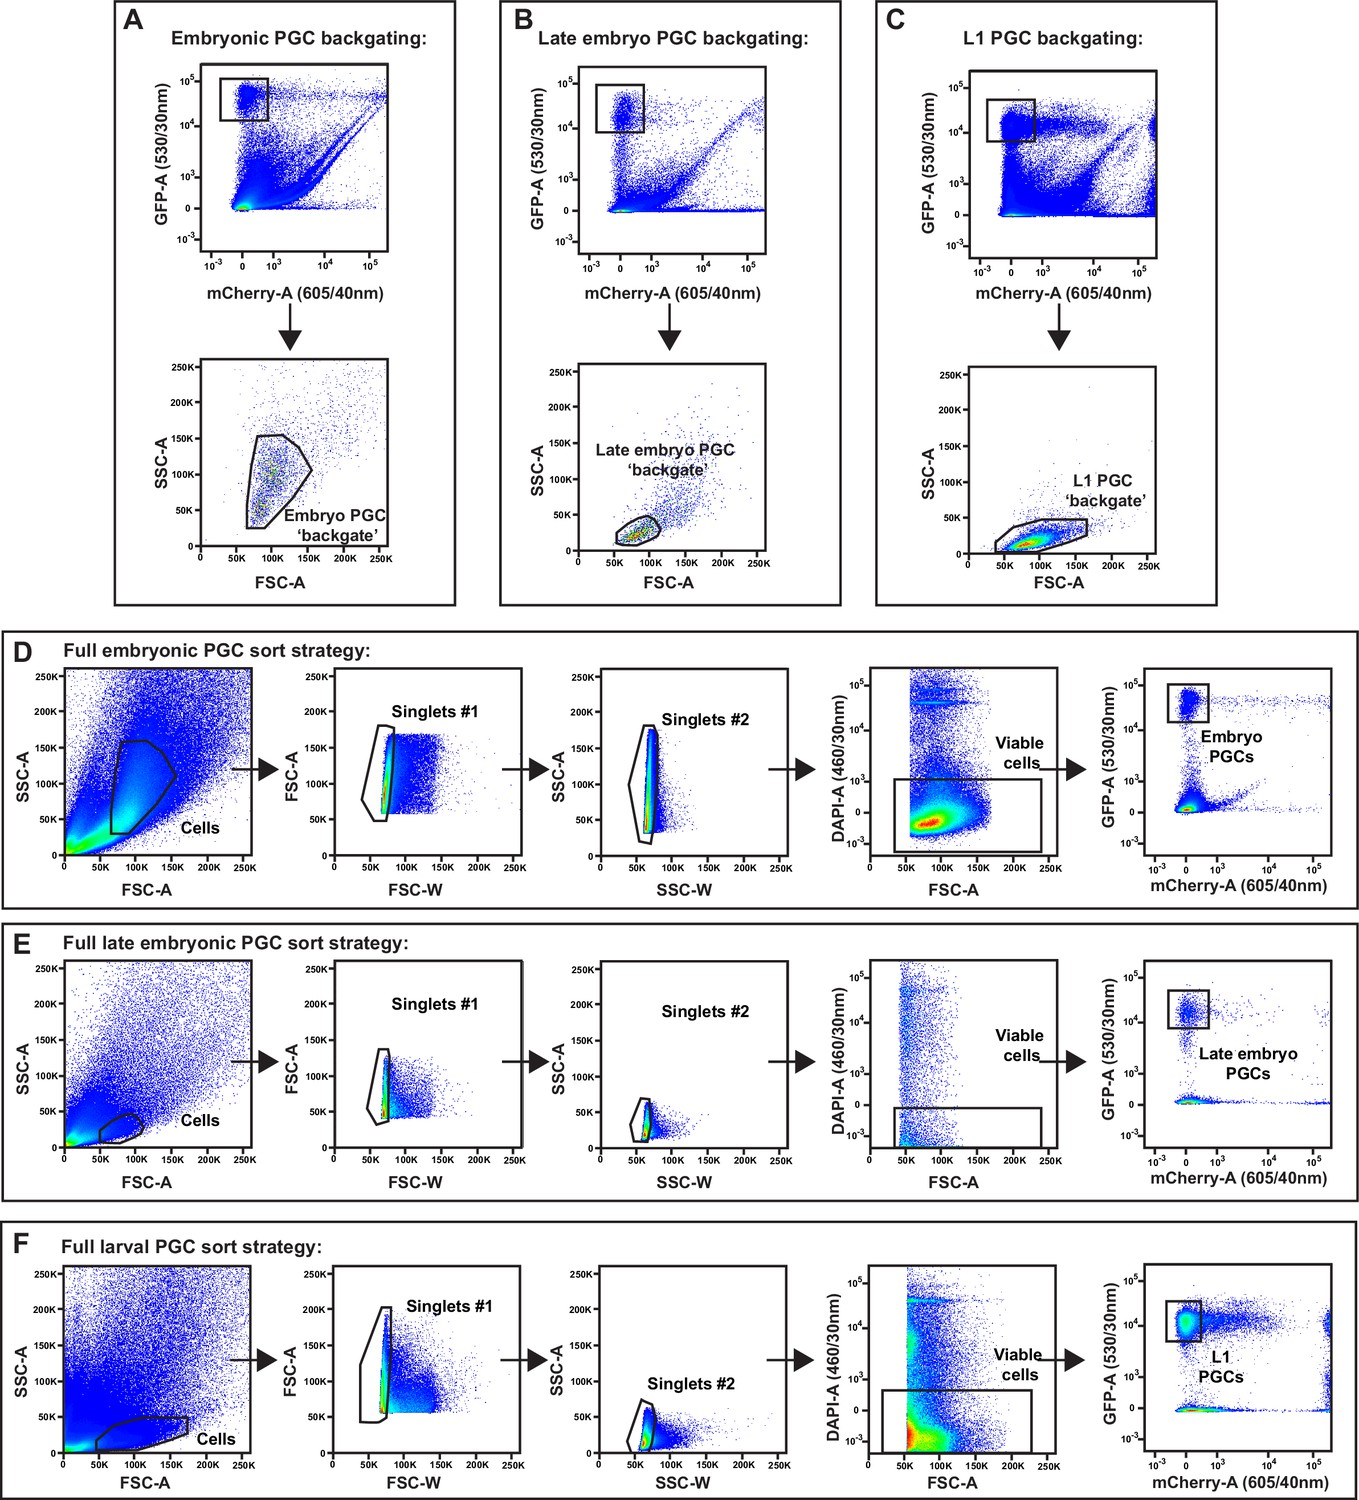
Embryo and L1 primordial germ cell (PGC) fluorescence activated cell sorting (FACS) purification gating strategy.
(A–F) Full gating strategies for isolating embryonic, late embryonic, and L1 PGCs from dissociations. Abbreviations: FSC-A, forward scatter area; FSC-W, forward scatter width; SSC-A, side scatter area; SSC-W, side scatter width; GFP-A, green fluorescent protein area; mCherry-A, mCherry area; DAPI-A, 4′,6-diamidino-2-phenylindole area. Size exclusion gates (SSC-A × FSC-A) containing PGCs were determined by backgating on all GFP+mCherry– events in embryonic (A), late embryonic (B), and L1 (C) dissociations. (D–F) Following size exclusion, two doublet discrimination gates (FSC-A × FSC-W and SSC-A × SSC-W) were applied to select singlet cells, DAPI-negative cells were selected for viability, and pure GFP+mCherry– embryonic (D), late embryonic (E), and L1 (F) PGCs were sorted.
Figure 2—figure supplement 2
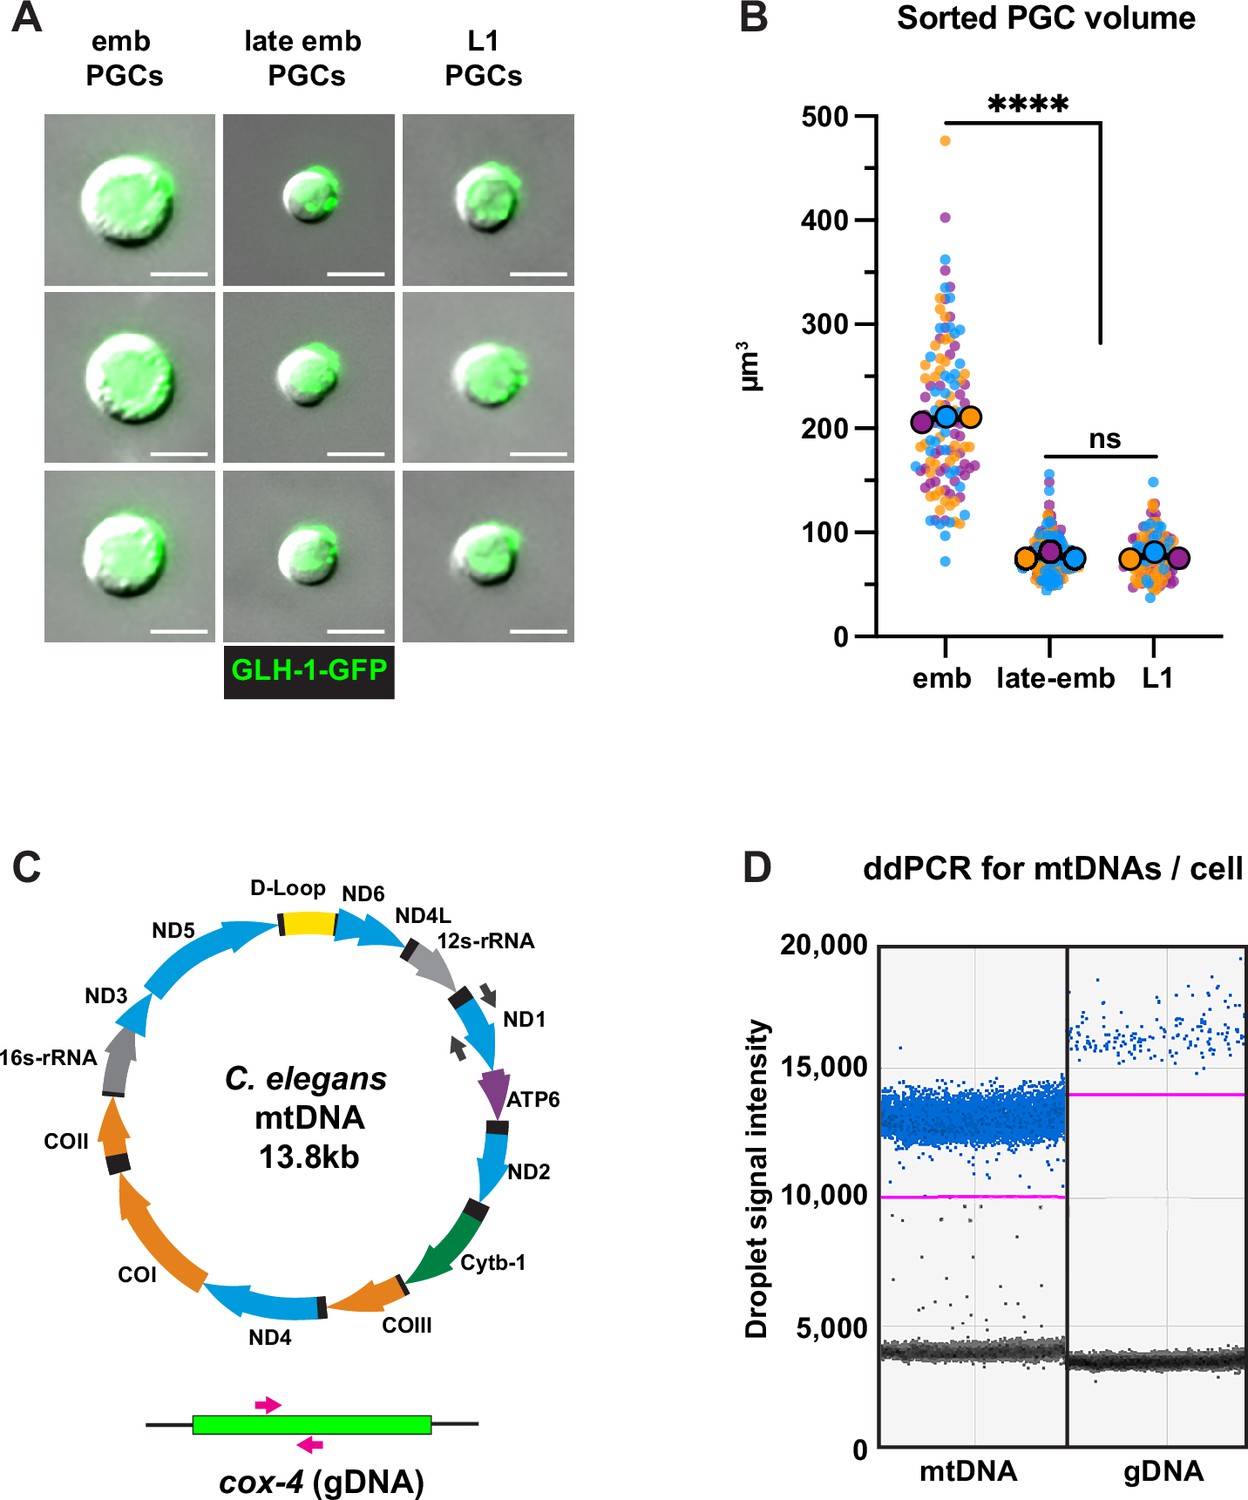
Fluorescence activated cell sorting (FACS) quality control and droplet digital PCR (ddPCR).
(A) Representative images of embryonic, late embryonic, and L1 primordial germ cells (PGCs) post-FACS. (B) Quantification of sorted PGC volume. Small dots are data points from individual cells from each of three color-coded cell sorting experiments; the mean from each sorting experiment is shown as a larger circle, the mean of means as a horizontal line, and the SEM as error bars. ****p≤0.0001, unpaired two-tailed Student’s t-test. (C) Schematic of C. elegans mitochondrial DNA (mtDNA) and genomic DNA targets, as well as color-coded primer pairs for detecting mtDNA and gDNA by ddPCR. Gray primers, mtDNA; magenta primers, gDNA. (D) Representative ddPCR plot for quantifying mtDNA (nd-1 gene) and gDNA (cox-4 gene) copy number in sorted PGC lysates. Positive droplets (blue dots), negative droplets (black dots), and the threshold for positive droplets (magenta line) are shown. Scale bars, 5 µm.
-
Figure 2—figure supplement 2—source data 1
Related to Figure 2—figure supplement 2B.
- https://cdn.elifesciences.org/articles/80396/elife-80396-fig2-figsupp2-data1-v2.xlsx
Figure 2—figure supplement 3
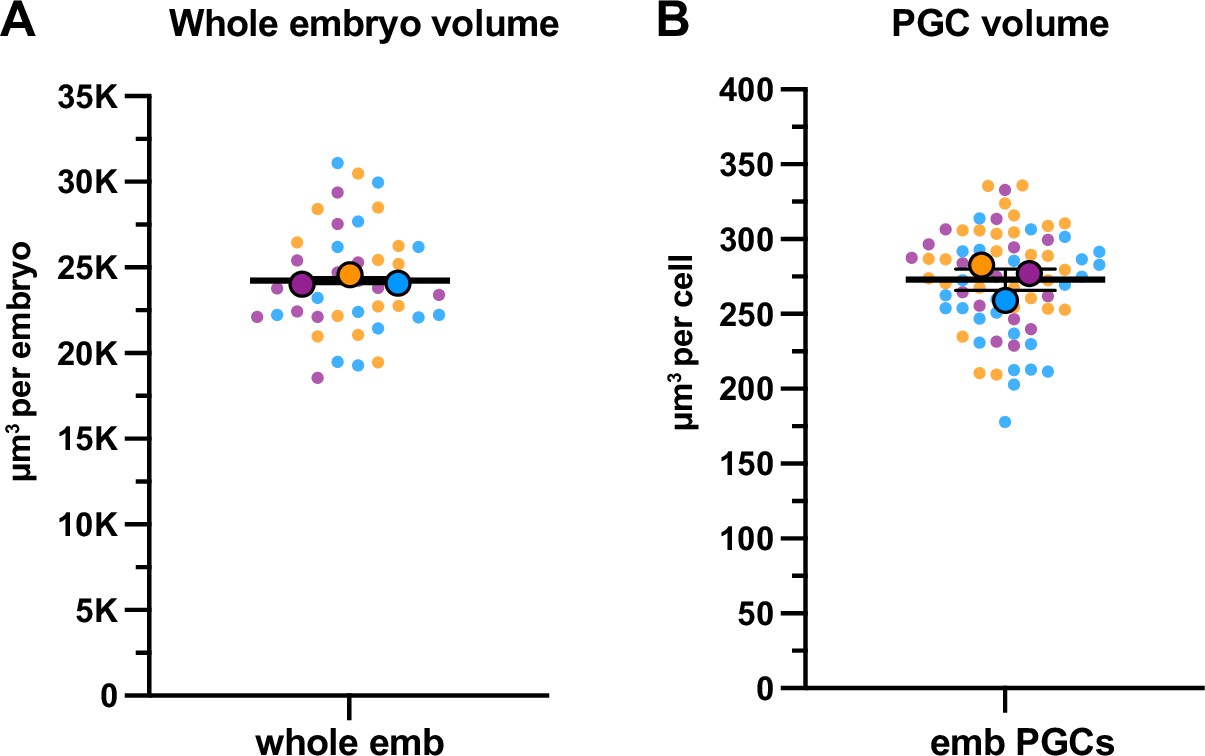
Quantification of whole embryo and primordial germ cell (PGC) volume.
(A) Quantification of whole embryonic volume based on embryonic length and width. Three independent biological replicates (N) with a sample size n≥13 were used to calculate whole embryo volume (see Methods). The mean of means was used to calculate the average whole embryo volume and the SEM. (B) Quantification of embryonic PGC volume using Imaris (see Methods). Three independent biological replicates (N) with sample size n≥18 were used to calculate PGC volumes. The mean of means was used to calculate the average PGC volume and SEM. Data shown: small dots are data points from individual embryos from each of three color-coded biological replicates; the mean from each biological replicate is shown as a larger circle, the mean of means as a horizontal line.
-
Figure 2—figure supplement 3—source data 1
Related to Figure 2—figure supplement 3A-B.
- https://cdn.elifesciences.org/articles/80396/elife-80396-fig2-figsupp3-data1-v2.xlsx
Figure 2—figure supplement 4
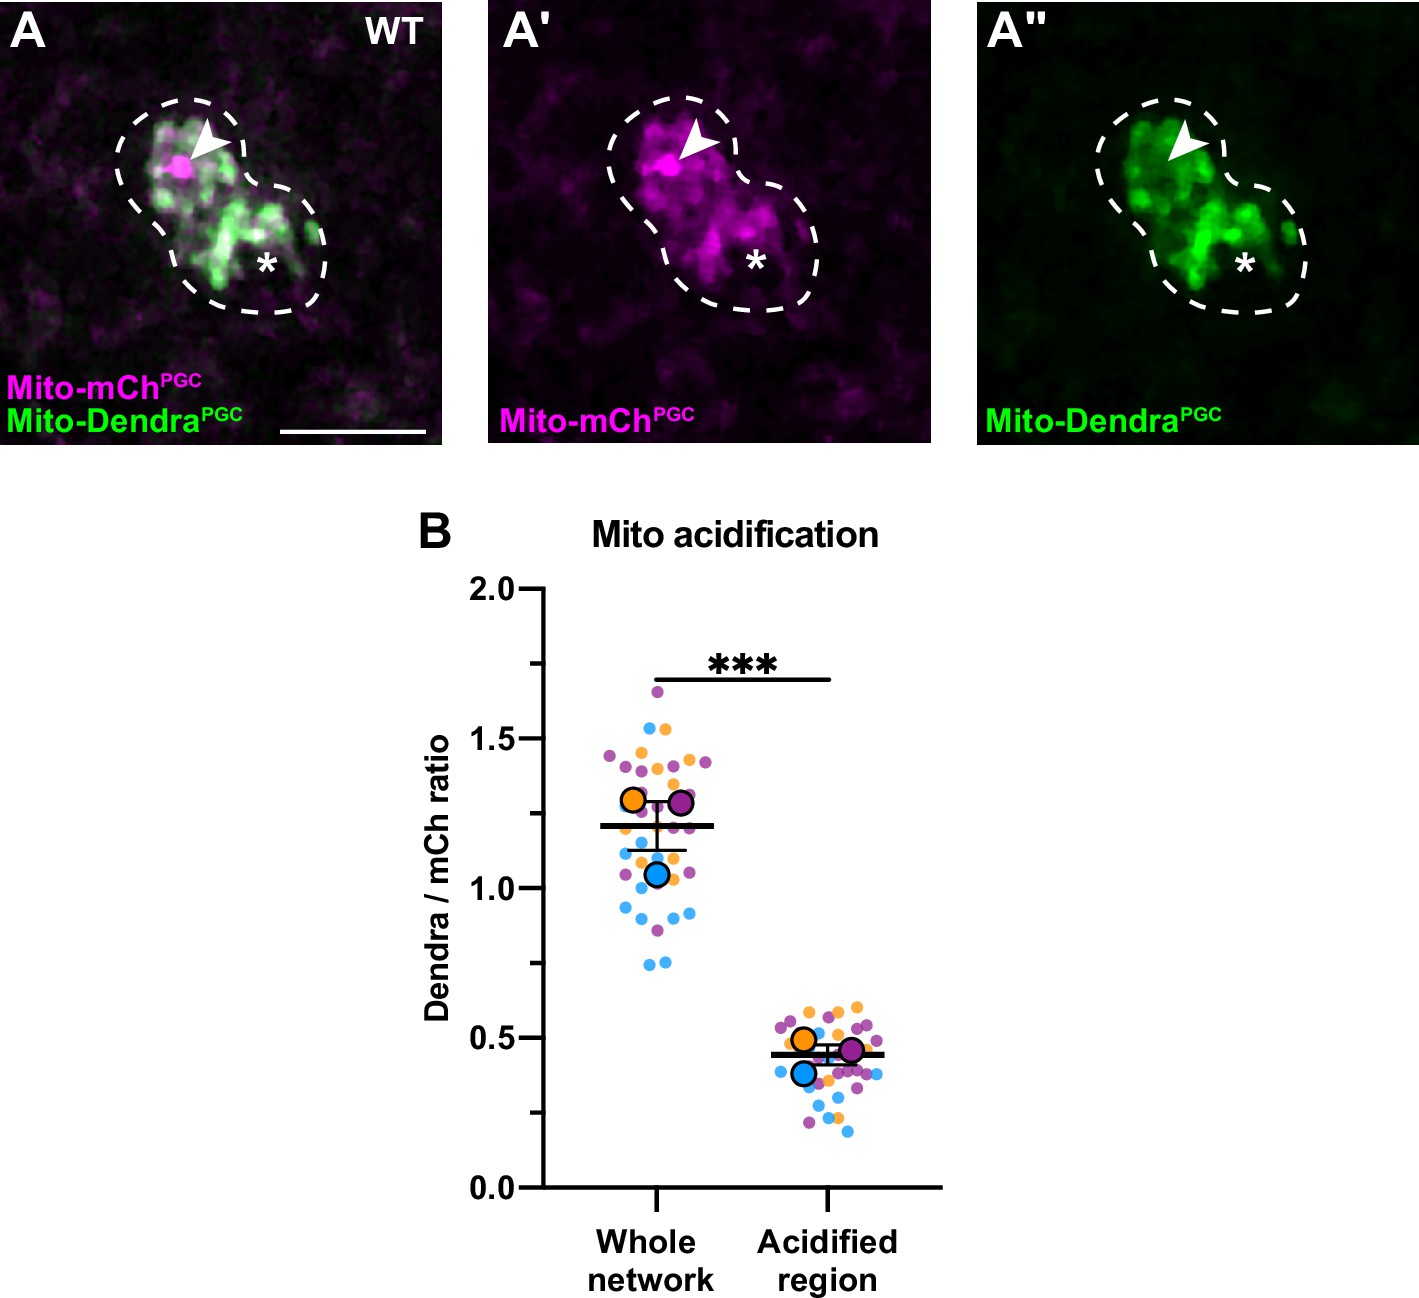
Acidification of a subset of primordial germ cell (PGC) mitochondria.
(A-A’’) Acidified mitochondria (arrowhead) in wild-type PGCs. (B) Quantification of Dendra/mCherry ratio in whole mitochondrial network and in the acidified region (see Methods). Individual data points from three independent color-coded biological replicates are shown as small dots, the mean from each experiment shown as a larger circle, the mean of means as a horizontal line, and the SEM as error bars. ***p≤0.001, ratio paired two-tailed Student’s t-test. Scale bar, 5 µm.
-
Figure 2—figure supplement 4—source data 1
Related to Figure 2—figure supplement 4B.
- https://cdn.elifesciences.org/articles/80396/elife-80396-fig2-figsupp4-data1-v2.xlsx
Figure 3 with 2 supplements
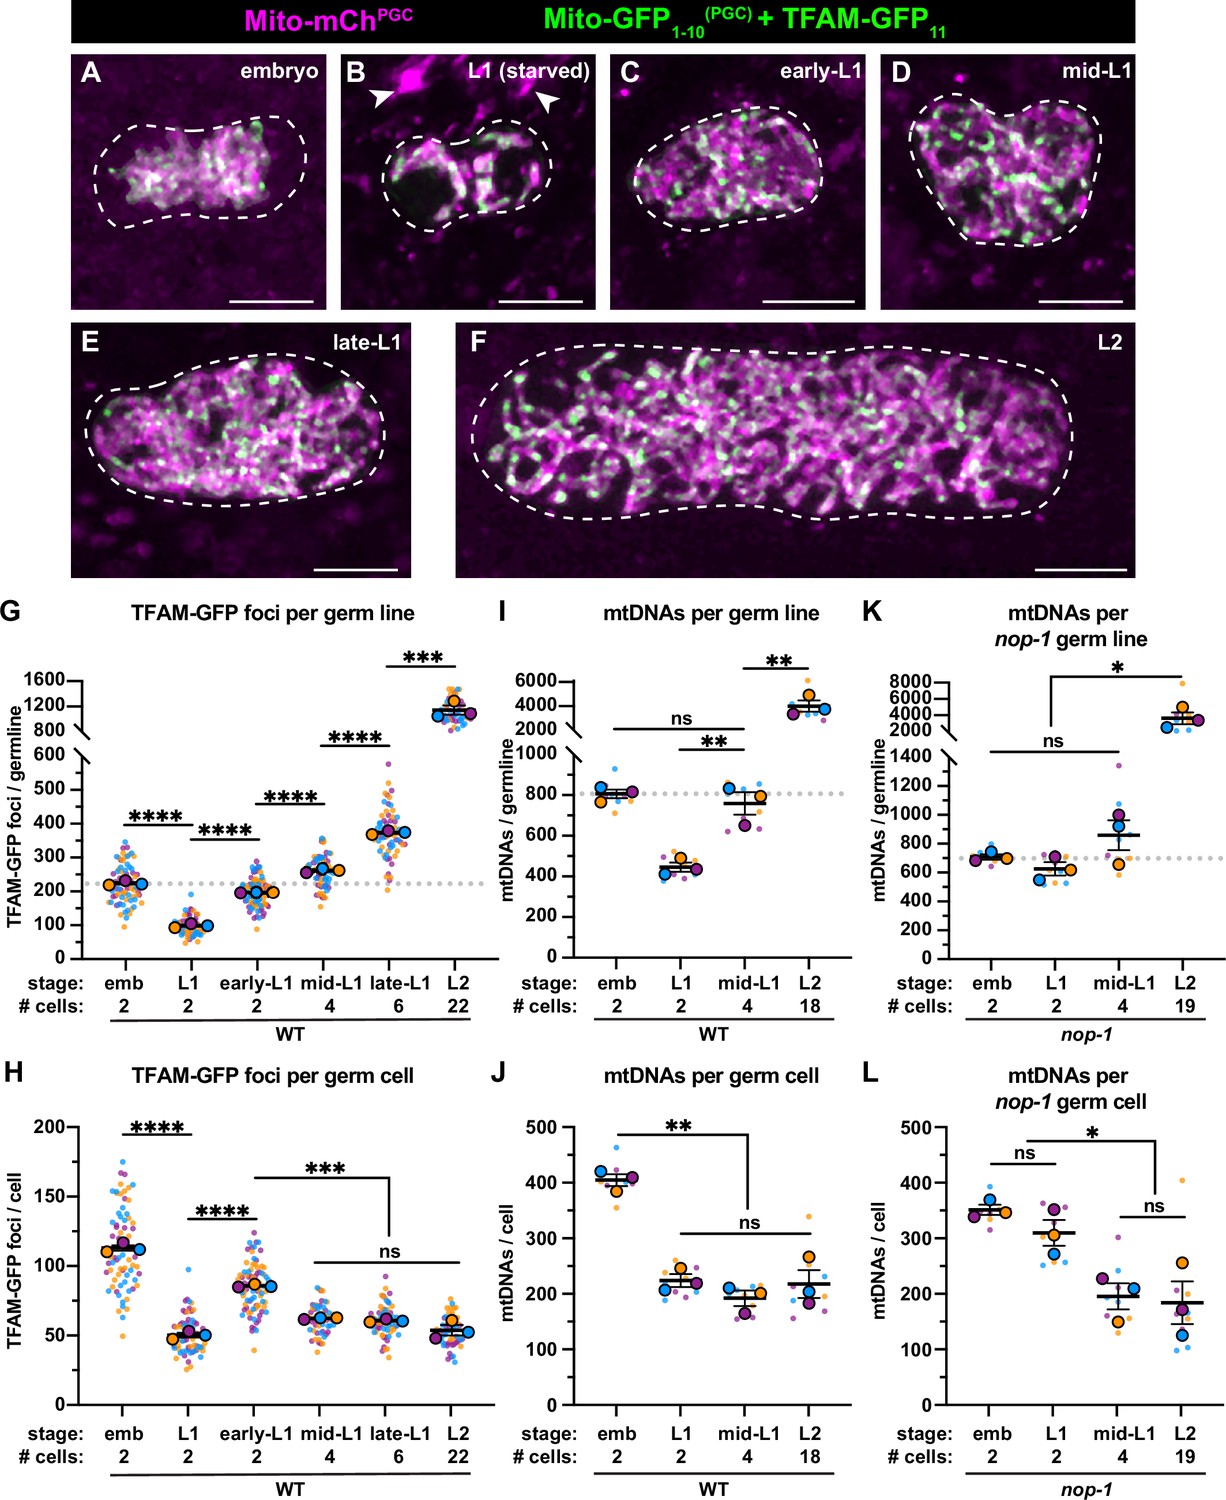
Primordial germ cell (PGC) lobe cannibalism and autophagy generate a mitochondrial DNA (mtDNA) low point and set point.
(A–F) Germline mitochondria and mitochondrial transcription factor-A (TFAM)-GFP11 in live embryos and larvae at the indicated stage. Dashed lines outline the PGCs or germline stem cells (GSCs). (G–H) Quantification of TFAM-GFP11 foci per germ line (G) and per germ cell (H) in embryos and larvae. (I–J) Quantification of mtDNAs per germ line (I) or per germ cell (J) in embryos and larvae; data shown for PGC mtDNA copy number in embryos and starved L1s are provided for comparison and originate from Figure 2B. (K–L) Quantification of mtDNAs per germ line (K) or per germ cell (L) in nop-1 mutant embryos and larvae; data shown for PGC mtDNA copy number in nop-1 mutant embryos and starved L1s are provided for comparison and originate from Figure 2E. Data in graphs: small dots are individual animals (TFAM-GFP11 measurements) or technical replicates (droplet digital PCR [ddPCR] experiments) from three color-coded biological replicates; the mean from each experiment is shown as a larger circle, the mean of means as a horizontal line, and the SEM as error bars. n.s., not significant (p>0.05), *p≤0.05, **p≤0.01, ***p≤0.001, ****p≤0.0001 unpaired two-tailed Student’s t-test. Scale bars, 5 µm.
-
Figure 3—source data 1
Related to Figure 3G–L.
- https://cdn.elifesciences.org/articles/80396/elife-80396-fig3-data1-v2.xlsx
Figure 3—figure supplement 1
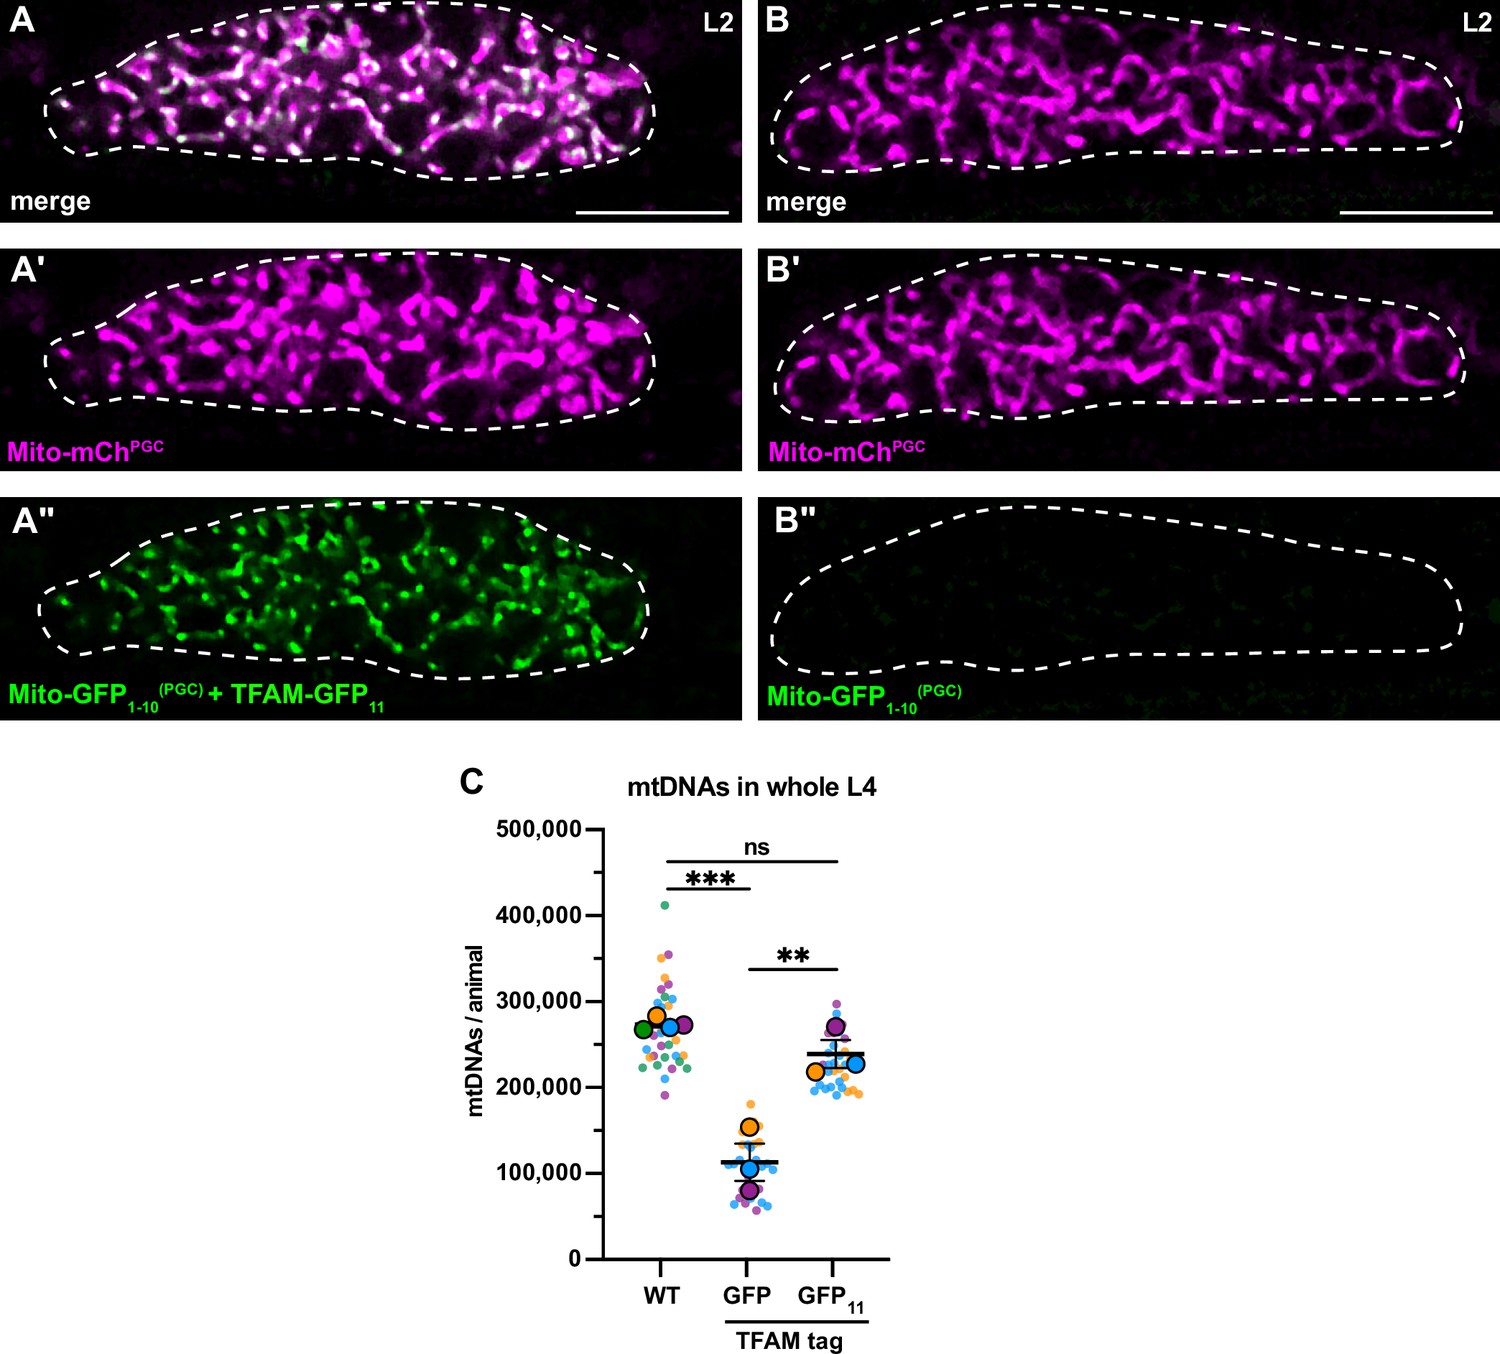
TFAM-GFP11 visualization and effect on mitochondrial DNA (mtDNA) copy number.
(A-B’’) Germline mitochondria and GFP1-10 in L2 larvae, with (A-A’’) or without (B-B’’) endogenously tagged TFAM-GFP11. Dashed line, the outline of the gonad. (C) Quantification of mtDNA copy number in whole L4 larvae assayed by quantitative PCR (qPCR) in wild-type, TFAM-GFP, and TFAM-GFP11; Mito-GFP1-10(PGC) genetic backgrounds. Small dots are data points from individual L4 worms from each of three color-coded biological replicates; the mean from each replicate is shown as a larger circle, the mean of means as a horizontal line, and the SEM as error bars. n.s., not significant (p>0.05), **p≤0.01, ***p≤0.001, unpaired two-tailed Student’s t-test. Scale bars, 10 µm.
-
Figure 3—figure supplement 1—source data 1
Related to Figure 3—figure supplement 1C.
- https://cdn.elifesciences.org/articles/80396/elife-80396-fig3-figsupp1-data1-v2.xlsx
Figure 3—figure supplement 2
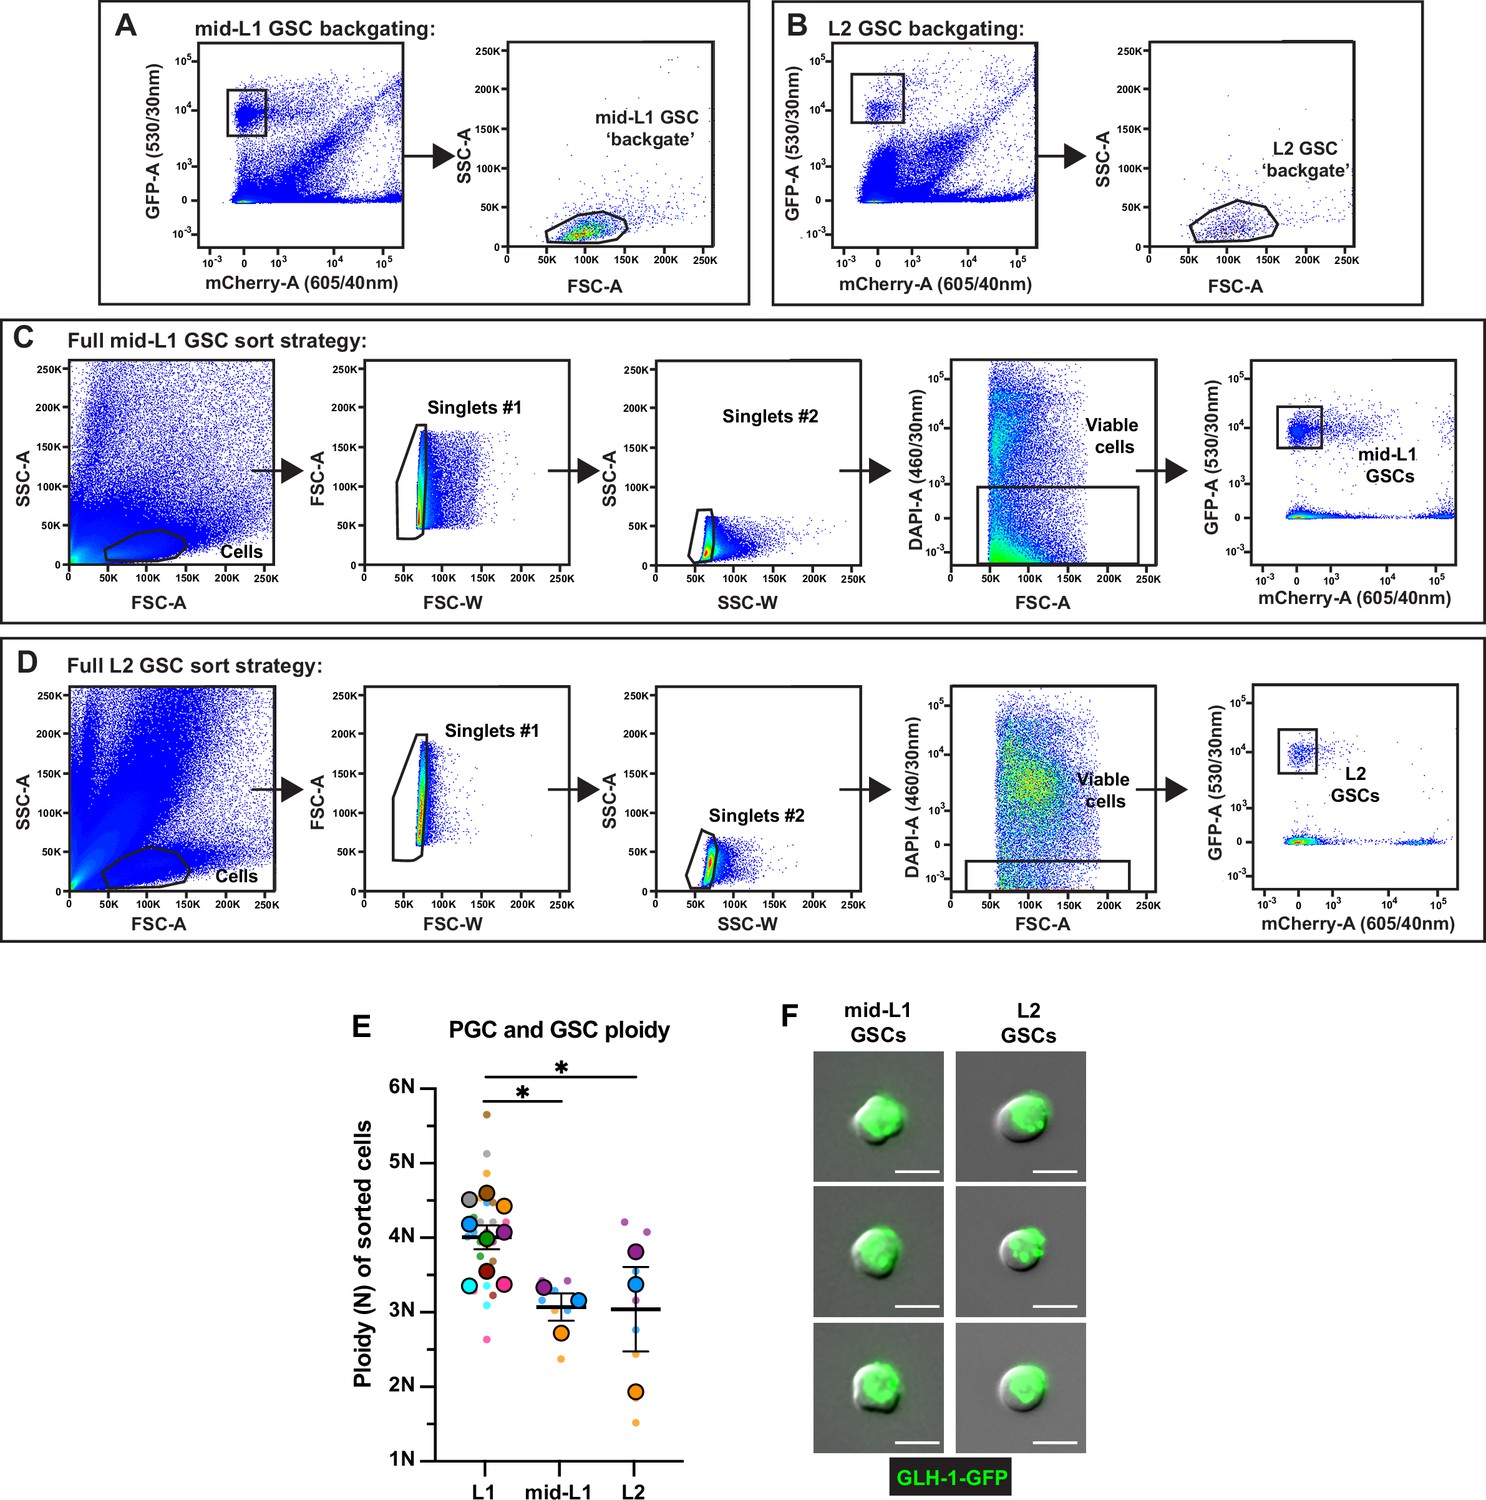
Fluorescence activated cell sorting (FACS), ploidy, and purity of sorted larval germline stem cells (GSCs).
(A–D) Full gating strategies for isolating mid-L1 and L2 GSCs from dissociations. Abbreviations: FSC-A, forward scatter area; FSC-W, forward scatter width; SSC-A, side scatter area; SSC-W, side scatter width; GFP-A, green fluorescent protein area; mCherry-A, mCherry area; DAPI-A, 4′,6-diamidino-2-phenylindole area. Size exclusion gates (SSC-A × FSC-A) containing GSCs were determined by backgating on all GFP+mCherry– events in mid-L1 (A) and L2 (B). (C–D) Following size exclusion, two doublet discrimination gates (FSC-A × FSC-W and SSC-A × SSC-W) were applied to select singlet cells, DAPI-negative cells were selected for viability, and pure GFP+mCherry– mid-L1 (C) and L2 (D) GSCs were sorted. (E) Ploidy of sorted mid-L1 and L2 GSCs (see Methods). Small dots are three technical replicates of droplet digital PCR (ddPCR) quantification from each of 3–9 color-coded biological replicates; the technical replicate mean from each experiment is shown as a larger circle, the mean of means as a horizontal line, and the SEM as error bars. *p≤0.05, unpaired two-tailed Student’s t-test. (F) Representative images of mid-L1 and L2 GSCs post-FACS. Scale bars, 5 µm.
-
Figure 3—figure supplement 2—source data 1
Related to Figure 3—figure supplement 2E.
- https://cdn.elifesciences.org/articles/80396/elife-80396-fig3-figsupp2-data1-v2.xlsx
Figure 4 with 1 supplement
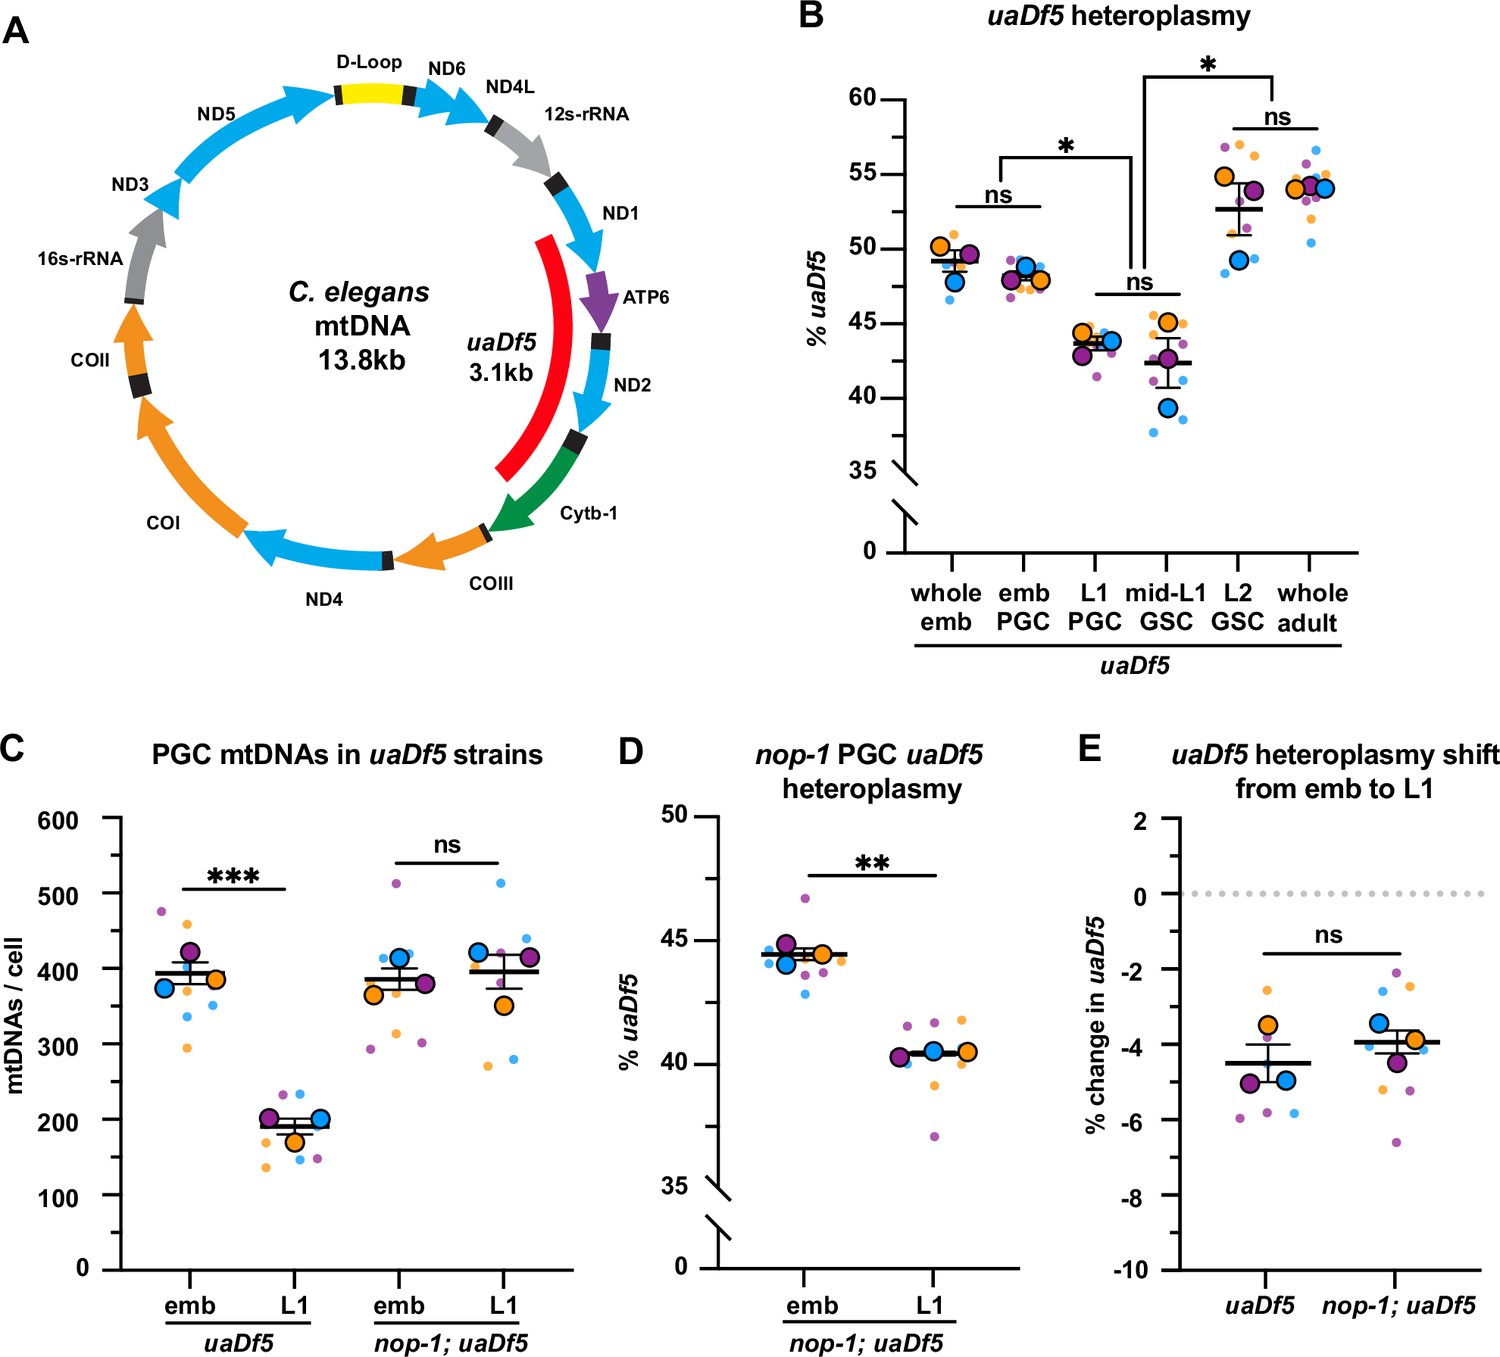
Primordial germ cells (PGCs) reduce uaDf5 heteroplasmy independently of lobe cannibalism.
(A) Schematic of C. elegans mitochondrial DNA (mtDNA); genes are indicated with colored arrows and the region deleted in uaDf5 is shown with a red bar. (B) Quantification of uaDf5 heteroplasmy in whole embryos, sorted PGCs or germline stem cells (GSCs), or whole adults at the indicated stages. (C) Quantification of mtDNA copy number in PGCs of uaDf5 and nop-1; uaDf5 mutants. (D) Quantification of uaDf5 heteroplasmy in nop-1; uaDf5 mutant PGCs. (E) Data from (B and D) presented as change in heteroplasmy shift from embryonic to L1 PGCs. Data in graphs: small dots are three technical replicates of droplet digital PCR (ddPCR) quantification from each of three color-coded biological replicates; the technical replicate mean from each experiment is shown as a larger circle, the mean of means as a horizontal line, and the SEM as error bars. n.s., not significant (p>0.05), *p≤0.05, **p≤0.01, ***p≤0.001, paired (B, D) and unpaired (B, C, E) two-tailed Student’s t-test.
-
Figure 4—source data 1
Related to Figure 4B–E.
- https://cdn.elifesciences.org/articles/80396/elife-80396-fig4-data1-v2.xlsx
Figure 4—figure supplement 1
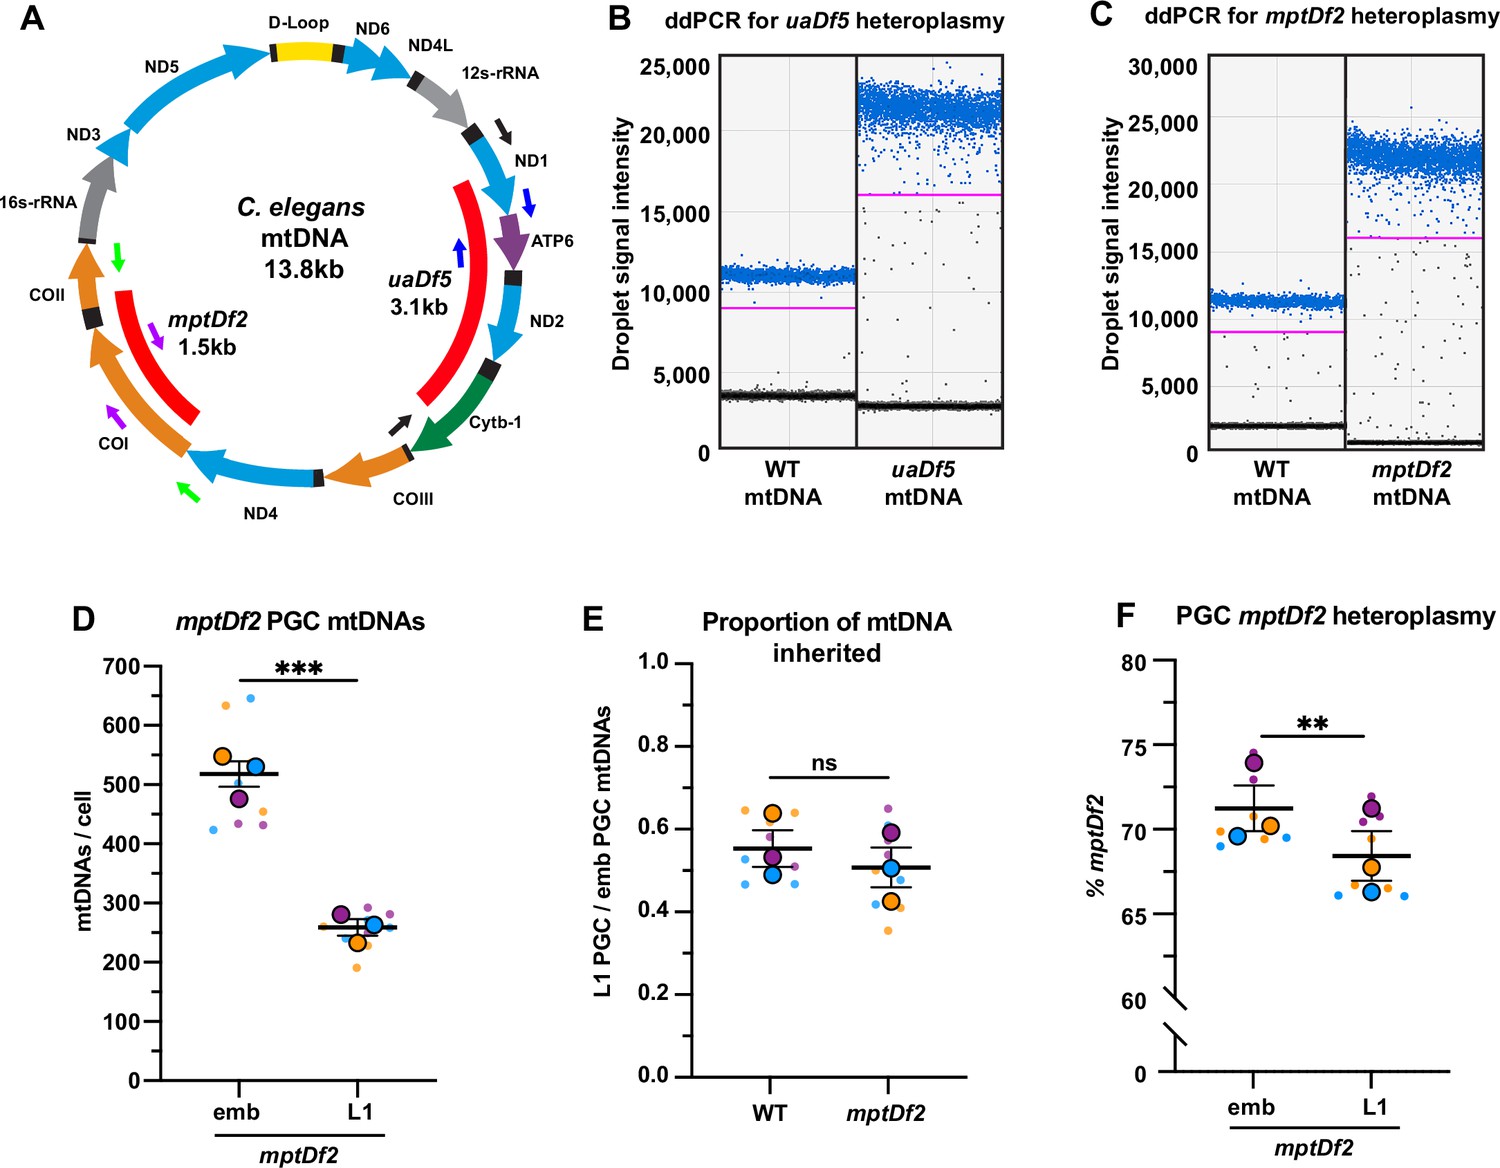
Droplet digital PCR (ddPCR) primers, detection of mitochondrial DNA (mtDNA) deletions, and mptDf2 inheritance in primordial germ cells (PGCs).
(A) Schematic of C. elegans mtDNA showing mtDNA deletions uaDf5 and mptDf2, as well as color-coded primer pairs for detecting wild-type and mutant mtDNA by ddPCR. Blue primers, wild-type mtDNA (uaDf5 experiments); black primers, uaDf5 mtDNA; purple primers, wild-type mtDNA (mptDf2 experiments); and green primers, mptDf2 mtDNA. (B) Representative ddPCR plot for quantifying uaDf5 and WT mtDNA copy number in sorted PGC lysates. (C) Representative ddPCR plot for quantifying mptDf2 and WT mtDNA copy number in sorted PGC lysates. Positive droplets (blue dots), negative droplets (black dots), and the threshold for positive droplets (magenta line) are shown. (D) The mtDNA copy number in mptDf2 embryonic and L1 PGCs. (E) The proportion of mptDf2 embryonic PGC mtDNAs inherited by L1 PGCs compared to wild type (from data in D and Figure 2B). (F) The percentage of mptDf2 heteroplasmy in embryonic and L1 PGCs. Data in graphs: small dots are three technical replicates of ddPCR quantification from each of three color-coded biological replicates; the technical replicate mean from each experiment is shown as a larger circle, the mean of means as a horizontal line, and the SEM as error bars. n.s., not significant (p>0.05), **p≤0.01, ***p≤0.001 paired (F) and unpaired (E,D) two-tailed Student’s t-test.
-
Figure 4—figure supplement 1—source data 1
Related to Figure 4—figure supplement 1D-F.
- https://cdn.elifesciences.org/articles/80396/elife-80396-fig4-figsupp1-data1-v2.xlsx
Figure 5 with 1 supplement
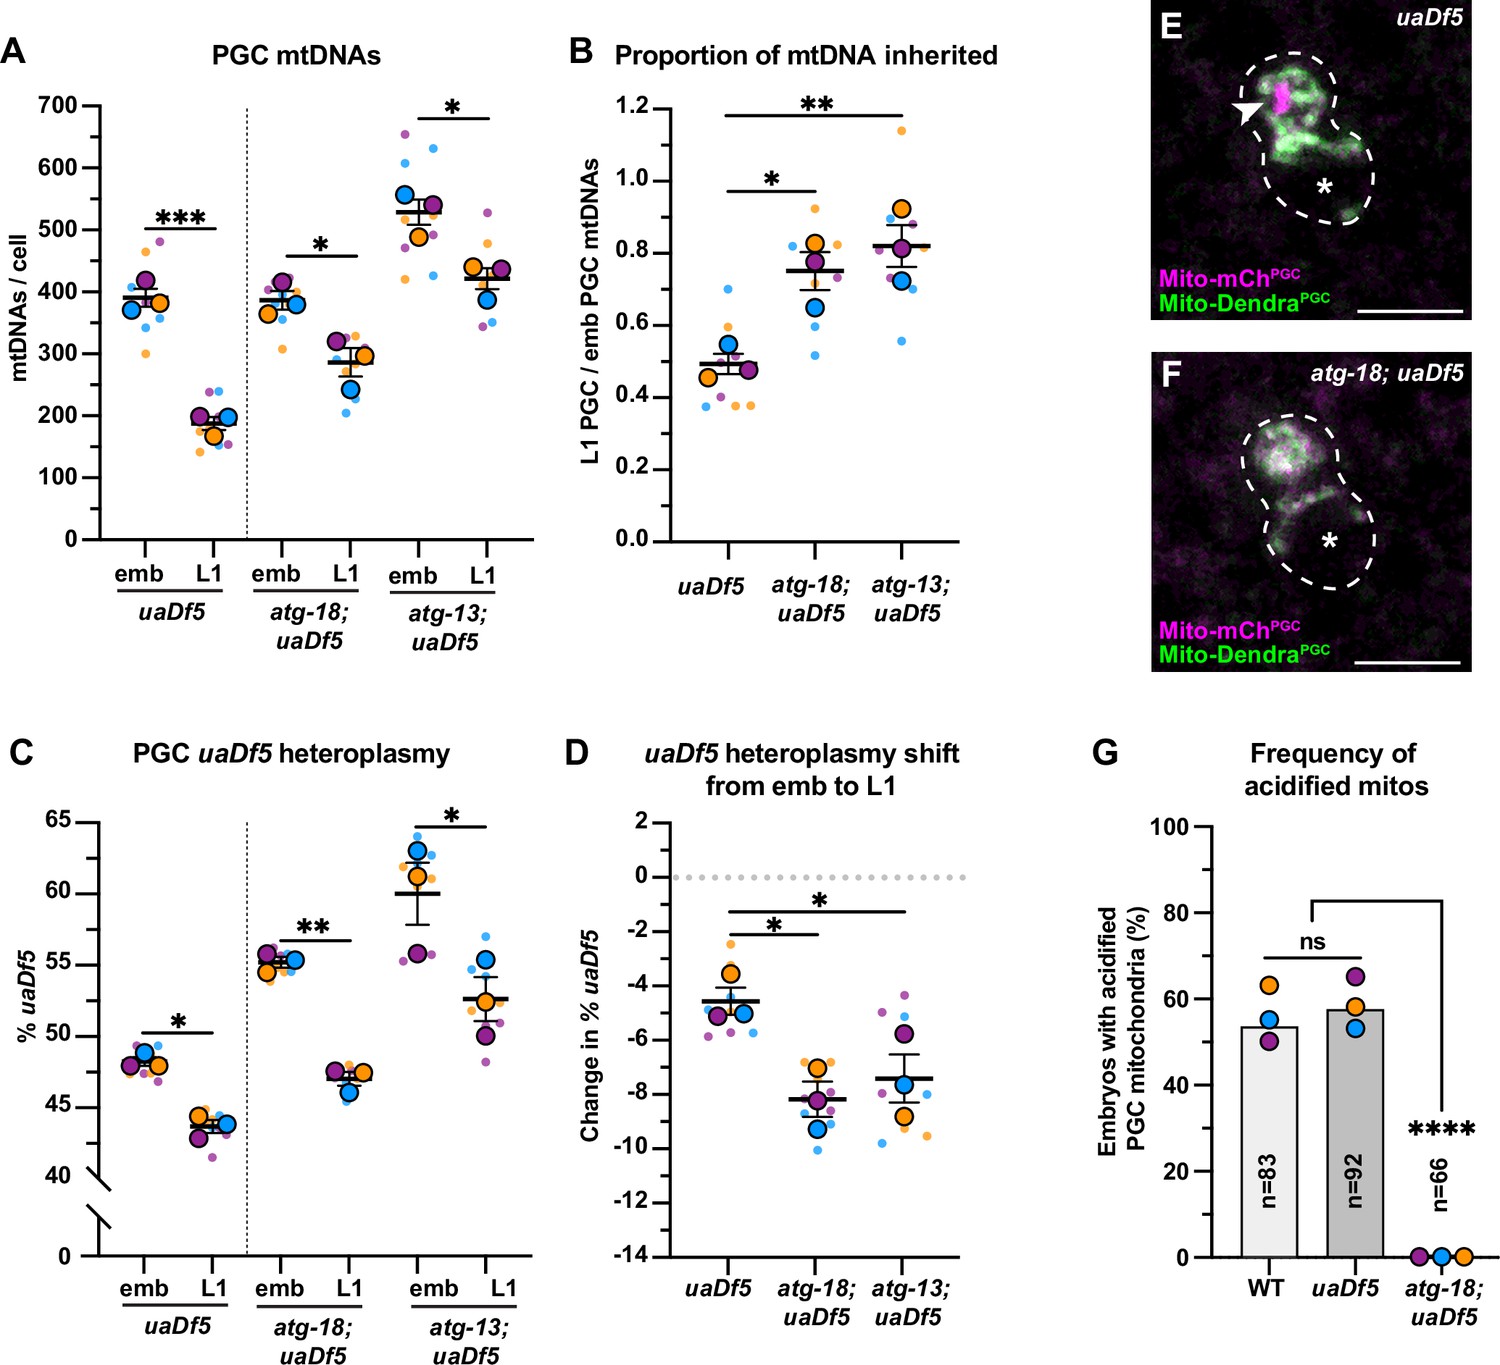
Autophagy eliminates a pool of primordial germ cell (PGC) mitochondrial DNAs (mtDNAs) non-selectively.
(A) mtDNA copy number in atg-18; uaDf5, and atg-13; uaDf5 embryonic and L1 PGCs; data shown for uaDf5 are provided for comparison, originate from Figure 4C, and are delineated with a dashed line. (B) Data from (A) presented as proportion of embryonic PGC mtDNAs inherited by L1 PGCs. (C) uaDf5 heteroplasmy in atg-18; uaDf5 and atg-13; uaDf5 PGCs; data shown for uaDf5 are provided for comparison, originate from Figure 4B, and are delineated with a dashed line. (D) Data from (C) presented as change in heteroplasmy shift from embryonic to L1 PGCs. Data in graphs: small dots are three technical replicates of droplet digital PCR (ddPCR) quantification from each of three color-coded biological replicates; the technical replicate mean from each experiment is shown as a larger circle, the mean of means as a horizontal line, and the SEM as error bars. n.s., not significant (p>0.05), *p≤0.05, **p≤0.01, ***p≤0.001 paired (C) and unpaired (A, B, D) two-tailed Student’s t-test. (E–F) Acidified mitochondria (magenta regions, arrowhead in E) in uaDf5 PGCs (E) and absent in atg-18; uaDf5 PGCs (F). (G) Percentage of embryos with acidified mitochondria in PGCs. Three biological replicates (N≥16) are shown as colored circles, with peak a of the bar on the graph representing the mean. Fisher’s exact test was used to determine statistical significance. n.s., not significant (p>0.05), ****p≤0.0001.
-
Figure 5—source data 1
Related to Figure 5A–D and G.
- https://cdn.elifesciences.org/articles/80396/elife-80396-fig5-data1-v2.xlsx
Figure 5—figure supplement 1
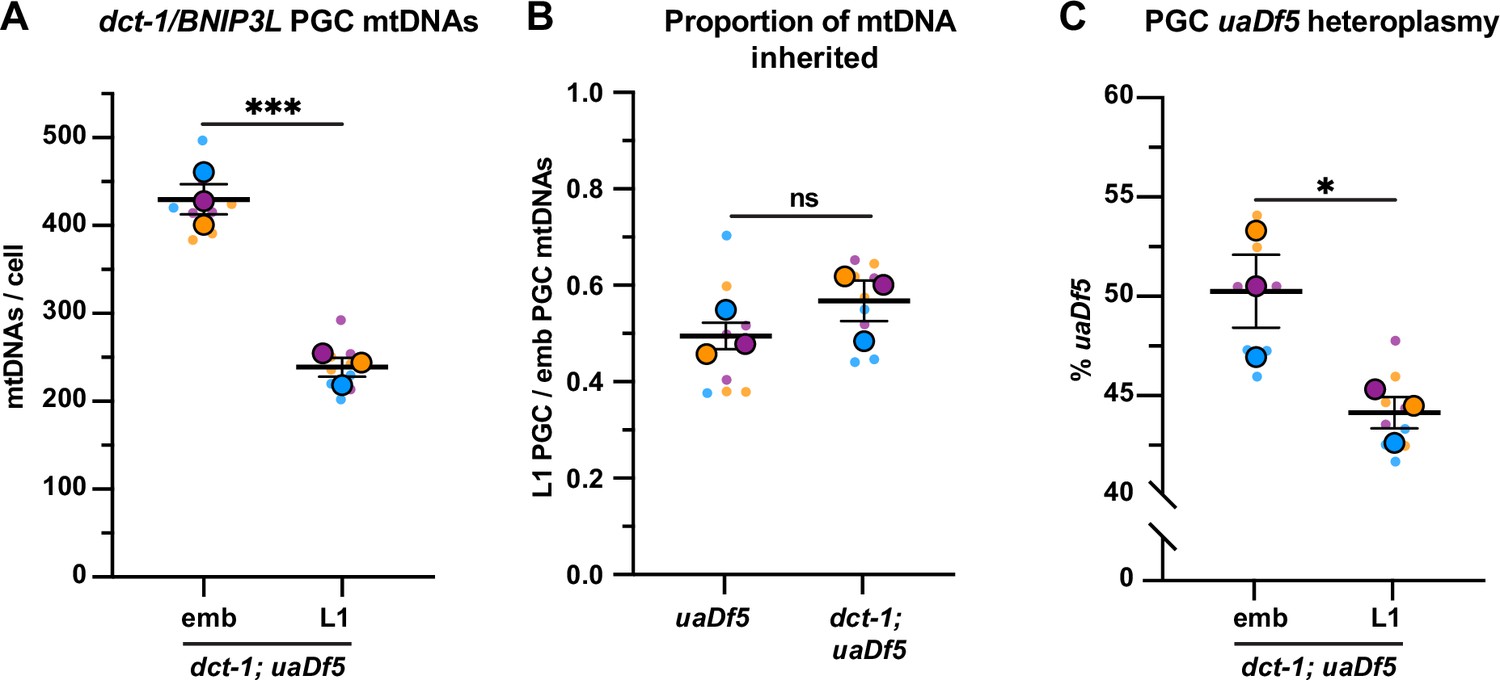
dct-1/BNIP3L is not required for mitochondrial DNA (mtDNA) regulation in primordial germ cells (PGCs).
(A) mtDNA copy number in dct-1; uaDf5 embryonic and L1 PGCs; (B) Data from (A) presented as proportion of embryonic PGC mtDNAs inherited by L1 PGCs; data shown for uaDf5 are provided for comparison and originate from Figure 4B. (C) Percentage of uaDf5 heteroplasmy in dct-1; uaDf5 PGCs. Data in graphs: small dots are three technical replicates of droplet digital PCR (ddPCR) quantification from each of three color-coded biological replicates; the technical replicate mean from each experiment is shown as a larger circle, the mean of means as a horizontal line, and the SSEM as error bars. n.s., not significant (p>0.05), *p≤0.05, ***p≤0.001, paired (C) and unpaired (A, B) two-tailed Student’s t-test.
-
Figure 5—figure supplement 1—source data 1
Related to Figure 5—figure supplement 1A-C.
- https://cdn.elifesciences.org/articles/80396/elife-80396-fig5-figsupp1-data1-v2.xlsx
Figure 6
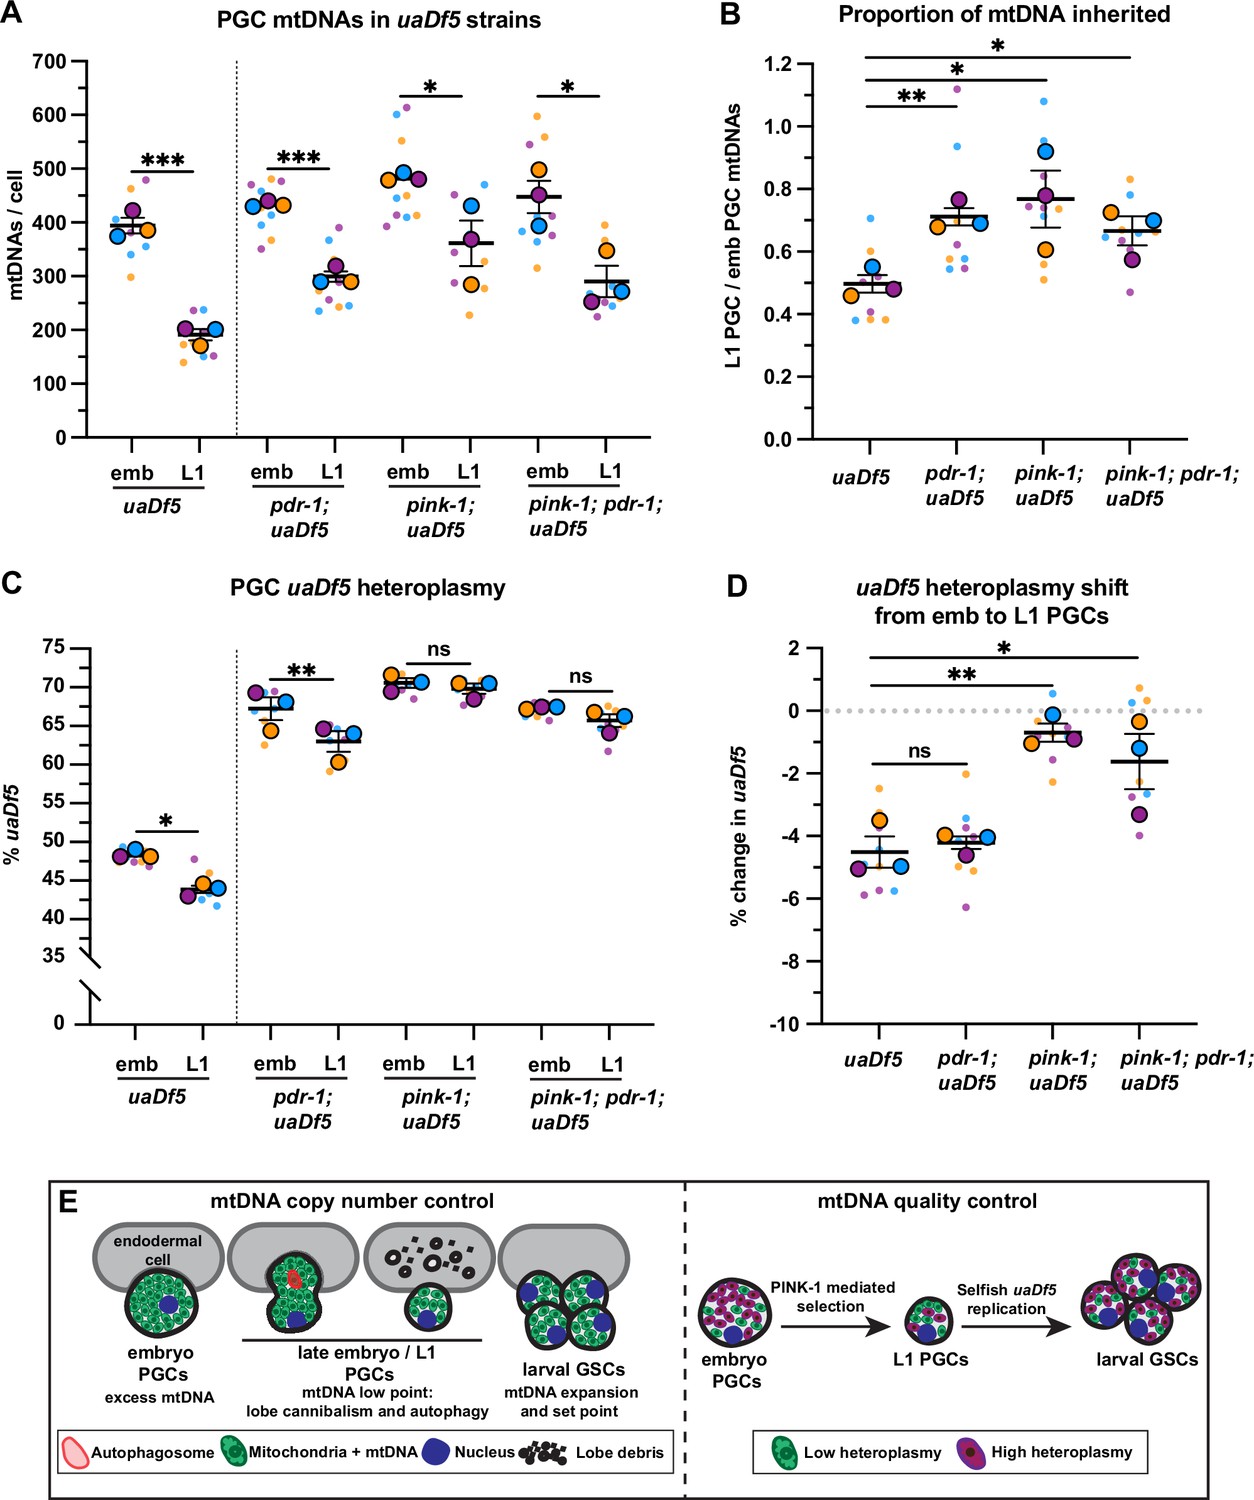
PINK-1 mediates mitochondrial DNA (mtDNA) purifying selection in primordial germ cells (PGCs).
(a) mtDNA copy number in pdr-1; uaDf5, pink-1; uaDf5, and pink-1; pdr-1; uaDf5 embryonic and L1 PGCs; data shown for uaDf5 are provided for comparison, originate from Figure 4C, and are delineated with a dashed line. (B) Data from (A) presented as proportion of embryonic PGC mtDNAs inherited by L1 PGCs. (C) Percent uaDf5 heteroplasmy in pdr-1; uaDf5, pink-1; uaDf5, and pink-1; pdr-1; uaDf5 PGCs; data shown for uaDf5 are provided for comparison, originate from Figure 4B, and are delineated with a dashed line. (D) Data from (C) presented as change in heteroplasmy shift from embryonic to L1 PGCs. Data in graphs: small dots are three technical replicates of droplet digital PCR (ddPCR) quantification from each of three color-coded biological replicates; the technical replicate mean from each experiment is shown as a larger circle, the mean of means as a horizontal line, and the SEM as error bars. n.s., not significant (p>0.05), *p≤0.05, **p≤0.01, ***p≤0.001, paired (C) and unpaired (A, B, D) two-tailed Student’s t-test. (E) Model for regulation of mtDNA quantity and quality in PGCs and germline stem cells (GSCs).
-
Figure 6—source data 1
Related to Figure 6A–D.
- https://cdn.elifesciences.org/articles/80396/elife-80396-fig6-data1-v2.xlsx
Author response image 1
Tables
Key resources table
| Reagent type (species) or resource | Designation | Source or reference | Identifiers | Additional information |
|---|---|---|---|---|
| Strain, strain background (C. elegans) | C. elegans wild isolate | Caenorhabditis Genetics Center (CGC) | N2 | |
| Strain, strain background (C. elegans) | atg-18(gk378) V | CGC | VC893 | |
| Strain, strain background (C. elegans) | atg-13(bp414) III | CGC | HZ1688 | |
| Strain, strain background (C. elegans) | pdr-1(gk448) III | CGC | VC1024 | |
| Strain, strain background (C. elegans) | xnSi1 [mex-5p::GFP-PH::nos-2 3’UTR, unc-119(+)] II; unc-119(ed3) III | Chihara and Nance, 2012 | FT563 | |
| Strain, strain background (C. elegans) | hmg-5(xn107[hmg-5-GFP]) IV | This study | FT2064 | hmg-5(xn107) made by Clustered Regularly Interspaced Short Palindromic Repeats (CRISPR). |
| Strain, strain background (C. elegans) | hmg-5(xn107[hmg-5-GFP]) IV; xnIs360 [pMRR08(mex-5p::mCherry-PH::nos-2 3’UTR, unc-119(+))] V | This study | FT2133 | Shown in Figure 1J–K. |
| Strain, strain background (C. elegans) | xnSi67 [pYA57(mex-5p::mito-tomm-201-54-Dendra2::nos-2 3’UTR, unc-119(+))] I; unc-119(ed3) III | This study | FT1885 | Made by Mos1-mediated single copy insertion (MosSCI). |
| Strain, strain background (C. elegans) | xnSi67 [pYA57(mex-5p::mito-tomm-201-54-Dendra2::nos-2 3’UTR, unc-119(+))] I; xnIs360 [pMRR08(mex-5p::mCherry-PH::nos-2 3’UTR, unc-119(+))] V | This study | FT1900 | Shown in Figure 1B–D, Figure 1—figure supplement 1, and Figure 2C–D. |
| Strain, strain background (C. elegans) | xnSi67 [pYA57(mex-5p::mito-tomm-201-54-Dendra2::nos-2 3’UTR, unc-119(+))] I; xnSi45 [pYA11(mex-5p::mCherry-moma-1::nos-2 3’UTR, unc-119(+))] II | This study | FT2366 | Shown in Figure 1G and Figure 2—figure supplement 4. |
| Strain, strain background (C. elegans) | xnSi67 [pYA57(mex-5p::mito-tomm-201-54-Dendra2::nos-2 3’UTR, unc-119(+))] I; xnSi45 [pYA11(mex-5p::mCherry-moma-1::nos-2 3’UTR, unc-119(+))] II; uaDf5 /+ mtDNA | This study | FT2414 | Shown in Figure 5E. |
| Strain, strain background (C. elegans) | xnSi67 [pYA57(mex-5p::mito-tomm-201-54-Dendra2::nos-2 3’UTR, unc-119(+))] I; xnSi45 [pYA11(mex-5p::mCherry-moma-1::nos-2 3’UTR, unc-119(+))] II; atg-18(gk378) V; uaDf5 /+ mtDNA | This study | FT2417 | Shown in Figure 5F. |
| Strain, strain background (C. elegans) | xnSi73 [mex-5p::GFP1-10::nos-2 3’UTR, unc-119(+)] I; xnSi45 [pYA11(mex-5p::mCherry-moma-1::nos-2 3’UTR)] II | This study | FT2128 | xnSi73 made by CRISPR, see Methods. |
| Strain, strain background (C. elegans) | xnSi85 [mex-5p::mito(matrix)-GFP1-10::nos-2 3’UTR] I; xnSi45 [pYA11(mex-5p::mCherry-moma-1::nos-2 3’UTR, unc-119(+))] II | This study | FT2293 | xnSi85 made by CRISPR, see Methods |
| Strain, strain background (C. elegans) | xnSi85 [mex-5p::mito(matrix)-GFP1-10::nos-2 3’UTR] I; xnSi45 [pYA11(mex-5p::mCherry-moma-1::nos-2 3’UTR, unc-119(+))] II; hmg-5(xn168[hmg-5-GFP11]) IV | This study | FT2296 | hmg-5(xn168) made by CRISPR. Shown in Figure 3A–F, and Figure 3—figure supplement 1A, B |
| Strain, strain background (C. elegans) | glh-1(sam24[glh-1-GFP-3xFLAG]) I; xnIs510 [pYA12(ehn-3p::mCherry-PH, unc-119(+))] II | This study | FT2279 | glh-1(sam24) a gift from Dustin Updike (MDI Biological Laboratory) (Marnik et al., 2019). Base strain used for all cell sorting. Related to 2—6. |
| Strain, strain background (C. elegans) | glh-1(sam24[glh-1-GFP-3xFLAG]) I; xnIs510 [pYA12(ehn-3p::mCherry-PH, unc-119(+))] II; uaDf5 /+ mtDNA | This study | FT2283 | Related to data shown in Figure 4 |
| Strain, strain background (C. elegans) | glh-1(sam24[glh-1-GFP-3xFLAG]) I; xnIs510 [pYA12(ehn-3p::mCherry-PH, unc-119(+))] II; hmg-5(xn107[hmg-5-GFP]) IV | This study | FT2312 | Related to data shown in Figure 2. |
| Strain, strain background (C. elegans) | glh-1(sam24[glh-1-GFP-3xFLAG]) I; xnIs510 [pYA12(ehn-3p::mCherry-PH, unc-119(+))] II; nop-1(full CRISPR deletion) III | This study | FT2323 | nop-1 deletion a gift from Heng-Chi Lee (University of Chicago) (Zhang et al., 2018). Related to data shown in 2–3. |
| Strain, strain background (C. elegans) | glh-1(sam24[glh-1-GFP-3xFLAG]) I; xnIs510 [pYA12(ehn-3p::mCherry-PH, unc-119(+))] II; nop-1(full CRISPR deletion) III; uaDf5 /+ mtDNA | This study | FT2332 | Related to data shown in Figure 4C–E |
| Strain, strain background (C. elegans) | glh-1(sam24[glh-1-GFP-3xFLAG]) I; xnIs510 [pYA12(ehn-3p::mCherry-PH, unc-119(+))] II; atg-18(gk378) V; uaDf5 /+ mtDNA | This study | FT2347 | Related to data shown in Figure 5 |
| Strain, strain background (C. elegans) | glh-1(sam24[glh-1-GFP-3xFLAG]) I; xnIs510 [pYA12(ehn-3p::mCherry-PH, unc-119(+))] II; atg-13(bp414) III; uaDf5 /+ mtDNA | This study | FT2402 | Related to data shown in Figure 5 |
| Strain, strain background (C. elegans) | glh-1(sam24[glh-1-GFP-3xFLAG]) I; xnIs510 [pYA12(ehn-3p::mCherry-PH, unc-119(+))] II; nop-1(full CRISPR deletion) III; atg-18(gk378) V | This study | FT2443 | Related to data shown in Figure 2 |
| Strain, strain background (C. elegans) | glh-1(sam24[glh-1-GFP-3xFLAG]) I; xnIs510 [pYA12(ehn-3p::mCherry-PH, unc-119(+))] II; pdr-1(gk448) III; uaDf5 /+ mtDNA | This study | FT2364 | Related to data shown in Figure 6 |
| Strain, strain background (C. elegans) | glh-1(sam24[glh-1-GFP-3xFLAG]) I; pink-1(xn199[pink-1(STOP-IN)]); xnIs510 [pYA12(ehn-3p::mCherry-PH, unc-119(+))] II; uaDf5 /+ mtDNA | This study | FT2432 | pink-1(xn199) made by CRISPR. Related to data shown in Figure 6. |
| Strain, strain background (C. elegans) | glh-1(sam24[glh-1-GFP-3xFLAG]) I; pink-1(xn199[pink-1(STOP-IN)]); xnIs510 [pYA12(ehn-3p::mCherry-PH, unc-119(+))] II; pdr-1(gk448) III; uaDf5 /+ mtDNA | This study | FT2378 | Related to data shown in Figure 6. |
| Strain, strain background (C. elegans) | glh-1(sam24[glh-1-GFP-3xFLAG]) I; xnIs510 [pYA12(ehn-3p::mCherry-PH, unc-119(+))] II; mptDf2 /+ mtDNA | This study | FT2387 | Related to data shown in Figure 4—figure supplement 1. |
| Strain, strain background (C. elegans) | glh-1(sam24[glh-1-GFP-3xFLAG]) I; xnIs510 [pYA12(ehn-3p::mCherry-PH, unc-119(+))] II; dct-1(xn192[dct-1(STOP-IN)]) X uaDf5 /+mtDNA | This study | FT2339 | dct-1(xn192) made by CRISPR. Related to data shown in Figure 5—figure supplement 1. |
| Strain, strain background (C. elegans) | xnSi67 [pYA57(mex-5p::mito(tomm-201-54)-Dendra2::nos-2 3’UTR)] I; xnSi45 [pYA11(mex-5p::mCherry-moma-1::nos-2 3’UTR, unc-119(+))] II; uaDf5 /+ mtDNA | This study | FT2414 | Shown in Figure 5E. |
| Strain, strain background (C. elegans) | xnSi67 [pYA57(mex-5p::mito(tomm-201-54)-Dendra2::nos-2 3’UTR)] I; xnSi45 [pYA11(mex-5p::mCherry-moma-1::nos-2 3’UTR, unc-119(+))] II; atg-18(gk378) V; uaDf5 /+ mtDNA | This study | FT2417 | Shown in Figure 5F. |
| Sequence-based reagent | ocrAS_Dendra-C-term | Integrated DNA Technologies (IDT) | GTCCTCTACCAAGTCAAGCA | crRNA to replace Dendra in xnSi67 |
| Sequence-based reagent | ocrAS_Dendra-N-Term | IDT | AGAATGTCGGACACAATTCT | crRNA to replace Dendra in xnSi67 |
| Sequence-based reagent | ocrAS01 | IDT | AAGGGAGAAGAATTATTTAC | crRNA used to add MLS to GFP1-10 in xnSi73 |
| Sequence-based reagent | ocrAS13 | IDT | ATCTGCATTTTCTTTCTGTT | crRNA used for hmg-5 C-terminal tagging |
| Sequence-based reagent | ocrAS19 | IDT | GGTGATAAATGGGTTTGAGA | crRNA used for dct-1(STOP-IN) |
| Sequence-based reagent | ocrAS20 | IDT | CAGGTGTACTCTCGGTCAAT | crRNA used for dct-1(STOP-IN) |
| Sequence-based reagent | ocrAS25 | IDT | AACTCCTAAATTATAAGTGG | crRNA used for pink-1(STOP-IN) |
| Sequence-based reagent | ocrAS26 | IDT | ATGAACTCCTAAATTATAAG | crRNA used for pink-1(STOP-IN) |
| Sequence-based reagent | oAS115 | IDT | TTTATCGATAATCAATTGA ATGTTTCAGACAGAGAAT GGCACTCCTGCAATCAC GTCTCCTCCTGTCCGCC CCACGTCGTGCCGCCG CCACCGCCCGTGCCGG AGCTGGTGCAGGCGCT GGAGCCGGAGCCATGT CTAAGGGAGAAGAACT CTTCACTGGAGTTGTT CCTATCCTCGTCGAGC TCGACGGAGACG | MLS-GFP1-10 repair template |
| Sequence-based reagent | oAS187 | IDT | tttgattacaaaatggaaag ttgtgacgaattcaaCTAG GTGATTCCGGCGG CATTGACATACTCA TGGAGGACCATGT GGTCACGTCCTCC TGAACCTCCTTGAT CTGCATTTTCTTTT TGTTCTGCTTCCC ATTTCTGGAGGAC GACATGGTATTCATCT | hmg-5-GFP11 repair template |
| Sequence-based reagent | oAS216 | IDT | aaaaagtaaaacaaac CAGGTGTACTCT CGGTCAAGCTAG CTTATCACTTAGT CAAGCATAATCTG GAACATCATATGG ATAAGCGTAGTCT GGAACGTCGTATG GATATGCATAGTCT GGCACGTCGTATG GGTAGACGGCTTT TGCGGATGGTGTT GTCTGTTGAGCCG | dct-1(STOP-IN) repair template |
| Sequence-based reagent | oAS245 | IDT | GAGCCTTTTTGAG TACGACATGAACT CCTAAATTAGCTA GCTTATCACTTAG TCACCTCTGCTCT GGACAAACTTCCC TCCTCCTGAACCT CCCGATGCTCCTG AGGCTCCCGATGC TCCTAAGTGGCGG GAAATATTCTCGGC AGGAAGCGTTG | pink-1(STOP-IN) repair template |
Additional files
-
Supplementary file 1
Supplemental sequences.
- https://cdn.elifesciences.org/articles/80396/elife-80396-supp1-v2.docx
-
Supplementary file 2
Combined ddPCR source data.
- https://cdn.elifesciences.org/articles/80396/elife-80396-supp2-v2.xlsx
-
MDAR checklist
- https://cdn.elifesciences.org/articles/80396/elife-80396-mdarchecklist1-v2.docx
Download links
A two-part list of links to download the article, or parts of the article, in various formats.
Downloads (link to download the article as PDF)
Open citations (links to open the citations from this article in various online reference manager services)
Cite this article (links to download the citations from this article in formats compatible with various reference manager tools)
Independent regulation of mitochondrial DNA quantity and quality in Caenorhabditis elegans primordial germ cells
eLife 11:e80396.
https://doi.org/10.7554/eLife.80396


