Activity regulates a cell type-specific mitochondrial phenotype in zebrafish lateral line hair cells
- Department of Biological Structure, University of Washington, United States
- Department of Otolaryngology-HNS, University of Washington, United States
Figures
Figure 1
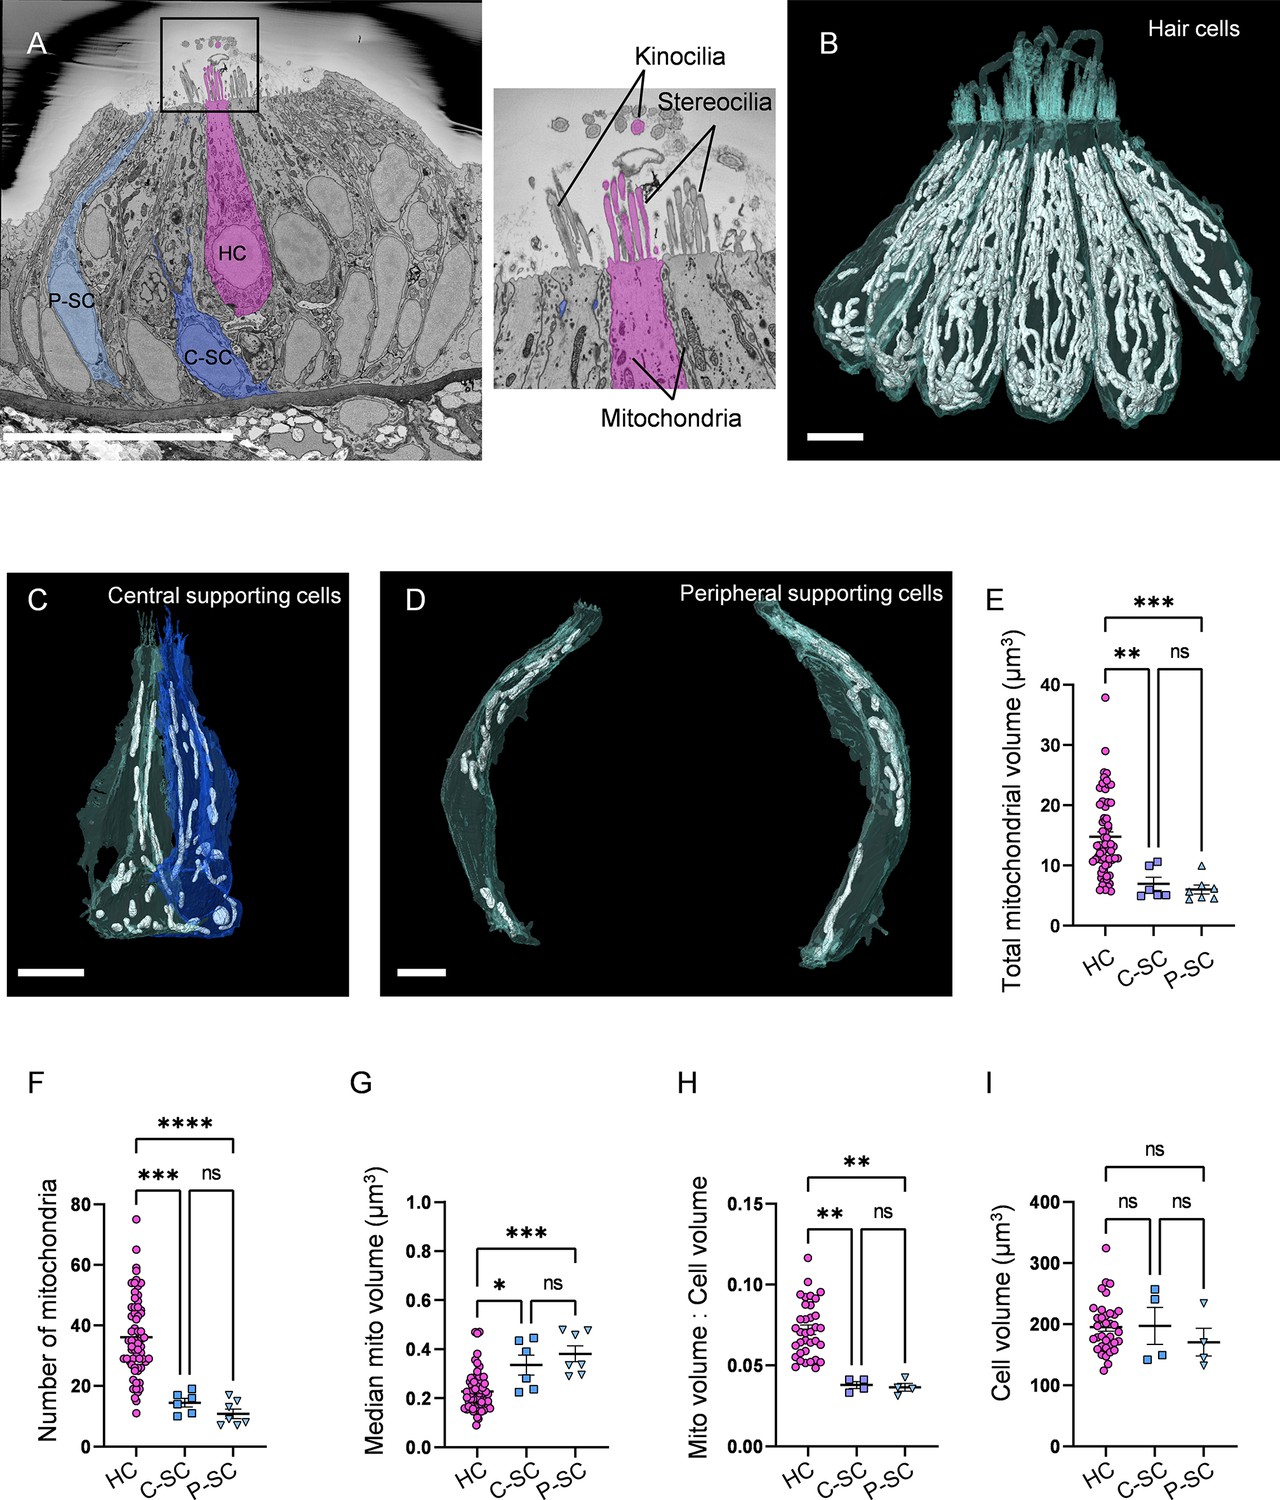
Hair cells (HCs) contain a higher mitochondrial volume than supporting cells.
(A) SEM cross-section through 5 days post fertilization (dpf) zebrafish neuromasts (NM) (NM3, Figure 1—source data 2). Scale bar = 20 µm. Inset shows the stereocilia bundle and kinocilium labeled for 1 HC. (B) Six reconstructed HCs from NM3, with mitochondria shown in white. Scale bar = 5 µm. (C) Two central supporting cells (C-SCs) reconstructed from NM3. Scale bar = 5 µm. (D) Two peripheral supporting cells (P-SCs) reconstructed from NM3. Scale bar = 3.5 µm. (E) Sum of mitochondrial volume for HCs, C-SCs, and P-SCs. (In µm3) HC: 14.8 ± 0.8; C-SC; 6.9 ± 1.1, P-SC; 6.0 ± 0.7. (F) Number of individual mitochondria in HCs, C-SCs, and P-SCs. HC: 36.1 ± 1.6; C-SC: 14.5 ± 1.4; P-SC: 10.9 ± 1.5. (G) The median mitochondrial volume in HCs, C-SCs, and P-SCs. HC: 0.2 ± 0.01; C-SC: 0.3 ± 0.04; P-SC: 0.4 ± 0.03. (H) The ratio of the total mitochondrial volume to the total cell volume in HCs, C-SCs, and P-SCs. HC: 0.07 ± 0.003; C-SC: 0.04 ± 0.002; P-SC: 0.04 ± 0.002. (I) The cell volume of HCs, C-SCs, and P-SCs. HC: 195.6 ± 7.2; C-SC: 197.4 ± 30.05; P-SC: 170.4 ± 22.7. Kruskal–Wallis test with Dunn’s multiple comparisons, *p<0.05, **p<0.01, ***p<0.001, ****p<0.0001. For (E–G), HC: n = 65, 5 NMs, 3 fish; C-SC: n = 6, 3 NMs, 2 fish; P-SC: n = 7, 3 NMs, 2 fish. For (H, I), HCs: n = 35, 3 NMs, 3 fish; C-SC: n = 4, 2 NMs, 2 fish; P-SC: n = 4, 2 NMs, 2 fish. Data are presented as the mean ± SEM.
-
Figure 1—source data 1
Raw values used in Figure 1.
- https://cdn.elifesciences.org/articles/80468/elife-80468-fig1-data1-v4.xlsx
-
Figure 1—source data 2
Datasets used in Figure 1.
- https://cdn.elifesciences.org/articles/80468/elife-80468-fig1-data2-v4.docx
Figure 2 with 2 supplements
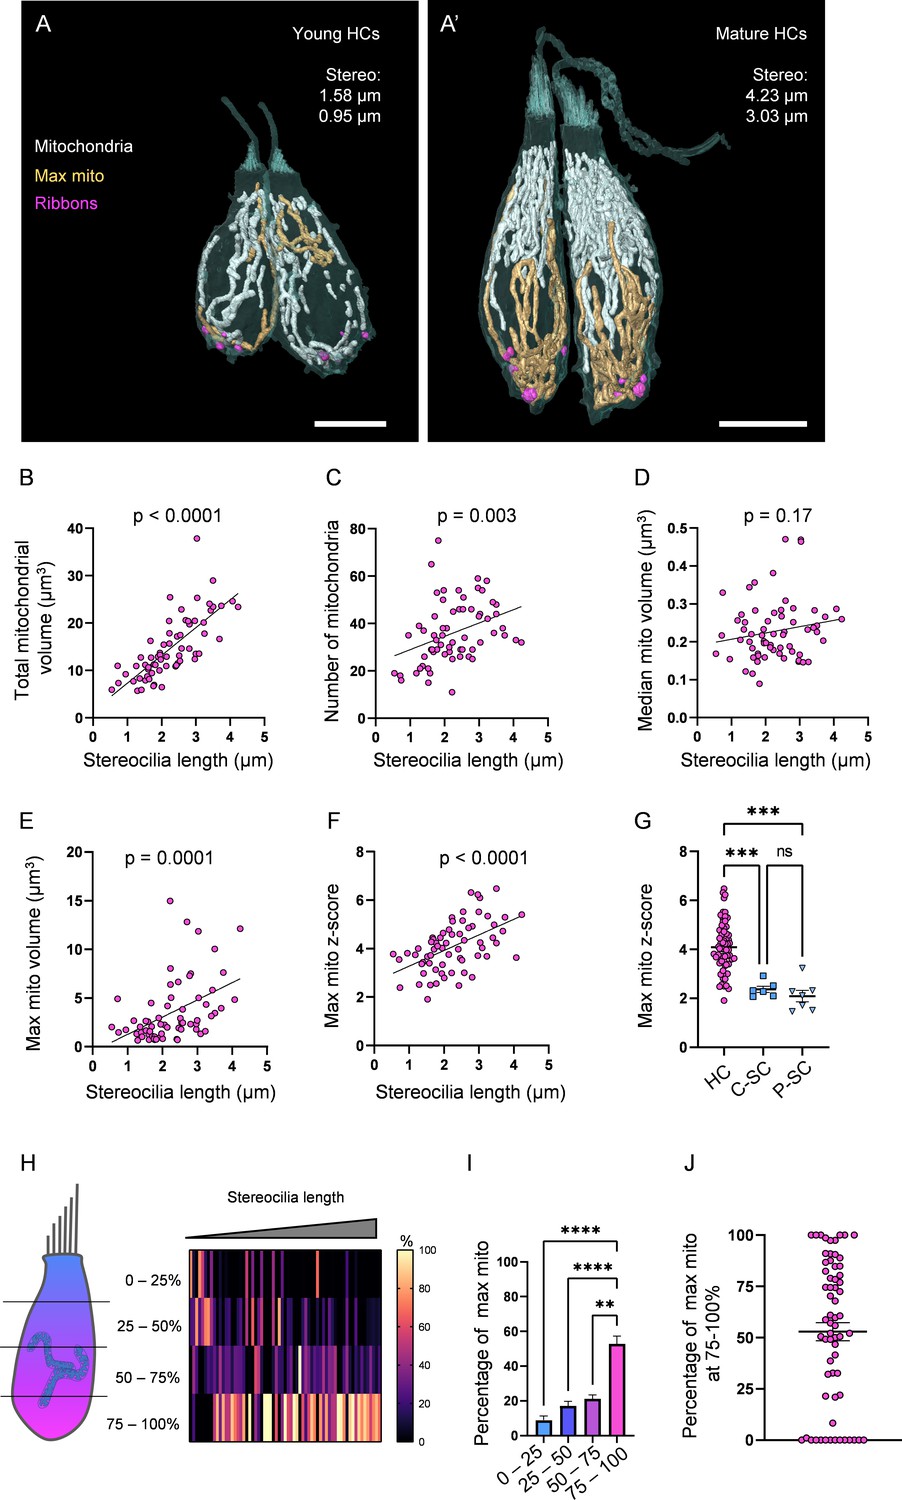
Hair cells (HCs) gradually develop a high mitochondrial volume with specific architecture.
(A) Two young HCs from a 5 days post fertilization (dpf) neuromasts (NM) (NM1, Figure 2—source data 2). Mitochondria are shown in white. Single largest mitochondrion (max mito) is shown in gold. Synaptic ribbons shown in purple. Scale bar = 5 µm. (A’) Two mature HCs from a 5 dpf NM (NM3, different HCs than in Figure 1B). Scale bar = 6 µm. (B) Relationship between HC stereocilia length and the total mitochondrial volume. (C) Relationship between HC stereocilia length and the number of individual mitochondria. (D) Relationship between HC stereocilia length and the volume of the median mitochondrion. (E) Relationship between HC stereocilia length and the volume of the largest mitochondrion (max mito). (F) Relationship between HC stereocilia length and the number of standard deviations between the max mito and average mitochondrial volume (max mito z-score). Lines represent standard linear regression, with significance as indicated. (G) The z-score of the max mito in HCs, central supporting cells (C-SCs), and peripheral supporting cells (P-SCs) (mean ± SEM) HC: 4.1 ± 0.1; C-SC: 2.4 ± 0.1, P-SC: 2.1 ± 0.2. Kruskal–Wallis test with Dunn’s multiple comparisons, ***p<0.001. (H) The percentage of the max mito located within each quadrant of an HC represented as a heat map. The length of each HC was normalized and broken into quadrants, with the highest HC point the base of the stereocilia bundle and the lowest point the lowest ribbon. The number of max mito segmentation coordinates within each quadrant of an HC were counted and represented as a percentage of all max mito coordinates. Cells are presented in order of their stereocilia lengths. (I) Summary of heat map data shown in (H). Most apical quadrant (0–25%): 9 ± 2.4%; 25–50%: 17.1 ± 2.7%; 50–75%: 21 ± 2.2%; Most basal quadrant (75–100%): 52.8 ± 4.4%. Kruskal–Wallis test with Dunn’s multiple comparisons, **p<0.01, ****p<0.0001. (J) Percentage of the max mito located within the most basal quadrant for individual HCs. HC: n = 65, 5 NMs, 3 fish; C-SC: n = 6, 3 NMs, 2 fish; P-SC: n = 7, 3 NMs, 2 fish.
-
Figure 2—source data 1
Raw values used in Figure 2.
- https://cdn.elifesciences.org/articles/80468/elife-80468-fig2-data1-v4.xlsx
-
Figure 2—source data 2
Datasets used in Figure 2.
- https://cdn.elifesciences.org/articles/80468/elife-80468-fig2-data2-v4.docx
Figure 2—figure supplement 1
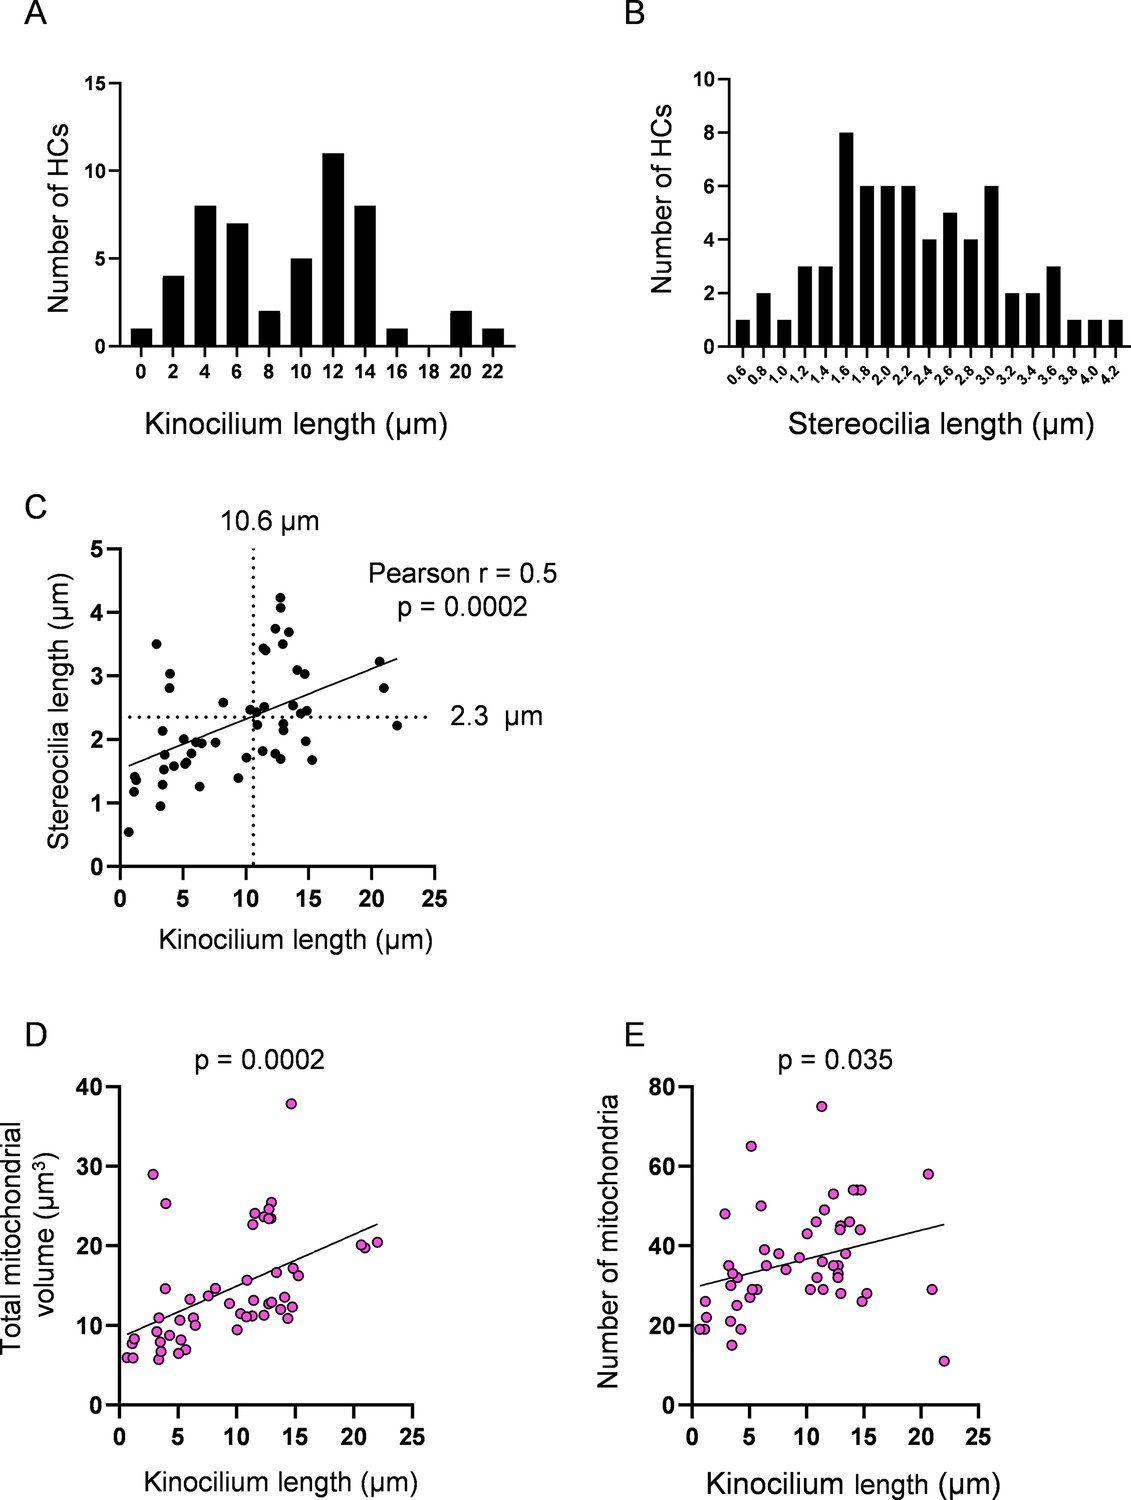
Hair cell (HC) kinocilia and stereocilia lengths as representatives of cell age.
(A) Histogram showing the distribution of HC ages via kinocilium length. Median = 10.6 µm. Kinocilia lengths were achieved for n = 50 HCs, 4 neuromasts (NMs), 3 fish. (A’) Histogram showing the distribution of HC ages via stereocilia length. Median = 2.1 µm. Stereocilia data were achieved for n = 65 HCs, 5 NMs, 3 fish. (C) Relationship between kinocilium length and stereocilia length. According to the linear regression, the median of the HC kinocilium data predicted a stereocilia length of 2.3 µm. (D) Relationship between HC kinocilium length and the total mitochondrial volume. (E) Relationship between HC kinocilium length and the number of mitochondria. Solid black lines represent standard linear regression with significance as indicated.
-
Figure 2—figure supplement 1—source data 1
Raw values used in Figure 2—figure supplement 1.
- https://cdn.elifesciences.org/articles/80468/elife-80468-fig2-figsupp1-data1-v4.xlsx
Figure 2—figure supplement 2
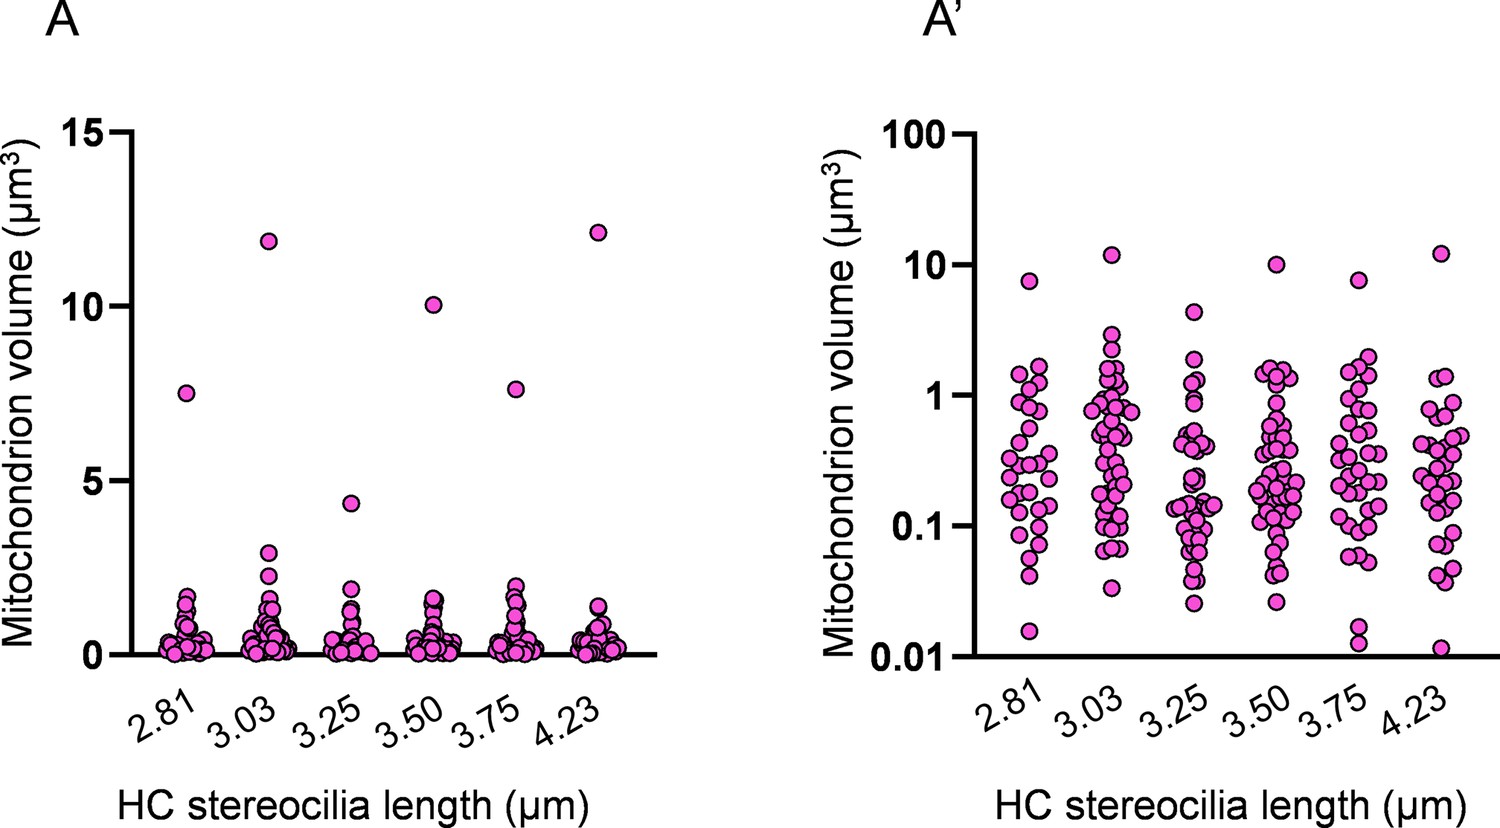
Distribution of individual mitochondrion volumes in mature hair cells (HCs).
(A) Distribution of all HC mitochondria volumes in six representative mature HCs. Length of HC stereocilia listed below. (A’) The same data as in (A) plotted on a logarithmic scale.
-
Figure 2—figure supplement 2—source data 1
Raw values used in Figure 2—figure supplement 2.
- https://cdn.elifesciences.org/articles/80468/elife-80468-fig2-figsupp2-data1-v4.xlsx
Figure 3 with 1 supplement
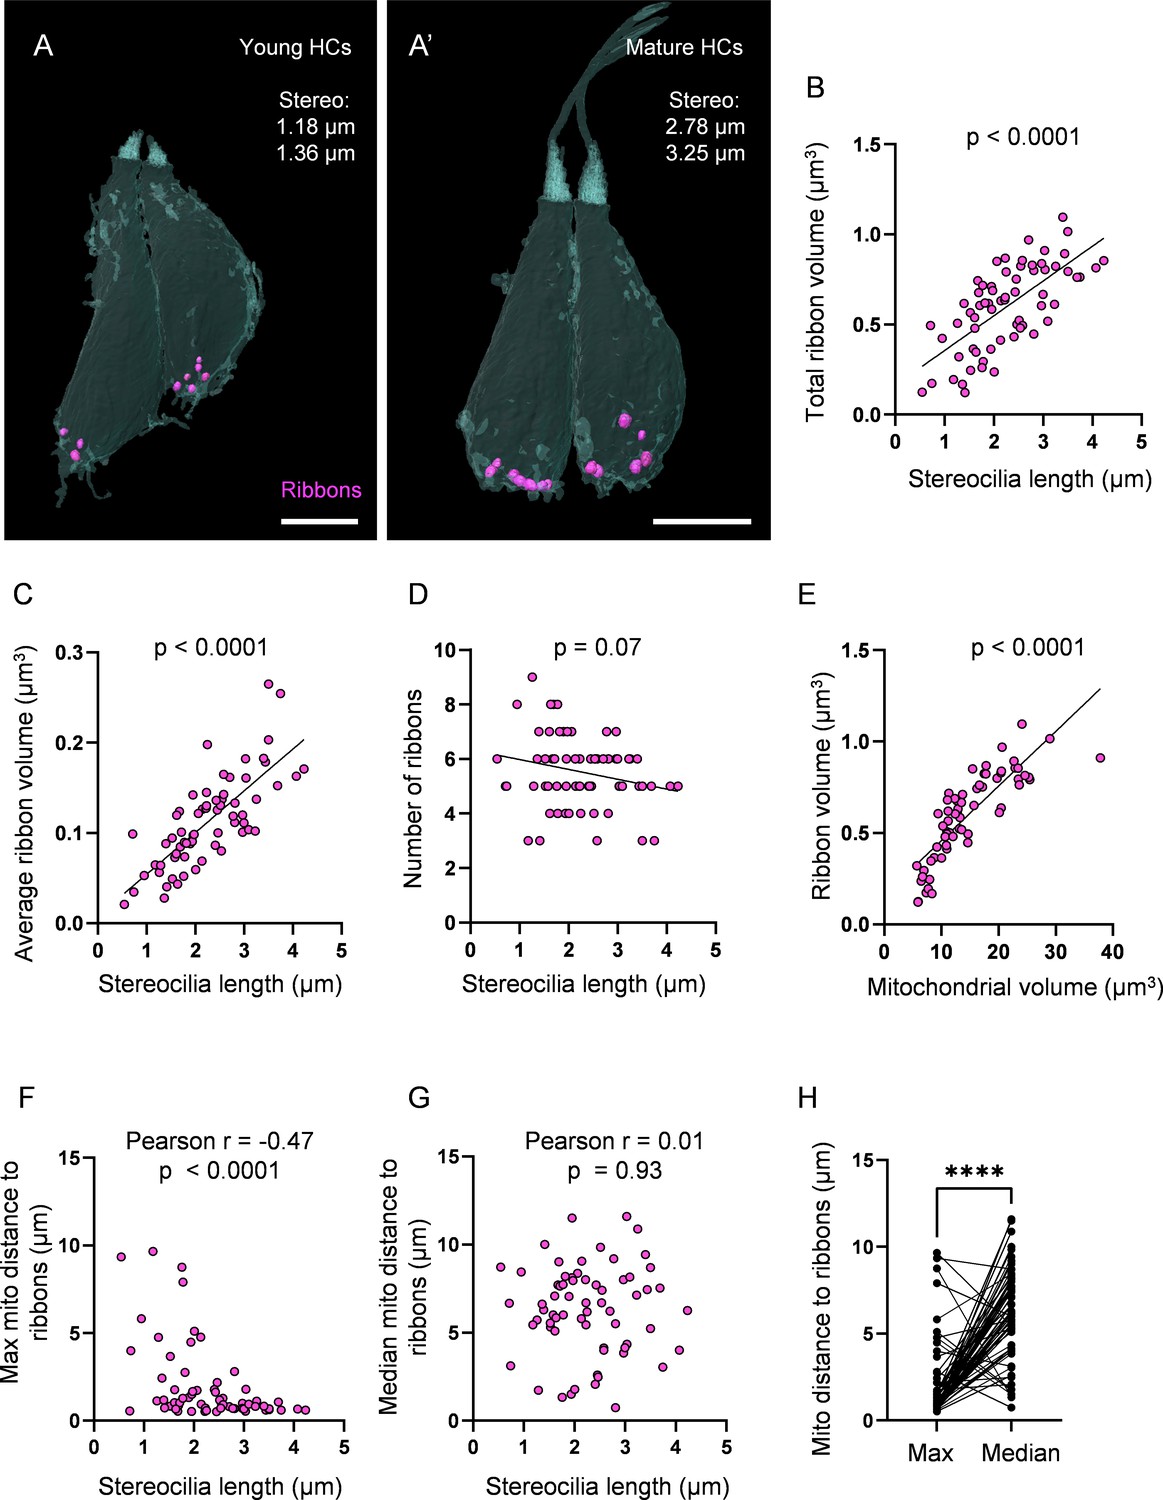
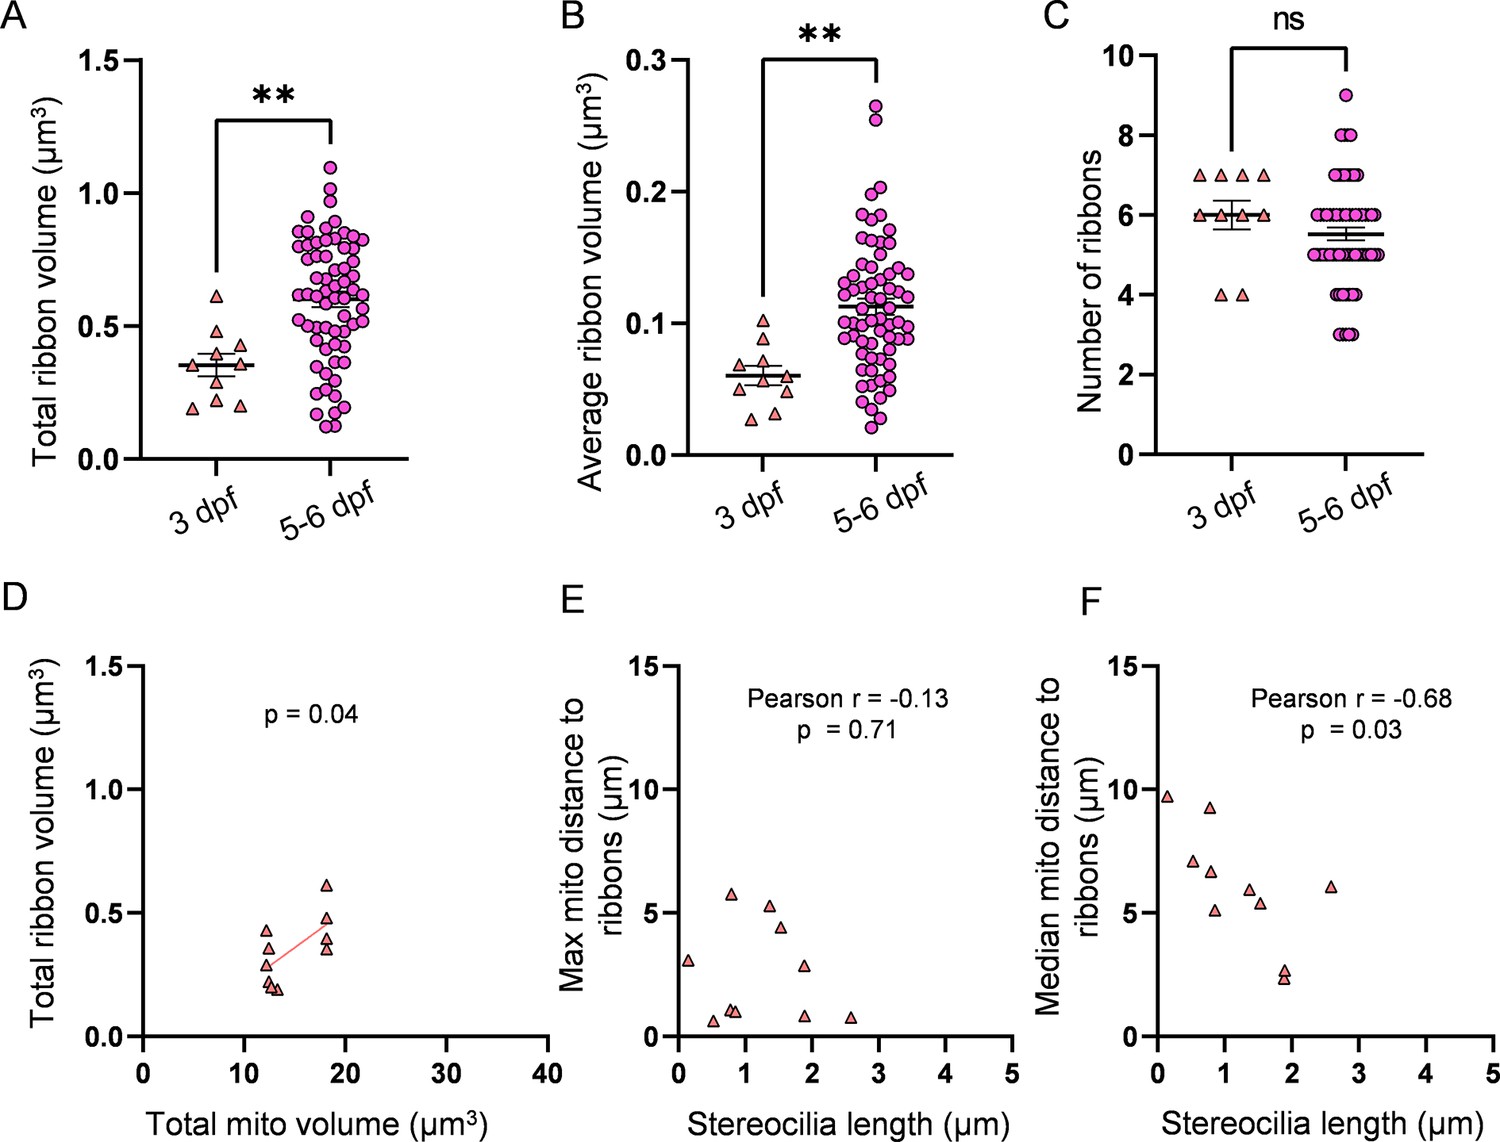
Ribbon growth parallels mitochondrial growth and localization.
(A) Two representative young hair cells (HCs) from a 6 days post fertilization (dpf) neuromasts (NM) (NM4, Figure 3—source data 2) with synaptic ribbons shown in purple. Scale bar = 4.5 µm. (A’) Two representative mature HCs from a 6 dpf NM (NM4, Figure 3—source data 2). Scale bar = 4 µm. (B) Relationship between HC stereocilia length and the total ribbon volume. (C) Relationship between HC stereocilia length and the average ribbon volume. (D) Relationship between HC stereocilia length and the number of ribbons. (E) Relationship between HC total mitochondrial volume and HC ribbon volume. Black line = standard linear regression, with significance as indicated. (F) Relationship between HC stereocilia length and the average minimum distance between each ribbon and the max mito. (G) Relationship between HC stereocilia length and the average minimum distance between each ribbon and the median mito. (H) Average minimum distance between each ribbon and the HC max or median mito. (In µm) Max mito: 1.9 ± 0.3; median mito: 6.3 ± 0.3. Mann–Whitney test, ****p<0.0001. HC: n = 65, 5 NMs, 3 fish, 5–6 dpf.
-
Figure 3—source data 1
Raw values used in Figure 3.
- https://cdn.elifesciences.org/articles/80468/elife-80468-fig3-data1-v4.xlsx
-
Figure 3—source data 2
Datasets used in Figure 3.
- https://cdn.elifesciences.org/articles/80468/elife-80468-fig3-data2-v4.docx
Figure 3—figure supplement 1
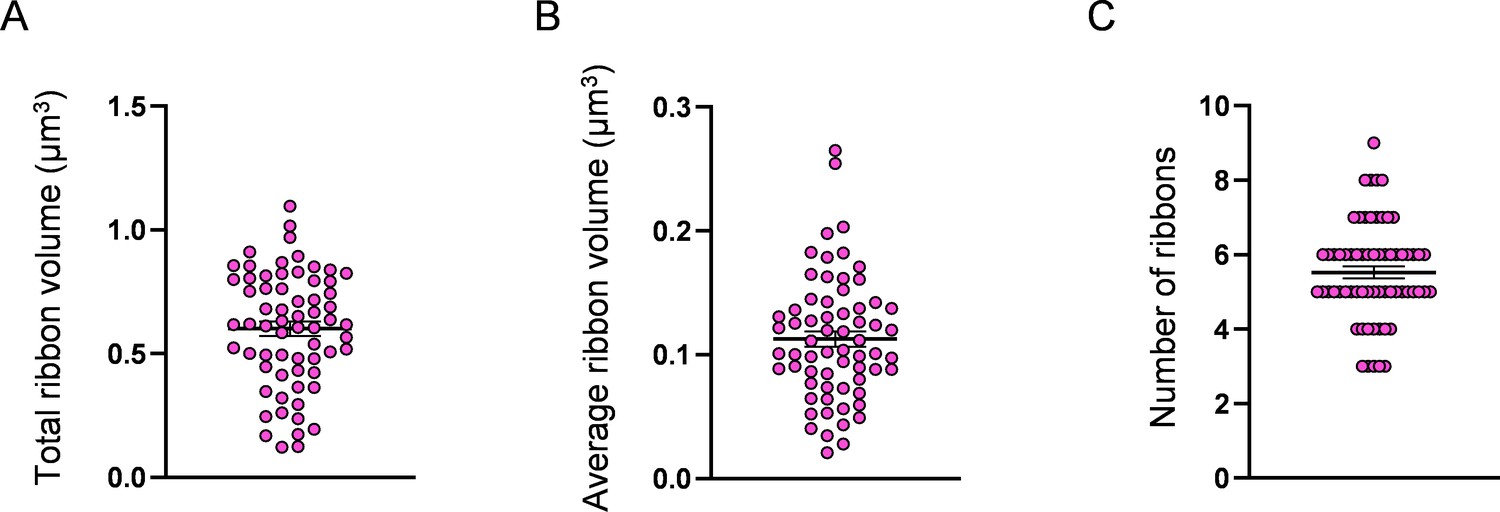
Measurement of hair cell (HC) ribbon number and volume.
(A) HC total ribbon volume, 0.6 ± 0.03 µm3. (B) HC average ribbon volume, 0.1 ± 0.006 µm3. (C) Number of ribbons, 5.5 ± 0.2. Data are presented as the mean ± SEM.
-
Figure 3—figure supplement 1—source data 1
Raw values used in Figure 3—figure supplement 1.
- https://cdn.elifesciences.org/articles/80468/elife-80468-fig3-figsupp1-data1-v4.xlsx
Figure 4 with 2 supplements
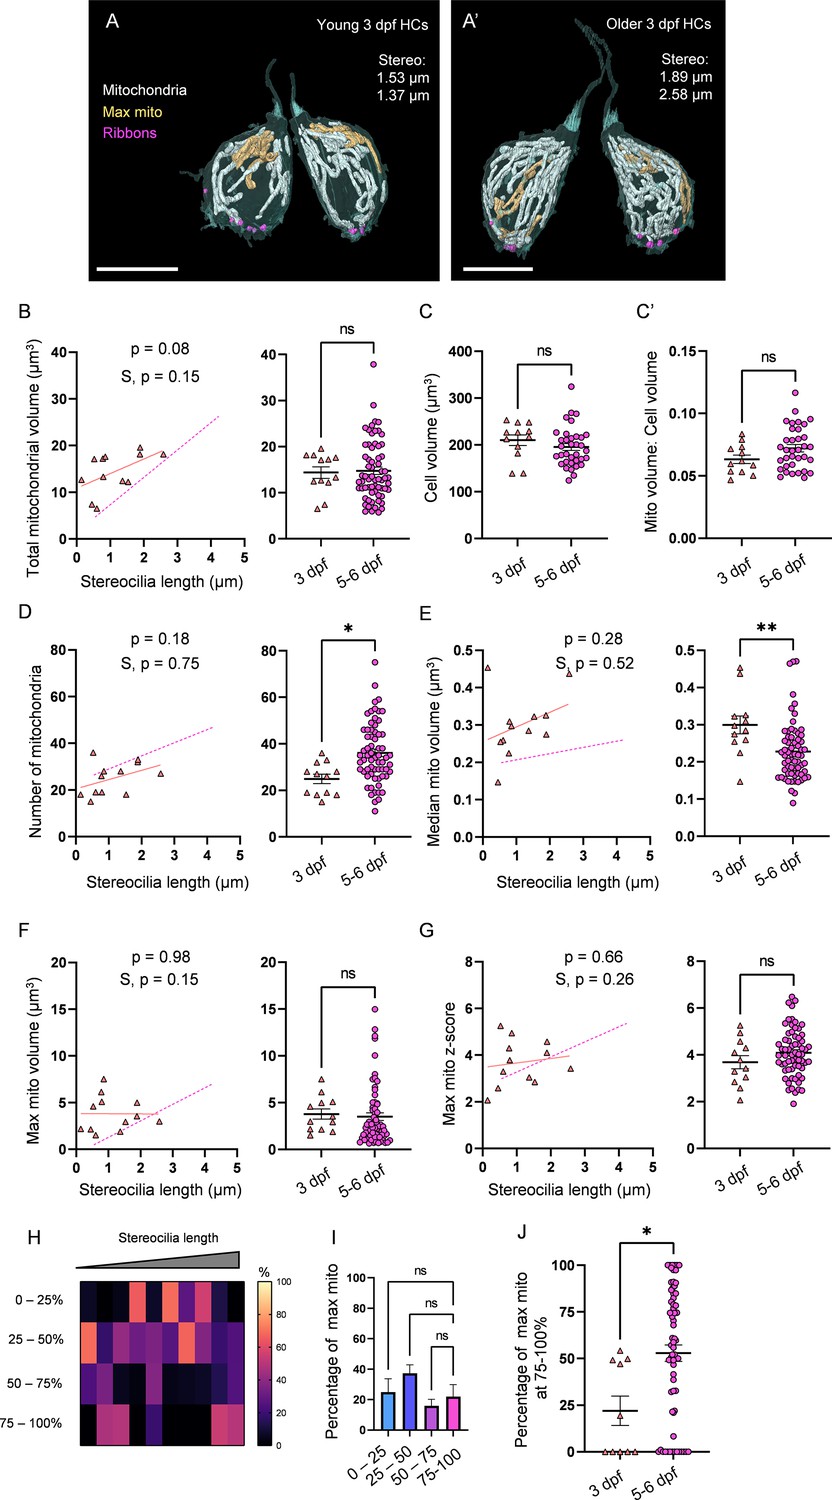
3 days post fertilization (dpf) hair cells (HCs) demonstrate immature mitochondrial architecture.
(A) Representative young HCs from a 3 dpf neuromasts (NM) (NM6, Figure 4—source data 2). Max mito shown in gold. Synaptic ribbons shown in purple. Scale bar = 8 µm. (A’) Representative older HCs from a 3 dpf NM (NM6, Figure 4—source data 2). Scale bar = 6 µm. (B) Comparison of total mitochondrial volume development (left) and average (right) between 3 dpf and 5–6 dpf HCs. On average (in µm3): 3 dpf: 14.4 ± 1.2; 5–6 dpf: 14.8 ± 0.8. Kolmogorov–Smirnov test, p=0.49. (C) Total HC volume for 3 dpf and 5–6 dpf HCs. (In µm3) 3 dpf: 210.1 ± 11.3; 5–6 dpf: 195.6 ± 7.2. Kolmogorov–Smirnov test, p=0.2. (C’) Ratio of total mitochondrial volume to HC volume. 3 dpf: 0.06 ± 0.003; 5–6 dpf: 0.07 ± 0.003. Kolmogorov–Smirnov test, p=0.41. (D) Comparison of the number of HC mitochondria over development (left) and on average (right) in 3 dpf and 5–6 dpf HCs. On average: 3 dpf: 25.0 ± 2; 5–6 dpf: 36.1 ± 1.6. Kolmogorov–Smirnov test, p=0.022. (E) Comparison of the median mitochondrial volume over development (left) and on average (right). On average (in µm3): 3 dpf: 0.3 ± 0.02; 5–6 dpf: 0.2 ± 0.01. Kolmogorov–Smirnov test, p=0.005. (F) Comparison of the max mito volume over development (left) and on average (right). On average (in µm3): 3 dpf: 3.8 ± 0.5; 5–6 dpf: 3.5 ± 0.4. Kolmogorov–Smirnov test, p=0.32. (G) Comparison of the max mito z-score in 3 dpf and 5–6 dpf HCs over development (left) and on average (right). On average: 3 dpf: 3.7 ± 0.3; 5–6 dpf: 4.1 ± 0.1. Standard unpaired t-test, p=0.21. (B–G) Solid line represents the standard linear regression for 3 dpf HCs. Dashed line represents standard regression for the 5–6 dpf HCs dataset as in Figure 2. Significance of the 3 dpf regression and difference with 5–6 dpf regression slope (S) are indicated. (H) The percentage of the max mito located within each quadrant of 3 dpf HCs represented as a heat map. Two HCs in the 3 dpf dataset lacked ribbons to provide a consistent HC lowest point and were not included in this analysis. (I) Summary of the heat map data shown in (H). Most apical quadrant (0–25%): 24.9 ± 8.9%; 25–50%: 37.2 ± 5.7%; 50–75%: 16.0 ± 4.2%; Most basal quadrant (75–100%): 22.0 ± 7.9%. Kruskal–Wallis test with Dunn’s multiple comparisons, nonsignificant. (J) Percentage of max mito located within the most basal quadrant for individual HCs. 3 dpf: 22.0 ± 7.9%, 5–6 dpf: 52.8 ± 4.4%. Kolmogorov–Smirnov test, p=0.017. Same cells as in (H, I). (B, D–G) 3 dpf data: n = 12 HCs, 2 NMs, 2 fish. 5–6 dpf data: n = 65 HCs, 5 NMs, 3 fish. (C, C’) 3 dpf data: n = 12 HCs, 2 NMs, 2 fish. 5–6 dpf data: n = 35 HCs, 3 NMs, 3 fish. (H–J) 3 dpf data: n = 10 HCs, 2 NMs, 2 fish. 5–6 dpf data: n = 65 HCs, 5 NMs, 3 fish. Where applicable, data are presented as the mean ± SEM.
-
Figure 4—source data 1
Raw values used in Figure 4.
- https://cdn.elifesciences.org/articles/80468/elife-80468-fig4-data1-v4.xlsx
-
Figure 4—source data 2
Datasets used in Figure 4.
- https://cdn.elifesciences.org/articles/80468/elife-80468-fig4-data2-v4.docx
Figure 4—figure supplement 1
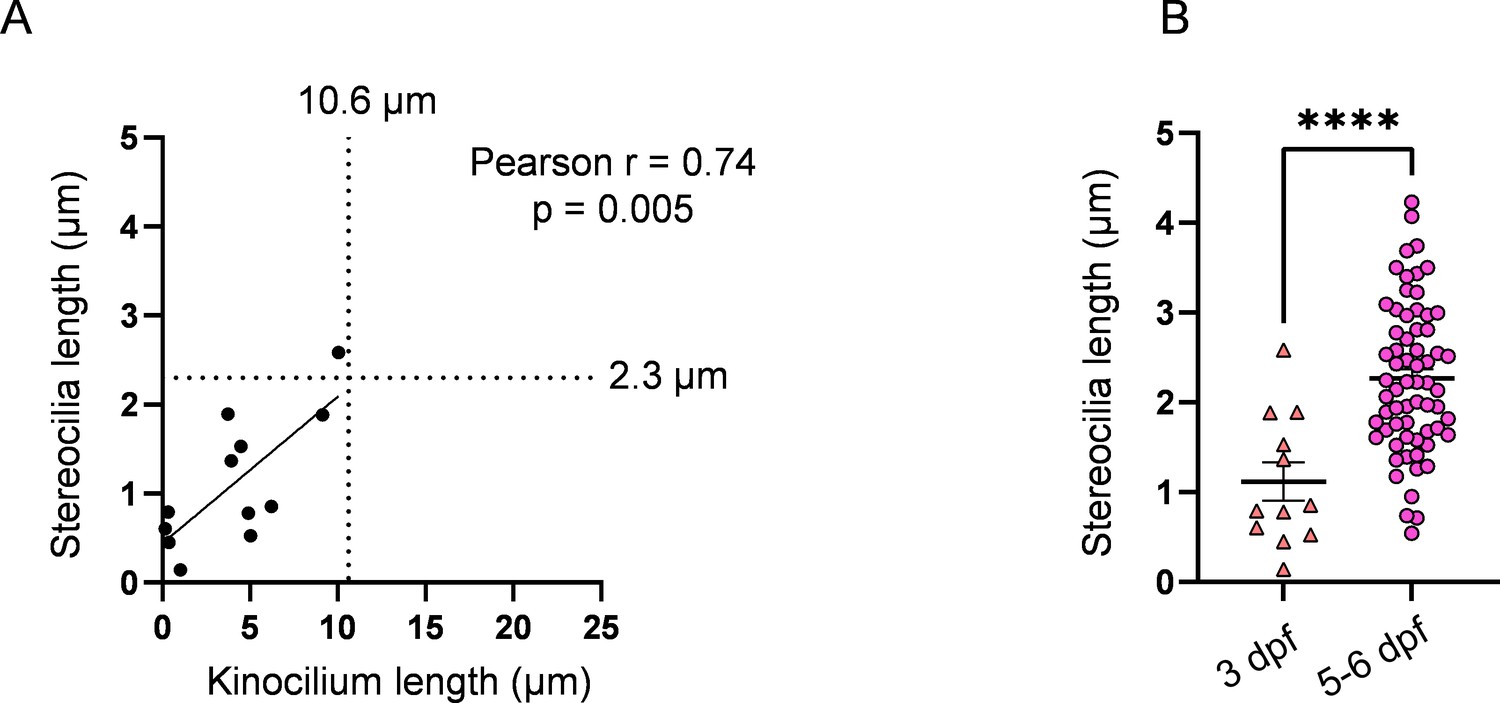
3 days post fertilization (dpf) hair cell (HC) stereocilia fall within the range of immature HCs.
(A) Relationship between kinocilium length and stereocilia length for 3 dpf HCs. The median kinocilium length from the WT dataset (10.6 µm) was used to compare similarity of the kinocilium–stereocilia relationship in 3 dpf HCs. (B) Comparison of stereocilia lengths between 3 dpf and 5–6 dpf HCs. Averages, 3 dpf: 1.1 ± 0.2 µm; 5–6 dpf: 2.3 ± 0.1 µm. Unpaired t-test, ****p<0.0001. 3 dpf: n = 12 HCs, 2 NMs, 2 fish. 5–6 dpf: n = 65, 5 NMs, 3 fish. Data are presented as the mean ± SEM.
-
Figure 4—figure supplement 1—source data 1
Raw values used in Figure 4.
- https://cdn.elifesciences.org/articles/80468/elife-80468-fig4-figsupp1-data1-v4.xlsx
Figure 4—figure supplement 2
3 days post fertilization (dpf) hair cells (HCs) have smaller ribbons than 5–6 dpf HCs.
(A) Total ribbon volume in 3 and 5–6 dpf HCs. In µm3, 3 dpf: 0.4 ± 0.04; 5–6 dpf: 0.6 ± 0.03. Standard unpaired t-test, p=0.002. (B) Average ribbon volume in 3 and 5–6 dpf HCs. In µm3, 3 dpf: 0.06 ± 0.007; 5–6 dpf: 0.1 ± 0.006. Kolmogorov–Smirnov test, p=0.004. (C) Number of ribbons in 3 and 5–6 dpf HCs. 3 dpf: 6 ± 0.4; 5–6 dpf: 5.5 ± 0.2. Standard unpaired t-test, p=0.29. (D) Relationship between total mitochondrial volume and total ribbon volume in 3 dpf HCs. Solid line represents standard linear regression. (E) Relationship between 3 dpf HC stereocilia length and the average minimum distance between each ribbon and the max mito. (F) Relationship between 3 dpf HC stereocilia length and the average minimum distance between each ribbon and the median mito. 3 dpf data: n = 10 HCs, 2 NMs, 2 fish. 5-6 dpf data: n = 65 HCs, 5 NMs, 3 fish. Data are presented as the mean ± SEM.
-
Figure 4—figure supplement 2—source data 1
Raw values used in Figure 4—figure supplement 2.
- https://cdn.elifesciences.org/articles/80468/elife-80468-fig4-figsupp2-data1-v4.xlsx
Figure 5 with 1 supplement
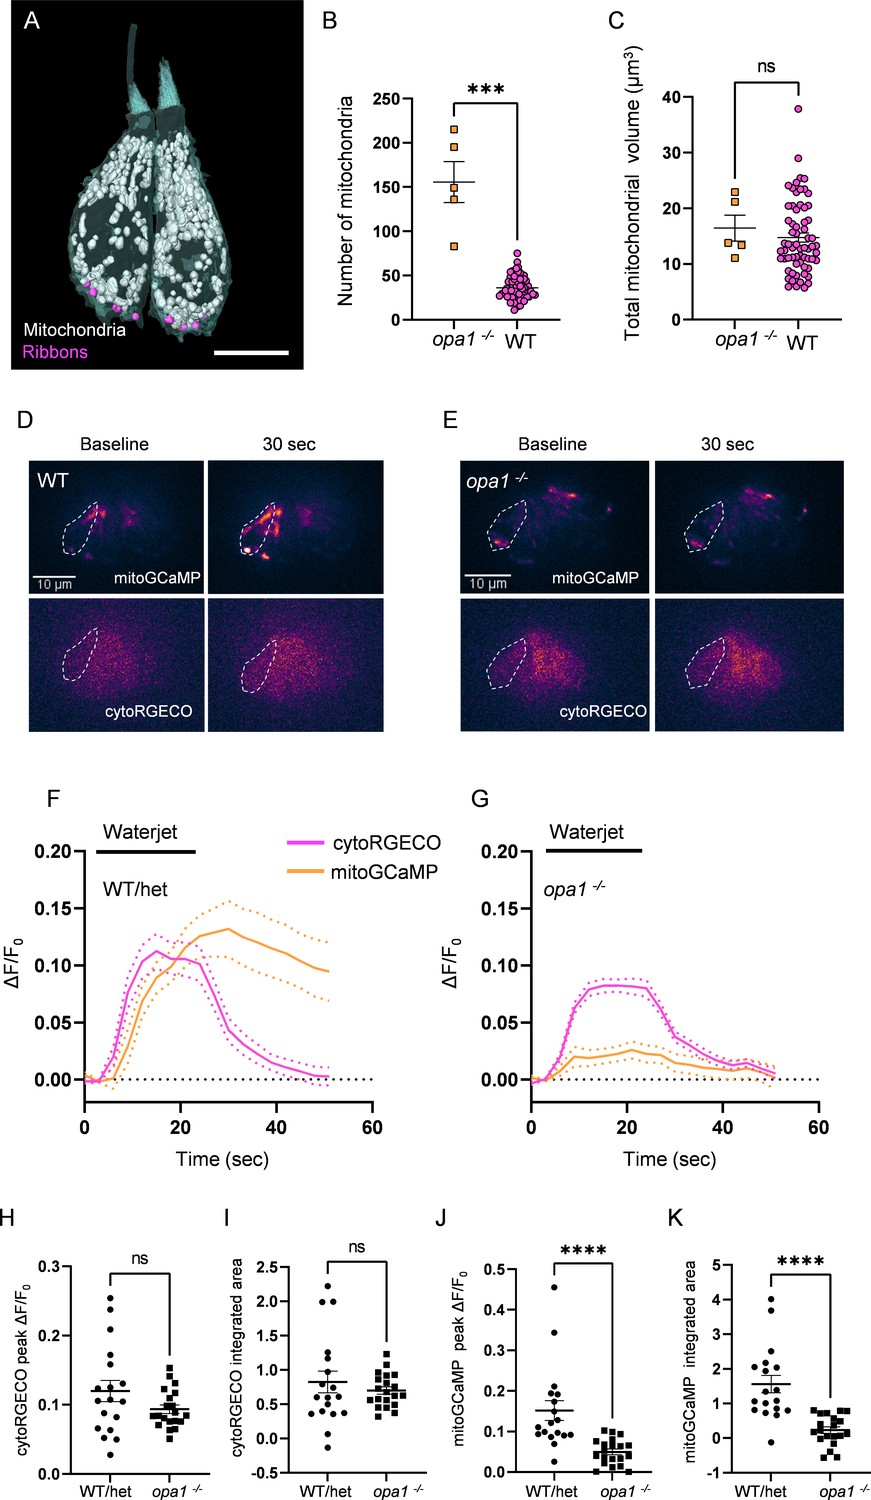
Mutations in opa1 disrupt hair cell (HC) mitochondrial architecture and calcium buffering.
(A) Two representative opa1 HCs (Figure 5—source data 2). Scale bar = 5 µm. (B) Number of individual mitochondria in WT and opa1 HCs. WT: 36.1 ± 1.6; opa1: 155.6 ± 23.22. Kolmogorov–Smirnov test, p=0.0002. (C) Total mitochondrial volume in WT and opa1 HCs. In µm3, WT: 14.8 ± 0.8; opa1: 16.5 ± 2.3. Kolmogorov–Smirnov test, p=0.66. (B, C) opa1 HCs; n = 5 HCs, 1 NM, 1 fish. (D) Representative WT images of myo6:mitoGCaMP (top) and myo6:cytoRGECO (bottom) at baseline and following a waterjet stimulus. (E) Same as in (D), but for opa1 HCs. (F, G) Changes in myo6:mitoGCaMP and myo6:cytoRGECO Ca2+ signal (expressed as ΔF/F0) following a 20 s, 10 Hz waterjet for both WT/het (F) and opa1 HCs (G). (H) Peak myo6:cytoRGECO ΔF/F0 signal. WT/het: 0.1 ± 0.02; opa1: 0.1 ± 0.01, Mann–Whitney test, p=0.28. (I) Integrated myo6:cytoRGECO ΔF/F0 signal. WT/het: 0.8 ± 0.2; opa1: 0.7 ± 0.05, Mann–Whitney test, p=0.94. (J) Peak myo6:mitoGCaMP ΔF/F0 signal. WT/het: 0.15 ± 0.02; opa1: 0.05 ± 0.007, Mann–Whitney test, p<0.0001. (K) Integrated myo6:mitoGCaMP ΔF/F0 signal. WT/het: 1.6 ± 0.3; opa1: 0.2 ± 0.1, Mann–Whitney test, p<0.0001. (D–K) WT/het: n = 18 HCs, 7 fish. opa1: n = 20 HCs, 9 fish. Data are presented as the mean ± SEM.
-
Figure 5—source data 1
Raw values used in Figure 5.
- https://cdn.elifesciences.org/articles/80468/elife-80468-fig5-data1-v4.xlsx
-
Figure 5—source data 2
Datasets used in Figure 5.
- https://cdn.elifesciences.org/articles/80468/elife-80468-fig5-data2-v4.docx
Figure 5—figure supplement 1
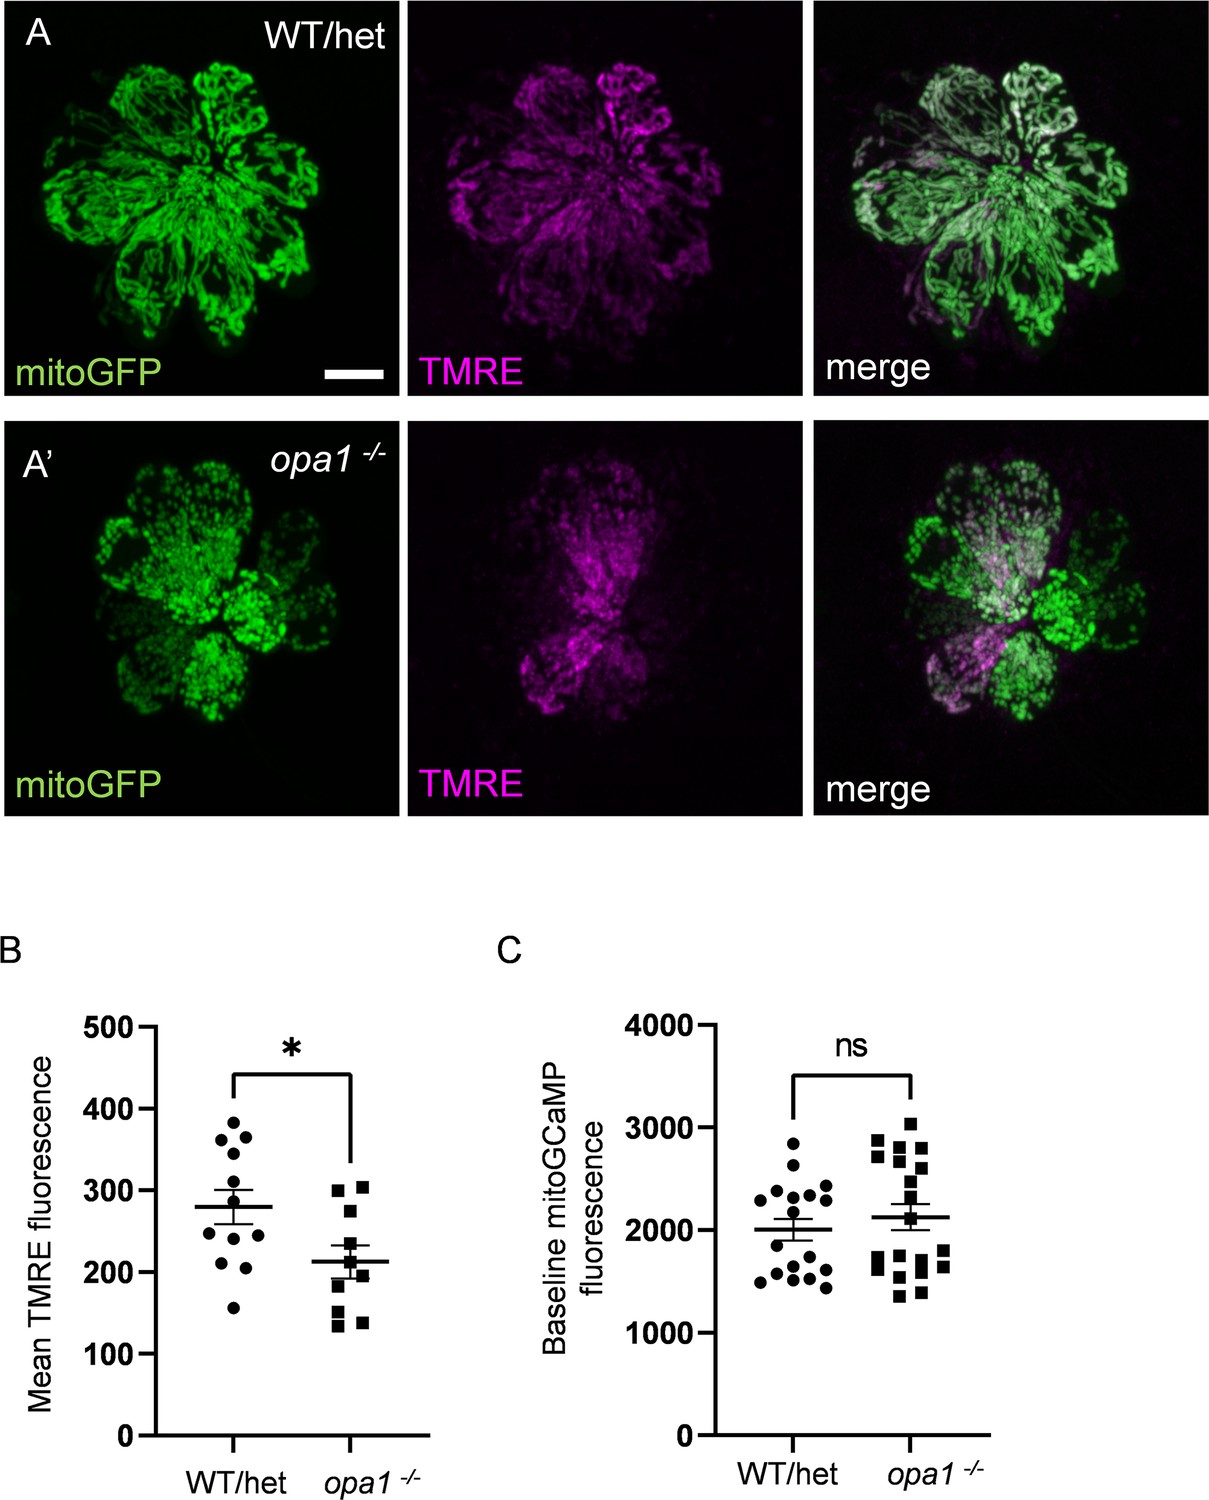
Mutations in opa1 decrease TMRE uptake, but do not affect baseline mitochondrial calcium.
(A) Confocal images of whole WT/het (A) and opa1 (A’) neuromasts (NMs) containing myo6b:mitoGFP and incubated in 1 nM TMRE for 1 hr. The GFP signal was used to render a 3D mask, by which TMRE florescence was measured. Scale bar = 5 µm. (B) Average TMRE fluorescence in whole WT/het and opa1 NMs. (In AU) WT: 279.6 ± 21.2, opa1: 212.6 ± 20.24, mean ± SEM. WT/het: n = 12 NMs (five fish), opa1: n = 10 NMs (three fish). Mann–Whitney test *p=0.02. (C) Average mitoGCaMP fluorescence for WT/het and opa1 prior to waterjet. (In AU) WT/het: 2004 ± 106.1; opa1: 2126 ± 127.3. Mann–Whitney test, p=0.41. WT/het: n = 18 HCs, 7 fish. opa1: n = 20 HCs, 9 fish. Data are presented as the mean ± SEM.
-
Figure 5—figure supplement 1—source data 1
Raw values used in Figure 5—figure supplement 1.
- https://cdn.elifesciences.org/articles/80468/elife-80468-fig5-figsupp1-data1-v4.xlsx
Figure 6 with 1 supplement
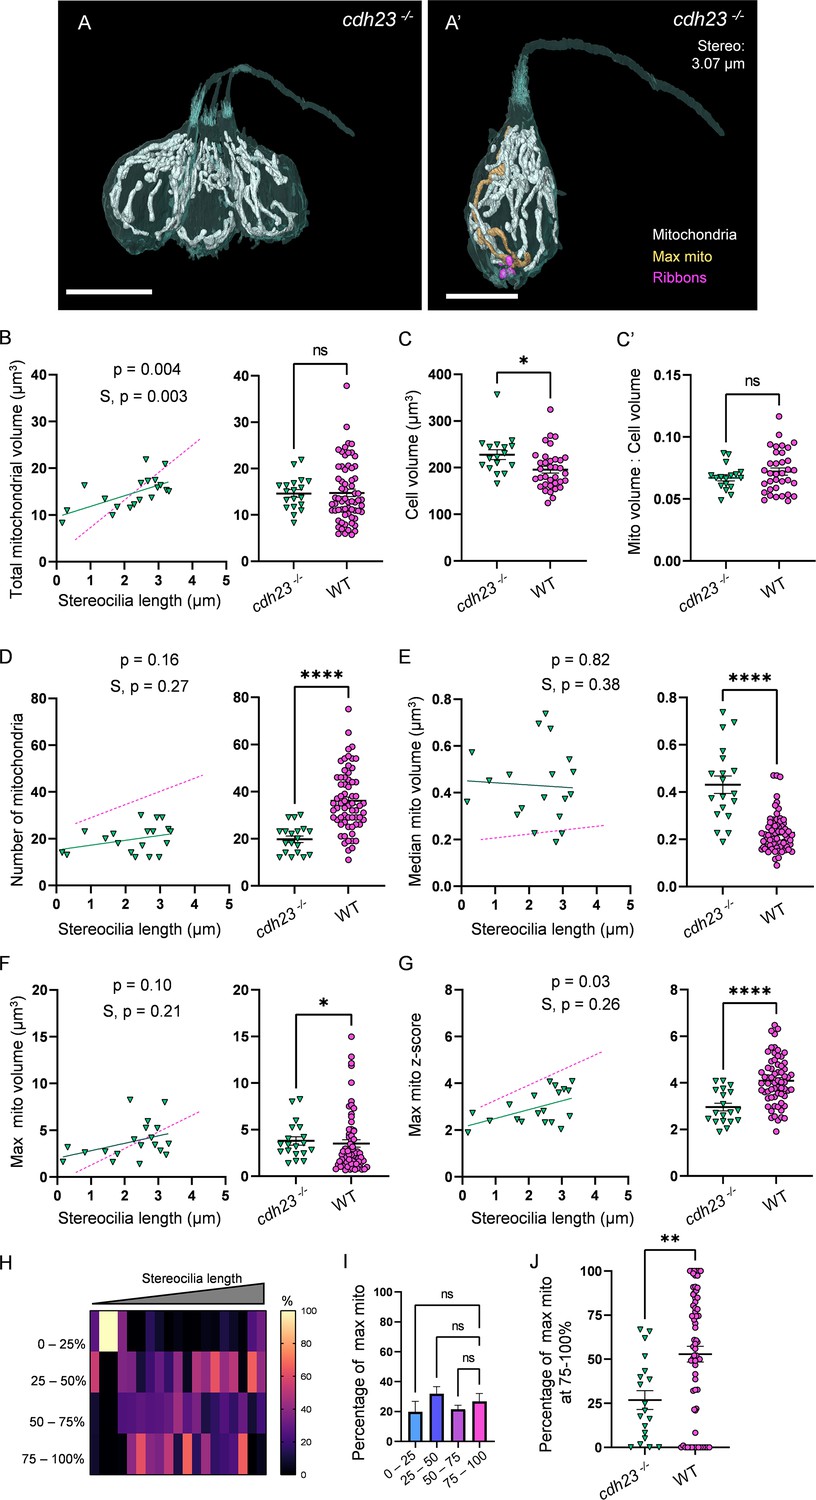
Mechanotransduction is not necessary for high mitochondrial volume, but is required for development of mitochondrial architecture.
(A) Three representative cdh23 hair cells (HCs) with mitochondria labeled in white (from NM11, Figure 6—source data 2). Scale bar = 9.5 µm. (A’) Representative mature cdh23 HC (NM11), max mito shown in gold, synaptic ribbons shown in purple. Scale bar = 6 µm. (B) Comparison of total mitochondrial volume development (left) and average (right) between cdh23 and WT HCs. On average (in µm3): cdh23:14.6 ± 0.8; WT: 14.8 ± 0.8. Kolmogorov–Smirnov test, p=0.35 (C) Total HC volume for cdh23 and WT HCs. (In µm3) cdh23: 228.0 ± 10.3; WT: 195.6 ± 7.2. Kolmogorov–Smirnov test, p=0.03. (C’) Ratio of total mitochondrial volume to HC volume. cdh23: 0.07 ± 0.002; WT: 0.07 ± 0.003. Kolmogorov–Smirnov test, p=0.23. (D) Comparison of the number of HC mitochondria over development (left) and on average (right) in cdh23 and WT HCs. On average: cdh23: 19.8 ± 1.4; WT: 36.1 ± 1.6. Kolmogorov–Smirnov test, p<0.0001. (E) Comparison of the median mitochondrial volume over development (left) and on average (right). On average (in µm3): cdh23: 0.4 ± 0.04; WT: 0.2 ± 0.01. Kolmogorov–Smirnov test, p<0.0001. (F) Comparison of the max mito volume over development (left) and on average (right). On average (in µm3): cdh23: 3.8 ± 0.5; WT: 3.5 ± 0.4. Kolmogorov–Smirnov test, p=0.04. (G) Comparison of the max mito z-score in cdh23 and WT HCs over development (left) and on average (right). On average: cdh23: 3.0 ± 0.2; WT: 4.1 ± 0.1. Standard unpaired t-test, p<0.0001. (B–G) Solid line represents the standard linear regression for cdh23 HCs. Dashed line represents standard regression for WT HCs as in Figure 2. Significance of the cdh23 regression and differences in the slope from the WT regression (S) are indicated. (H) The percentage of the max mito located within each quadrant of cdh23 HCs represented as a heat map. (I) Summary of the heat map data shown in (H). Most apical quadrant (0–25%): 19.8 ± 7.0%; 25–50%: 31.9 ± 4.8%; 50–75%: 21.6 ± 2.6%; Most basal quadrant (75–100%): 26.8 ± 5.3%. Kruskal–Wallis test with Dunn’s multiple comparisons, nonsignificant. (J) Percentage of max mito located within the most basal quadrant for individual HCs. cdh23: 26.8 ± 5.3%, WT: 52.8 ± 4.4%. Kolmogorov–Smirnov test, p=0.008. (B, D–J) cdh23 data: n = 19 HCs, 4 NMs, 2 fish. WT data: n = 65 HCs, 5 NMs, 3 fish. (C, C’) cdh23 data: n = 17 HCs, 4 NMs, 2 fish. WT data: n = 35 HCs, 3 NMs, 3 fish. Where applicable, data are presented as the mean ± SEM.
-
Figure 6—source data 1
Raw values used in Figure 6.
- https://cdn.elifesciences.org/articles/80468/elife-80468-fig6-data1-v4.xlsx
-
Figure 6—source data 2
Datasets used in Figure 6.
- https://cdn.elifesciences.org/articles/80468/elife-80468-fig6-data2-v4.docx
Figure 6—figure supplement 1
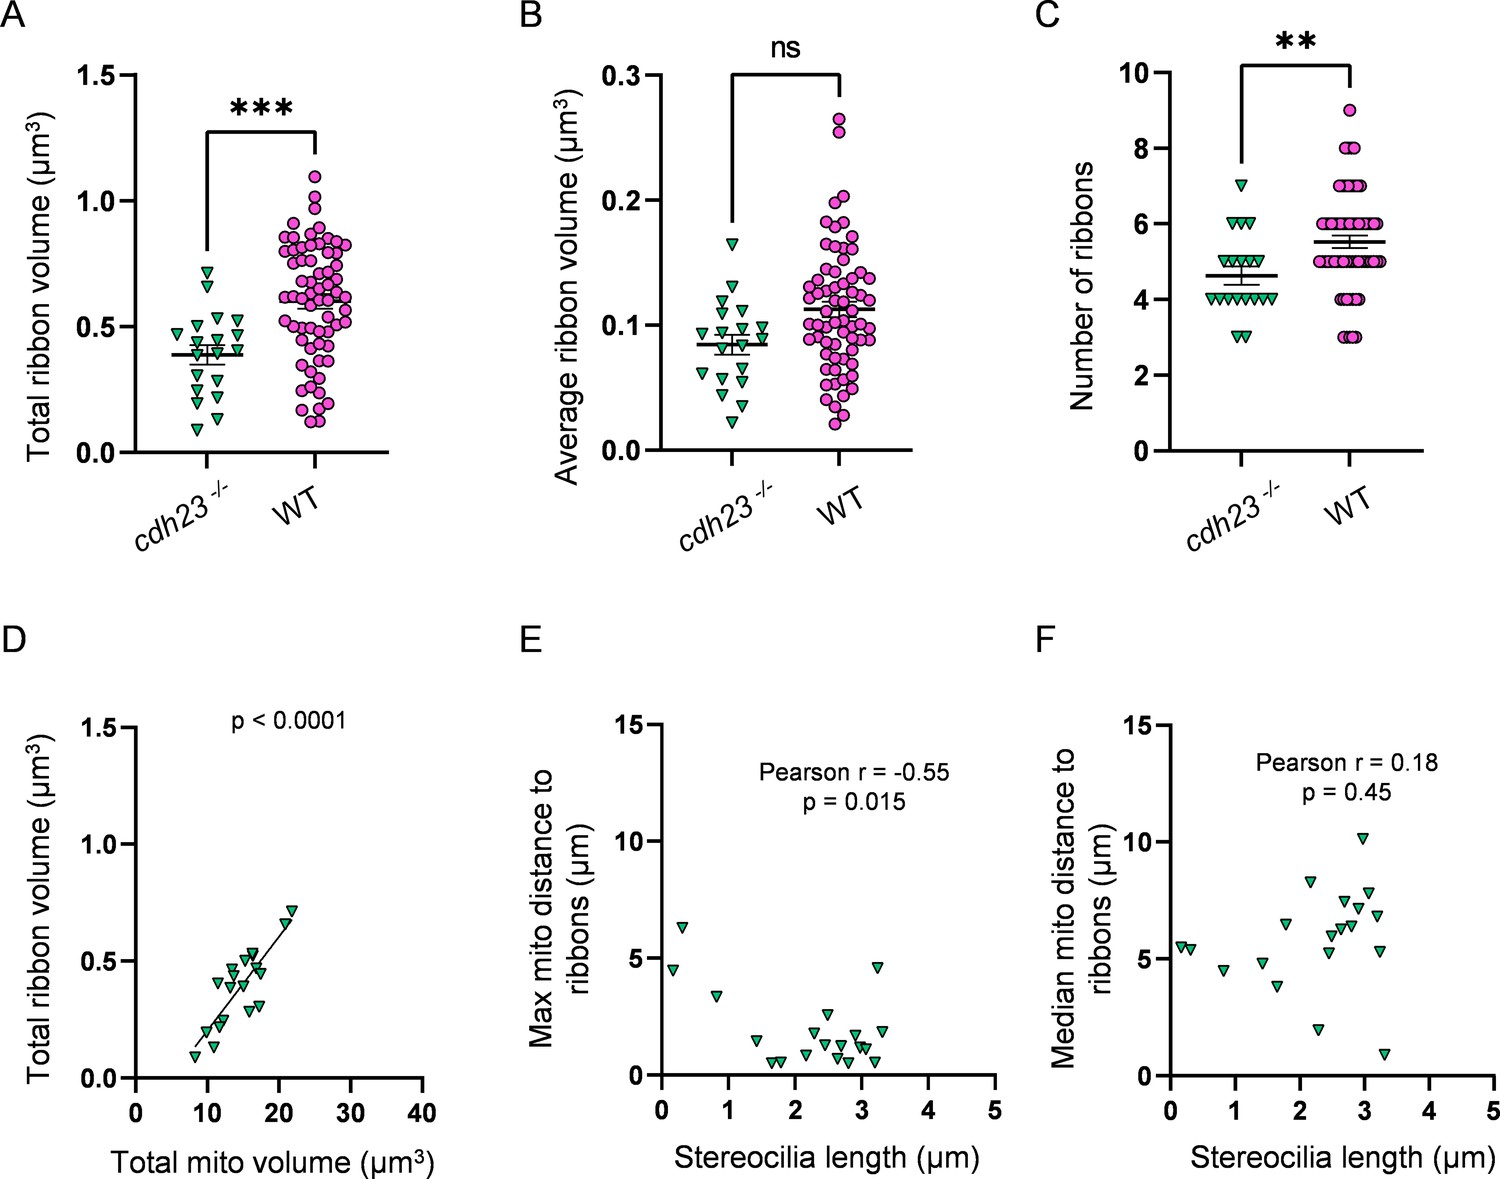
Mechanotransduction-deficient hair cells (HCs) have fewer ribbons than WT.
(A) Total ribbon volume in cdh23 and WT HCs. In µm3, cdh23: 0.4 ± 0.04; WT: 0.6 ± 0.03. Standard unpaired t-test, p=0.0004. (B) Average ribbon volume in cdh23 and WT HCs. In µm3, 3 days post fertilization (dpf): 0.08 ± 0.008; WT: 0.1 ± 0.006. Kolmogorov–Smirnov test, p=0.066. (C) Number of ribbons in cdh23 and WT HCs. cdh23: 4.6 ± 0.2; WT: 5.5 ± 0.2. Standard unpaired t-test, p=0.009. (D) Relationship between total mitochondrial volume and total ribbon volume in cdh23 HCs. Solid line represents standard linear regression. (E) Relationship between cdh23 HC stereocilia length and the average minimum distance between each ribbon and the max mito. (F) Relationship between cdh23 HC stereocilia length and the average minimum distance between each ribbon and the median mito. cdh23 data: n = 19 HCs, 4 NMs, 2 fish. WT dpf data: n = 65 HCs, 5 NMs, 3 fish. Data are presented as the mean ± SEM.
-
Figure 6—figure supplement 1—source data 1
Raw values used in Figure 6—figure supplement 1.
- https://cdn.elifesciences.org/articles/80468/elife-80468-fig6-figsupp1-data1-v4.xlsx
Figure 7 with 1 supplement
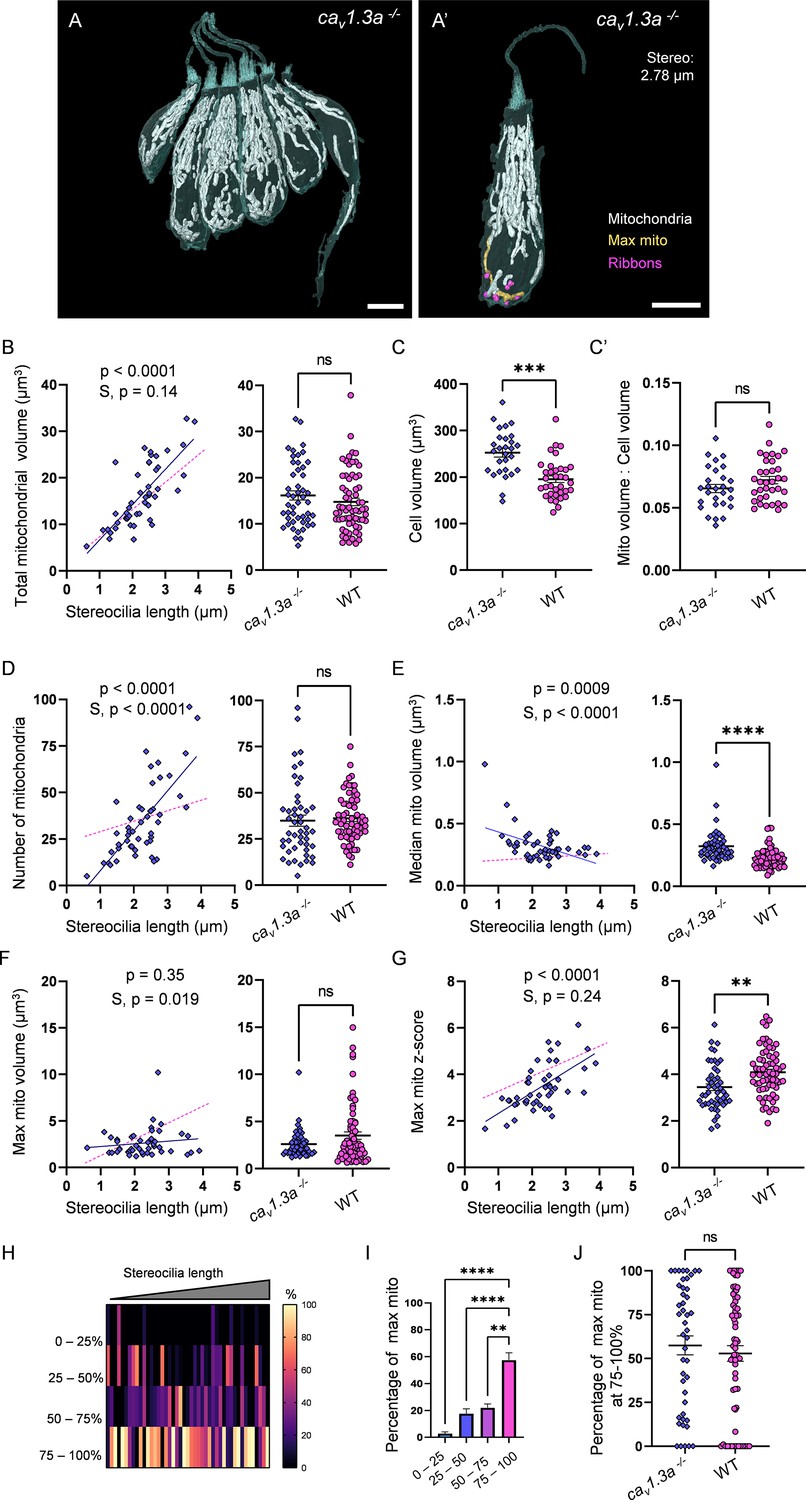
Synaptic transmission is necessary for gradual max mito growth.
(A) Six representative cav1.3a hair cells (HCs) with mitochondria labeled in white (from NM13, Figure 7—source data 2). Scale bar = 5 µm. (A’) Representative mature cav1.3a HC (NM14, Figure 7—source data 2), max mito shown in gold, synaptic ribbons shown in purple. Scale bar = 5 µm. (B) Comparison of total mitochondrial volume development (left) and average (right) between cav1.3a and WT HCs. On average (in µm3): cav1.3a: 16.2 ± 1.0; WT: 14.8 ± 0.8. Kolmogorov–Smirnov test, p=0.76. (C) Total HC volume for cav1.3a and WT HCs. (In µm3) cav1.3a: 252.5 ± 9.3; WT: 195.6 ± 7.2. Kolmogorov–Smirnov test, p=0.0003. (C’) Ratio of total mitochondrial volume to HC volume. cav1.3a: 0.07 ± 0.003; WT: 0.07 ± 0.003. Kolmogorov–Smirnov test, p=0.66. (D) Comparison of the number of HC mitochondria over development (left) and on average (right) in cav1.3a and WT HCs. On average: cav1.3a: 34.9 ± 3.0; WT: 36.1 ± 1.6. Kolmogorov–Smirnov test, p=0.13. (E) Comparison of the median mitochondrial volume over development (left) and on average (right). On average (in µm3): cav1.3a: 0.3 ± 0.02; WT: 0.2 ± 0.01. Kolmogorov–Smirnov test, p<0.0001. (F) Comparison of the max mito volume over development (left) and on average (right). On average (in µm3): cav1.3a: 2.6 ± 0.2; WT: 3.5 ± 0.4. Kolmogorov–Smirnov test, p=0.14. (G) Comparison of the max mito z-score in cav1.3a and WT HCs over development (left) and on average (right). On average: cav1.3a: 3.4 ± 0.1; WT: 4.1 ± 0.1. Standard unpaired t-test, p=0.001. (B–G) Solid line represents the standard linear regression for cav1.3a HCs. Dashed line represents standard regression for WT HCs dataset as in Figure 2. Significance of the cav1.3a regression and differences in the slope from the WT regression (S) are indicated. (H) The percentage of the max mito located within each quadrant of cav1.3a HCs represented as a heat map. Three HCs in the cav1.3a dataset lacked ribbons to provide a consistent HC lowest point and were not included in this analysis. (I) Summary of the heat map data shown in (H). Most apical quadrant (0–25%): 2.8 ± 1.2%; 25–50%: 17.6 ± 3.6%; 50–75%: 22.1 ± 2.8%; Most basal quadrant (75–100%): 57.5 ± 5.4%. Kruskal–Wallis test with Dunn’s multiple comparisons, **p<0.01, ****p<0.0001. (J) Percentage of max mito located within the most basal quadrant for individual HCs. cav1.3a: 57.4 ± 5.4%, WT: 52.8 ± 4.4%. Kolmogorov–Smirnov test, p=0.77. (B, D–G) cav1.3a data: n = 48 HCs, 4 NMs, 2 fish. WT dpf data: n = 65 HCs, 5 NMs, 3 fish. (C, C’) cav1.3a data n = 28 HCs, 3 NMs, 2 fish. WT data: n = 35 HCs, 3 NMs, 3 fish. (H - J) cav1.3a data: n = 45 HCs, 4 NMs, 2 fish. WT data: n = 65 HCs, 5 NMs, 3 fish. Where applicable, data are presented as the mean ± SEM.
-
Figure 7—source data 1
Raw values used in Figure 7.
- https://cdn.elifesciences.org/articles/80468/elife-80468-fig7-data1-v4.xlsx
-
Figure 7—source data 2
Datasets used in Figure 7.
- https://cdn.elifesciences.org/articles/80468/elife-80468-fig7-data2-v4.docx
Figure 7—figure supplement 1
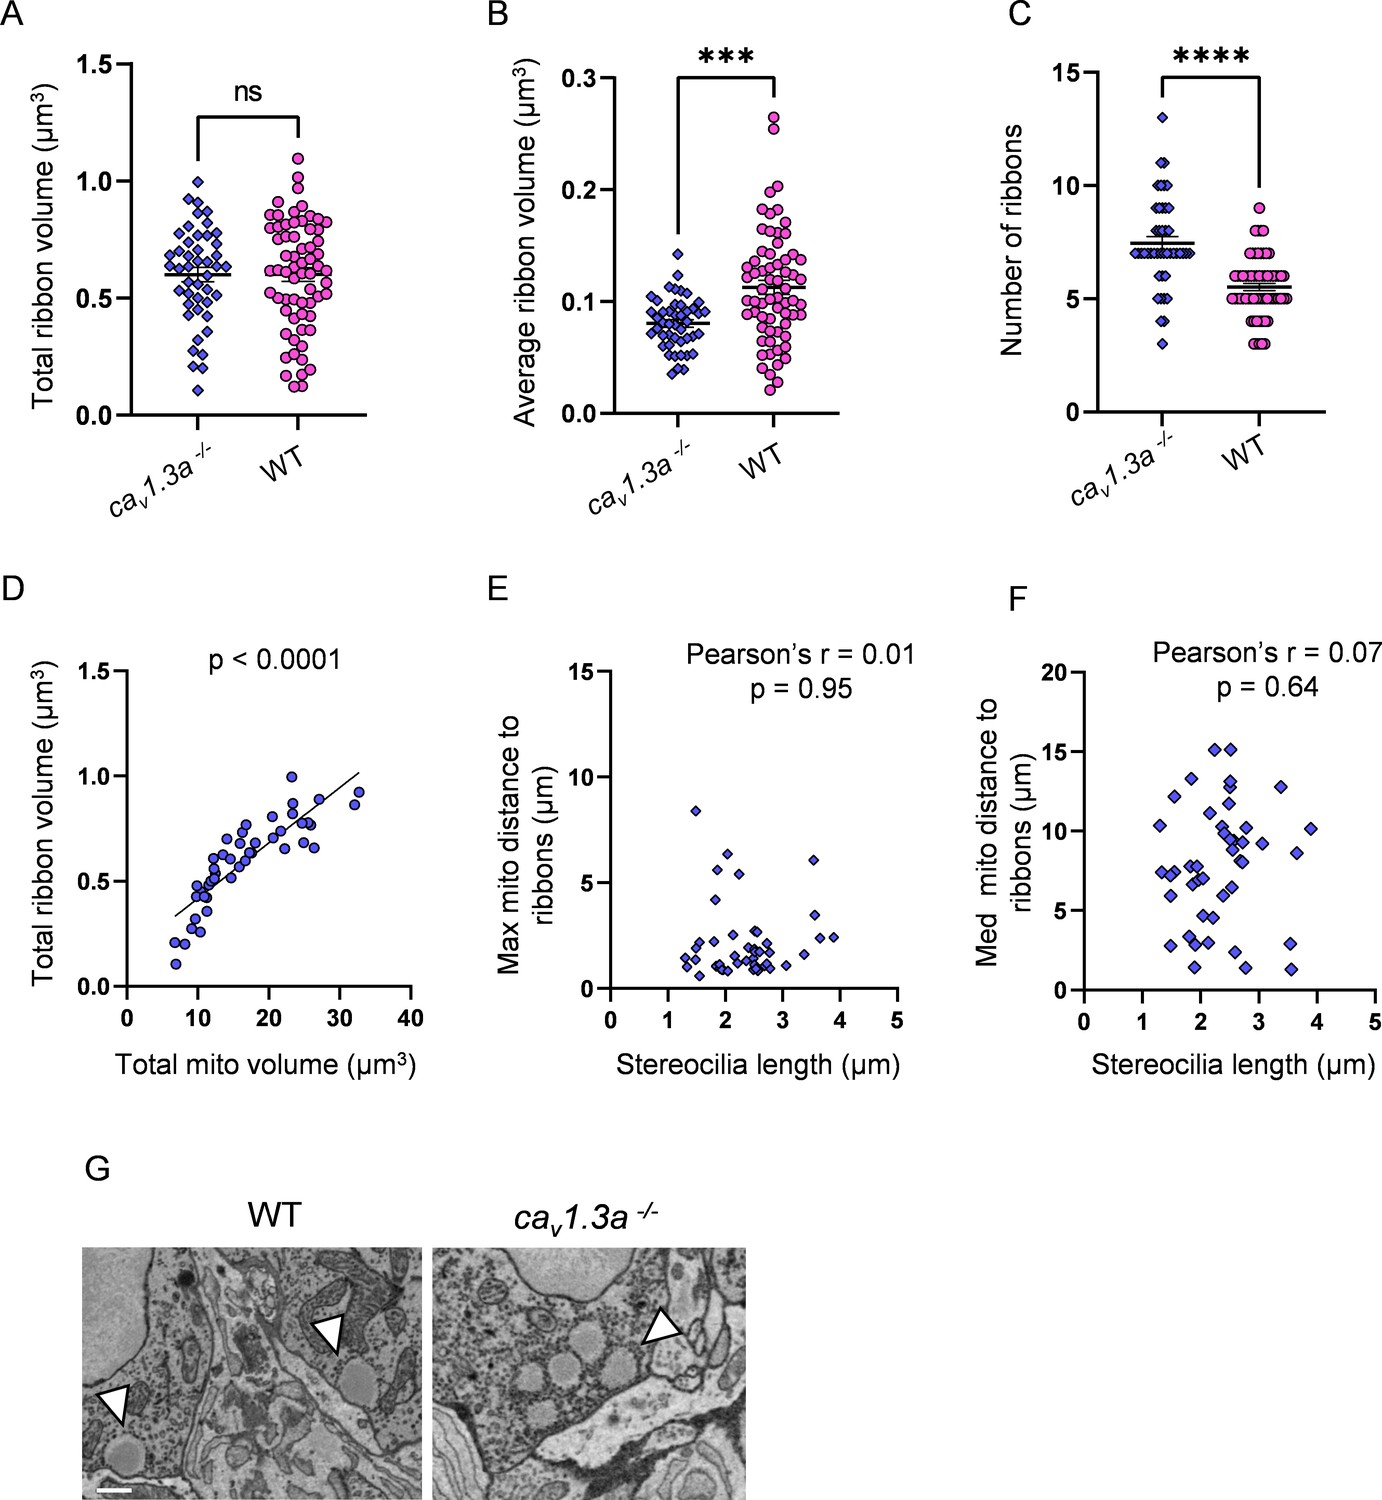
Synaptic transmission-deficient hair cells (HCs) have a larger number of smaller ribbons than WT.
(A) Total ribbon volume in cav1.3a and WT HCs. In µm3, cav1.3a: 0.6 ± 0.03; WT: 0.6 ± 0.03. Standard unpaired t-test, p=0.99. (B) Average ribbon volume in cav1.3a and WT HCs. In µm3, cav1.3a: 0.08 ± 0.003; WT: 0.1 ± 0.006. Kolmogorov–Smirnov test, p=0.0002. (C) Number of ribbons in cav1.3a and WT HCs. cav1.3a: 7.4 ± 0.3; WT: 5.5 ± 0.2. Kolmogorov–Smirnov test, p<0.0001. (D) Relationship between total mitochondrial volume and total ribbon volume in cav1.3a HCs. Solid line represents standard linear regression. (E) Relationship between cav1.3a HC stereocilia length and the average minimum distance between each ribbon and the max mito. (F) Relationship between cav1.3a HC stereocilia length and the average minimum distance between each ribbon and the median mito. (G) Example of ribbons from a WT HC (left) and an example ribbon cluster from a cav1.3a HC (right). Ribbons marked with arrows. Scale bar = 500 nm. (A–F) cav1.3a data: n = 45 HCs, 4 NMs, 2 fish. WT data: n = 65 HCs, 5 NMs, 3 fish.
-
Figure 7—figure supplement 1—source data 1
Raw values used in Figure 7—figure supplement 1.
- https://cdn.elifesciences.org/articles/80468/elife-80468-fig7-figsupp1-data1-v4.xlsx
Figure 8 with 2 supplements
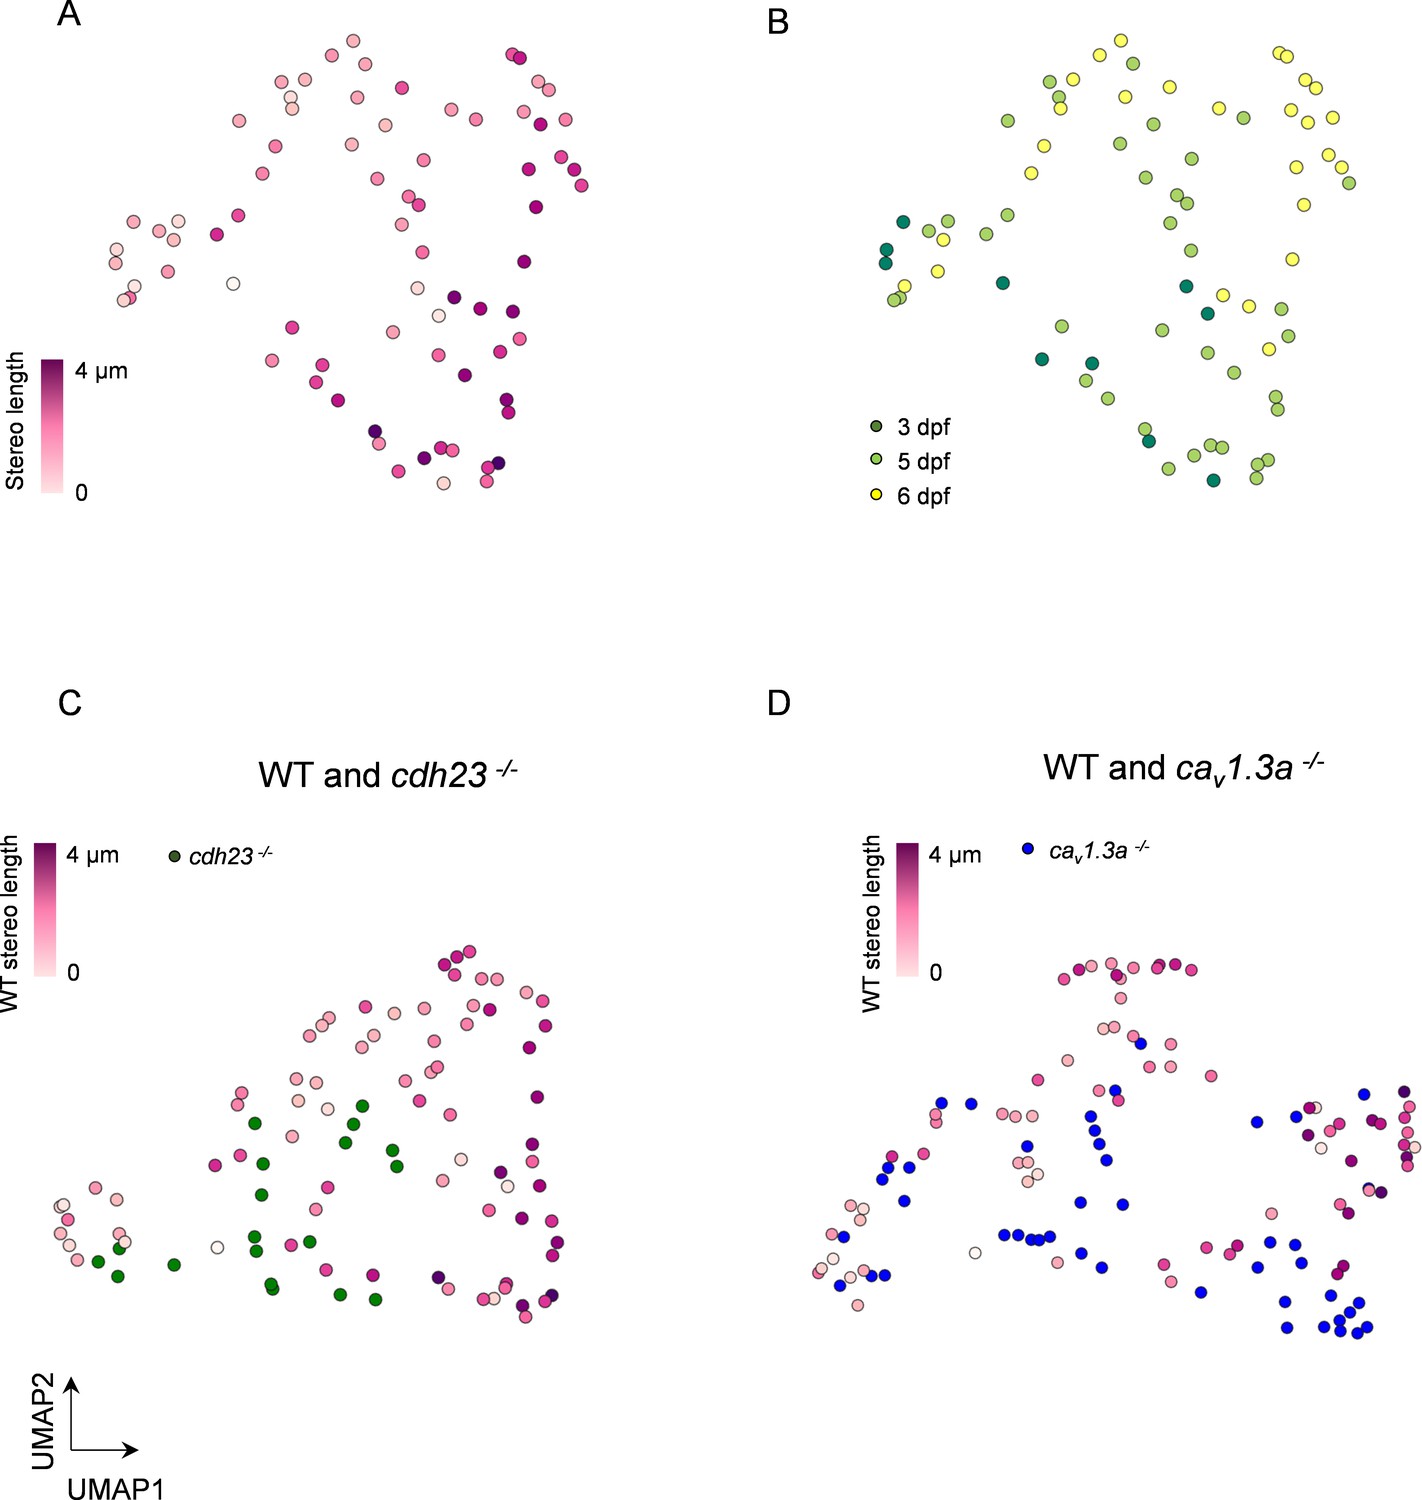
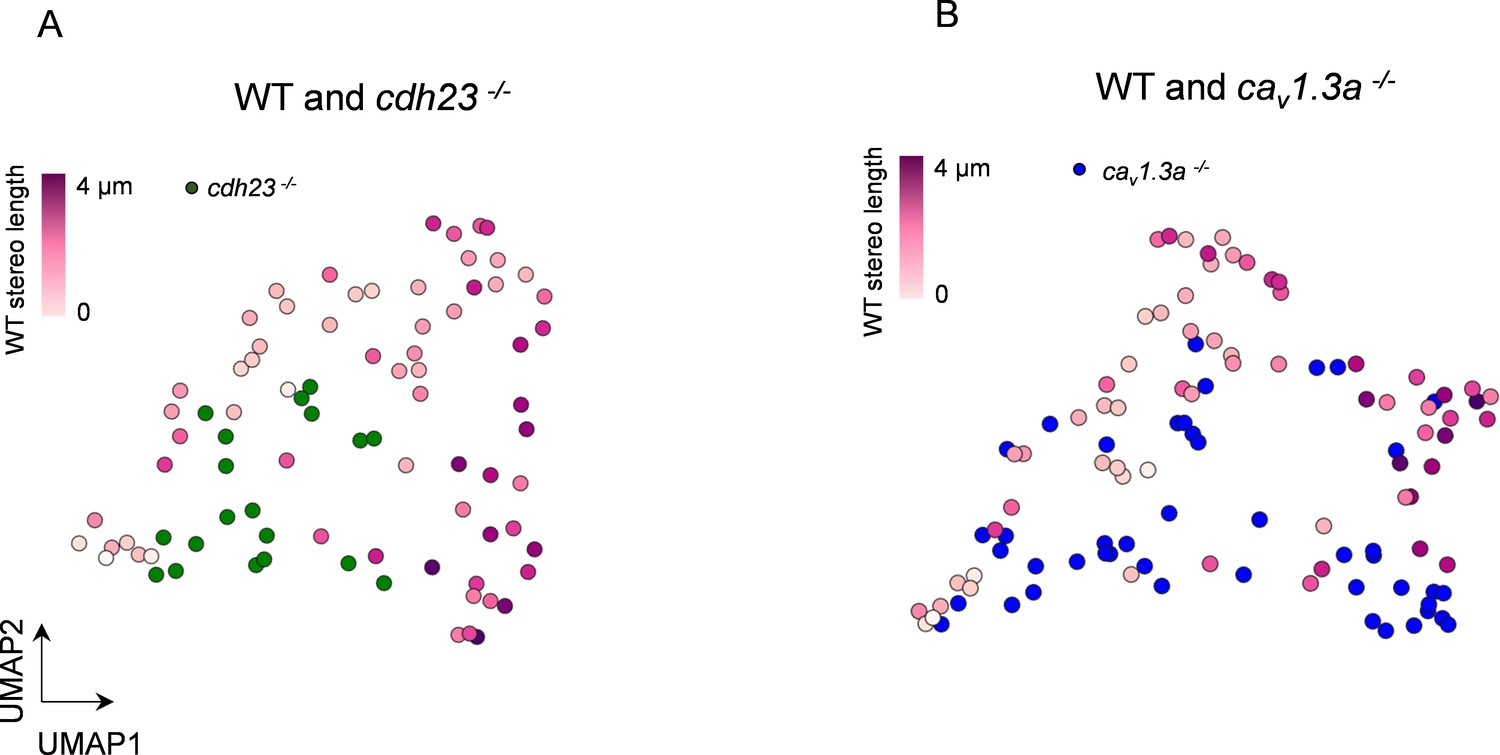
Multidimensional analysis of hair cell (HC) mitochondrial properties confirms differences across genotypes.
(A) UMAP plot of HCs based on principal component analysis of mitochondrial properties. Variables included in this analysis: (1) number of mitochondria, (2) total mitochondrial volume, (3) max mito volume, (4) max mito cable length, (5) median mito volume, (6) average minimum distance between max mito and ribbons, and (7) average minimum distance between median mito and ribbons. HCs are color-coded by stereocilia length. (B) Same UMAP analysis as in (A), color-coded according to age of the animal. Total HCs, n = 75. 3 days post fertilization (dpf) HC: n = 10, 2 NM, 2 fish. 5 dpf HCs: 38 HC, 3 NM, 2 fish. 6 dpf HC: n = 27 HC, 2 NM, 1 fish. (C) UMAP analysis comparing WT to cdh23 HCs. (D) UMAP plot comparing WT to cav1.3a HC. WT HC data, n = 75 HCs, 7 NM, 5 fish (3–6 dpf, same as A and B). cdh23 data, n = 19, 4 NM, 2 fish, 5 dpf. cav1.3a data, n = 45, 4 NM, 2 fish, 5 dpf.
-
Figure 8—source data 1
Raw values used in Figure 8.
- https://cdn.elifesciences.org/articles/80468/elife-80468-fig8-data1-v4.xlsx
Figure 8—figure supplement 1
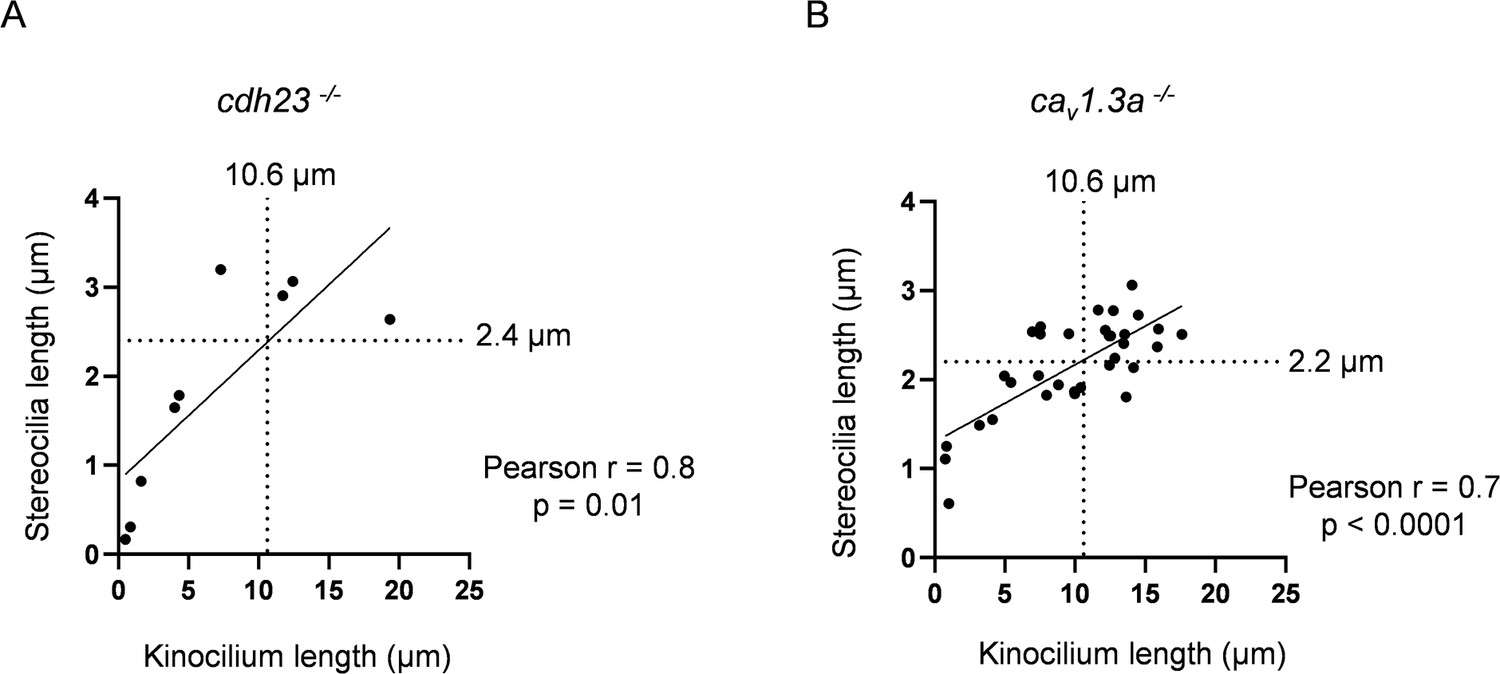
cav1.3a and cdh23 have similar relationships between stereocilia and kinocilia lengths as WT.
(A) Relationship between kinocilia length and stereocilia length for cdh23 hair cells (HCs). The median kinocilium length from the WT dataset (10.6 µm) was used to compare similarity of the kinocilium–stereocilia relationship for cdh23 and cav1.3a HCs. Kinocilia data were achieved for nine cdh23 HCs, two neuromasts (NMs), two fish. (B) Relationship between kinocilia length and stereocilia length for cav1.3a HCs. Kinocilia data were achieved for 33 cav1.3a HCs, 4 NMs, 2 fish.
-
Figure 8—figure supplement 1—source data 1
Raw values used in Figure 8—figure supplement 1.
- https://cdn.elifesciences.org/articles/80468/elife-80468-fig8-figsupp1-data1-v4.xlsx
Figure 8—figure supplement 2
3 days post fertilization (dpf) hair cell (HC) data does not affect UMAP separation.
(A) UMAP analysis comparing WT to cdh23 HC using the mitochondrial properties outlined in Figure 8. (B) UMAP plot comparing WT to cav1.3a HC. WT HC data, n = 65 HCs, 5 NM, 3 fish (5–6 dpf). cdh23 data, n = 19, 4 NM, 2 fish, 5 dpf. cav1.3a data, n = 45, 4 NM, 2 fish, 5 dpf.
-
Figure 8—figure supplement 2—source data 1
Raw data used in Figure 8—figure supplement 2.
- https://cdn.elifesciences.org/articles/80468/elife-80468-fig8-figsupp2-data1-v4.xlsx
Tables
Table 1
Individual cells and mitochondria reconstructed.
| Genotype | Age (dpf) | Fish | Neuromasts | Cells | Mitochondria |
|---|---|---|---|---|---|
| WT HCs | 3 | 2 | 2 | 12 | 299 |
| WT HCs | 5–6 | 3 | 5 | 65 | 2347 |
| cdh23 HCs | 5 | 2 | 4 | 19 | 382 |
| cav1.3 HCs | 5 | 2 | 4 | 48 | 1939 |
| opa1 HCs | 5 | 1 | 1 | 5 | 778 |
| WT SCs | 5 | 2 | 3 | 13 | 163 |
| Total | 162 | 5908 |
-
dpf: days post fertilization; HC: hair cell.
Key resources table
| Reagent type (species) or resource | Designation | Source or reference | Identifiers | Additional information |
|---|---|---|---|---|
| Strain, strain background (Danio rerio) | Opa1 mutant | This paper | ZFIN: ZDB-ALT-240524-3 | opa1w264 mutant |
| Sequence-based reagent | Opa1 guide | This paper | http://crisperscan.org | 5′ GGCGAGACGGGCCACCCAGA 3′ (IDT) |
| Sequence-based reagent | Opa1 guide | This paper | http://crisperscan.org | 5′ GGCAGTGAGGTGGTCTCTGT 3′ (IDT) |
| Sequence-based reagent | Opa1 fwd primer | This paper | PCR primers | 5′ GCTGCCCGGCATTACACATCTC 3′ (IDT) |
| Sequence-based reagent | Opa1 rev primer | This paper | PCR primers | 5′ GCTCAGCGGTTGGAGGTGGATA 3′ (IDT) |
| Strain, strain background (D. rerio) | Cav1.3a mutant | PMID: 15115817 | ZDB-GENE-030616-135 | cav1.3atc323d mutant |
| Strain, strain background (D. rerio) | Cdh23 mutant | PMID: 9491988 | ZDB-GENE-040413-7 | cdh23tj264 mutant |
| Strain, strain background (D. rerio) | mitoGCaMP3 | PMID: 25031409 | ZDB-TGCONSTRCT-141008-1 | Tg(myosin6b:mitoGCaMP3)w119 |
| Strain, strain background (D. rerio) | cytoRGECO | PMID: 25114259 | ZDB-TGCONSTRCT-150114-2 | Tg(myosin6b:R-GECO1)vo10Tg |
| Strain, strain background (D. rerio) | mitoGFP | This paper | ZFIN: ZDB-ALT-240529-8 | Tg(myosin6b:mitoGFP)w213aTg; Gateway cloning and Tol2-mediated transgenesis |
| Chemical compound, drug | TMRE | Invitrogen | Invitrogen: T669 | |
| Software, algorithm | GraphPad Prism | GraphPad Software | https://www.graphpad.com | |
| Software, algorithm | Slidebook | Intelligent Imaging Innovations (3i) | https://www.intelligent-imaging.com | |
| Software, algorithm | Fiji | PMID: 22743772 | https://fiji.sc | |
| Software, algorithm | TrakEM2 | PMID: 22723842 | https://imagej.net/plugins/trakem2/ | |
| Software, algorithm | AMIRA 6.5 for EM systems | Thermo Fisher Scientific | http://Thermofisher.com |
Additional files
Download links
A two-part list of links to download the article, or parts of the article, in various formats.
Downloads (link to download the article as PDF)
Open citations (links to open the citations from this article in various online reference manager services)
Cite this article (links to download the citations from this article in formats compatible with various reference manager tools)
Activity regulates a cell type-specific mitochondrial phenotype in zebrafish lateral line hair cells
eLife 12:e80468.
https://doi.org/10.7554/eLife.80468


