The molecular basis of socially induced egg-size plasticity in honey bees
- Institute of Apicultural Research/Key Laboratory of Pollinating Insect Biology, Ministry of Agriculture and Rural Affairs, Chinese Academy of Agricultural Sciences, China
- Department of Biology, University of North Carolina Greensboro, United States
- Delta Research and Extension Center, Mississippi State University, United States
- Biological and Biotechnology Sciences Branch, U.S. Army Research Office, DEVCOM-ARL, United States
- Department of Applied Ecology, North Carolina State University, Canada
- Department of Biological Sciences, University of Alberta, Canada
Figures
Figure 1
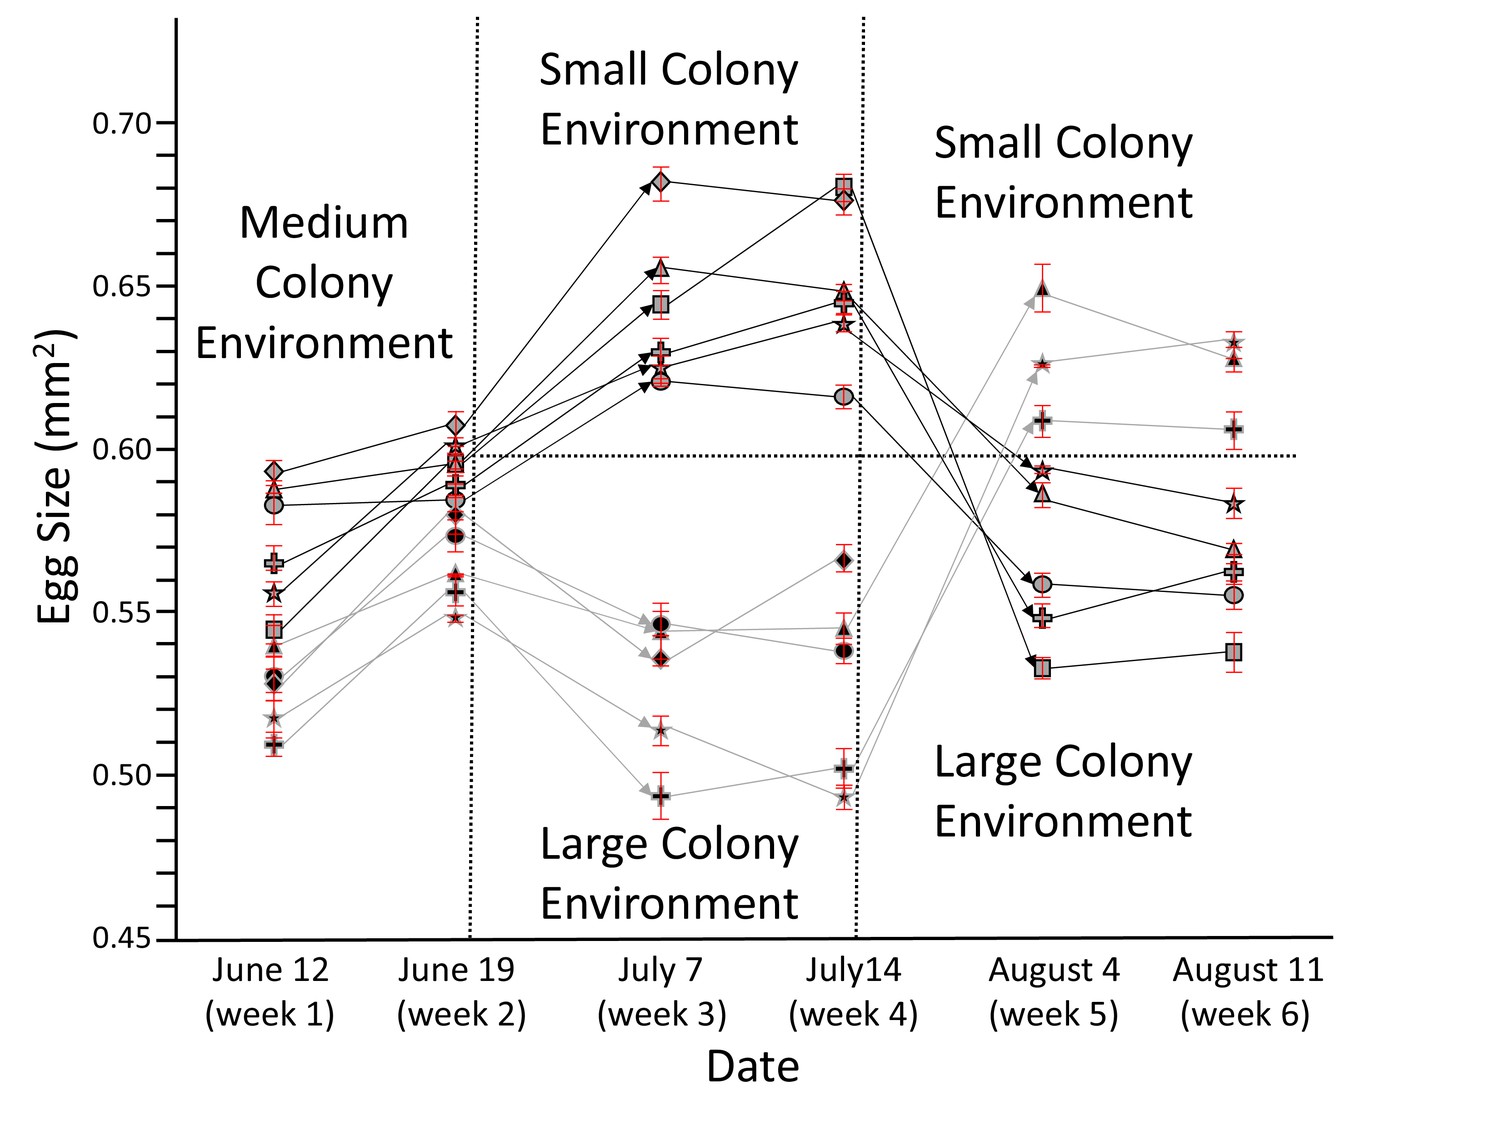
Honey bee queens reversibly adjust egg size according to colony size.
The egg size (n = 20 for each data point) of individual queens (each depicted by a unique symbol ± SEM) was measured for 6 weeks while they were moved from medium to small to large (light symbols with dark lines) or from medium to large to small colonies (dark symbols with light lines). Arrows symbolize transfer between different colonies, during which some of the queens died (lines not continuing). Despite the presence of individual and environmental differences, these experiments show a strong and consistent negative relation between egg size and colony size. Ovaries from surviving queens were collected after week 6 for proteomic profiling (see below).
-
Figure 1—source data 1
Egg-size measurements.
- https://cdn.elifesciences.org/articles/80499/elife-80499-fig1-data1-v2.xlsx
Figure 2
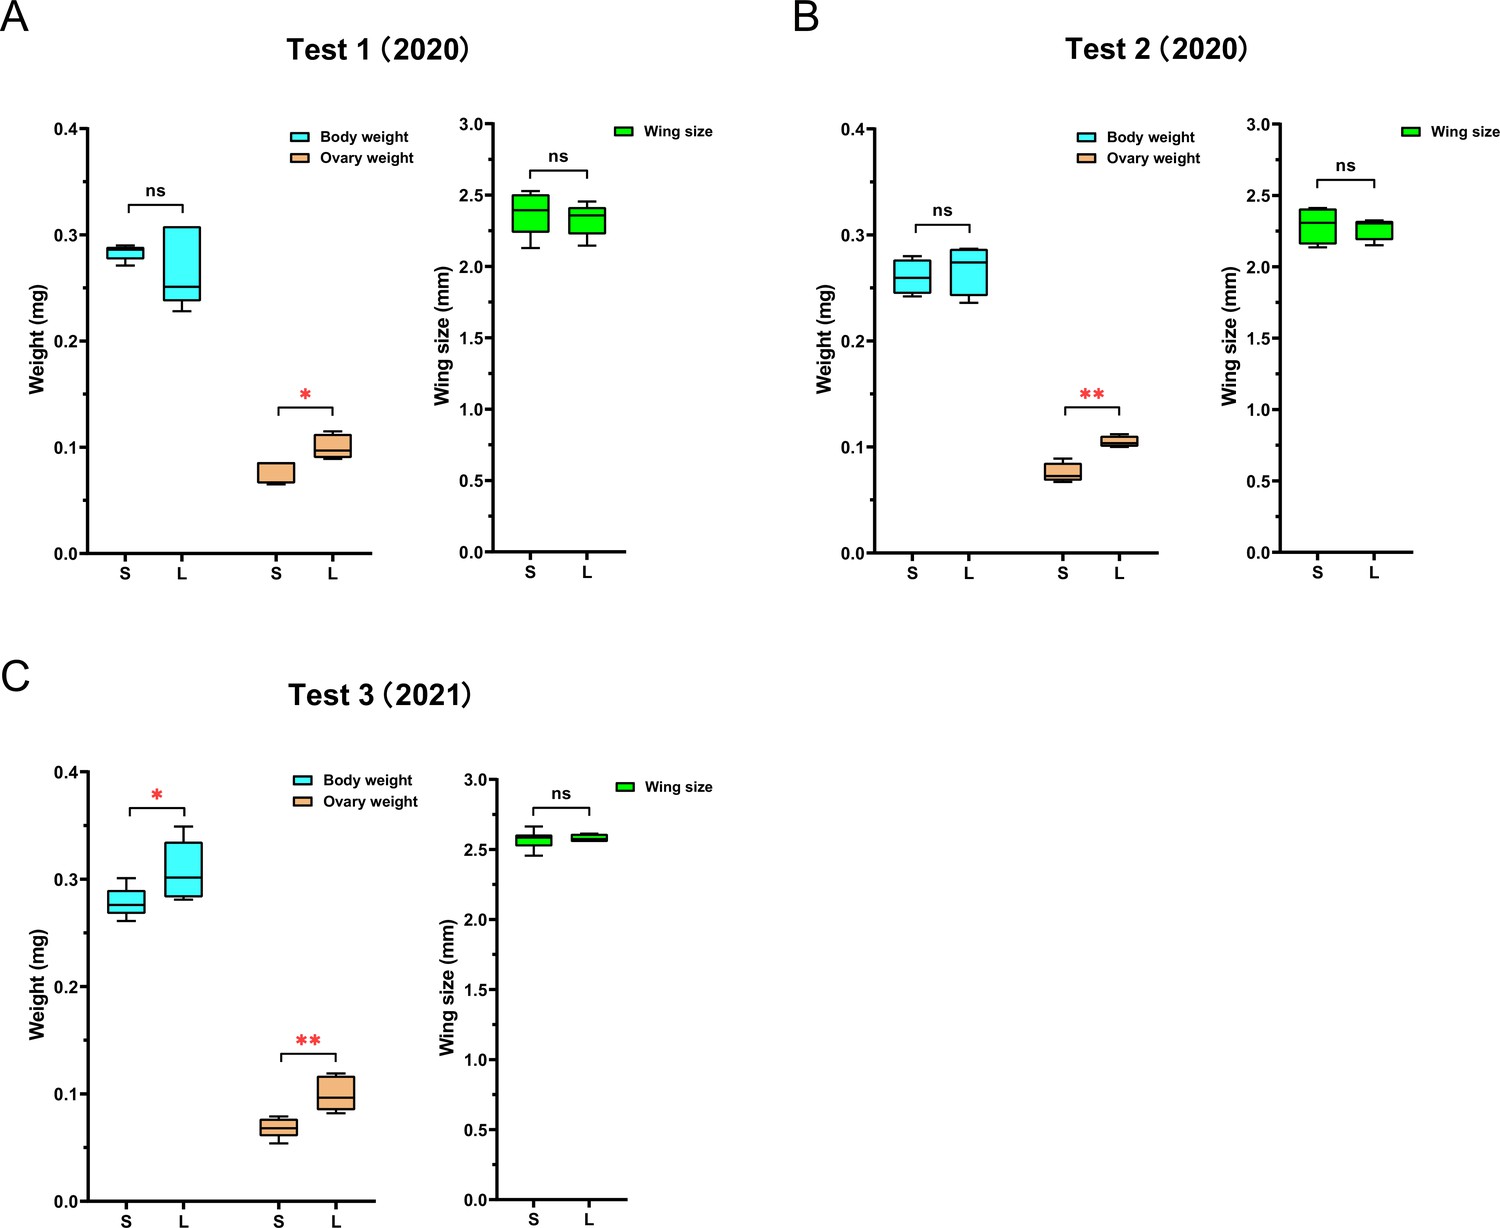
The queens’ ovary weighs less in ‘small’ colonies than in ‘large’ colonies.
While queen size, measured as wing size, was not significantly different between queens in ‘large’ (L) and ‘small’ (S) colonies, ovaries were consistently lighter in queens from small colonies than in queens from large colonies. Total body weight of queens showed no significant difference between the two groups in the first (A) and second (B) experiments, but queens in large colonies were significantly heavier than queens in small colonies in the third experiment (C). NTest1 = 10, NTest2 = 8, NTest3 = 12 for all measures; simple ANOVAs were used for pairwise comparisons (*p<0.05, **p<0.01).
-
Figure 2—source data 1
Queen measurements for test 1.
- https://cdn.elifesciences.org/articles/80499/elife-80499-fig2-data1-v2.xlsx
-
Figure 2—source data 2
Queen measurements for test 2.
- https://cdn.elifesciences.org/articles/80499/elife-80499-fig2-data2-v2.xlsx
-
Figure 2—source data 3
Queen measurements for test 3.
- https://cdn.elifesciences.org/articles/80499/elife-80499-fig2-data3-v2.xlsx
Figure 3

Egg size of queens is not affected by egg-laying rate.
After egg size of individual queens in large colonies was measured, treatment queens (triangular symbols) were confined on capped brood comb that did not allow any oviposition while the control queens (circle symbols) had free access to empty comb for oviposition. After 14 days, the egg size in neither group of queens changed significantly. Individual means ± SEM of 20 eggs are shown for each summary data point.
-
Figure 3—source data 1
Egg-size measurements.
- https://cdn.elifesciences.org/articles/80499/elife-80499-fig3-data1-v2.xlsx
Figure 4
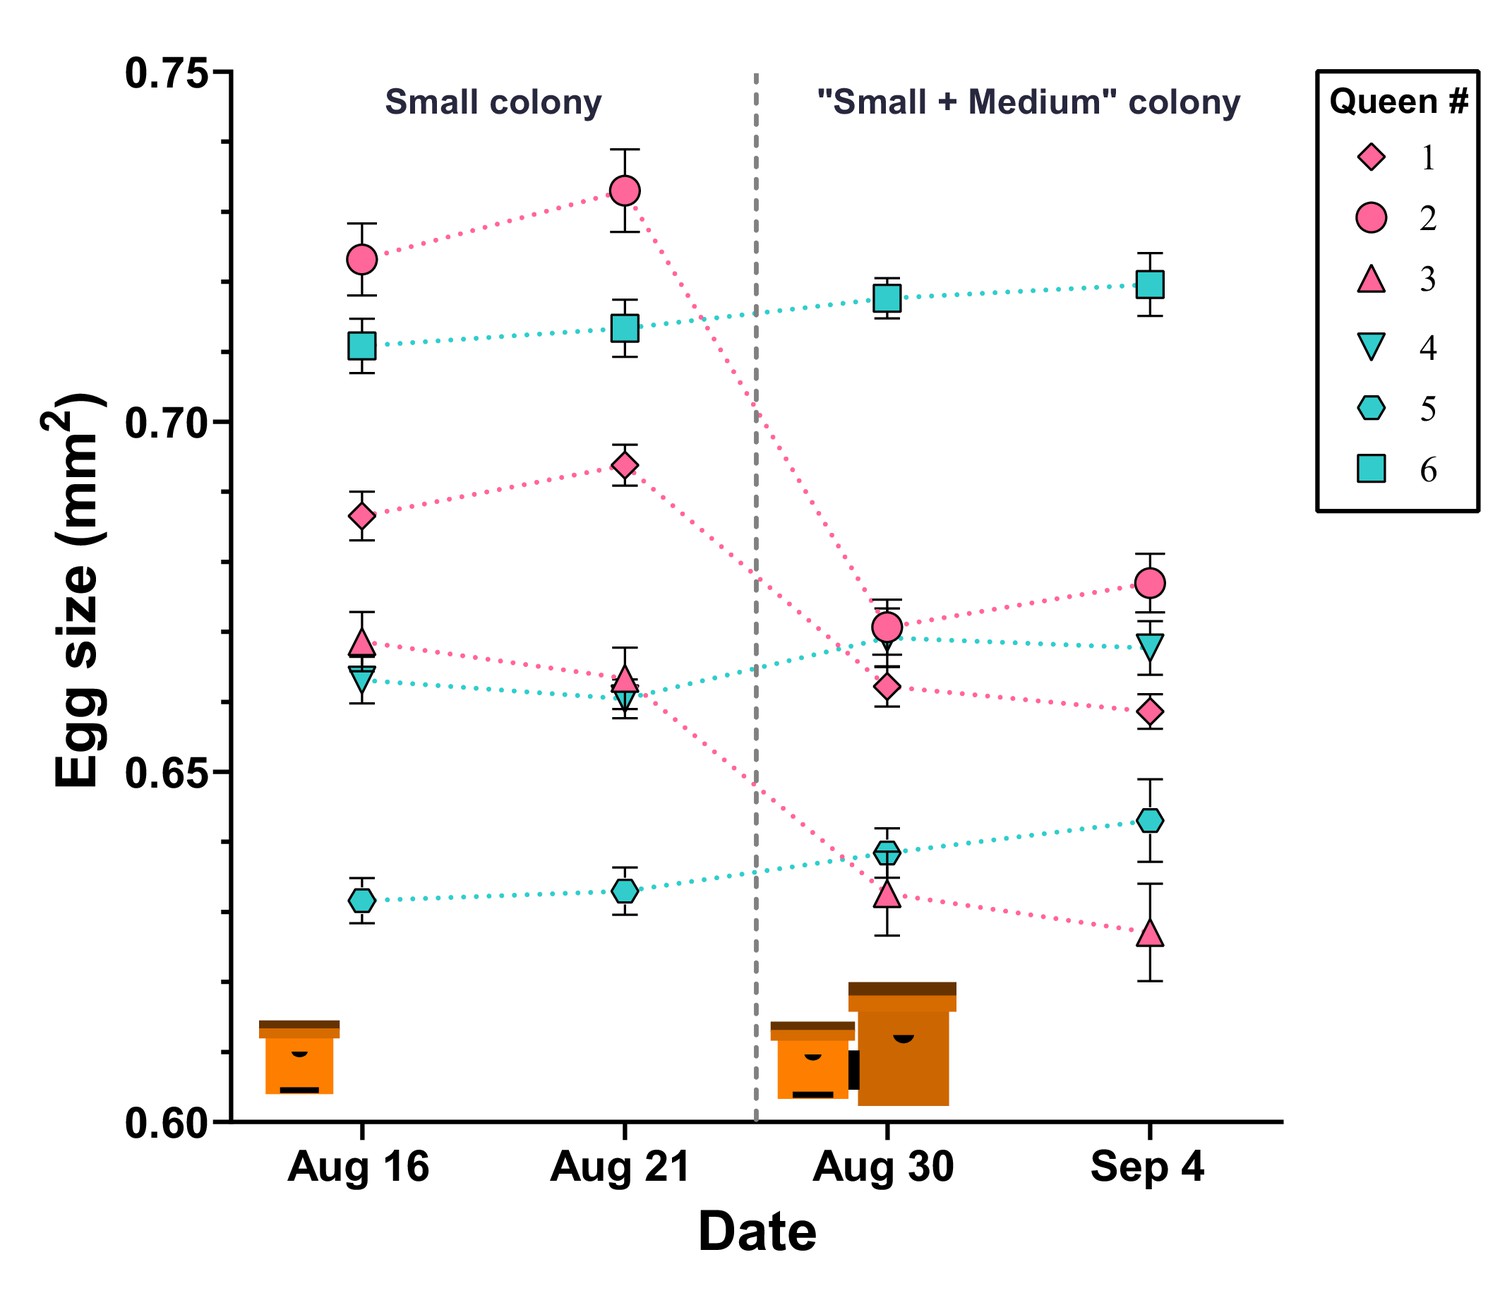
Egg size is actively regulated by the queen in response to perceived colony size.
After initial egg-size determination, queens in ‘small’ hives were either paired with an empty ‘mMedium’ hive box (controls: cyan color, #4, #5, and #6) or with a ‘medium’ hive box containing a colony (pink color, #1, #2, and #3). Queens in hives that were paired with another colony decreased their egg size, while queens in control colonies maintained their egg sizes. Individual means ± SEM are shown.
-
Figure 4—source data 1
Egg-size measurements.
- https://cdn.elifesciences.org/articles/80499/elife-80499-fig4-data1-v2.xlsx
Figure 5

Quantitative protein differences between the ovaries of queens producing small and large eggs.
The abundance of approximately 10% of all identified proteins was significantly different, with the vast majority of significant differences indicating higher protein levels in the ovaries of queens that produced larger eggs because they were housed in small instead of large colonies (A). Among the Gene Ontology (GO) terms that were significantly (p<0.01) enriched in the differentially abundant proteins, ‘protein localization’ and ‘cytoskeleton organization’ were most prominent (B). Functional grouping of these overall GO terms, using kappa ≥ 0.4 as linking criterion confirmed that the GO terms represented at least six distinct functional groups (C).
Figure 6
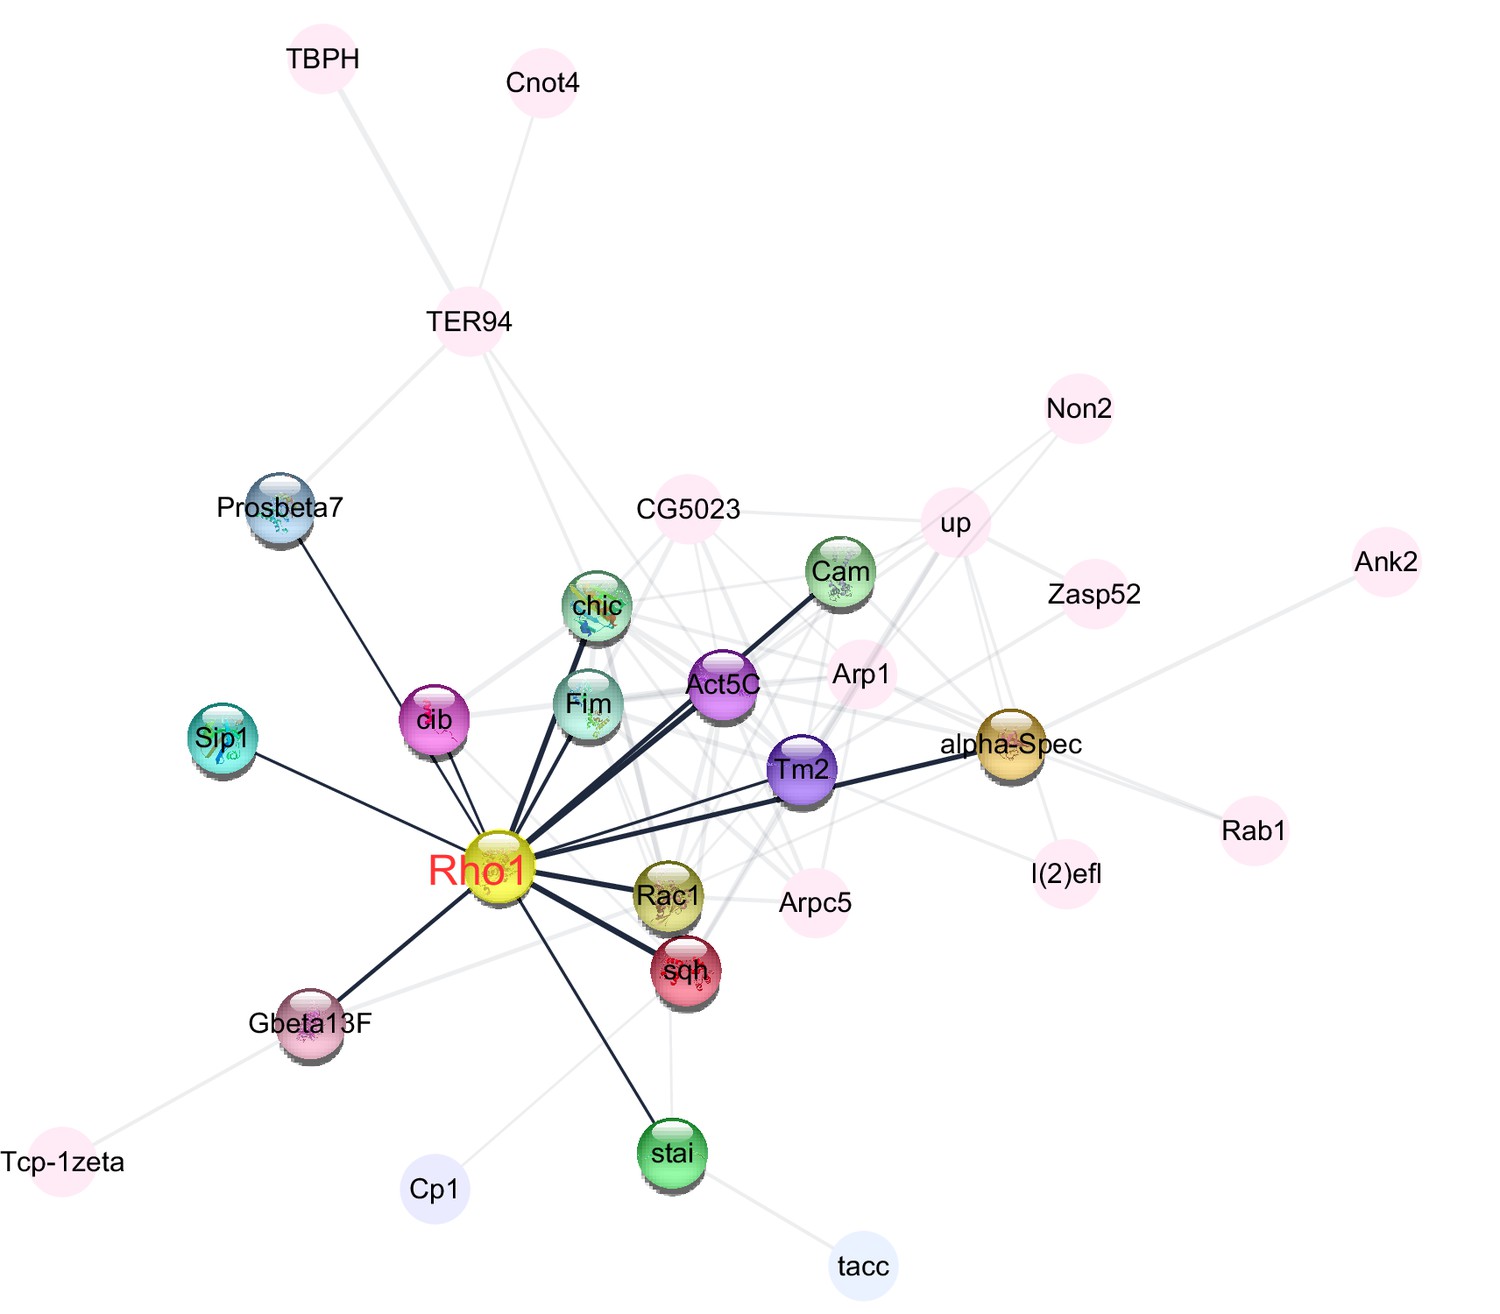
Central role of Rho1 in protein−protein interaction network of cytoskeleton organization, a Gene Ontology (GO) term that was enriched among proteins that were more abundant in the ovaries of large-egg-producing honey bee queens than in small-egg-producing queens.
The interaction analysis, carried out in STRING v10, linked 29 proteins into the network. The highlighted nodes depict proteins that have a direct interaction with Rho1, a central regulator of cytoskeletal organization and the second most connected protein in the network.
Figure 7
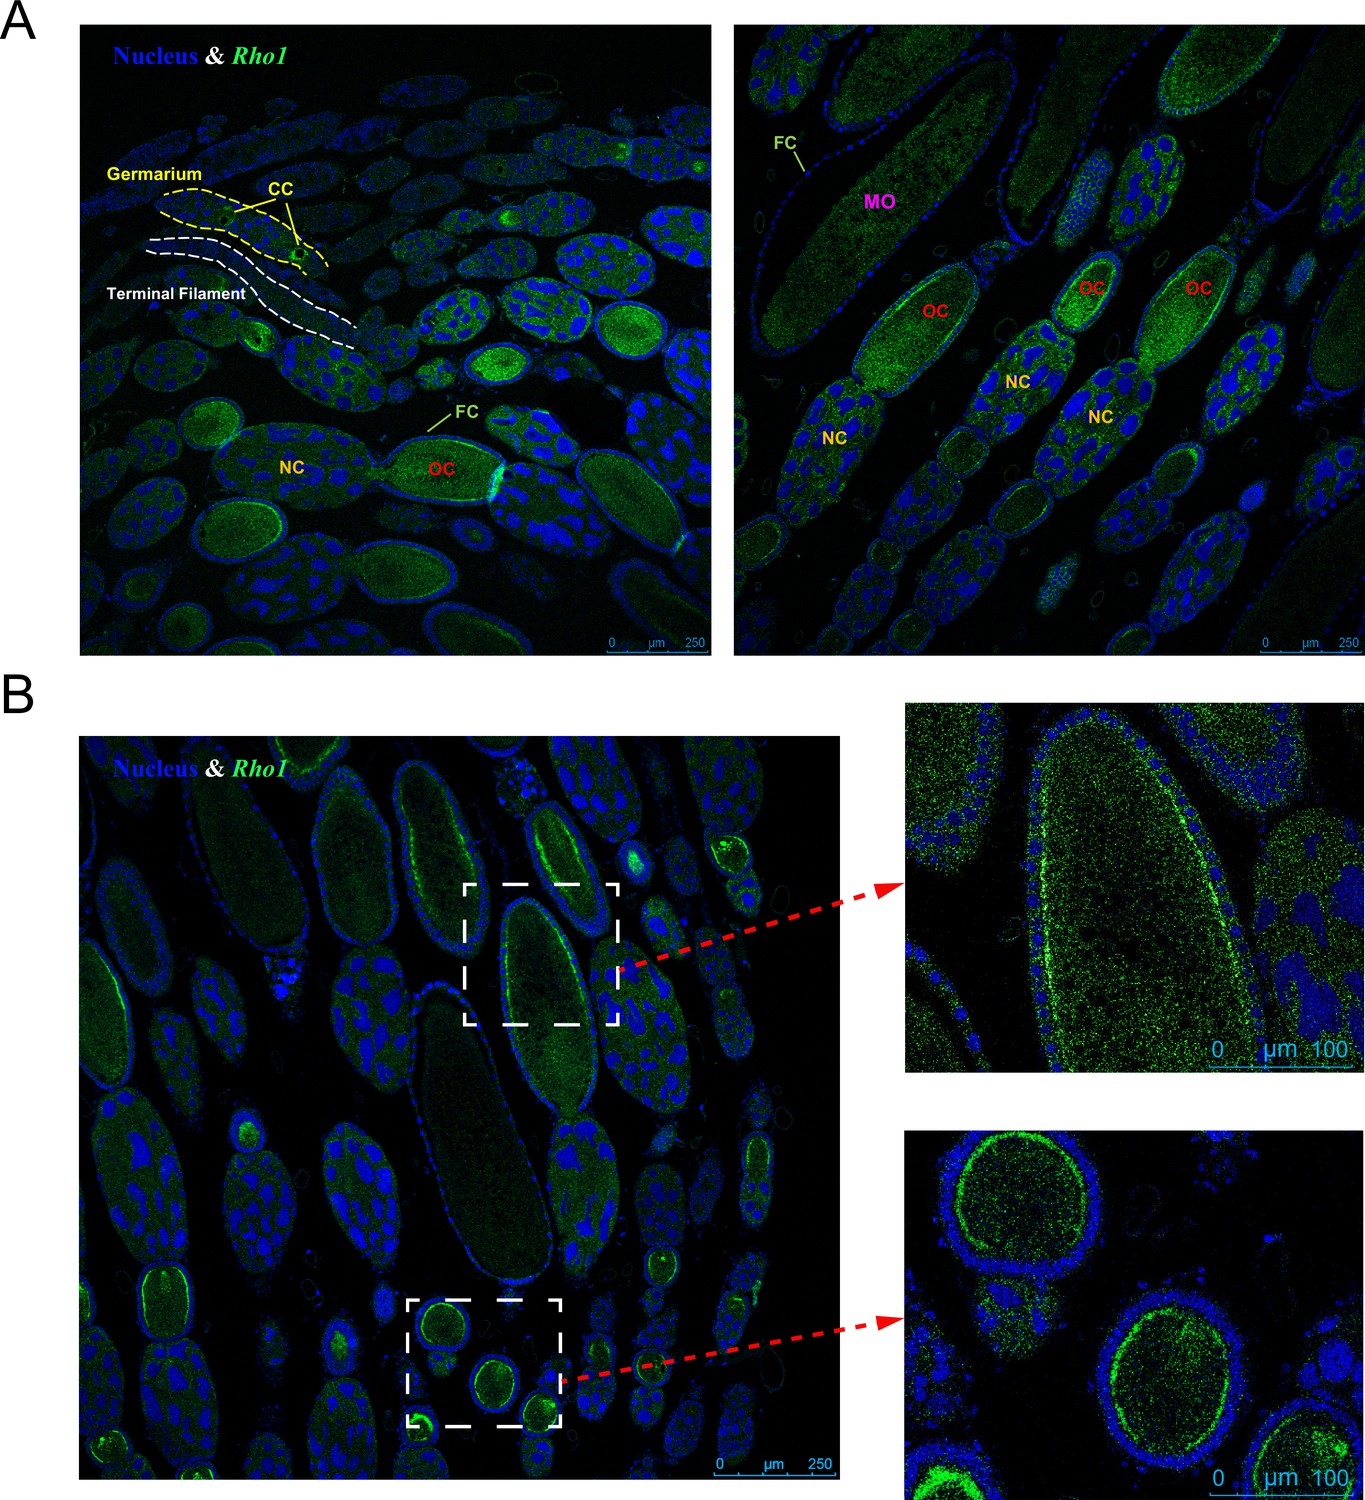
Rho1 gene expression localization in the queen ovary via RNAscope in situ hybridization.
(A) The expression of Rho1 (green color) is limited to the growth stages of the oocyte: In the germarium, Rho1 is expressed in cytocysts (CCs) and in the vitellarium, Rho1 is highly expressed in oocytes (OCs), particularly near the lateral cell surface (B). In contrast, nurse cells (NCs) and follicle cells (FCs) do not exhibit elevated Rho1 expression at this stage. Less expression of Rho1 is observed in mature oocytes (MOs). Blue DAPI staining indicates cell nuclei for comparison. Representative pictures are shown, and the same patterns were found in six queens investigated.
Figure 8
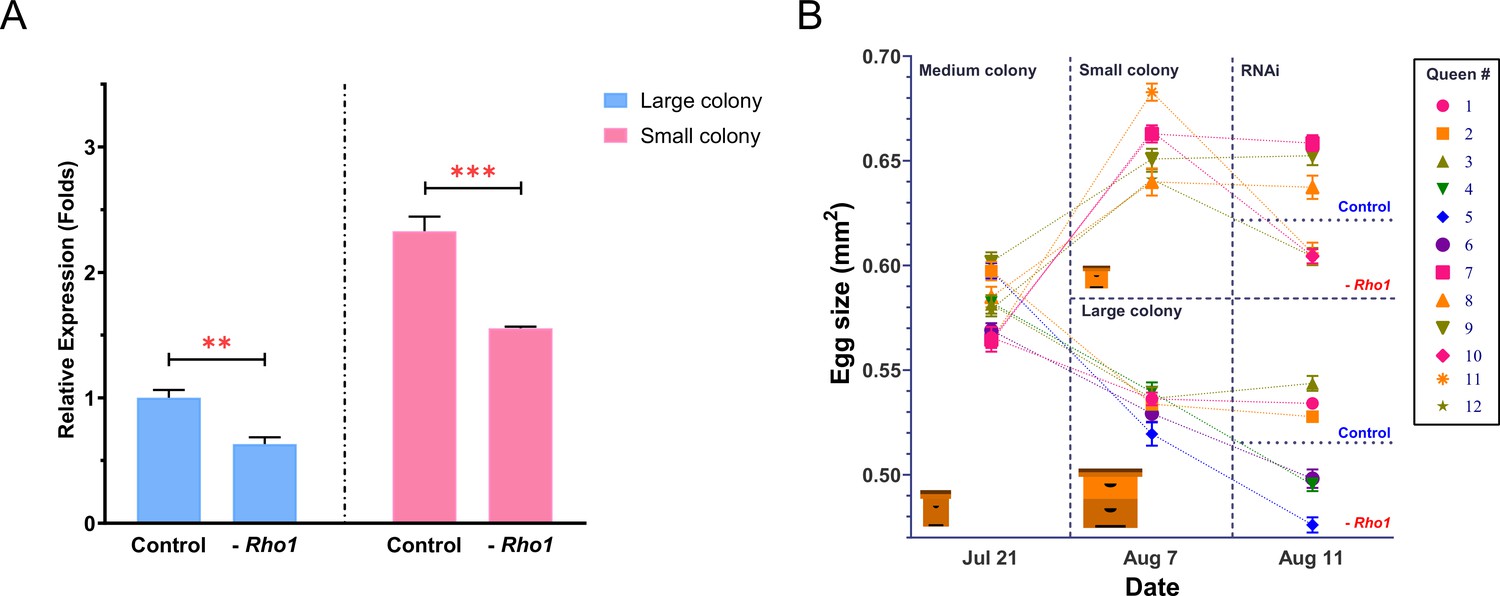
RNAi-mediated downregulation of Rho1 decreases egg size in both ‘small’ and ‘large’ colonies.
(A) RT-qPCR results confirmed the experimental downregulation of Rho1 in ovaries of RNAi-injected queens and also showed that Rho1 was significantly more expressed in queens that were housed in small colonies and thus produced larger eggs. Treatment effects were assessed by ANOVA with N = 6 and **p<0.01 and ***p<0.001. Means are shown with SD. (B) The 12 sister queens were mated and introduced to medium-sized colonies to establish egg laying. Subsequently, queens were randomly divided into two groups that were either introduced to small or large colonies. After the predicted egg-size differences were confirmed, three randomly chosen queens in each group were injected with Rho1-siRNA mix, and the other three were injected with scramble siRNA. Final egg-size measurements 3 days after injection demonstrated a significant reduction of egg size in all Rho1 knockdown queens but not in control queens, regardless of colony environment. Means are shown with SEM.
-
Figure 8—source data 1
Gene expression data.
- https://cdn.elifesciences.org/articles/80499/elife-80499-fig8-data1-v2.xlsx
-
Figure 8—source data 2
Egg-size measurements.
- https://cdn.elifesciences.org/articles/80499/elife-80499-fig8-data2-v2.xlsx
Tables
Key resources table
| Reagent type (species) or resource | Designation | Source or reference | Identifiers | Additional information |
|---|---|---|---|---|
| Sequence-based reagent | Rho1-siRNA | GenePharma | Cat# A01001 | See Supplementary file 8 |
| Sequence-based reagent | Scramble siRNA | GenePharma | Cat# A06001 | See Supplementary file 8 |
| Sequence-based reagent | PCR primers | Sangon Biotech | See Supplementary file 8 | |
| Commercial assay or kit | PrimeScript RT reagent kit | TaKaRa | Cat# RR047A | |
| Commercial assay or kit | TB Green Fast qPCR Mix | TaKaRa | Cat# RR430A | |
| Commercial assay or kit | RNAscope Multiplex Fluorescent Reagent Kit v2 | Advanced Cell Diagnostics | Cat# 323100 | |
| Commercial assay or kit | RNAscope Probe- Amel-LOC409910-C1 | Advanced Cell Diagnostics | Cat# 1061331-C1 | |
| Chemical compound, drug | DiI stain | Beyotime | Cat# C1036 | |
| Software, algorithm | ImageJ | https://Imagej.nih.gov/ij | ||
| Software, algorithm | GraphPad Prism v8 | GraphPad Software | ||
| Software, algorithm | SPSS Statistics 20.0 | IBM | RRID:SCR_019096 | |
| Software, algorithm | Xcalibur 3.0 | Thermo Fisher Scientific | RRID:SCR_014593 | |
| Software, algorithm | PEAKS 8.5 | Bioinformatics Solutions | ||
| Software, algorithm | Primer Premier 5.0 | PREMIER Biosoft | ||
| Software, algorithm | Cytoscape v3.8.2 | https://cytoscape.org | ||
| Software, algorithm | TBtools | https://doi.org/10.1016/j.molp.2020.06.009 | ||
| Software, algorithm | STRING | https://string-db.org | ||
| Software, algorithm | Metascape | http://metascape.org/ | ||
| Software, algorithm | geNorm | https://genorm.cmgg.be |
Additional files
-
Supplementary file 1
Egg-size measurements from queen ovary comparison experiments.
- https://cdn.elifesciences.org/articles/80499/elife-80499-supp1-v2.xlsx
-
Supplementary file 2
Proteins of difference abundance.
- https://cdn.elifesciences.org/articles/80499/elife-80499-supp2-v2.xlsx
-
Supplementary file 3
Gene Ontology results of upregulated proteins in large-egg-producing ovaries.
- https://cdn.elifesciences.org/articles/80499/elife-80499-supp3-v2.xlsx
-
Supplementary file 4
KEGG pathway results of upregulated proteins in large-egg-producing ovaries.
- https://cdn.elifesciences.org/articles/80499/elife-80499-supp4-v2.xlsx
-
Supplementary file 5
Protein–protein interaction analysis of cytoskeleton organization proteins.
- https://cdn.elifesciences.org/articles/80499/elife-80499-supp5-v2.xlsx
-
Supplementary file 6
Rho1 expression and egg-size correlation analysis from the RNAi experiment.
- https://cdn.elifesciences.org/articles/80499/elife-80499-supp6-v2.xlsx
-
Supplementary file 7
Rho1 expression and egg-size correlation analysis using an independent dataset.
- https://cdn.elifesciences.org/articles/80499/elife-80499-supp7-v2.xlsx
-
Supplementary file 8
Sequence information for RNAi and qPCR.
- https://cdn.elifesciences.org/articles/80499/elife-80499-supp8-v2.xlsx
-
MDAR checklist
- https://cdn.elifesciences.org/articles/80499/elife-80499-mdarchecklist1-v2.docx
Download links
A two-part list of links to download the article, or parts of the article, in various formats.
Downloads (link to download the article as PDF)
Open citations (links to open the citations from this article in various online reference manager services)
Cite this article (links to download the citations from this article in formats compatible with various reference manager tools)
The molecular basis of socially induced egg-size plasticity in honey bees
eLife 11:e80499.
https://doi.org/10.7554/eLife.80499


