Prolonged partner separation erodes nucleus accumbens transcriptional signatures of pair bonding in male prairie voles
- Department of Molecular, Cellular, and Developmental Biology, University of Colorado Boulder, United States
- Department of Psychology and Neuroscience, University of Colorado Boulder, United States
- Department of Adult Hematology, University of Colorado- Anschutz Medical Campus, United States
- BioFrontiers Institute, University of Colorado Boulder, United States
- Department of Behavioral Neuroscience, Oregon Health and Science University, School of Medicine, United States
Figures
Figure 1 with 3 supplements
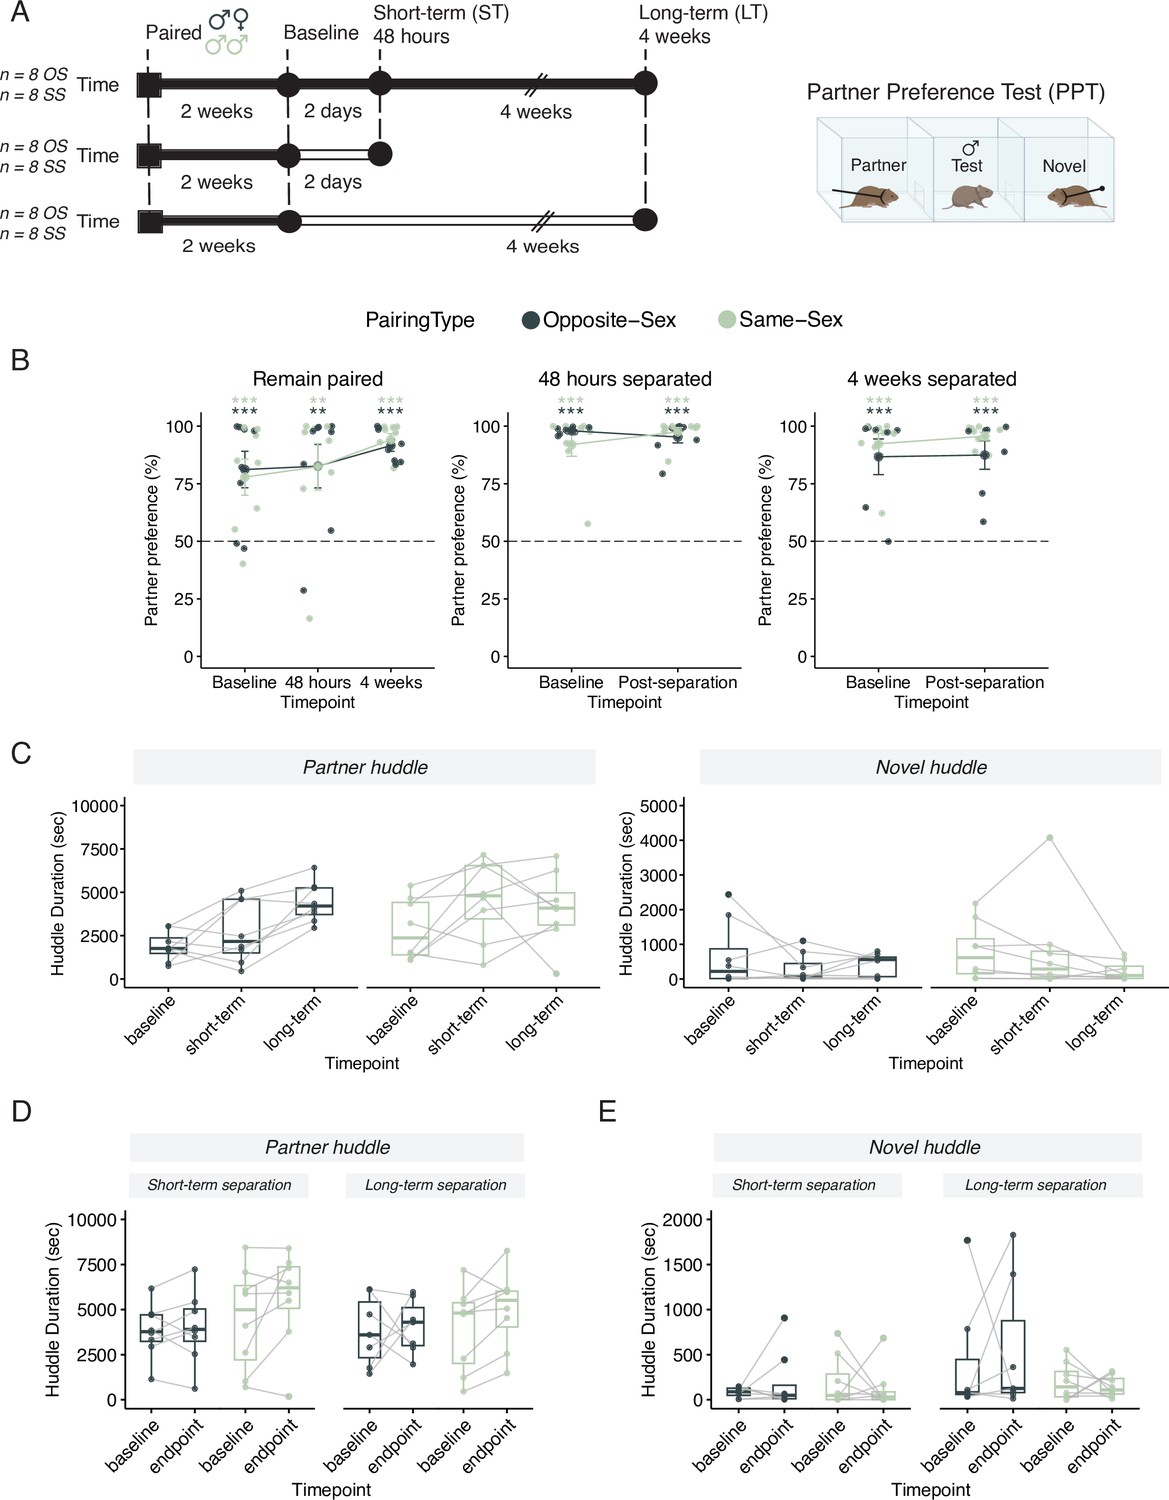
Males in either opposite-sex or same-sex pairs retain their partner preferences for at least four weeks following partner separation.
Additional stats including post-hocs provided in Supplementary file 1. (A) Schematic of a partner preference test (PPT) and timelines for behavioral experiments. Opposite-sex (n=8/cohort) and same-sex (n=8/cohort) pairs were paired for 2 weeks prior to a baseline PPT. Pairs were then either in a remain paired or separated cohort. Remain paired animals stayed with their partners throughout the experiment and underwent PPT 48 hours and 4 weeks after baseline. Separated animals were separated from their partners for either 48 hours (short-term) or 4 weeks (long-term) prior to the endpoint PPT. (B) Partner preference scores (% partner huddle/total huddle) from baseline, short-term, and long-term PPTs of opposite-sex (dark green) and same-sex (light green) paired males. Opposite- and same-sex paired males showed a baseline partner preference that remained evident for both groups after short-term separation and long-term separation (one-way t-tests relative to 50%, *** p<0.001, ** p<0.01). Black dotted line at 50% indicates no preference for partner or novel. (C) Partner (left) and novel (right) huddle duration (seconds) for remain paired animals over time during each PPT (two-way RM-ANOVA). (D) Partner huddle for short-term (left) and long-term (right) separated animals between baseline and the endpoint PPT—48 hours or 4 weeks post-baseline, respectively (two-way RM-ANOVA). (E) Novel huddle for short-term (left) and long-term (right) separated animals between baseline and the endpoint PPT—48 hours or 4 weeks post-baseline respectively (two-way RM-ANOVA).
Figure 1—figure supplement 1
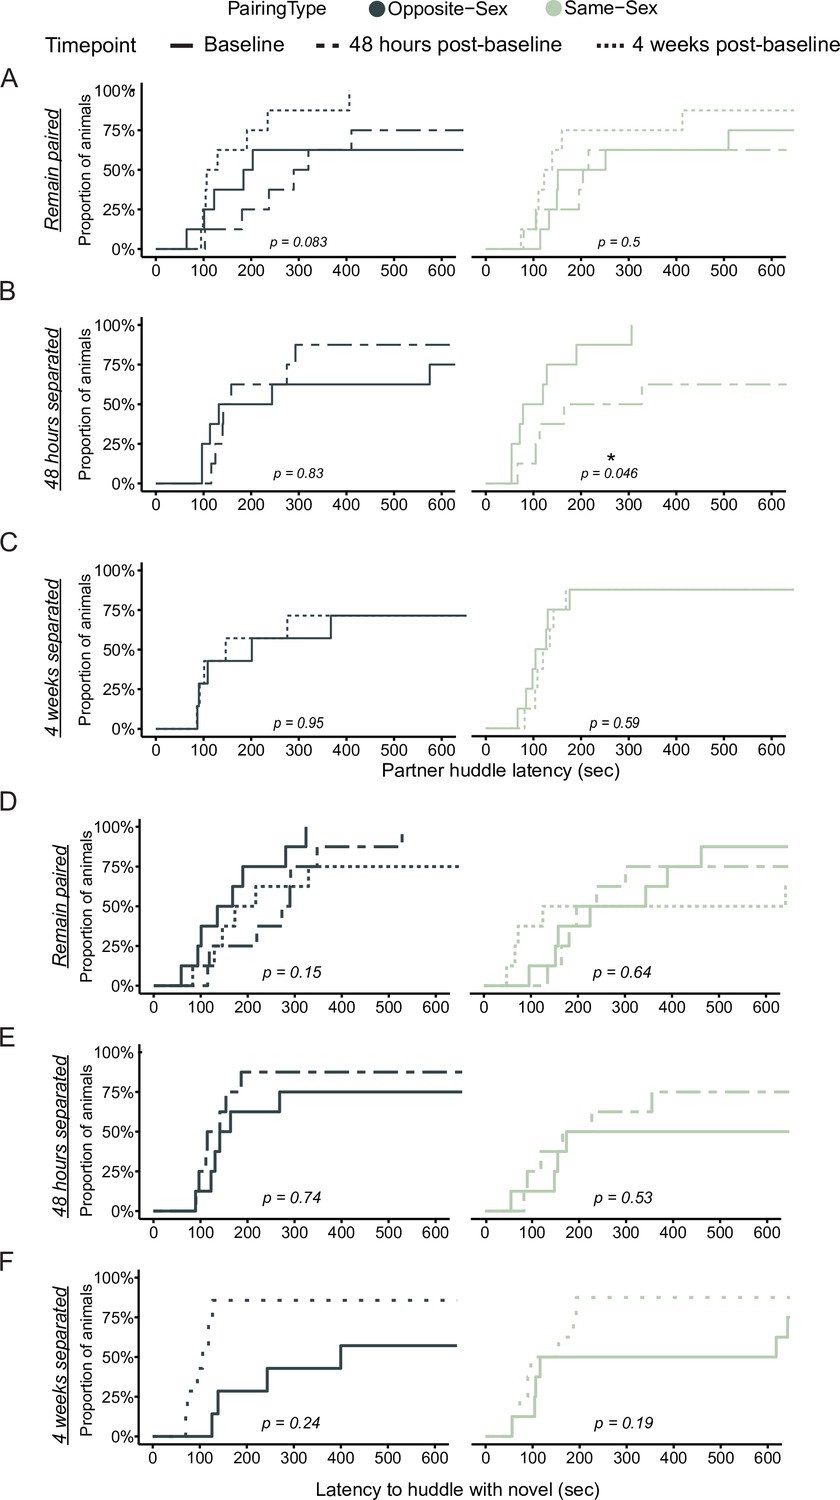
Partner and novel huddle latency is unchanged in both remain paired and separated opposite- and same-sex paired males.
Cumulative event plots for partner (A–C) and novel (D–F) huddle latency in opposite-sex (left, dark green) and same-sex (right, light green) paired males showing the first 10 minutes of the partner preference test. (A) There was no difference in latency to huddle after 6 weeks of paring compared to 2 weeks in opposite sex pairs. This was true for both partner and novel huddle. (B) Same-sex paired males huddle significantly more quickly with their partner at baseline compared to 48 hr post-separation (log-rank test: χ2=4.0, p=0.046) while this change is absent in opposite-sex paired males. (C) Males separated for 4 weeks do not have any changes to their partner huddle latency. (D) As in A, same-sex pairs show no different in huddle latency over time. (E) Males separated for 48 hr have no change to their novel huddle latency. (F) Males separated for 4 weeks have no statistically significant differences between their baseline and endpoint novel huddle latencies.
Figure 1—figure supplement 2
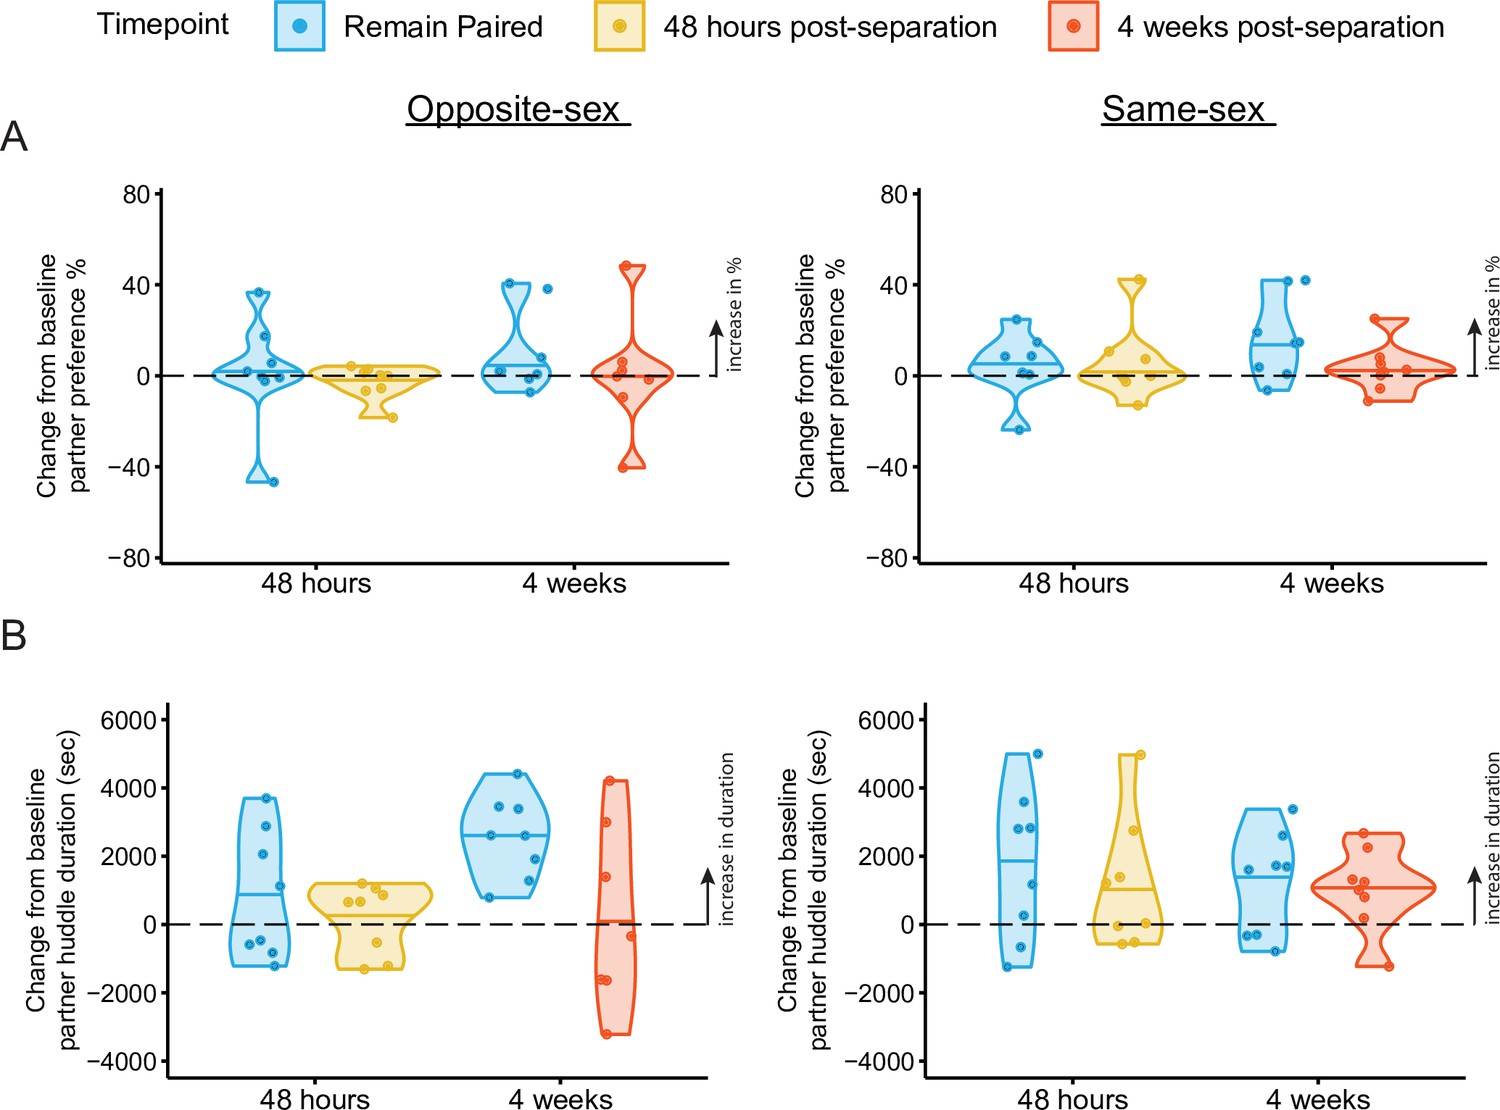
Change scores of partner preference and partner huddle duration for opposite-sex and same-sex paired males.
Change scores were calculated by subtracting the value of either metric (e.g. partner preference or partner huddle duration) at the endpoint PPT minus the baseline PPT. (A) Change scores of percent partner huddle for opposite-sex (left) and same-sex (right) paired males. (B) Change scores of partner huddle duration. Partner huddle duration significantly increased between 4 weeks post baseline only in males that had remained with their opposite-sex partner (t-test against 0%: p=0.000529). Same-sex paired males continued to increase their partner huddle duration after baseline regardless of separation (t-test against 0%: remain paired 48 hr – base p=0.062; remain paired 4 weeks – base p=0.060; separated 4 weeks – base p=0.046).
Figure 1—figure supplement 3
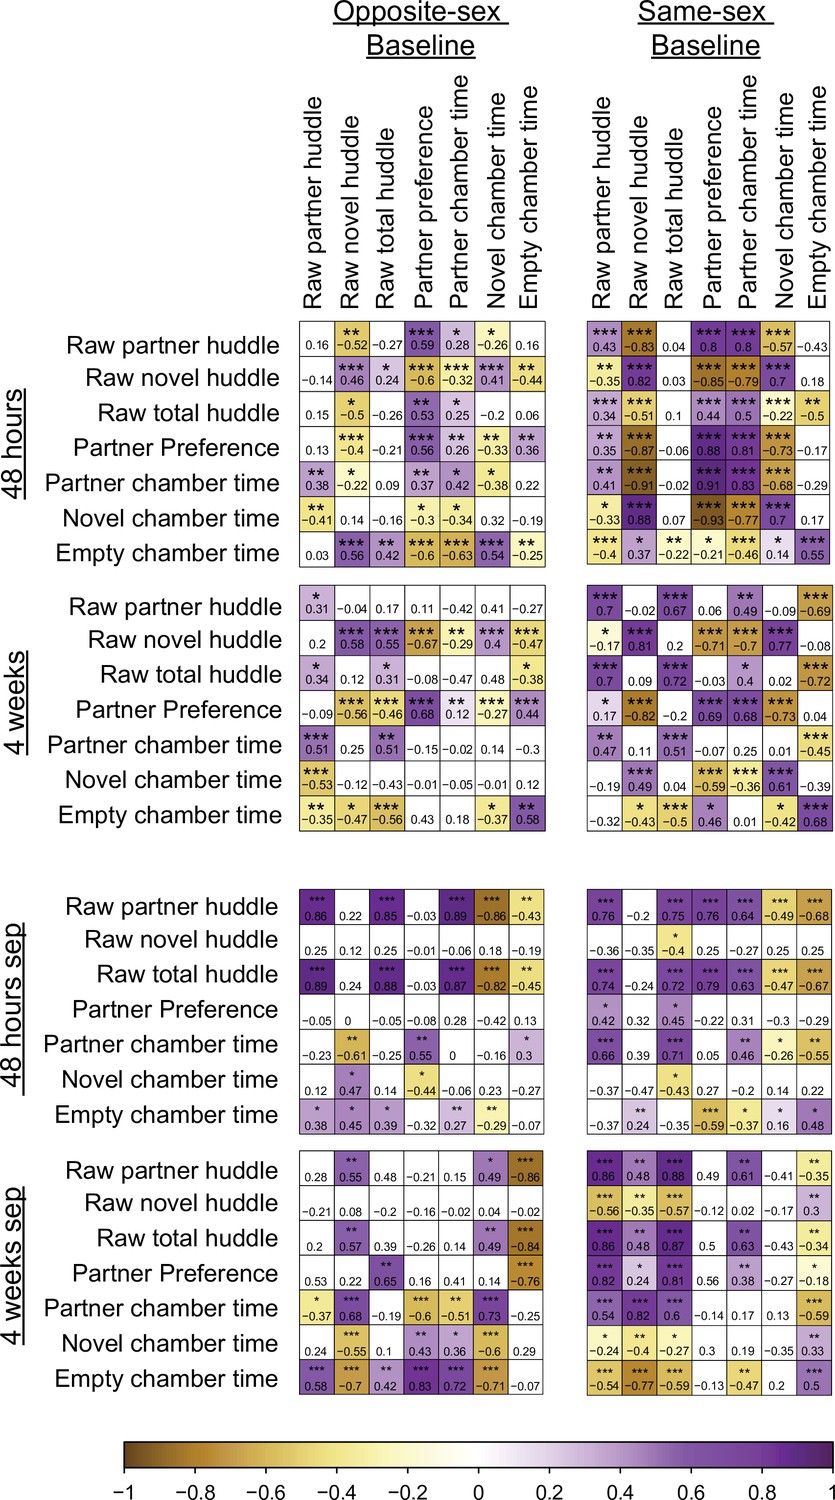
Pearson’s correlation matrices of partner preference test behaviors across time points.
Left: opposite-sex paired males, Right: same-sex paired males. Correlation of PPT metrics for remain paired males (top 2 rows), males separated for 48 hr (3rd row), and males separated for 4 weeks (4th row). Number and color indicate Pearson’s R-value ***p<0.001, **p<0.01, *p<0.05.
Figure 2 with 2 supplements
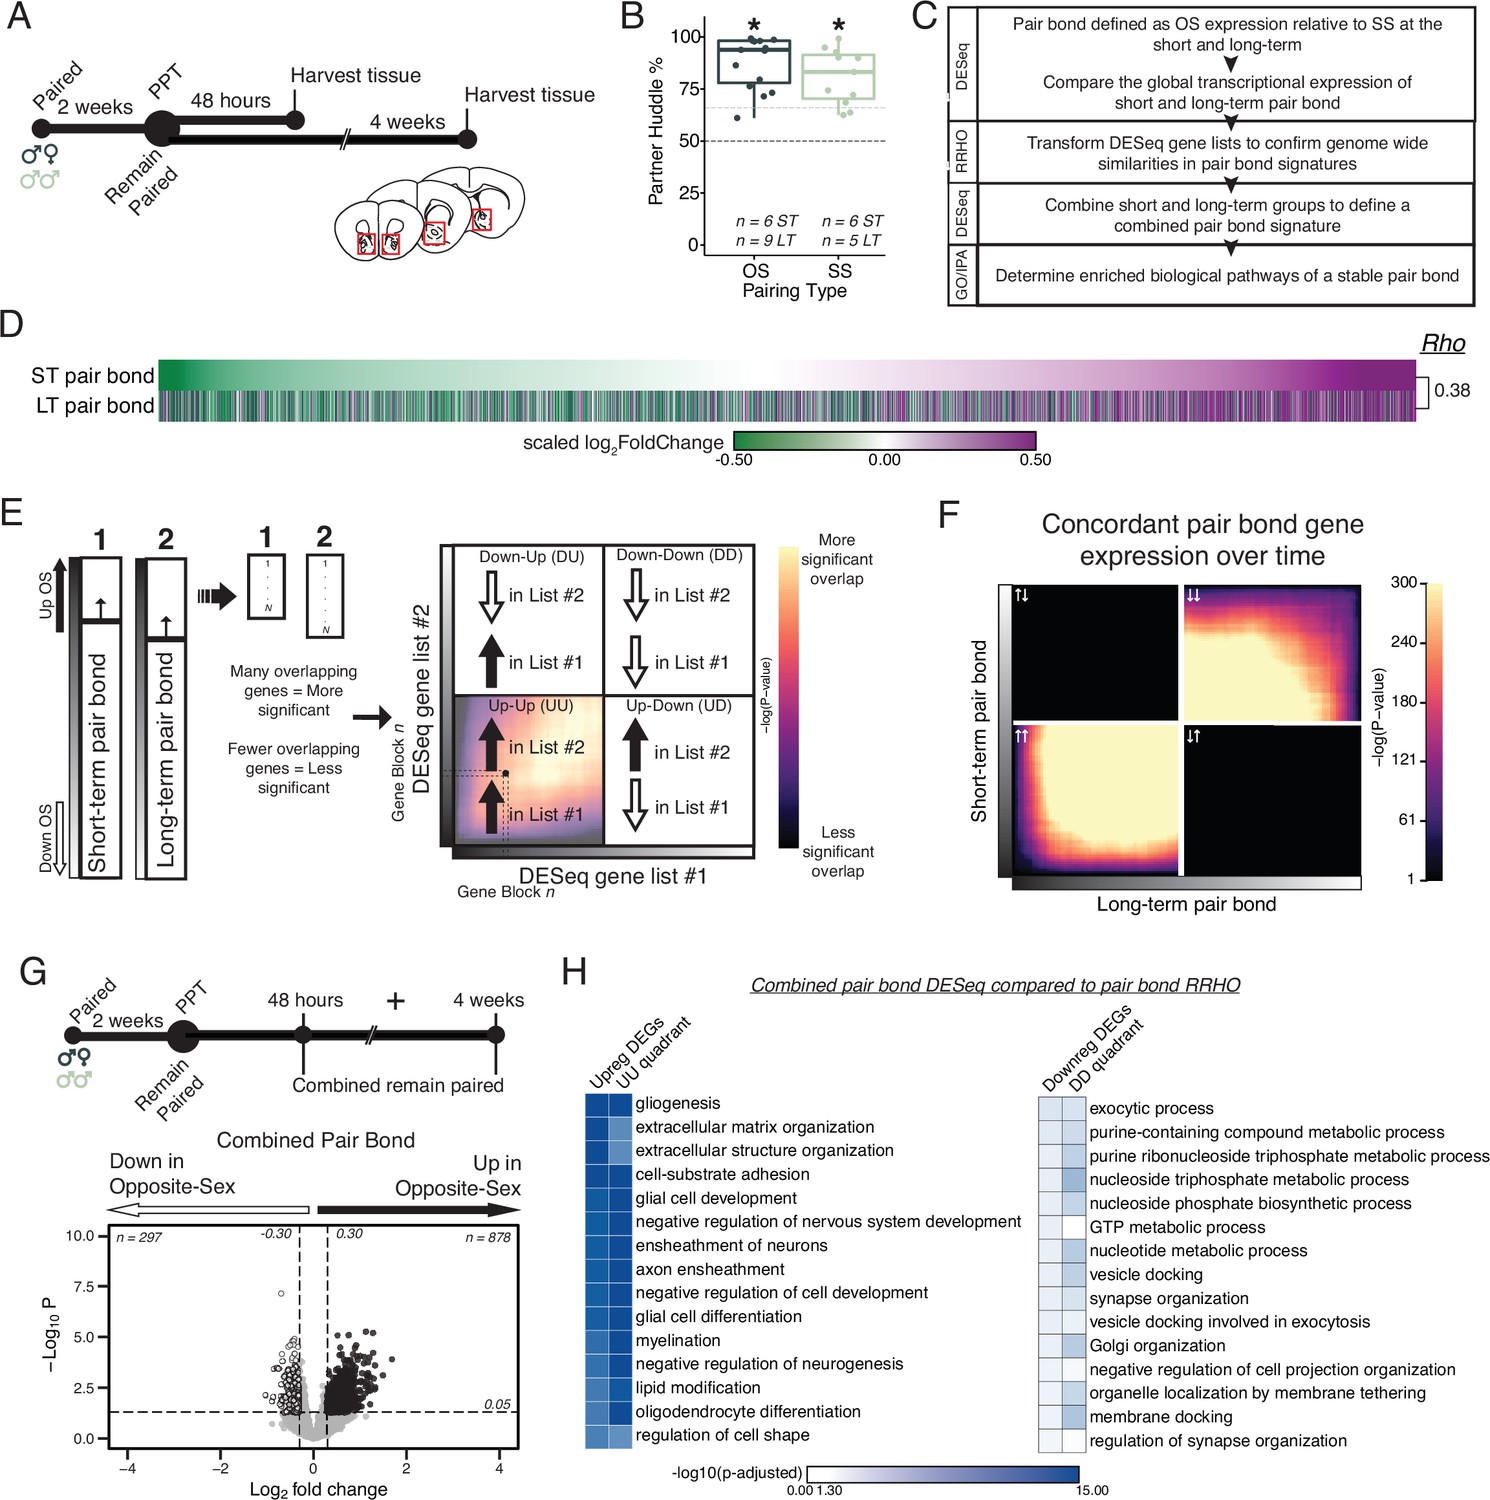
Pair bonding leads to persistent and consistent changes in NAc transcription.
(A) Opposite- and same-sex pairs were paired for 2 weeks prior to a baseline partner preference test. Pairs then remain paired for either 48 hours (short-term; ~2 weeks total pairing) or 4 weeks (long-term; ~6 weeks total pairing) prior to collecting fresh nucleus accumbens tissue (dissection sites in red boxes) for RNA sequencing. (B) Baseline partner preference scores of males included in RNA sequencing for the opposite- and same-sex groups (one-tailed t-test relative to 50%: opposite-sex T14=11.76, p=1.21 X 10⁻⁸; same-sex T10=7.78, p=1.50 X 10⁻⁵). Black dotted line indicates a 50% partner preference score and the grey dotted line indicates 66%. There were no differences in partner preference score between opposite- and same-sex paired animals used for RNAseq (two-tailed t-test: T21.016 = 1.374, p=0.184). (C) Transcriptional analysis workflow. (D) Gene list from both timepoints ordered from the smallest to largest log2FoldChange after short-term pairing with color indicating up- or down-regulation in opposite- vs same-sex pairs. Expression patterns are strongly correlated across timepoints (Rho = 0.38, p=2.2 X 10⁻¹⁶). (E) Schematic of RRHO analysis. The heatmap is arranged into quadrants of genes upregulated in both lists (up-up: quadrant UU), downregulated in both lists (down-down: quadrant DD), or genes that have opposite regulation (up in list 1-down in list 2: quadrant UD; down in list 1-up in list 2: quadrant DU). Genes that are found in both lists at a similar ranked position result in higher p-values and are represented by a yellow color. (F) RRHO comparing short-term and long-term pair bonding (from 2D) indicates a stable pair bond gene signature over time as evidenced by concordant up- or downregulated genes at the two timepoints. (G) The short-term and long-term time points were pooled for opposite- and same-sex pairs to define the combined pair bond gene signature. (H) We compared GO analysis Mus musculus ontology terms between the combined pair bond DEGs and the RRHO quadrants (from 2 F) with strong correspondence between the two analyses.
Figure 2—figure supplement 1
Cohort shuffled controls for remain paired cohorts.
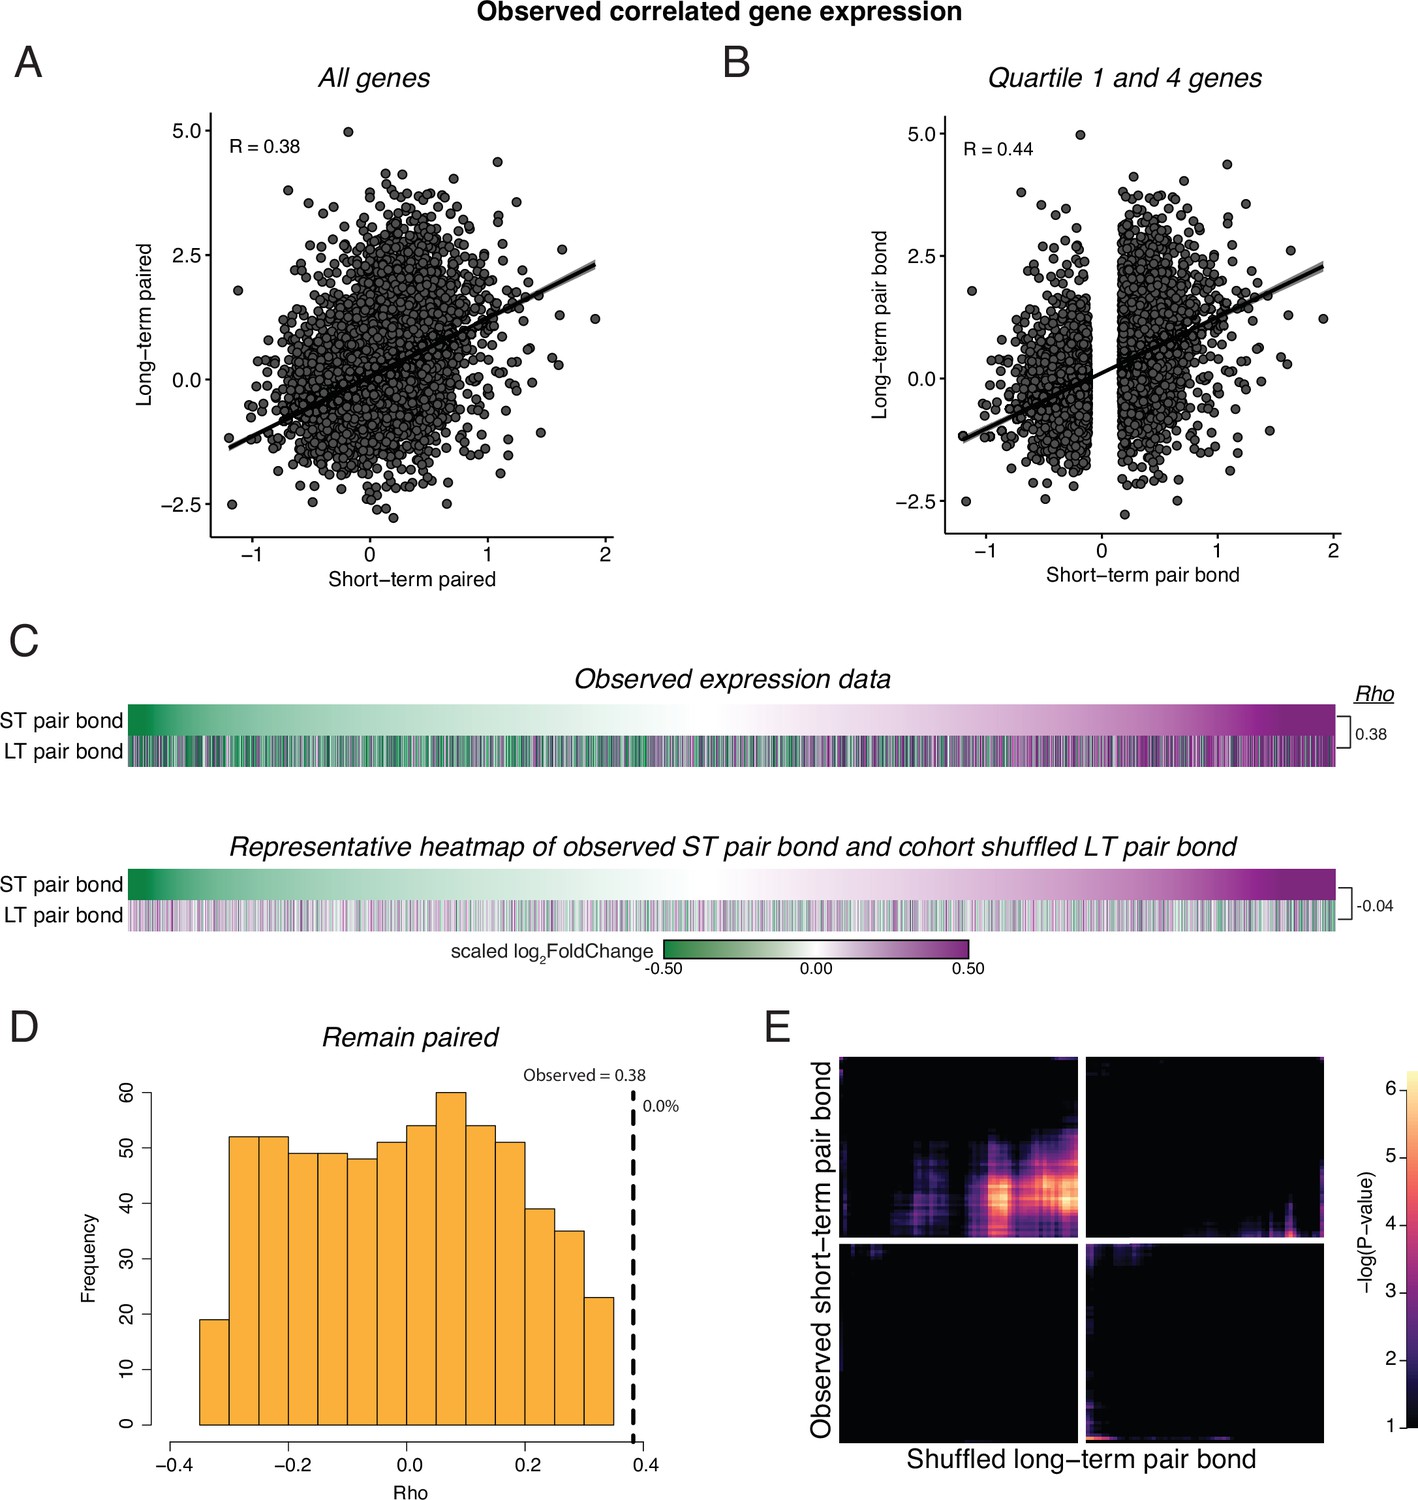
(A) Spearman’s Ranked Correlation of gene expression (log2FoldChange) at the short-term pair bond and the long-term pair bond. Black line is the regression line with shading indicating a 95% confidence interval. (B) To ensure that our correlations are not driven by genes with consistent but low differential expression values, we only retained the first and fourth quartile of genes in the short-term pair bond and found a stronger Spearman’s Ranked Correlation between pair bond time points. (C) To test if the correlation in gene expression between remain paired timepoints was likely to be due to chance, we shuffled the Cohort identity for each animal and performed differential expression analysis. Heatmaps show every gene from short-term and long-term pairing ordered from the smallest to largest log2FoldChange after short-term pairing in the observed comparison (top) and a representative Cohort shuffle (bottom). Scale represents the scaled log2FoldChange. (D) Histogram of Rho values for 1000 iterations of (C, shuffled data). Only correlations that did not have a –log10(adjusted pvalue) of infinite were retained (n=636). Vertical dashed line indicates the observed Rho value with the percent of shuffled iteration in which Rho was greater than the observed value to the right (0.0%). (E) Unscaled RRHO plot of the representative Cohort shuffle used in (C) indicates elimination of the concordant signal seen with the observed data.
Figure 2—figure supplement 2
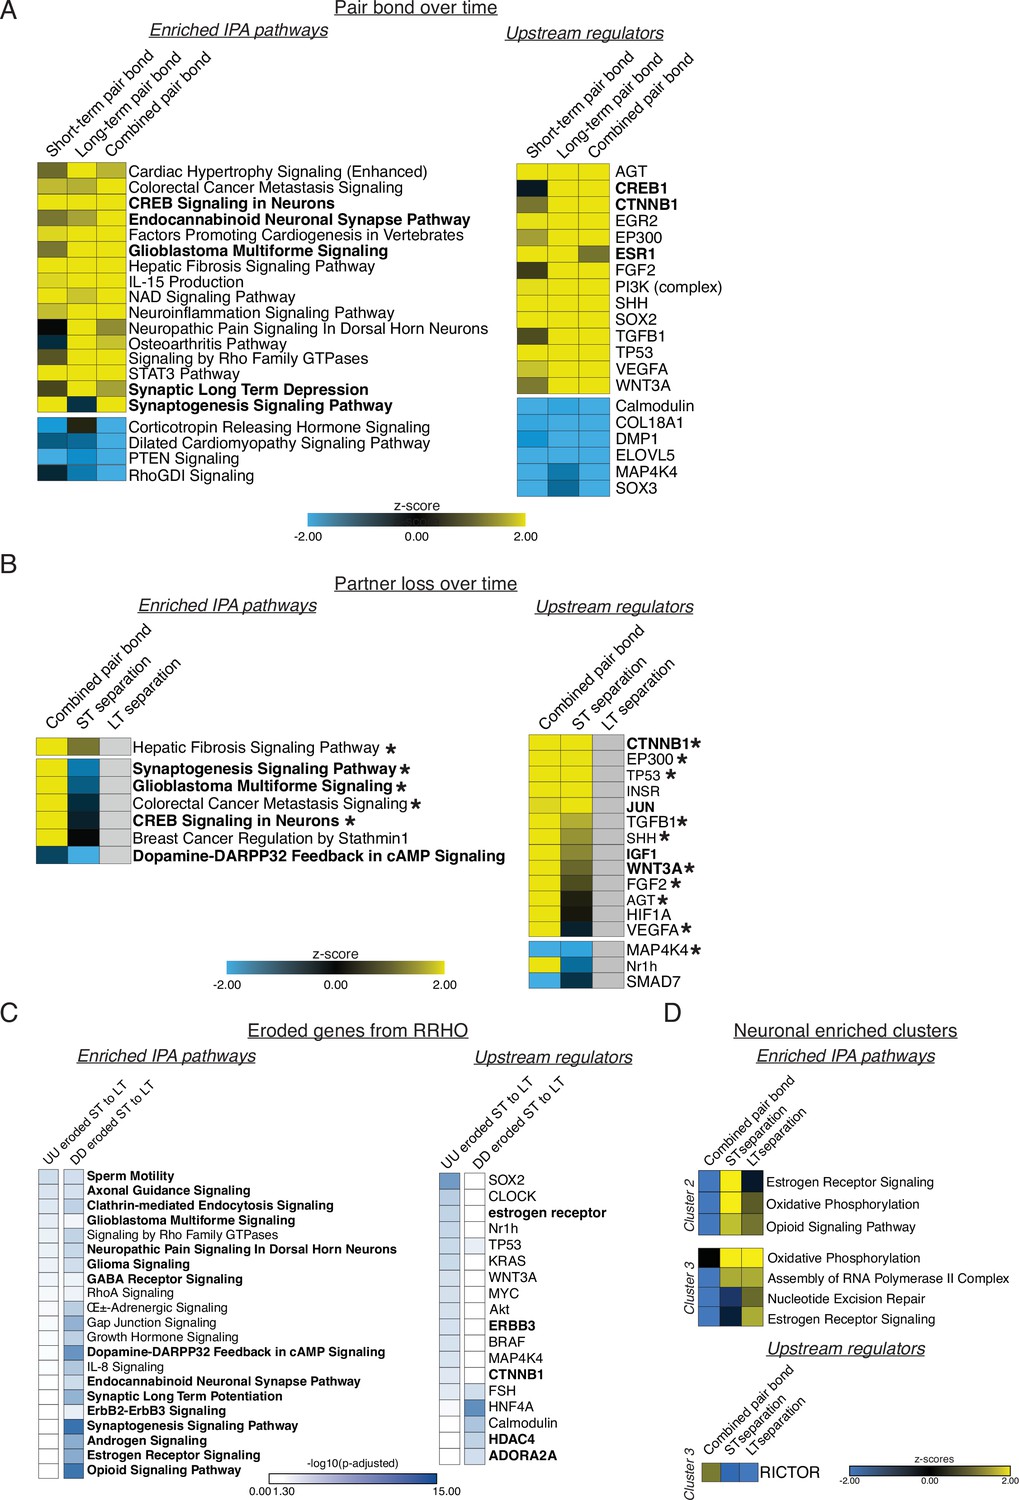
Ingenuity Pathway Analysis (IPA) corresponding to GO term analyses.
Figure is also supplemental data for Figure 3. IPA analyses indicating enriched pathways and upstream regulators for applicable comparisons. Representative pathways and regulators were chosen based on significance, activation pattern, and relationship to GO terms. Full lists can be found in Supplementary file 3. Yellow to blue scales indicate the z-scores of enrichment where yellow is activated and blue is repressed. White to blue scale represents the –log10(p-adjusted) where any non-significant terms are white. (A) IPA analysis for the remain-paired cohorts in Figure 2. The strong similarity of the activation/repression of pathways and regulators from short-term to long-term pairing are well represented by the combined pair bond transcriptional signature. Pathways or regulators of interest are bolded. (B) IPA analysis of the combined pair bond, short-term separation, and long-term separation in Figure 3. Grey boxes indicate that the term is not found in the results for that time point. Terms and regulators of interest are bolded while asterisks denote terms or regulators found in A. (C) IPA analysis of the eroded ST to LT genes for the UU and DD quadrants of Figure 3. Results are denoted as adjusted p-values instead of z-scores because there is no log2FoldChange value associated with the RRHO heatmaps. Pathways or regulators of interest are bolded. (D) IPA analysis of the neuronal enriched clusters of interest from Figure 4. Cluster #1 contained few genes and no significant pathways or regulators. Cluster #2 did not have any significant regulators.
Figure 3 with 5 supplements
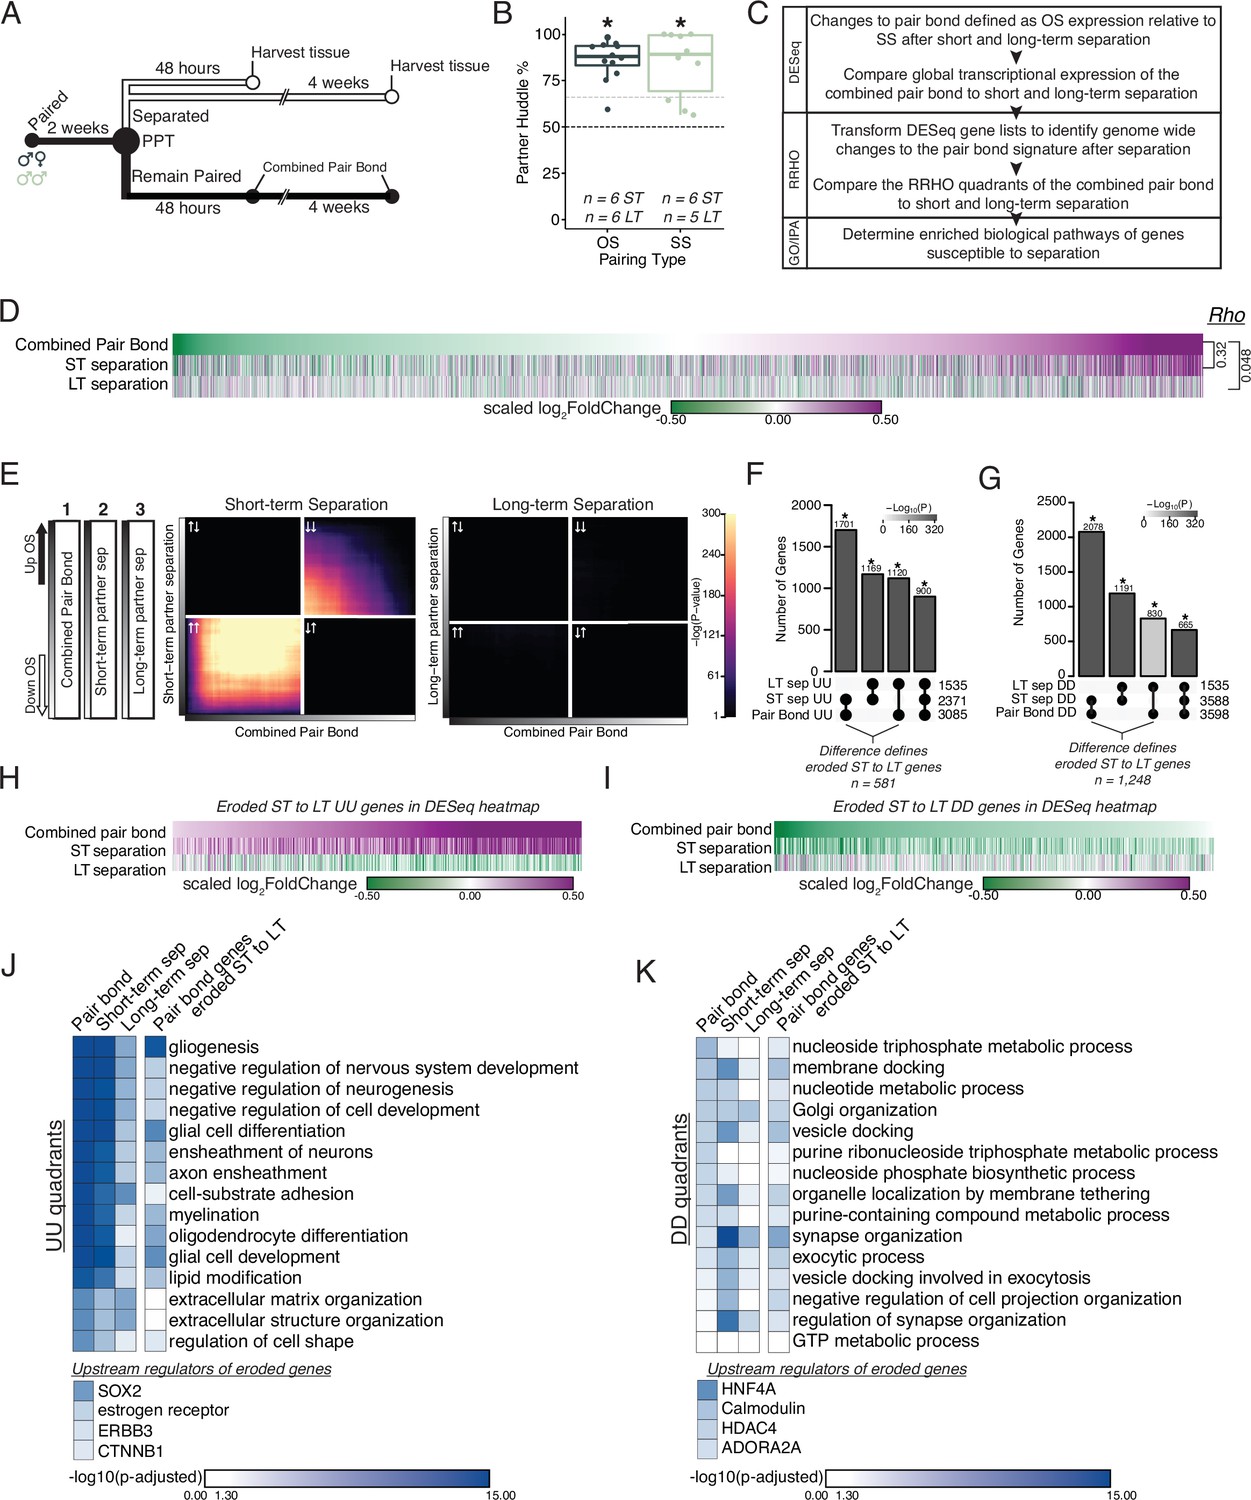
Prolonged separation erodes pair bond transcriptional signatures.
(A) Opposite-sex and same-sex pairs were paired for 2 weeks prior to a baseline partner preference test. Pairs were then separated for either 48 hours (short-term) or 4 weeks (long-term) prior to collecting fresh nucleus accumbens tissue for RNAseq. Animals in the Remain Paired group are analyzed in Figure 2 to define the Combined Pair Bond transcriptional signature. (B) Baseline partner preference scores of males included in RNA sequencing for the opposite- and same-sex separation groups (one-tailed t-test relative to 50%: opposite-sex T11=11.56, p=1.71 X 10⁻⁷; same-sex T9=6.07, p=1.87 X 10⁻⁴). Black dotted line indicates a 50% partner preference score and the grey dotted line indicates 66%. There were no differences in partner preference score between opposite-sex and same-sex separated animals used for RNAseq (two-tailed t-test: T14.33 = 0.33, p=0.75). (C) Transcriptional analysis workflow similar to Figure 2. (D) Heatmap of the scaled log2FoldChange for every gene where short- and long-term separation is compared to the combined pair bond gene signature. (E) RRHO using the combined pair bond, short-term separated, and long-term separated ranked transcript lists show that short-term separated animals retain a gene expression pattern concordant with pair bond transcription while there is a dramatic erosion of pair bond gene expression following long-term separation. (F, G) Upset plot showing overlap of genes in the UU or DD quadrants of 2F and 3E RRHO was determined using a Fisher’s Exact test. The difference between the intersections of the pair-bond:short-term sep. and pair-bond:long-term sep. was used to define the eroded gene lists. (H, I) The RRHO gene lists of eroded pair bond genes were used to filter the DESeq heatmap in 2D. Eroded genes from the UU quadrants show upregulation during pair bonding and short-term separation but downregulation after long-term separation (H) while the eroded genes from the DD quadrants show the opposite pattern (I). (J, K) GO and IPA analysis of RRHO quadrant gene lists and pair bond eroded gene lists. Scale represents the –log10(p-adjusted) where any non-significant terms are white. (J) Glial associated GO terms of the UU quadrants are less significantly represented after separation and are highly significantly represented among the eroded genes. Significant upstream regulators of the eroded genes include Sox2, estrogen receptor, Erbb3, and Ctnnb1. (K) Vesicle docking and synapse organization associated GO terms of the DD quadrants are less significantly represented after separation and are more significantly represented among the pair bond eroded genes. Significant upstream regulators of the eroded genes include Hnf4a, Calmodulin, Hdac4, and Adora2a.
Figure 3—figure supplement 1
Cohort shuffled controls for the combined pair bond and separation time points.
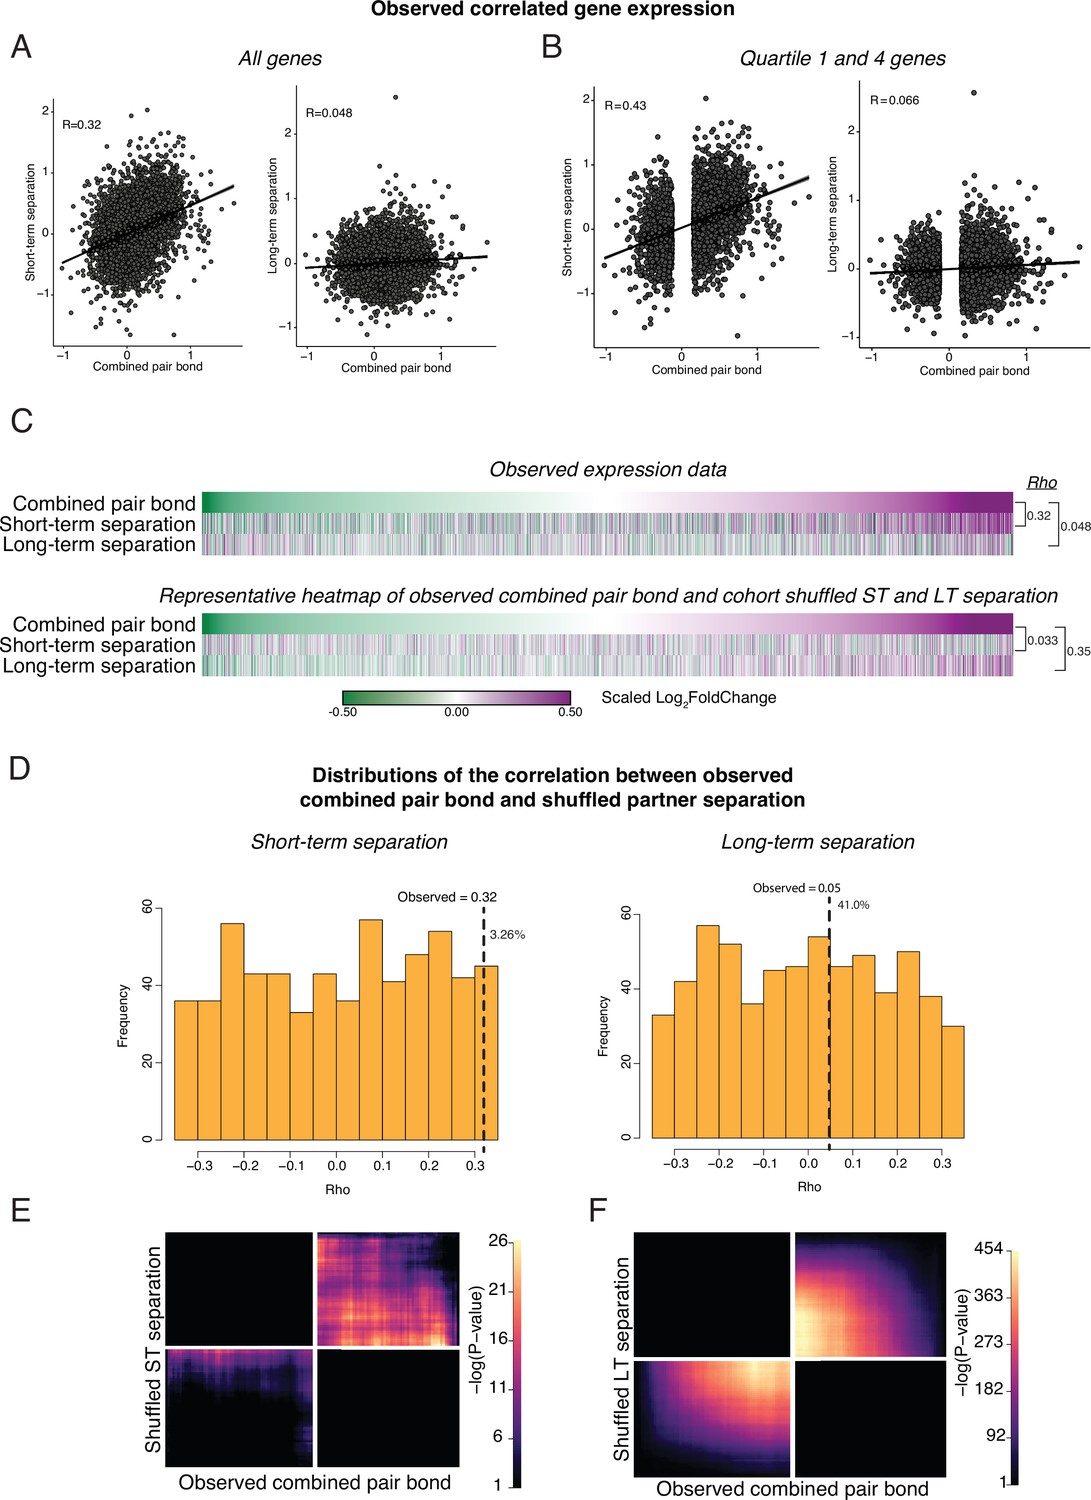
(A) Spearman’s Ranked Correlation of gene expression (log2FoldChange) for the combined pair bond vs short-term separation (left) or the combined pair bond vs long-term separation (right). Black line is the regression line with shading indicating a 95% confidence interval. (B) To ensure that our correlations are not driven by consistent but low differential expression values we only retained the first and fourth quartile of genes in the combined pair bond. We then performed a Spearman’s Ranked Correlation between the combined pair bond and each separation time point and found a greater Rho value for each time point. (C) To test if the correlation in gene expression between timepoints could occur by chance, we shuffled the Cohort identity for each animal and performed differential expression analysis. Heatmaps show every gene from the combined pair bond and separation time points ordered from the smallest to largest log2FoldChange in the combined pair bond for the observed comparison (top) and a representative Cohort shuffle (bottom) with Rho values for each. Scale represents the scaled log2FoldChange. (D) Histogram of Rho values for a 1000 shuffles of the Cohort identity as in C, shuffled. Rho values for the correlation between the combined pair bond vs short-term separation (left) or the combined pair bond vs long-term separation (right) are plotted for each iteration. Only correlations that did not have a –log10(adjusted pvalue) of infinite were retained (short-term separation n = 613; long-term separation n = 617). Vertical dashed line indicates the observed Rho value with the percent of shuffled Rho’s that were greater than the observed value to the right (pair bond:short term 3.26%; pair bond:long term 41%). (E, F) Unscaled RRHO plot of the representative Cohort shuffle used in (C). The combined pair bond vs short-term separation (E) indicates a similar concordant pattern as the observed data though to a much lower degree (note scale maximum). The combined pair bond vs long-term separation (F) shows a highly significant concordant pattern that does not occur in the observed data.
Figure 3—figure supplement 2
Volcano plots of differential expression with Upset plots for overlap of differential expressed genes.
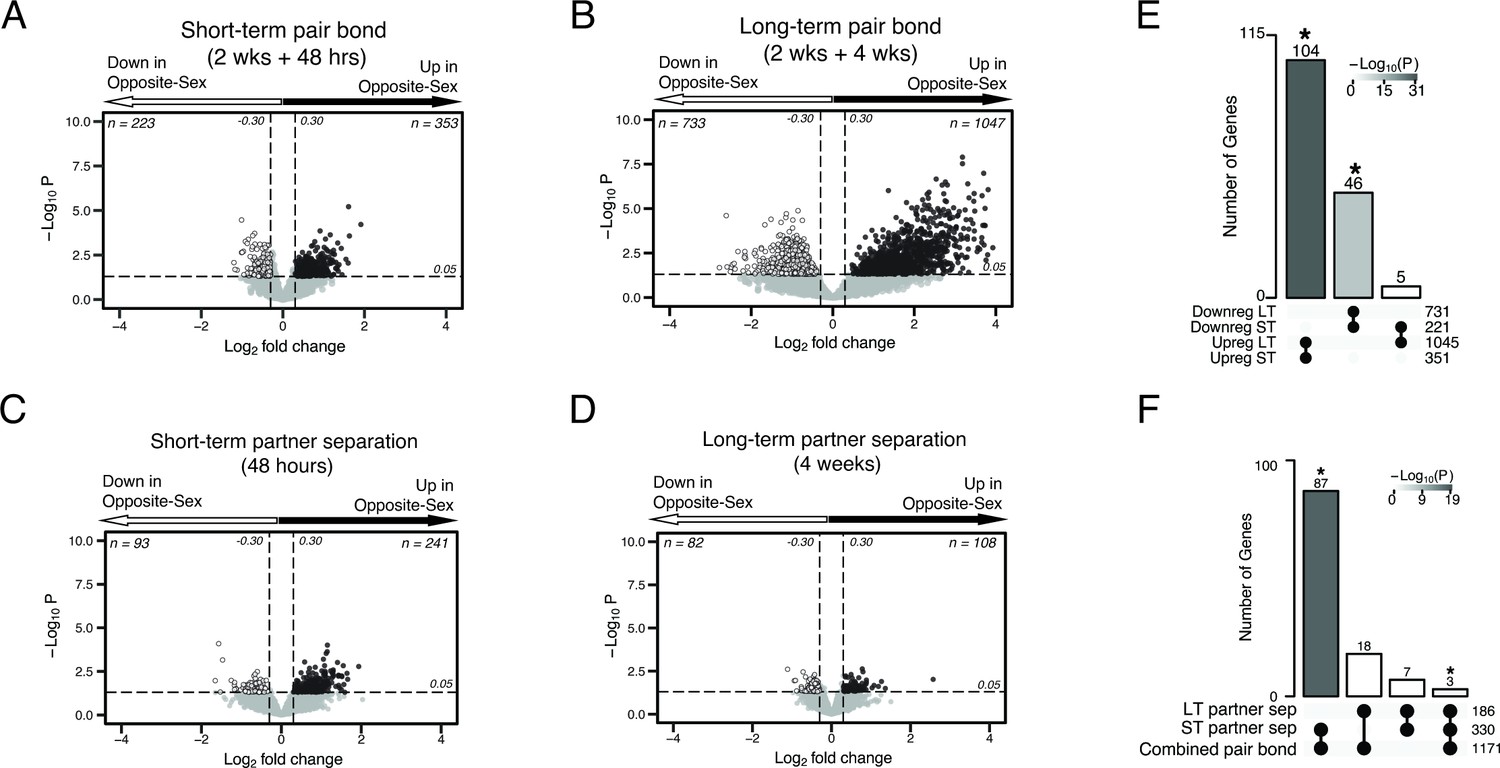
Figure is also supplemental data for Figure 2. (A–D) Volcano plots with associated Upset plots of the differentially expressed genes of the short-term pair bond (A), long-term pair bond (B), short-term partner separation (C), and long-term partner separation (D). Genes that are upregulated in opposite-sex paired males compared to same-sex paired males are to the right (black dots) and genes that are downregulated are to the left (white dots). Dashed lines indicate thresholds of +/-0.30 log2FoldChange (vertical) or 0.05 p-value (horizontal) used to determine differential expression. (E) Upset plot showing overlap of up- and downregulated DEGs from each timepoint. Intersections with no overlapping genes, such as downregulated long-term:upregulated short-term, are not displayed on the graph. Asterisks and shading indicate statistically significant intersections (Fisher’s Exact Test: Upreg ST:LT χ2=30.24, p=5.36 X 10⁻³¹; Downreg ST:LT χ2=13.32, p=7.05 X 10⁻¹⁴). (F) Upset plot showing the combined up- and downregulated separation DEGs compared to the combined pair bond DEGs. There are more shared transcripts between the pair bond and short-term separated animals than the pair bond and long-term separated animals. Asterisks and shading indicate statistically significant intersections (Fisher’s exact test: pair-bond:short-term sep χ2=31.86, p=6.78 X 10⁻¹⁹; pair-bond:long-term sep χ2=17.96, p=0.53).
Figure 3—figure supplement 3
Randomly selected subsampled data shows the same differential expression and RRHO patterns as the full dataset.
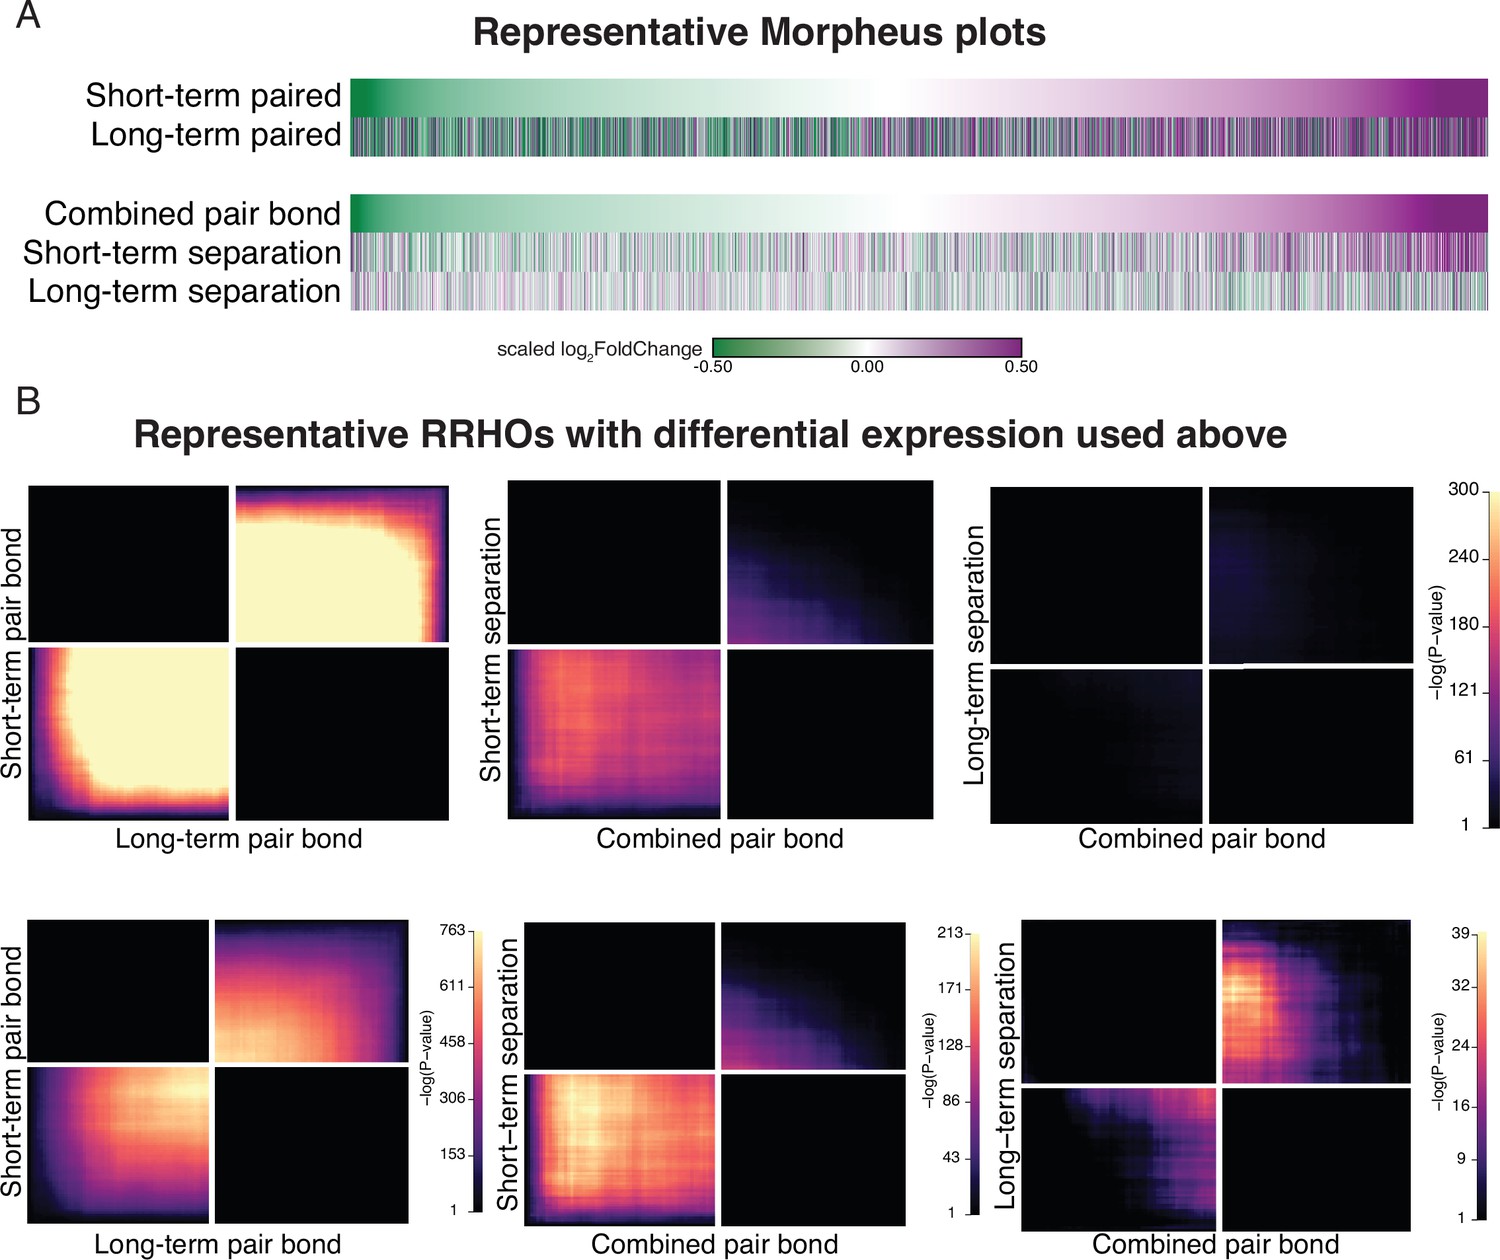
(A) We selected a random subset of the same number of animals for each opposite-sex (n=6) and same-sex paired (n=5) cohort, and performed differential expression analysis between pairing time points (top) and the combined pair bond vs separation time points (bottom). The heatmap shows genes ordered based on log2FoldChange in the short term Pair bond (tope) or combined pair bond (bottom) with color indicated expression difference between opposite and same-sex paired males. Scale represents the scaled log2FoldChange. (B) RRHO heatmaps of the representative subset used in (A) that use the same scale as the observed data (top) or are unscaled to visually optimize significant signal (bottom).
Figure 3—figure supplement 4
Control analyses for RRHO.
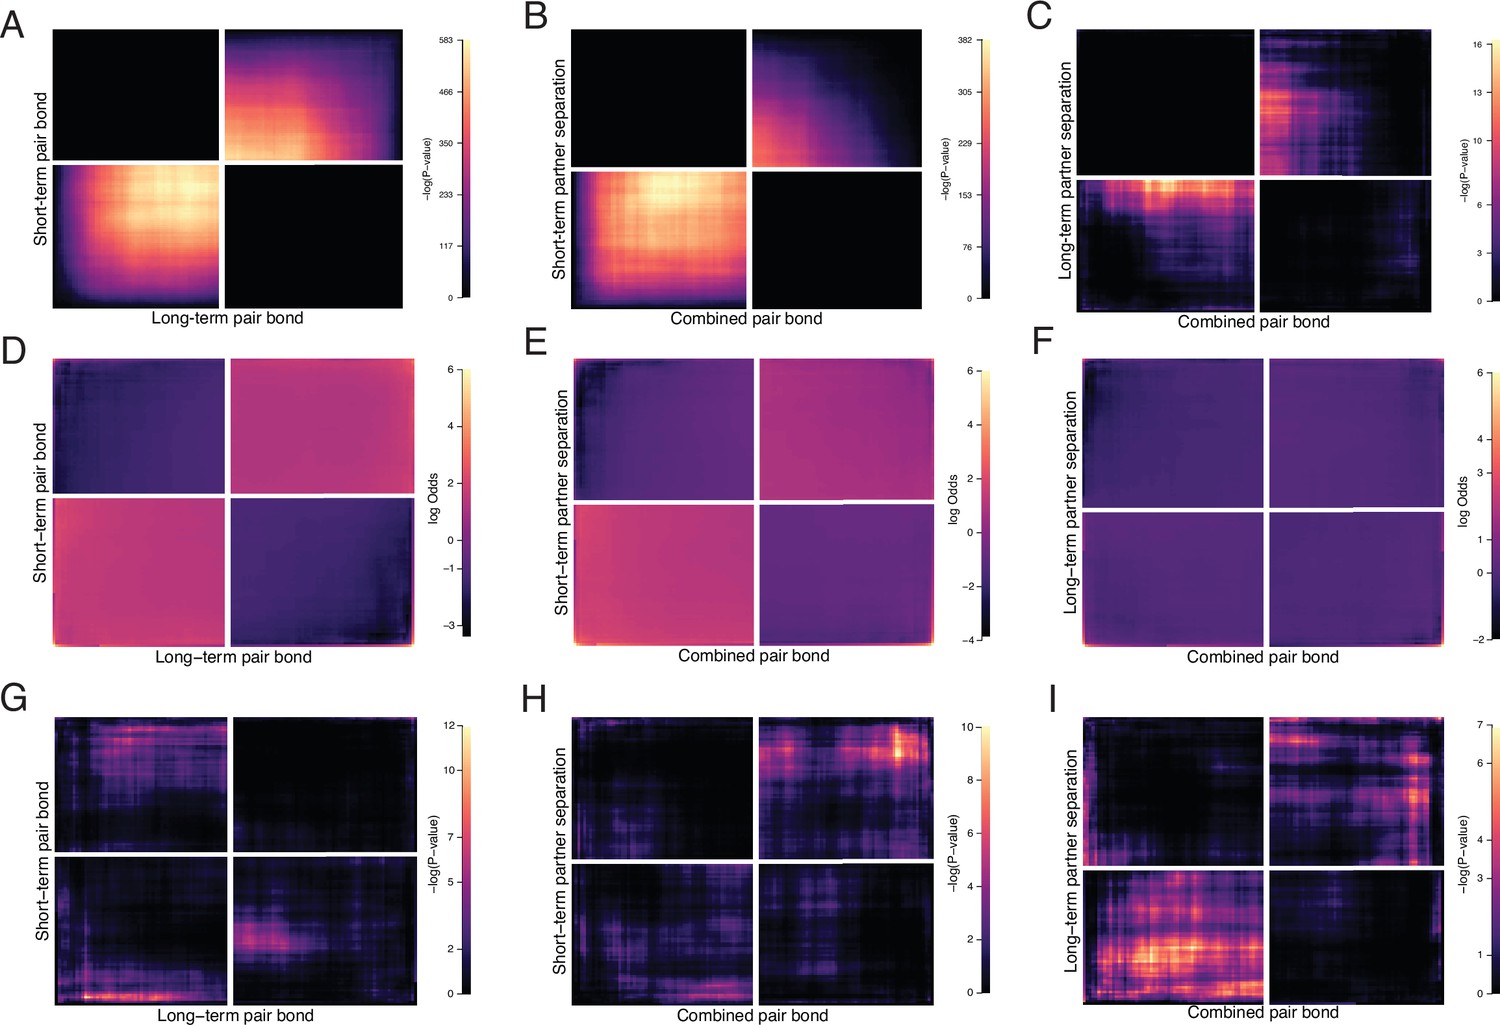
Further examination of RRHO results where A, D, G correspond to Figure 2F (short-term vs long-term remain paired). B, E, F correspond to Figure 3E left (pair bond vs short-term separation). C, F, I correspond to Figure 3E right (pair bond vs long-term separation). (A, B, C) RRHOs showing -log10(p-value) scales optimized for visualization of significant signal. Note the greatly reduced scale (max 16) in C compared with other analyses. (D, E, F) Log-Odds ratio plots for RRHOs of all analyses scaled to a max value of 6. (G–I) Control analyses where the ranked gene lists were randomly shuffled while all other RRHO parameters remain the same.
Figure 3—figure supplement 5
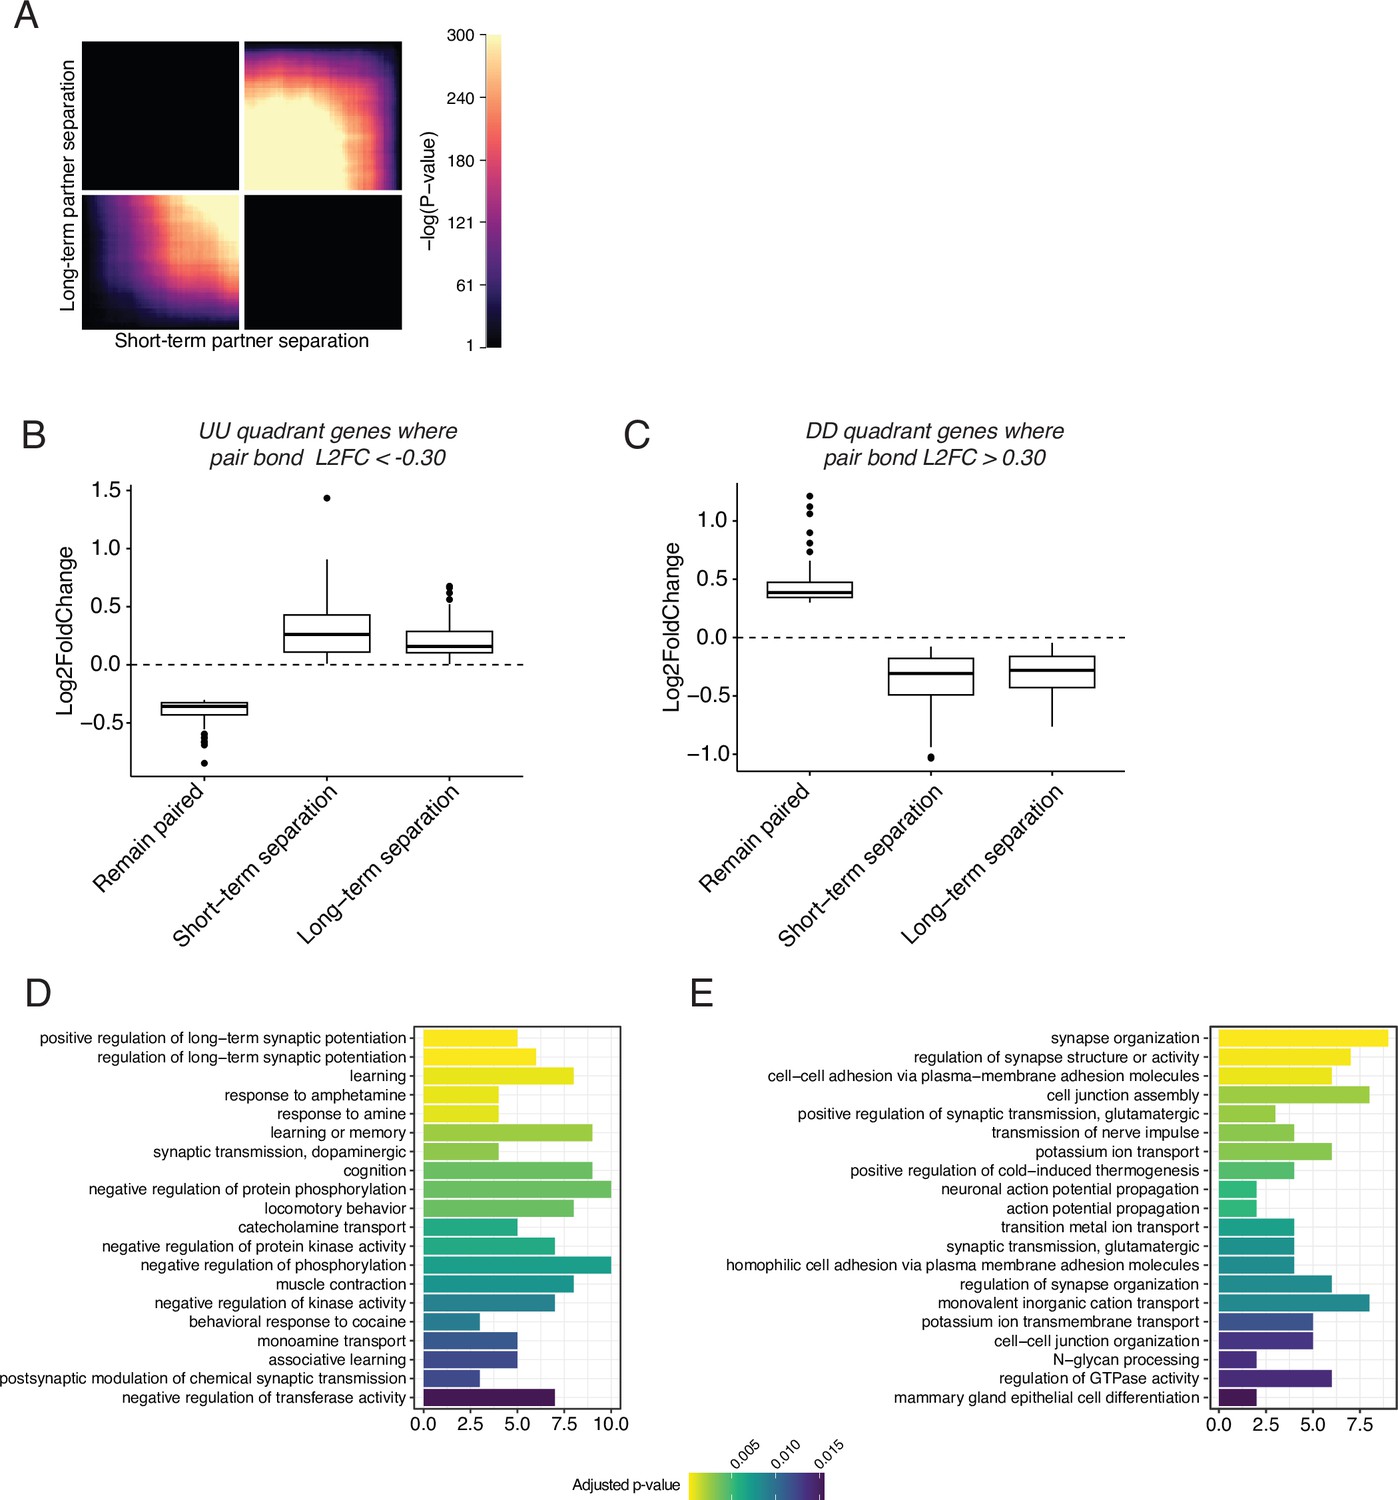
RRHO of short-term vs long-term partner separation reveals a transcriptional signature of partner loss.
(A) RRHO comparing short-term and long-term partner loss. Heatmap indicates that genes that are downregulated after short-term separation remain downregulated after long-term partner separation. (B, C) Gene lists were extracted from the UU and DD quadrants and used to filter the combined pair bond differential expression data of Figure 2. (B) The UU quadrant genes that had a L2FC <–0.30 in the combined pair bond were plotted for their expression in males that stayed with their partner or were separated for 48 hours or 4 weeks. (C) The DD quadrant genes that had a L2FC >0.30 in the combined pair bond were plotted for their expression in males that stayed with their partner or were separated for 48 hr or 4 weeks. (D, E) GO analysis using Mus musculus ontology terms for the UU quadrant filtered genes used in B (D) or the DD quadrant filtered genes used in C (E).
Figure 4 with 2 supplements
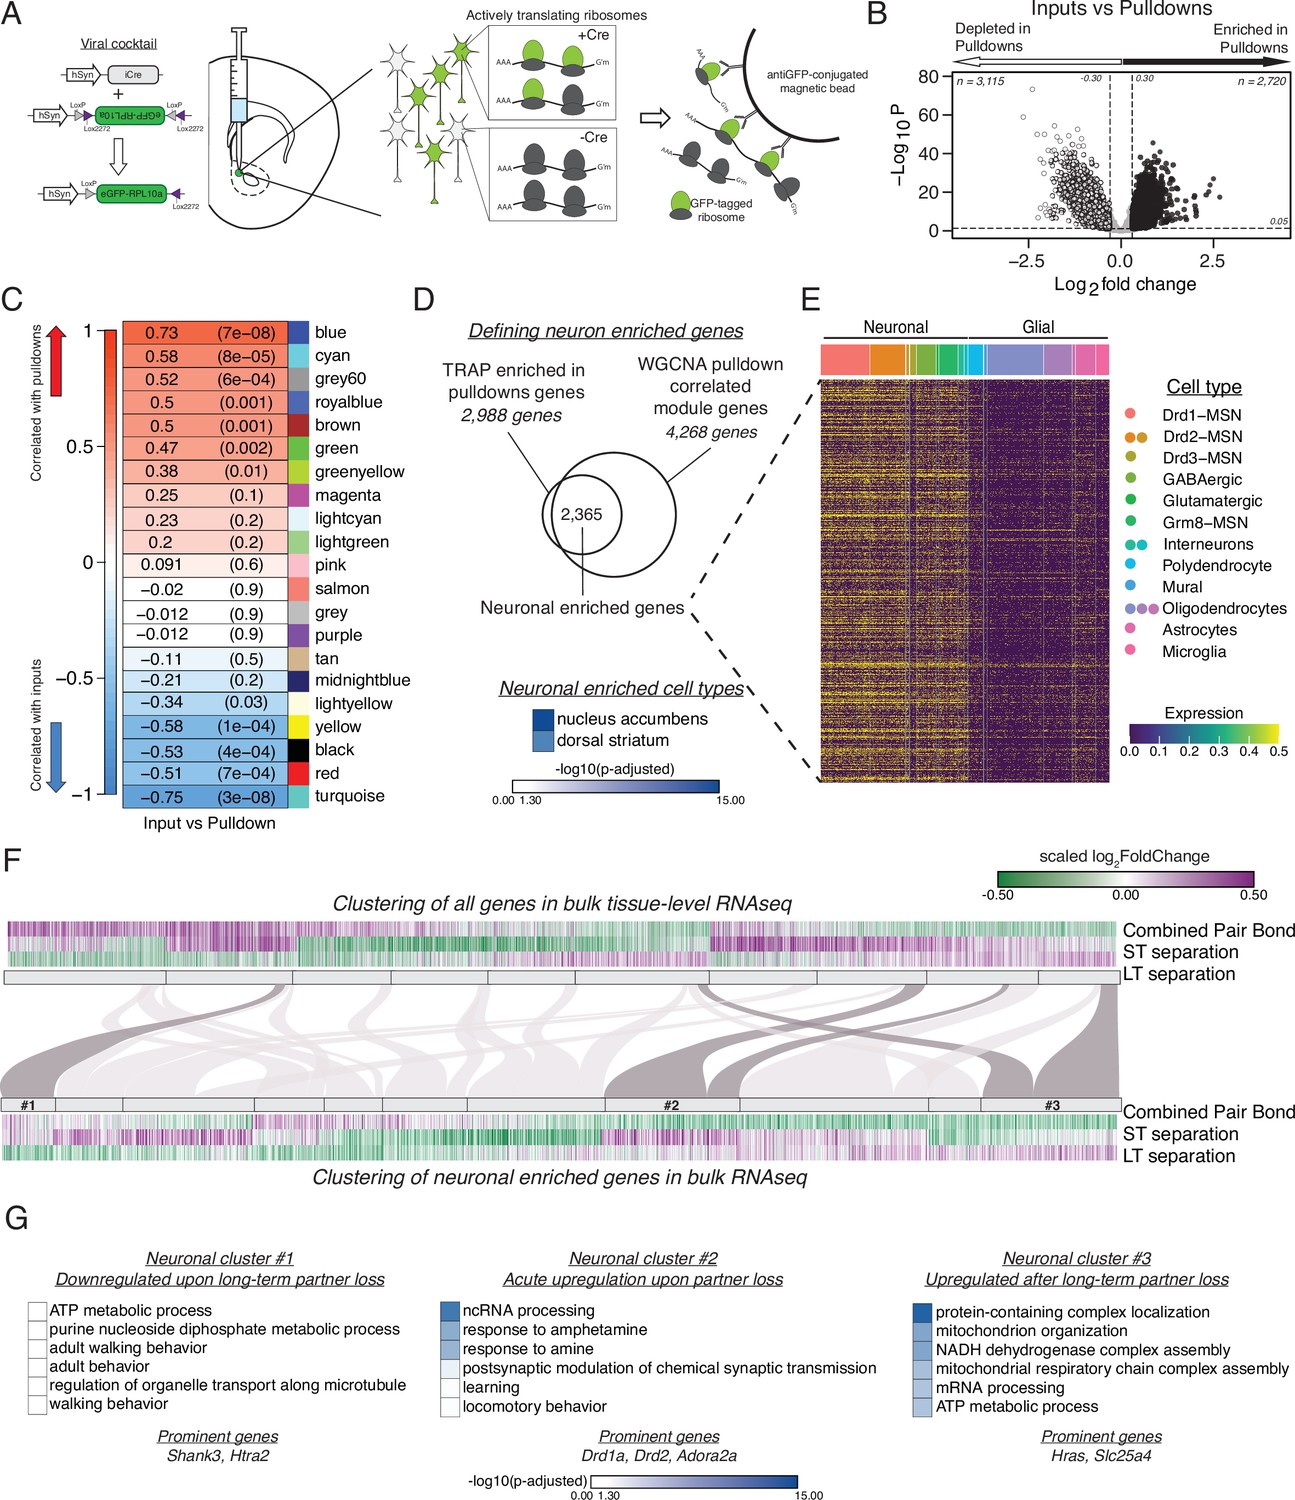
vTRAP elucidates separation-induced transcriptional changes specifically in neurons.
(A) Schematic of the vTRAP system. AAV-mediated delivery of hSyn-Cre, which drives neuron-specific Cre-recombinase expression, and DIO-vTRAP vectors results in neuronal expression of GFP-tagged ribosomes. Subsequent immunoprecipitation of the tagged ribosomes isolates neuron-specific, actively-translating mRNAs. (B) Transcripts enriched in the immunoprecipitation pulldowns compared to the input fractions. Differential expression skews towards depletion. (C) WGCNA to identify gene modules correlated with the input (negative correlation) or pulldown (positive correlation) fractions. The grey60 module contains neuronal transcripts of interest such as Drd1a, Fosb, Oprk1, and Pdyn while the blue module contains Drd2. (D) Neuronal enriched genes—2,365 genes—were defined as the intersection of the Input v Pulldown enriched DEGs and the WGCNA pulldown-correlated modules (modules grey60, blue, greenyellow, brown, green, royalblue, and cyan). When using Enrichr to search for cell types associated with the neuronal enriched gene list, nucleus accumbens is the most prominent and is highly significant followed by dorsal striatum. Scale represents –log10(p-adjusted). (E) Heatmap showing expression of identified neuronally enriched genes in a single-nuclei RNAseq dataset from the nucleus accumbens of adult male rats. The scale indicates expression of each gene in the snRNAseq dataset. (F) Hierarchical clustering using one minus Pearson correlation with complete linkage of bulk tissue-level sequencing for all genes (top heatmap) and neuronal enriched genes (bottom heatmap) for the combined pair bond, short-term separation, and long-term separation. The scale indicates scaled log2FoldChange. The mapping of neuronal clusters to the all genes clusters is visualized via a Sankey plot. Neuronal clusters of interest are highlighted by dark grey links. (G) Gene Ontology analysis using mouse terms for each neuronal cluster of interest. Genes of interest that occur in multiple terms are referred to as prominent genes. Scale represents –log10(p-adjusted).
Figure 4—figure supplement 1
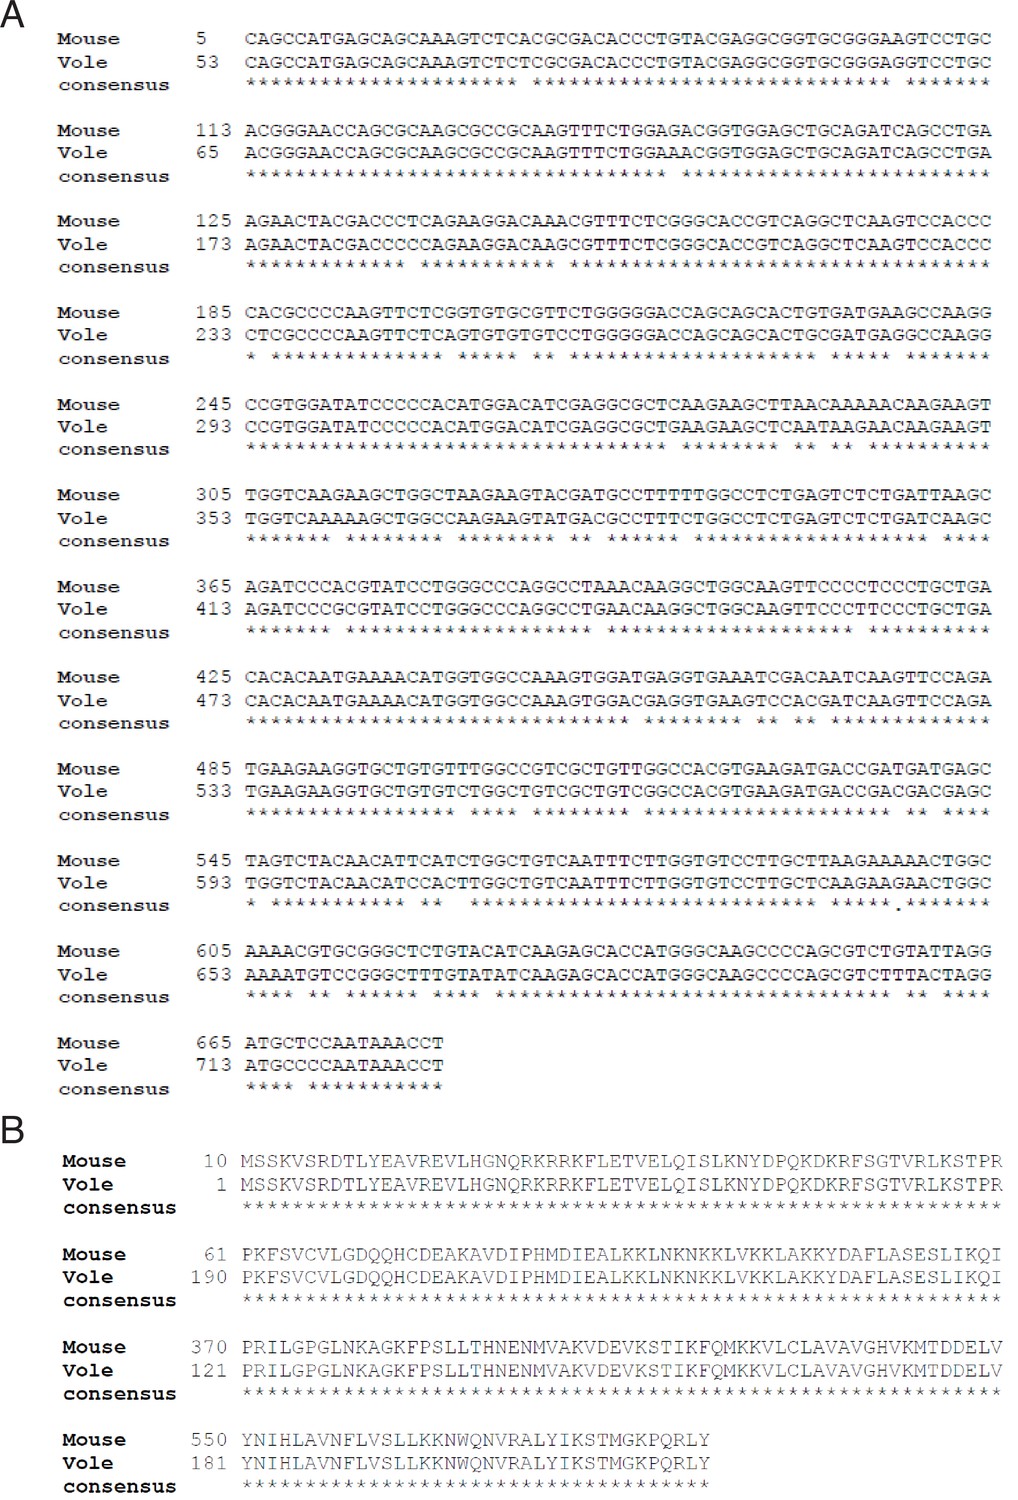
Alignment of mouse (Mus musculus) and prairie vole (Microtus ochrogaster) ribosomal protein L10a (RPL10a) cDNA sequences and amino acid sequences.
(A) The mouse RPL10a mRNA sequence (GenBank BC083346.1) was aligned to the prairie vole RPL10a cDNA sequence (XP_005360358.1) using BLASTN 2.8.0+33. Asterisks indicate matching nucleotides. The mouse and vole cDNA sequences are 93% identical, with an expected value of 0.0. (B) The mouse RPL10a amino acid sequence was deduced from the mouse RPL10a cDNA sequence (GenBank BC083346.1) and aligned to the prairie vole RPL10a amino acid sequence (XP_005360415.1) using BLASTX 2.8.0+33. Asterisks indicate matching amino acids. The mouse and vole amino acid sequences are 100% identical, with an expected value of 3 X 10-145.
Figure 4—figure supplement 2
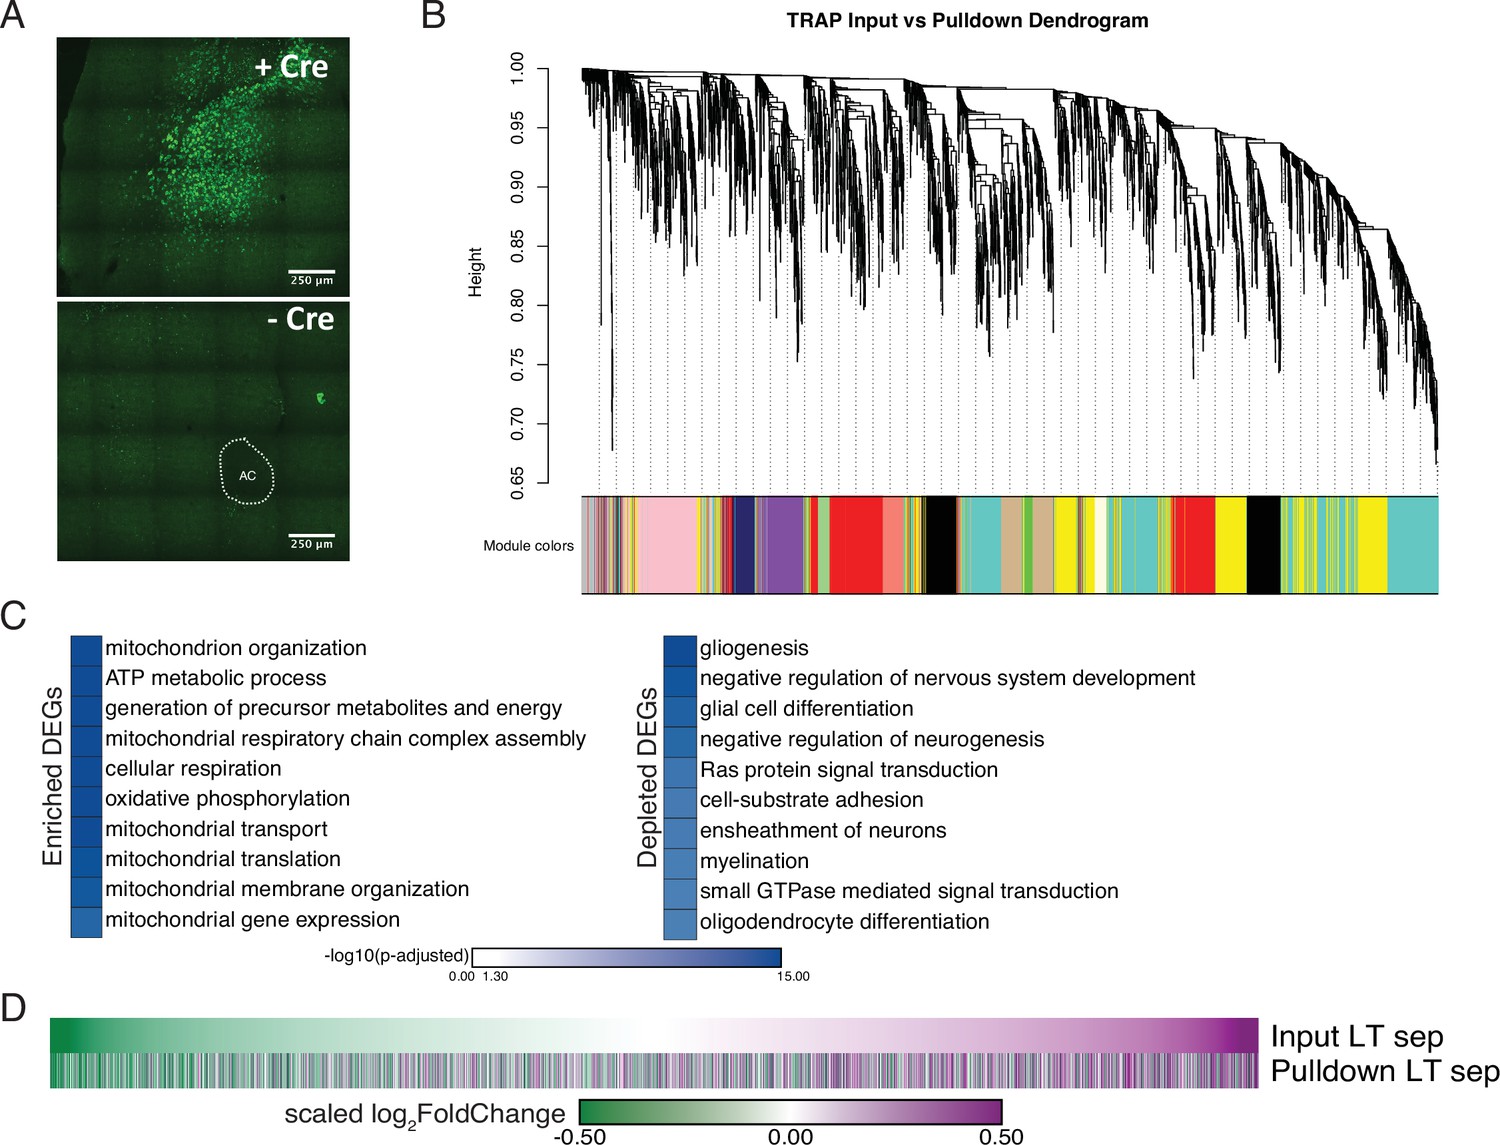
Validation of expression and analyses for vole optimized Translating Ribosome Affinity Purification.
(A) Vole optimized GFP-RPL10a vector is Cre-dependent as confirmed by bilateral NAc injections +/- Cre. ac = anterior commissure. (B) The input and pulldown samples from vTRAP cohorts were used to construct gene co-expression networks using WGCNA. The resulting co-expression networks are clustered in a dendrogram and each gene module is assigned a unique color. (C) Gene Ontology analysis using mouse ontology terms indicates that transcripts associated with the mitochondria and cellular respiration are enriched while transcripts associated with gliogenesis and myelination are depleted, supporting neuronal targeting of RPL10-GFP. (D) The neuronal enriched genes from Figure 4E were used to filter the input and pulldown samples of the opposite-sex 4-week separated cohort. The high correspondence in the scaled log2FoldChange of the Morpheus heatmaps validates that, for neuronal enriched genes, their expression in bulk sequencing is largely representative of their expression in neurons.
Additional files
-
Supplementary file 1
Comprehensive statistical analyses and individual animal information.
10.6084/m9.figshare.19911541. Statistical analyses for behavior and transcription experiments including applicable post-hocs and version numbers of analysis packages used. Also includes relevant metrics for all experimental animals including information about excluded animals.
- https://cdn.elifesciences.org/articles/80517/elife-80517-supp1-v4.xlsx
-
Supplementary file 2
DESeq, RRHO, and Fisher’s Exact Test intersection gene lists.
10.6084/m9.figshare.19911577. Workbook includes all gene lists used in analysis. For DESeq, all results dataframes and differentially expressed genes are included with all output metrics. RRHO tabs include genes in each list used to generate heatmaps and overlapping genes for each quadrant as well as genes in the Fisher’s Exact Test intersections. Descriptions of all column names, the associated figure, and versions of packages used are in the last three tabs.
- https://cdn.elifesciences.org/articles/80517/elife-80517-supp2-v4.xlsx
-
Supplementary file 3
Ingenuity Pathway Analysis data.
10.6084/m9.figshare.19911583. Comprehensive output from IPA analyses for both Canonical Pathways and Upstream Regulators. Includes all terms with those that are statistically significant highlighted in red.
- https://cdn.elifesciences.org/articles/80517/elife-80517-supp3-v4.xlsx
-
MDAR checklist
- https://cdn.elifesciences.org/articles/80517/elife-80517-mdarchecklist1-v4.docx
Download links
A two-part list of links to download the article, or parts of the article, in various formats.
Downloads (link to download the article as PDF)
Open citations (links to open the citations from this article in various online reference manager services)
Cite this article (links to download the citations from this article in formats compatible with various reference manager tools)
Prolonged partner separation erodes nucleus accumbens transcriptional signatures of pair bonding in male prairie voles
eLife 12:e80517.
https://doi.org/10.7554/eLife.80517


