Tissue-specific modifier alleles determine Mertk loss-of-function traits
- Department of Immunobiology, Yale School of Medicine, United States
- Department of Cell Biology, Center for Cellular and Molecular Imaging, Yale School of Medicine, United States
- Celldex Therapeutics, United States
- Department of Molecular Biophysics and Biochemistry, W. M. Keck Foundation Biotechnology Resource Laboratory, School of Medicine, Yale University, United States
- Center on Endocrinology and Metabolism, Yale Genome Editing Center, School of Medicine, Yale University, United States
- Departments of Dermatology, Pathology and Immunobiology, Yale School of Medicine, United States
- Center for Cancer, Genetic Diseases and Gene Regulation, Department of Biological Sciences, Fordham University, United States
- Departments of Neurology and Pathology and Cell Biology, Institute for Cancer Genetics, Columbia Medical Center, United States
- Departments of Pediatrics and Pathology and Cell Biology, Institute for Cancer Genetics, Columbia University, United States
- Departments of Immunobiology and Pharmacology, Yale School of Medicine, United States
- Departments of Neurology and Pharmacology, Yale School of Medicine, United States
Figures
Figure 1 with 1 supplement

Generation of B6 embryonic stem (ES) cell-derived mice with genetic ablation of Mertk.
(A) Schematic showing the differences in approach between the generation of Mertk -/-V1 mice by targeting Mertk in 129P2/OlaHsd (129P2)-derived ES cells by Camenisch et al. and our Mertk knockout mouse lines. 129P2 ES cells were microinjected into C57BL/6 (B6) blastocysts to generate chimeric mice with germline transmission of deleted Mertk allele by Camenisch et al. Chimeric mice were subsequently backcrossed onto B6 mice for >10 generations in our laboratory to obtain Mertk -/-V1 mice. Our two independent Mertk knockout mouse lines, Mertk -/-V2 and Mertk -/-V3 mice, were generated by targeting Mertk in B6 ES cells. Red stars indicate at least one copy of the mutant allele of Mertk. (B) Schematic indicating Mertk -/-V1 mice have deletion of exon 17 that encodes for the kinase domain of Mertk. A neomycin cassette is also present at this site. Mertk -/-V2 mice have targeted excision of exon 18, which also encodes for residues in the kinase domain. Mertk -/-V3 mice have exons 3 and 4 targeted with CRISPR/Cas9 approach. (C, D) Representative and quantification of independent MERTK Western blot data depicting total MERTK protein expression in spleen, brain, testis, retinal pigment epithelia (RPE), and peritoneal cavity cells (PerC) from C57BL/6, Mertk -/-V1, Mertk -/-V2, and Mertk -/-V3 mice (mean ± SEM of n = 3–4 mice/genotype). **p<0.01. ***p<0.001, ****p<0.0001, one-way ANOVA Dunnett’s test. Source files for the representative Western blot images (C) and the corresponding quantitative analysis (D) performed are available in Figure 1—source data 1. Supporting data for (B) is available in Figure 1—figure supplement 1A–C.
-
Figure 1—source data 1
Independent datasets and unmodified images for blots shown in Figure 1.
- https://cdn.elifesciences.org/articles/80530/elife-80530-fig1-data1-v2.zip
Figure 1—figure supplement 1
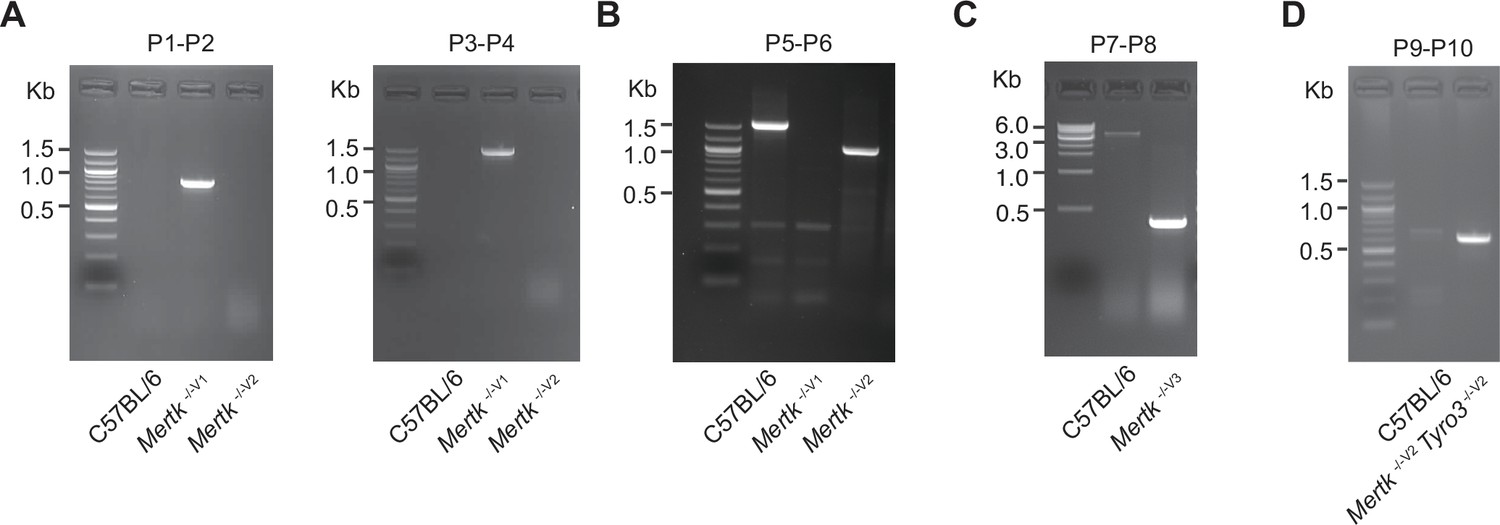
PCR genotyping of mouse lines targeting Mertk (including a mouse line with the simultaneous ablation of Mertk and Tyro3).
(A) PCR amplification of genomic DNA (gDNA) from Mertk -/-V1 mice using primers P1–P2 and P3–P4. Binding sites for primers P1–P2 and P3–P4 are indicated in Figure 1B. (B) Excision of targeted allele in Mertk -/-V2 mice was confirmed using primers P5–P6. Binding sites for primers P5–P6 are indicated in Figure 1B. (C) PCR amplification of gDNA from Mertk -/-V3 mice, using primers P7–P8, confirming excision. Binding sites for primers P7–P8 are indicated in Figure 1B. (D) PCR amplification of genomic DNA from Mertk -/-V2 Tyro3 -/-V2 mice, using primers P9–P10, confirming excision. Binding sites for primers P9–P10 are indicated in Figure 5C. Source files for all gel images shown are available in .
-
Figure 1—figure supplement 1—source data 1
Unmodified images for PCR genotyping results shown in Figure 1—figure supplement 1.
- https://cdn.elifesciences.org/articles/80530/elife-80530-fig1-figsupp1-data1-v2.zip
Figure 2
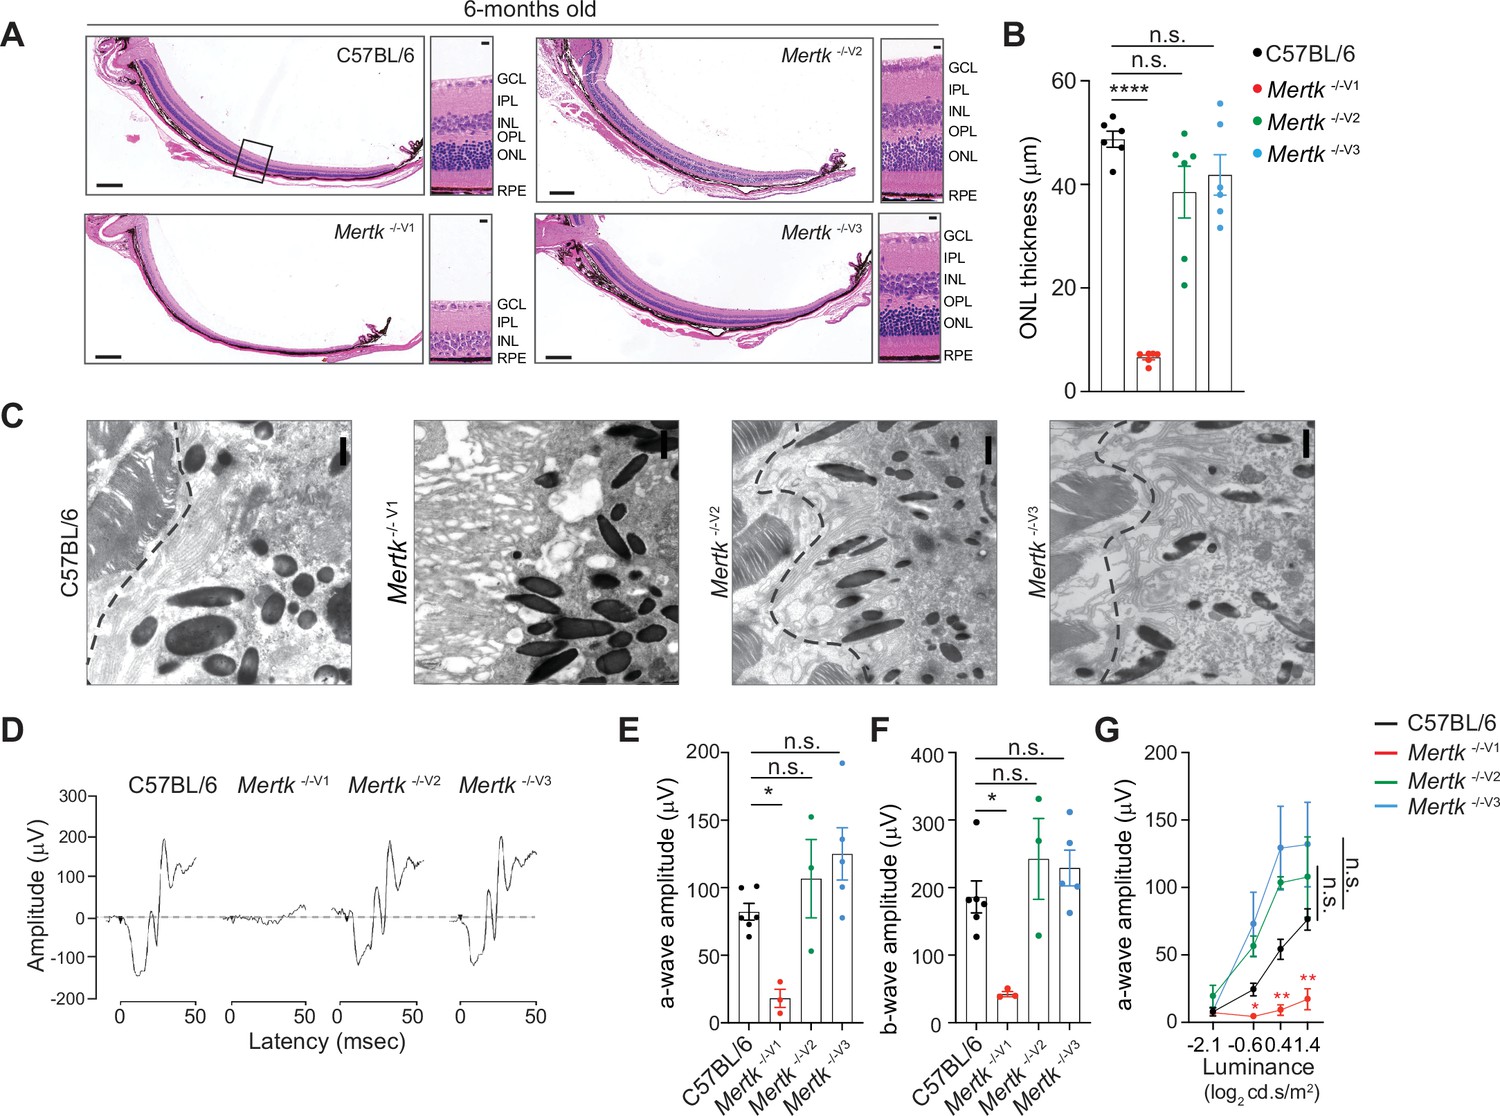
Retinal degeneration of Mertk -/-V1 mice is not phenocopied by Mertk -/-V2 and Mertk -/-V3 mice.
Morphological and functional changes in the eye were assessed in 6-month-old C57BL/6, Mertk -/-V1, Mertk -/- V2, and Mertk -/-V3 mice. (A) Representative hematoxylin-eosin-stained transverse sections of the retina. Boxed section is shown as inset and indicates the area quantified in (B). Scale bars = 200 mm (left panels) and 10 mm (insets). (B) Quantification of outer nuclear layer (ONL) thickness in the area indicated in (A) (mean ± SEM of 10 measurements/mouse, n = 6 mice/genotype). ****p<0.0001, one-way ANOVA Dunnett’s test. (C) Ultrastructure at the photoreceptor outer segment–retinal pigment epithelia (POS–RPE) interface (dashed line) by transmission electron microscopy. Scale bars = 1 mm. (D) Representative scotopic electroretinogram traces are shown at the highest luminance tested. (E) Quantification of a-wave amplitude at highest luminance tested (25 cd.s/m2) (mean ± SEM of n = 3–6 mice/ genotype). *p<0.05, one-way ANOVA Dunnett’s test. (F) Quantification of b-wave amplitude at the highest luminance tested (25 cd.s/m2) (mean ± SEM of n = 3–6 mice/ genotype). *p<0.05, one-way ANOVA Dunnett’s test. (G) a-wave amplitude at increasing luminance (mean ± SEM of n = 3–6 mice/ genotype). *p<0.05, **p<0.01, two-way ANOVA. Source files for (B) ONL thickness, (E) a-wave amplitude, (F) b-wave amplitude, and (G) a-wave amplitude at increasing luminance are available in Figure 2—source data 1. GCL,-ganglion cell layer; IPL, inner plexiform layer; INL, inner nuclear layer; OPL, outer plexiform layer.
-
Figure 2—source data 1
Quantification of ONL thickness, a-wave and b-wave amplitude for data shown in Figure 2.
- https://cdn.elifesciences.org/articles/80530/elife-80530-fig2-data1-v2.xlsx
Figure 3 with 1 supplement
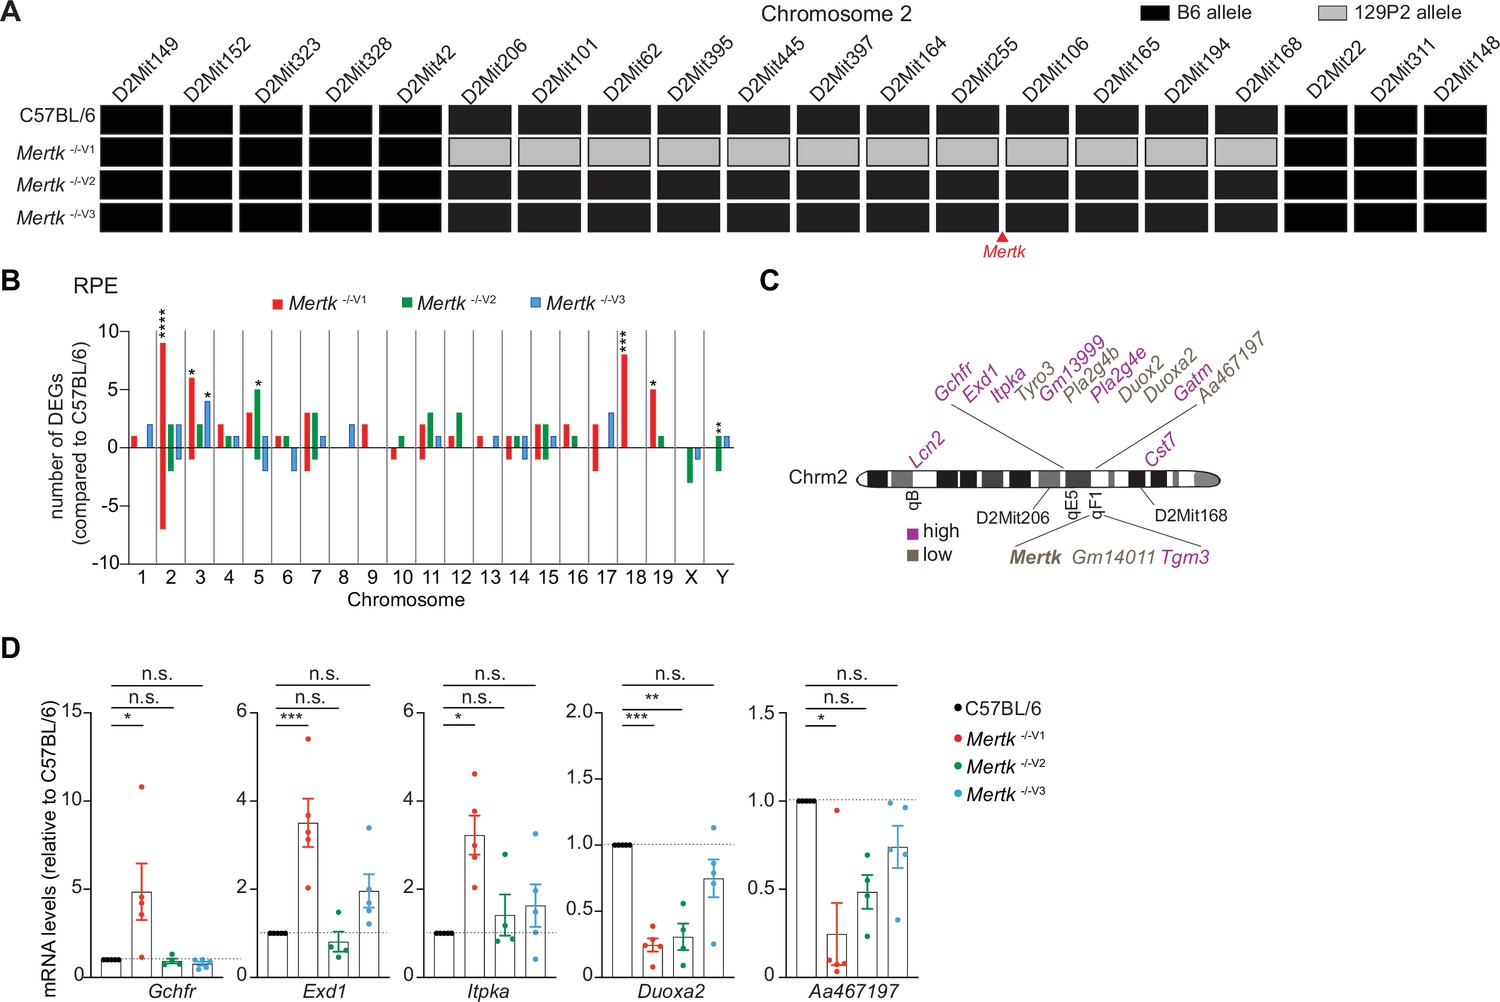
Significant gene expression differences in retinal pigment epithelia (RPE) of Mertk -/-V1 versus Mertk -/-V2 and Mertk -/-V3 mice.
(A) Haplotype map comparing 20 microsatellite markers across chromosome 2 in C57BL/6, Mertk -/-V1, Mertk -/-V2, and Mertk -/-V3 mice. Black rectangles indicate homozygosity for C57BL/6 (B6) alleles, and gray rectangles indicate homozygosity for 129P2/OlaHsd (129P2) alleles. (B) Distribution of differentially expressed genes (DEGs) in RPE across chromosomes (n = 3–6 samples/genotype). *p<0.05, **p<0.01, ***p<0.001, ****p<0.0001, hypergeometric test. (C) Schematic showing genes neighboring Mertk that are significantly upregulated or downregulated in the RPE of Mertk -/-V1 mice. (D) qPCR quantification of indicated chromosome 2 genes in C57BL/6, Mertk -/-V1, Mertk -/-V2, and Mertk -/-V3 RPEs (mean ± SEM, n = 4–5 samples/genotype). *p<0.05, **p<0.01, ***p<0.001, one-way ANOVA Dunnett’s test. Source files for the distribution of DEGs in RPEs across chromosomes (B) and qPCR quantification of various chromosome 2 genes (D) are available in Figure 3—source data 1. Supporting data for (A) is available in Figure 3—figure supplement 1.
-
Figure 3—source data 1
Independent datasets for qPCR quantifications shown in Figure 3D.
- https://cdn.elifesciences.org/articles/80530/elife-80530-fig3-data1-v2.xlsx
Figure 3—figure supplement 1
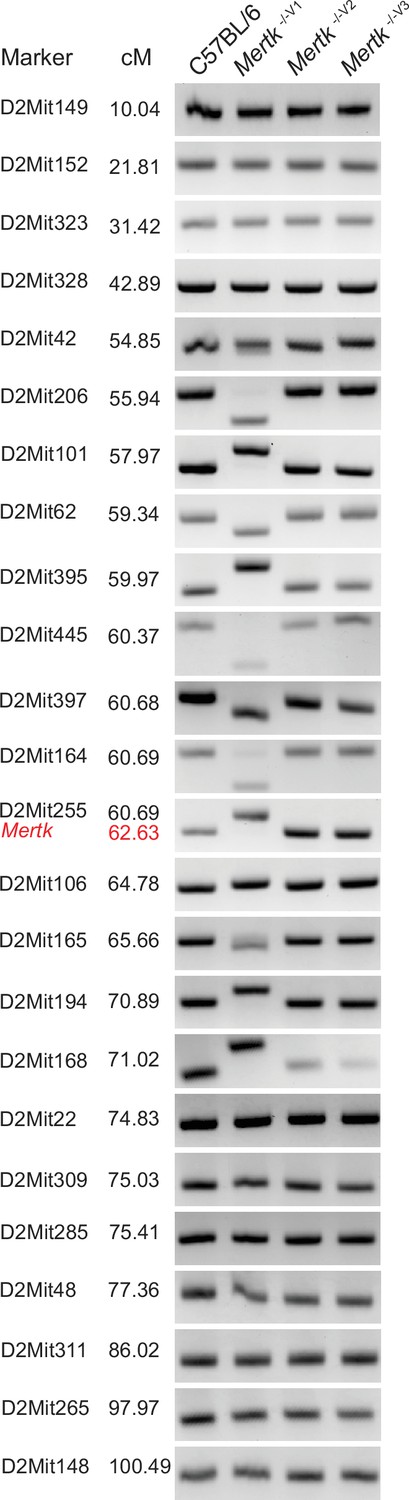
A 129P2-specific genomic interval is present in Mertk -/-V1 but not in Mertk -/-V2 and Mertk -/-V3 mice.
Representative PCR amplification products corresponding to 24 different microsatellite markers on chromosome 2 using genomic DNA extracted from C57BL/6, Mertk -/-V1, Mertk -/-V2, and Mertk -/-V3 mice. The presence of a 129P2/OlaHsd (129P2)-derived segment of DNA on chromosome 2 in Mertk -/- V1 mice was confirmed, at each microsatellite location shown, in at least three animals. Source files for the gel images shown are available in .
-
Figure 3—figure supplement 1—source data 1
Unmodified images for PCR genotyping results shown in Figure 3—figure supplement 1.
- https://cdn.elifesciences.org/articles/80530/elife-80530-fig3-figsupp1-data1-v2.zip
Figure 4
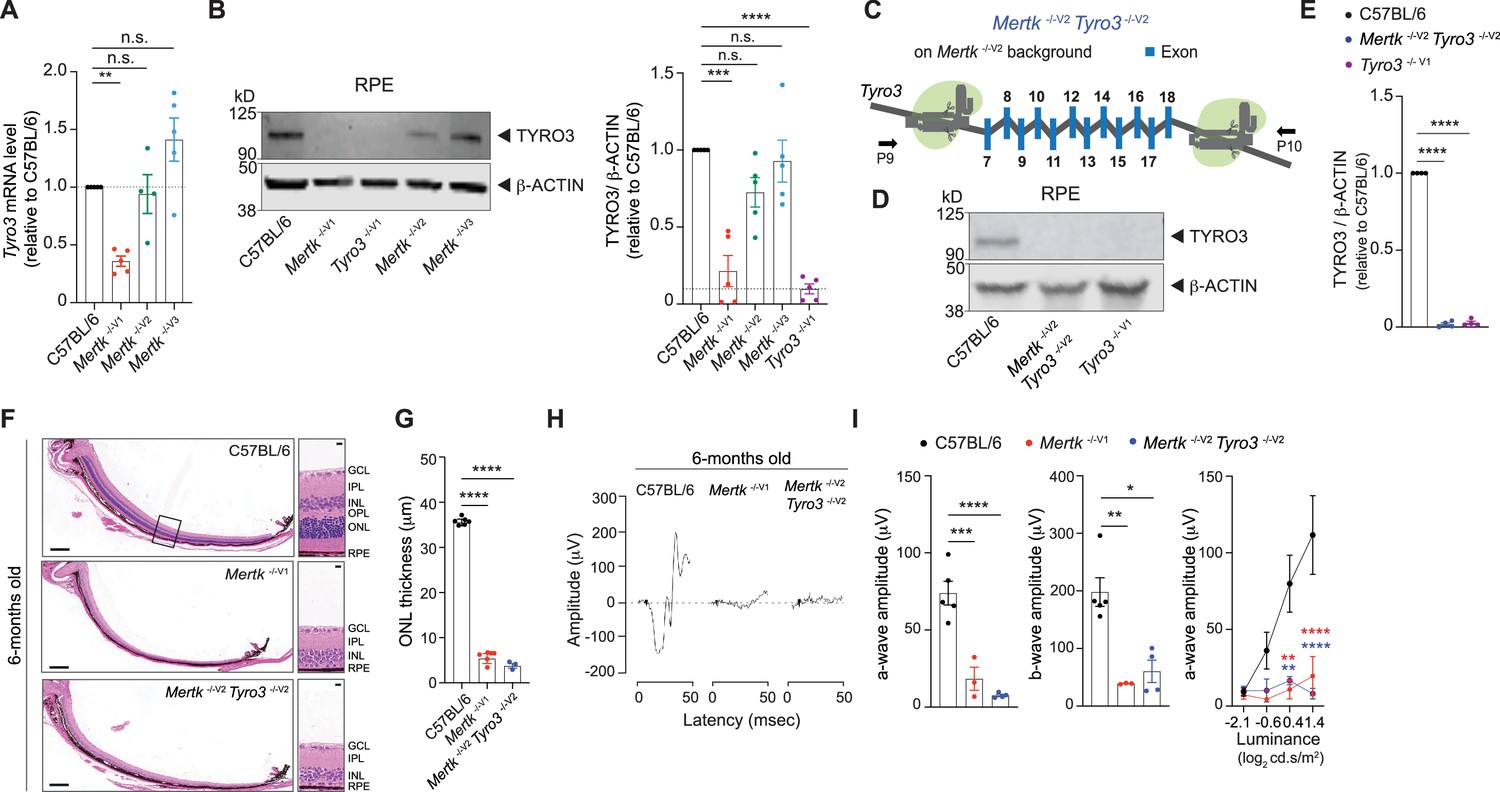
Tyro3 is epistatic with Mertk for the retinal degeneration trait.
(A) qPCR quantification of Tyro3 in C57BL/6, Mertk -/-V1, Mertk -/-V2, and Mertk -/-V3 retinal pigment epithelia (RPE) (mean ± SEM, n = 4–5 samples/genotype). **p<0.01, one-way ANOVA Dunnett’s test. (B) Representative and independent measurements of TYRO3 amounts in RPE. Western blot (WB) from C57BL/6, Mertk -/-V1, Mertk -/-V2, Mertk -/-V3, and Tyro3 -/-V1 mice RPE (mean ± SEM of n = 5 mice/ genotype). *p<0.05, **p<0.01, ***p<0.001, and ****p<0.0001, one-way ANOVA Dunnett’s test. (C) Schematic showing targeting of Tyro3 exons 7–18 with CRISPR/Cas9 in Mertk -/-V2 ES cells to generate the Mertk -/- V2 Tyro3 -/- V2 mouse line. Image not drawn to scale. (D, E) Representative and independent measurements of TYRO3 amounts in RPE. WB from C57BL/6, Mertk -/-V2 Tyro3 -/-V2, and Tyro3 -/-V1 mice RPE (mean ± SEM of n = 4 mice/ genotype). ****p<0.0001, one-way ANOVA Dunnett’s test. (F) Representative hematoxylin-eosin-stained transverse sections of the retina. Boxed section is shown as inset and indicates the areas quantified in (G). Scale bars = 200 mm (left panels) and 10 mm (insets). (G) Quantification of outer nuclear layer (ONL) thickness in the area indicated in (F) (mean ± SEM of 10 measurements/mouse, n = 3–6 mice/genotype). ****p<0.0001, one-way ANOVA Dunnett’s test. (H) Representative scotopic electroretinogram traces are shown at the highest luminance tested. (I) Quantification of a-wave amplitude and b-wave amplitude at highest luminance tested (mean ± SEM of n = 3–6 mice/genotype). *p<0.05, **p<0.01, ***p<0.001, ****p<0.0001, one-way ANOVA Dunnett’s test. a-wave amplitude at increasing luminances. **p<0.01, ****p<0.0001, two-way ANOVA. Morphological and functional changes in the eye were assessed in 6-month-old C57BL/6, Mertk -/-V1, and Mertk -/-V2 Tyro3 -/-V2 mice. Source files for (A) qPCR quantification of Tyro3, (B, E) quantification of TYRO3 levels, (G) ONL thickness, (I) a-wave amplitude, b-wave amplitude, and a-wave amplitude at increasing luminances are available in Figure 4—source data 1. Supporting data for (C) is available in Figure 1—figure supplement 1D. GCL, ganglion cell layer; IPL, inner plexiform layer; INL, inner nuclear layer; OPL,-outer plexiform layer.
-
Figure 4—source data 1
Independent datasets and unmodified images for results shown in Figure 4.
- https://cdn.elifesciences.org/articles/80530/elife-80530-fig4-data1-v2.zip
Figure 5 with 1 supplement
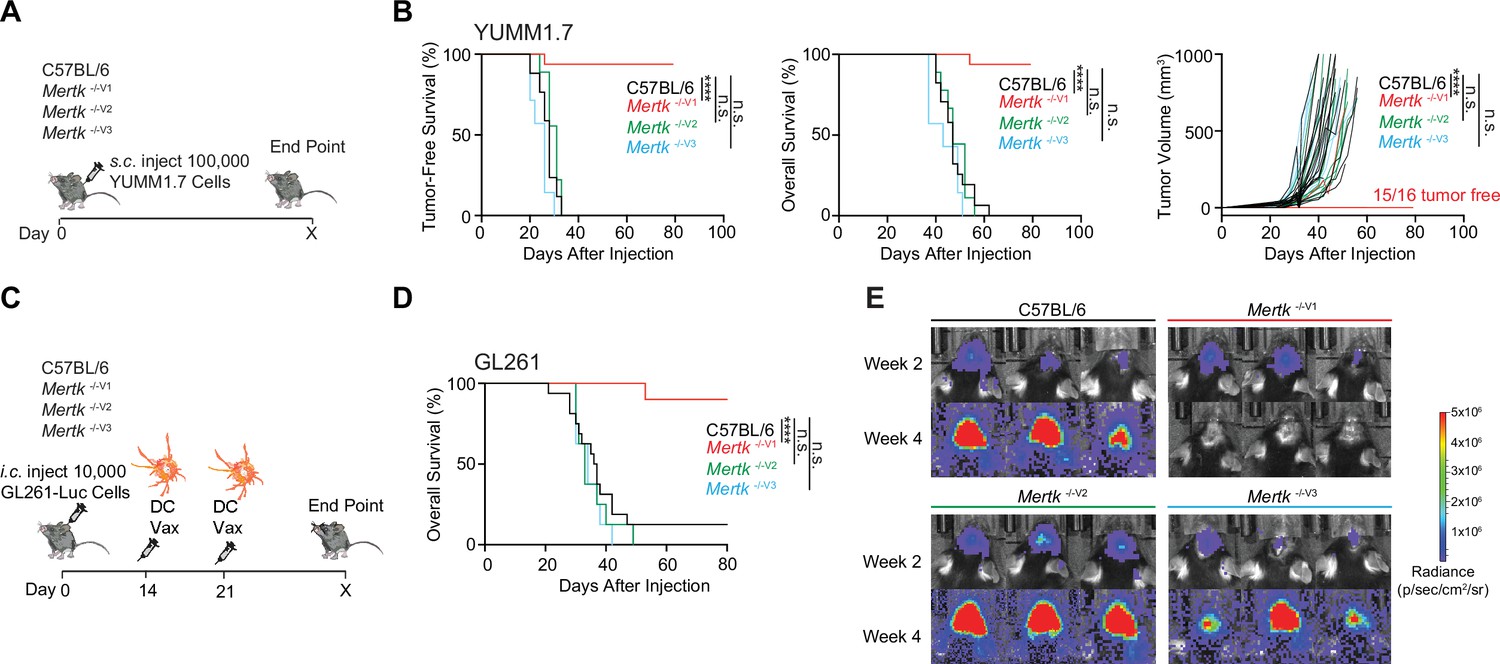
Anti-tumor response of Mertk -/-V1 mice is not phenocopied by Mertk -/-V2 and Mertk -/-V3 mice.
(A) Schematic showing subcutaneous injection of 100,000 Braf V600E Pten -/- YUMM1.7 mouse melanoma cells into mice of different genotypes. (B) Tumor-free survival (TFS), overall survival (OS), and tumor volume in C57BL/6 (n = 17), Mertk -/-V1 (n = 16), Mertk -/-V2 (n = 9), and Mertk -/-V3 (n = 7) mice implanted with YUMM1.7 cells. ****p<0.0001, Log-rank Mantel–Cox test or two-way ANOVA, Dunnett’s multiple-comparison test. (C) Schematic showing intracranial injection of 10,000 GL261-Luc glioma cells and intraperitoneal dendritic cell vaccination of mice at 14 and 21 days post-tumor implantation. (D) OS in C57BL/6 (n = 16), Mertk -/-V1 (n = 10), Mertk -/-V2 (n = 8), and Mertk -/- V3 (n = 8) mice implanted with GL261 tumors. ****p<0.0001, Log-rank Mantel–Cox test. (E) Representative IVIS images of intracranial tumors at D14 and D28 post-implantation. Source files for TFS (B) and OS (B, D) plots shown are available in Figure 5—source data 1. Supporting data relating to (C–E) is available in Figure 5—figure supplement 1.
-
Figure 5—source data 1
Tumor free survival dataset following implantation with YUMM1.7 melanoma cells shown in Figure 5.
- https://cdn.elifesciences.org/articles/80530/elife-80530-fig5-data1-v2.xlsx
-
Figure 5—source data 2
Overall survival dataset following implantation with GL261 glioblastoma cells shown in Figure 5.
- https://cdn.elifesciences.org/articles/80530/elife-80530-fig5-data2-v2.xlsx
Figure 5—figure supplement 1
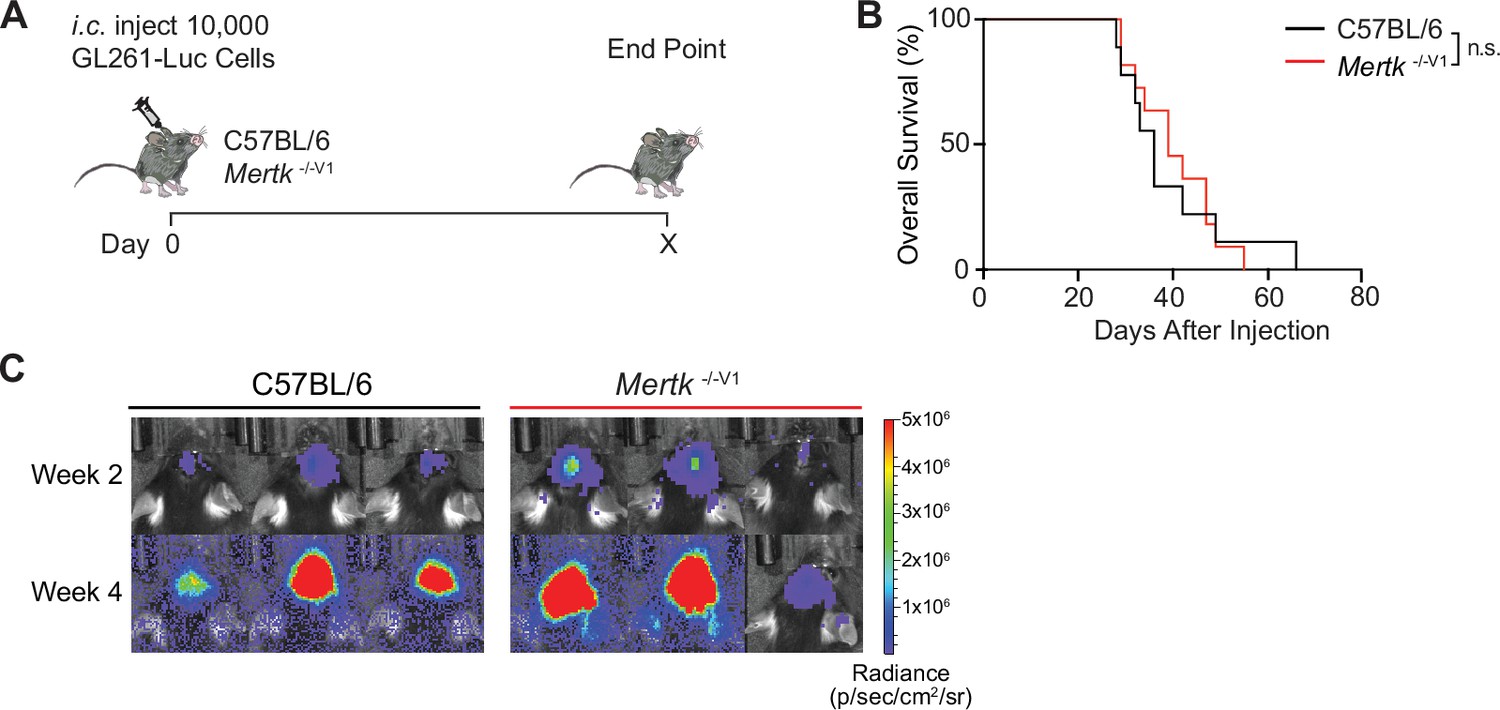
Unvaccinated Mertk -/- V1 mice are not protected against GL261 tumors.
(A) Schematic of intracranial injection of 10,000 GL261-Luc glioma cells in mice. (B) Overall survival (OS) in C57BL/6 (n = 9) and Mertk -/-V1 (n = 11) mice. n.s., Log-rank Mantel–Cox test. (C) Representative IVIS images of intracranial tumors in mice at D14 and D28 post-implantation. Source file for the OS plot (B) shown is available in Figure 5—source data 2.
Figure 6 with 1 supplement
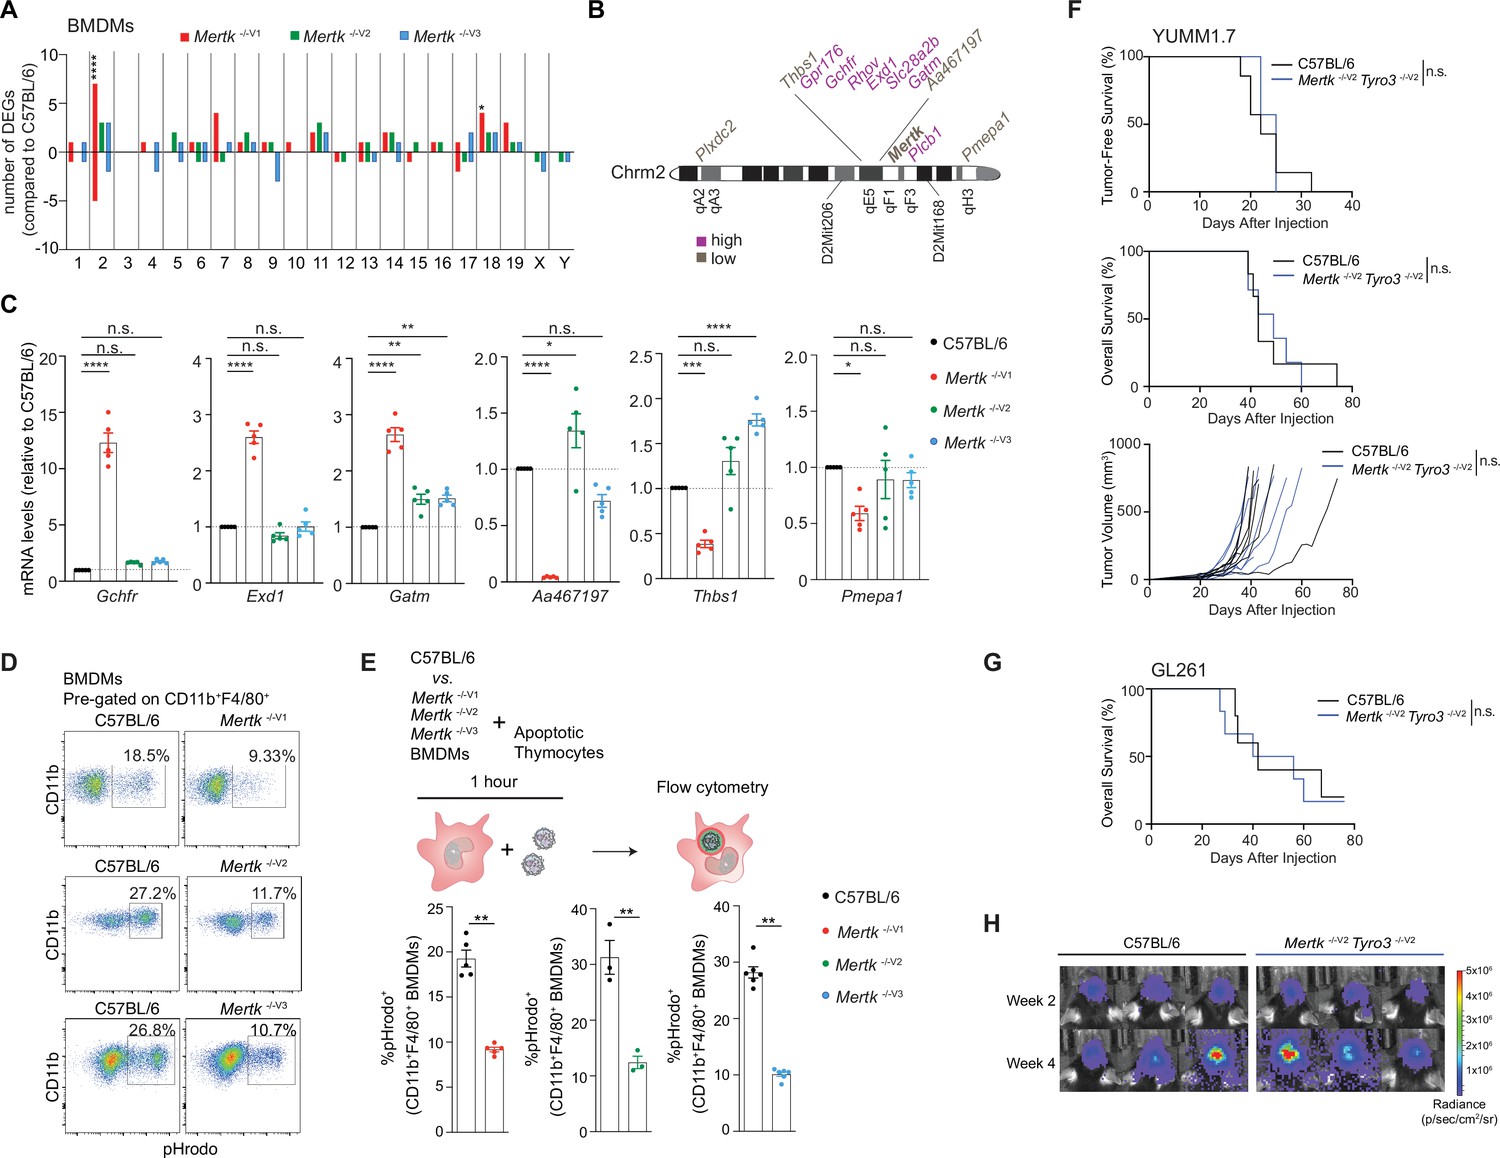
Anti-tumor response of Mertk -/-V1 mice is neither the result of deficient efferocytosis by macrophages nor hypomorphic TYRO3.
(A) Distribution of differentially expressed genes (DEGs) in bone marrow-derived macrophages (BMDMs) across chromosomes. (n = 3 samples/genotype). *p<0.05, ****p<0.0001, hypergeometric test. (B) Schematic indicating chromosome 2 genes that are upregulated or downregulated in Mertk -/-V1 BMDMs. (C) qPCR quantification of the indicated chromosome 2 genes in C57BL/6, Mertk -/-V1, Mertk -/-V2, and Mertk -/-V3 BMDMs (mean ± SEM, n = 5 samples/genotype). *p<0.05, **p<0.01, ***p<0.001, ****p<0.0001, one-way ANOVA Dunnett’s test. (D) BMDMs from C57BL/6, Mertk -/-V1, Mertk -/-V2, and Mertk -/-V3 mice were co-cultured with apoptotic thymocytes for 1 hr. Representative plots show uptake of pHrodo-labeled apoptotic thymocytes by CD11b+F4/80+ BMDMs by flow cytometry. (E) Quantification of (D) (mean ± SEM, n = 3–6 mice/group). **p<0.01, Mann–Whitney or Student’s t-test. (F) Tumor-free survival (TFS), overall survival (OS), and tumor volume in C57BL/6 (n = 7), Mertk -/-V1 (n = 7), and Mertk -/-V2 Tyro3 -/-V2 (n = 7) mice implanted with YUMM1.7 tumors. n.s., Log-rank Mantel–Cox test. (G) OS in C57BL/6 (n = 5) and Mertk -/-V2 Tyro3 -/-V2 (n = 6) mice implanted with GL261 tumors. n.s., Log-rank Mantel–Cox test. (H) Representative IVIS images of intracranial tumors in C57BL/6 and Mertk -/-V2 Tyro3 -/-V2 mice at D14 and D28 post-implantation. Source files for the distribution of DEGs in BMDMs across chromosomes (A), qPCR quantification of various chromosome 2 genes (C), quantification of percentage of pHrodo+ BMDMs (E), TFS (F), and OS (F, G) plots are available in Figure 6—source data 1. Supporting data for (D, E) is available in Figure 6—figure supplement 1.
-
Figure 6—source data 1
Independent datasets for qPCR quantifications and survival dataset following implantation with tumor models shown in Figure 6.
- https://cdn.elifesciences.org/articles/80530/elife-80530-fig6-data1-v2.xlsx
-
Figure 6—source data 2
Quantification of MERTK levels in bone-marrow-derived macrophages shown in Figure 6.
- https://cdn.elifesciences.org/articles/80530/elife-80530-fig6-data2-v2.xlsx
Figure 6—figure supplement 1
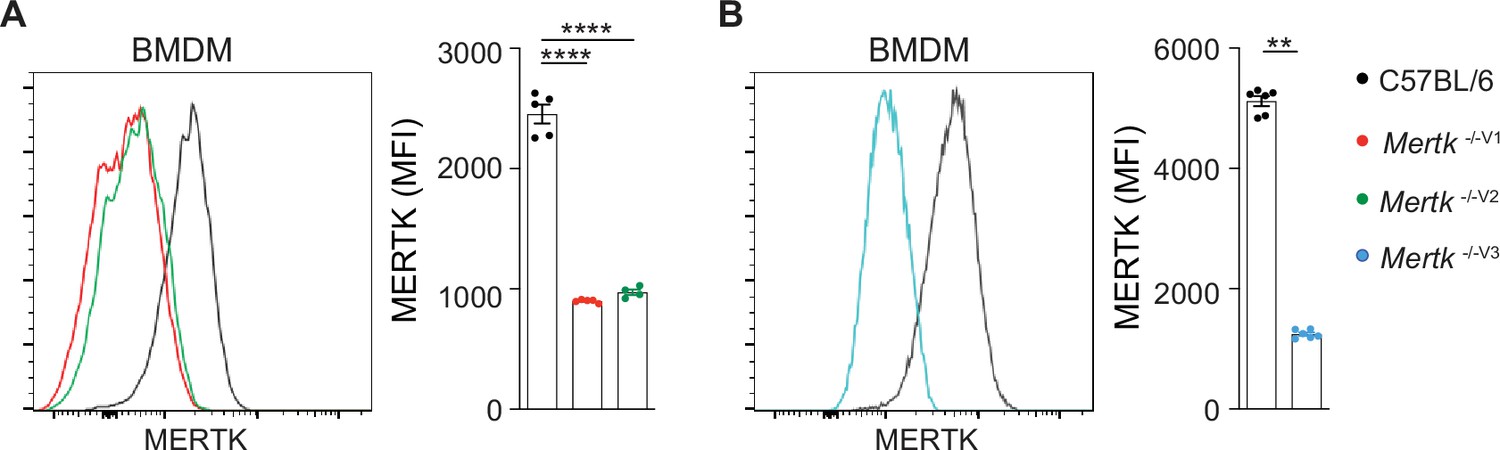
Significantly diminished MERTK expression in bone marrow-derived macrophages (BMDMs) isolated from Mertk knockout mice.
(A, B) Representative flow cytometry and independent quantification of MERTK levels in BMDMs from C57BL/6, Mertk -/-V1, Mertk -/-V2, and Mertk -/-V3 mice (mean ± SEM of n = 4–5 mice/genotype). ****p<0.0001, one-way ANOVA Dunnett’s test; **p<0.01, Mann–Whitney test. Source files for quantification of MERTK levels in BMDMs are available in Figure 6—source data 2.
Tables
Key resources table
| Reagent type (species) or resource | Designation | Source or reference | Identifiers | Additional information |
|---|---|---|---|---|
| Gene (Mus musculus) | Mertk | NCBI Gene ID | 17289 | |
| Gene (M. musculus) | Tyro3 | NCBI Gene ID | 22174 | |
| Strain, strain background (M. musculus, males and females) | C57BL/6J | The Jackson Laboratory | Strain# 000664 | |
| Genetic reagent (M. musculus) | Mertk -/-V1 | Lu et al., 1999 | Both males and females used | |
| Genetic reagent (M. musculus) | Mertk -/-V2 | This paper | See section ‘Animals’, both males and females used | |
| Genetic reagent (M. musculus) | Mertk -/-V3 | This paper | See section ‘Animals’, both males and females used | |
| Genetic reagent (M. musculus) | Tyro3 -/- | Lu et al., 1999 | Both males and females used | |
| Genetic reagent (M. musculus) | Mertk -/-V2 Tyro3 -/-V2 | This paper | See section ‘Animals’, both males and females used | |
| Biological sample (M. musculus) | Retinal pigment epithelial cells | This paper | Freshly isolated from indicated mouse strains, see ‘Materials and methods’ sections for various applications | |
| Biological sample (M. musculus) | Bone marrow-derived macrophages | This paper | Freshly isolated from indicated mouse strains, see ‘Materials and methods’ sections for various applications | |
| Antibody | Anti-MERTK (rabbit polyclonal) | Abcam | Cat# ab95925 | WB (1:1000) |
| Antibody | Anti-TYRO3 (rabbit monoclonal) | Cell Signaling Technology | Cat# 5585S | WB (1:1000) |
| Antibody | Anti-β-actin (rabbit monoclonal) | Cell Signaling Technology | Cat# 8457S | WB (1:10,000) |
| Antibody | Anti-β-actin (mouse monoclonal) | Cell Signaling Technology | Cat# 3700S | WB (1:10,000) |
| Antibody | Anti-rabbit IgG, IRDye800 (donkey polyclonal) | Li-COR Biosciences | Cat# 926-32213 | WB (1:15,000) |
| Antibody | Anti-mouse IgG, IRDye680 (donkey polyclonal) | Li-COR Biosciences | Cat# 926-68072 | WB (1:20,000) |
| Antibody | Anti-mouse CD16/32 (rat monoclonal) | BioLegend | Cat# 101302 | FC (1:1000) |
| Antibody | Anti-mouse CD11b (rat monoclonal) | BioLegend | Cat# 101222 | FC (1:200) |
| Antibody | Anti-mouse F4/80 (rat monoclonal) | BioLegend | Cat# 123114 | FC (1:200) |
| Antibody | Anti-mouse MERTK (rat monoclonal) | Invitrogen | Cat# 17-5751-82 | FC (1:200) |
| Chemical compound, drug | RNAprotect Cell Reagent | QIAGEN | Cat# 76526 | |
| Chemical compound, drug | Paraformaldehyde 16% | Electron Microscopy Sciences | Cat# 15710 | |
| Chemical compound, drug | Glutaraldehyde 25% | Electron Microscopy Sciences | Cat# 16200 | |
| Chemical compound, drug | Tropicamide ophthalmic Solution 0.5% | Sandoz | Cat# 61214-354-01 | |
| Chemical compound, drug | cOmplete Protease Inhibitor Cocktail | Roche | Cat# 11697498001 | |
| Chemical compound, drug | Eye Fixative | ServiceBio | Cat# G1109 | |
| Commercial assay, kit | RNeasy Plus Micro Kit | QIAGEN | Cat# 74034 | |
| Commercial assay, kit | iScript cDNA Synthesis Kit | Bio-Rad | Cat# 1708891 | |
| Commercial assay, kit | Mini-PROTEAN TGX Stain-Free Precast Gel | Bio-Rad | Cat# 4568025, 4568125 | |
| Commercial assay, kit | Immun-Blot PVDF membrane | Bio-Rad | Cat#1620177 | |
| Commercial assay, kit | Pierce BCA Protein Assay Kit | Thermo Scientific | Cat# 23227 | |
| Other | Hematoxylin-eosin staining | iHisto histopatholgy support | https://www.ihisto.io/ |
Appendix 1—table 1
Sequence-based reagents utilized in this article.
Single-guide (sgRNAs) and repair oligonucleotides that were used in CRISPR/Cas9-based generation of Mertk -/-V2Tyro3 -/-V2 mice are indicated. Primers (P1–10) utilized for PCR genotyping of mouse lines targeting Mertk and Tyro3, as shown in Figure 1—figure supplement 1, are included. Additionally, primers used for qPCR quantification of various genes are listed. Finally, primers used for genotyping various microsatellite markers on mouse chromosome 2 are indicated with a D2Mit-prefix.
| Oligonucleotide | Sequence |
|---|---|
| sgRNA#1 | GAAATTAATACGACTCACTATAGGGAGACTACACCTACAGAGAACAAGGTTTTAGAGCTAGAAATAGCAAGTTAAAATAAGGCTAGTCCGTTATCAACTTGAAAAAGTGGCACCGAGTCGGTGCTTTTTT |
| sgRNA#2 | GAAATTAATACGACTCACTATAGGGAGACCCAAGTGTCAGAATCCCAGGTTTTAGAGCTAGAAATAGCAAGTTAAAATAAGGCTAGTCCGTTATCAACTTGAAAAAGTGGCACCGAGTCGGTGCTTTTTT |
| Repair Oligo#1 | ATGAAGATCAATCACAGCTGATATTCCTCCCTCTTACATCCTGCTACTACACCTACAGAGAACAAGAGGAAGAGGAAGGCTAACAAACCCTGGCGAAGTTTGTCTGTCTGTCTGTTTGTTTGTTTG |
| Repair Oligo#2 | TTAGAGCTGAGAGGTACCCTAGACTTCAGATCCTCCTGCCACCACGCCCAAGTGTCAGAATCCCAGCGGTGTAGCACTTATGAGGTACTGGAGGTCATACCTGGGACTCTGTGCACACTGAGCAAG |
| P1 | GGGGCAGAGTACCTTGCTTT |
| P2 | CTGCGTGCAATCCATCTTGT |
| P3 | CTTTCGACCTGCAGCCAATATG |
| P4 | CCTCATCCCATATCAACACTGC |
| P5 | GCTCCAGCCCCTTTTACTTTTTGT |
| P6 | GATGTGCGATGTGATGGGAGGTAG |
| P7 | CTTAGAGACCAGGCAAGGTAGAAGCA |
| P8 | TCCTGAACACTCGCTGAATGCA |
| P9 | CAGGCCTGTGCTTTCTTTATGCTA |
| P10 | ACTGCTCTTCTGGGGGTTCTGA |
| Tyro3 F | TGCCATTCGTACCGACTCAG |
| Tyro3 R | TTTCTTGGACCCAGGACAGCTT |
| Gchfr F | CCACGCACCATGCCCTATCT |
| Gchfr R | GCTCCGGATCCGAGTGTTCA |
| Gatm F | TGCACTACATCGGCTCTCGG |
| Gatm R | CAGAGGATGGGTGGCCTTGT |
| Thbs1 F | GGGGAGATAACGGTGTGTTTG |
| Thbs1 R | CGGGGATCAGGTTGGCATT |
| Pmepa1 F | AGCATGGAGATCACGGAGCTG |
| Pmepa1 R | ACCGTACTCTCTGAGGGCCA |
| Exd1 F | TCCCAGCAGTGACTACCATTT |
| Exd1 R | CTCGTGCCCGAAGAACACTTT |
| Itpka F | CACGAAGCCGAGAGCAAGTG |
| Itpka R | TGAGCTGCCAATCACCTCGT |
| Duoxa2 F | CGTTAACATTACACTCCGAGGAACA |
| Duoxa2 R | CAGAATGCCACCCACAGTGT |
| Aa467197 F | GGAGCCACATCTTTCGCTTTG |
| Aa467197 R | CTCCTCAACGGGCTTCCATTG |
| Gapdh F | TCCCACTCTTCCACCTTCGA |
| Gapdh R | AGTTGGGATAGGGCCTCTCTT |
| Hprt F | AAGCTTGCTGGTGAAAAGGA |
| Hprt R | TTGCGCTCATCTTAGGCTTT |
| Rn18s F | GTAACCCGTTGAACCCCATT |
| Rn18s R | CCATCCAATCGGTACTAGCG |
| D2Mit149 F | ATATCATATAGTAGAGAAAGCGTGCTG |
| D2Mit149 R | TCATTAGACTTGGAAAAAAGTTTGC |
| D2Mit152 F | CACAGATCTTGTAAGACCACGTG |
| D2Mit152 R | TGCCATGAGTGTGGGACTAA |
| D2Mit323 F | AGAATCCTAAGTGGTGGTTAGAGG |
| D2Mit323 R | ACCCAAAGTTGTCTTTAAGTACACA |
| D2Mit328 F | CTTTCAATGTTCCGGCATG |
| D2Mit328 R | AAGACTTGCTTTCATTAGACCACA |
| D2Mit42 F | ATTACTGGGCAGGAACATTTG |
| D2Mit42 R | GCCAAACTTCCAGACTCCTC |
| D2Mit206 F | TGTCAGAACTGGACAATGTCG |
| D2Mit206 R | ATGATAACAGACACTAATGATTAGGGC |
| D2Mit101 F | ATAATTCCTGATTTGCTGTTTGTG |
| D2Mit101 R | ACATGAAGCCTAGAGGGTGC |
| D2Mit62 F | GGATACCGTTTGGAAAGTAAACC |
| D2Mit62 R | GCAAGAAGCACAGGAGGC |
| D2Mit395 F | AGGTCAGCCTGGACTATATGG |
| D2Mit395 R | AGCATCCATGGGATAATGGT |
| D2Mit445 F | CCTATACACGCACACACAGACA |
| D2Mit445 R | ATGCCCTGCTTGCTATTGTT |
| D2Mit397 F | TGATGAAGGTTCTTTTTCTCCC |
| D2Mit397 R | CCACAGTTGGTAATTATCTGGC |
| D2Mit164 F | TCTCTGCTAATTAAGTTGAAGAGTGC |
| D2Mit164 R | ACCAGTGTGTGTTTGTATGATGTG |
| D2Mit255 F | GCAAGTGTGATCTGGGTGC |
| D2Mit255 R | TGAGCACACTTACACTGTGGTG |
| D2Mit106 F | GAGGGTTGCCAAAGAGACTG |
| D2Mit106 R | CACCTCAGGGGAACATTGTG |
| D2Mit165 F | TTTGGTCTTTCTAACCTTTGCA |
| D2Mit165 R | AACAAAAACAAAACCAAAAAAACC |
| D2Mit194 F | TGGAATTCCAAAGTCAAGGG |
| D2Mit194 R | GGGAAGAATGGGGGAAGTTA |
| D2Mit168 F | CTCACAGACACTGCACTATTACACA |
| D2Mit168 R | TGTTCCTGCTATTGTTTTGGG |
| D2Mit22 F | GCTCCCTTTCCTCTTGAACC |
| D2Mit22 R | GGGCCCTTATTCTATCTCCC |
| D2Mit309 F | ACAAATGCCACTCTCACATCC |
| D2Mit309 R | TATTTCTCAGAGTCACTAGGAGTGATG |
| D2Mit285 F | TCAATCCCTGTCTGTGGTAGG |
| D2Mit285 R | TATGACACTTACAAGGTTTTTGGTG |
| D2Mit48 F | GCTCTGCAGAAGATGCTGC |
| D2Mit48 R | GCTGAGACGCAGAGTCGC |
| D2Mit311 F | ACAGGCAGCCTTCCCTTC |
| D2Mit311 R | TCTGTCCCGCTTCTGTTTCT |
| D2Mit265 F | AATAATAATCAAGGTTGTCATTGAACC |
| D2Mit265 R | TAGTCAAAATTCTTTTGTGTGTTGC |
| D2Mit148 F | GTTCTCTGATCTACGGGCATG |
| D2Mit148 R | TTCACTTCTACAAGTTCTACAAGTTCC |
Additional files
Download links
A two-part list of links to download the article, or parts of the article, in various formats.
Downloads (link to download the article as PDF)
Open citations (links to open the citations from this article in various online reference manager services)
Cite this article (links to download the citations from this article in formats compatible with various reference manager tools)
Tissue-specific modifier alleles determine Mertk loss-of-function traits
eLife 11:e80530.
https://doi.org/10.7554/eLife.80530


