Disrupting the ciliary gradient of active Arl3 affects rod photoreceptor nuclear migration
- Department of Ophthalmology and Visual Science, University of Michigan-Ann Arbor, United States
- Department of Mathematics, University of North Carolina at Chapel Hill, United States
- Department of Ophthalmology, Duke University, United States
- Department of Cell and Developmental Biology, University of Michigan–Ann Arbor, United States
Figures
Figure 1
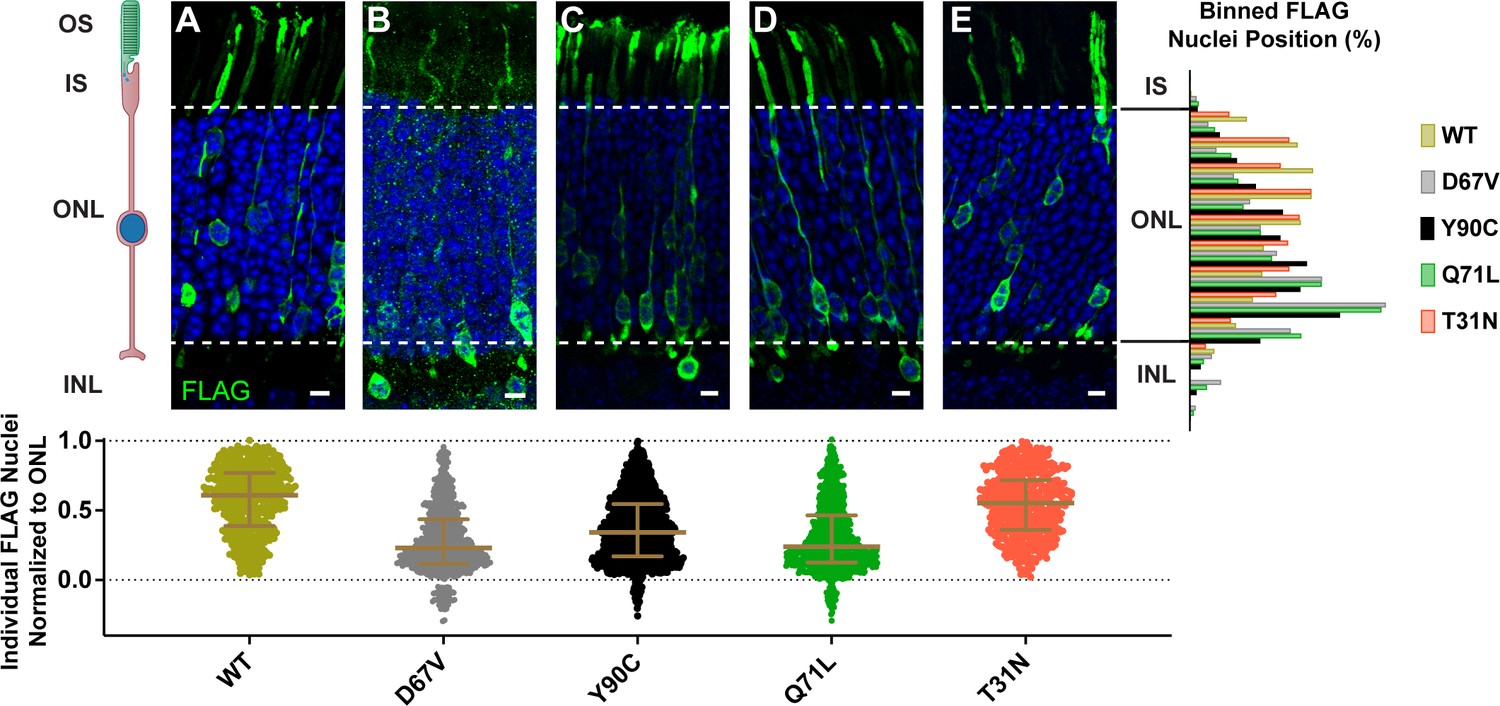
Expression of dominant Arl3 mutants in rod photoreceptors causes nuclear mislocalization.
Representative images showing cross-sections through wild-type mouse retinas electroporated with Arl3-3XFLAG (A), Arl3-D67V-FLAG (B), Arl3-Y90C-FLAG (C), Arl3-Q71L-FLAG (D), or Arl3-T31N-FLAG (E) and immunostained with anti-FLAG antibodies (green). Nuclei are counterstained with Hoechst (blue). Scale bars, 5 µm. Here and in all subsequent figures the nuclear position of electroporated rods is represented as follows: Below each image, a scatter plot shows the location of every Arl3-FLAG-expressing nuclei, normalized to its position within the ONL with the apical edge set to 1.0 and the basal edge set to 0.0 (dashed lines in the images and graphs). Median and interquartile range are indicated in brown. To the right, a histogram shows the relative distribution of the nuclear position for each construct with nuclei sorted into 10 ONL and 3 INL bins. A minimum of three expressing eyes were analyzed for each construct. Abbreviations: outer segments (OS), inner segments (IS), outer nuclear layer (ONL), and inner nuclear layer (INL).
Figure 2 with 2 supplements

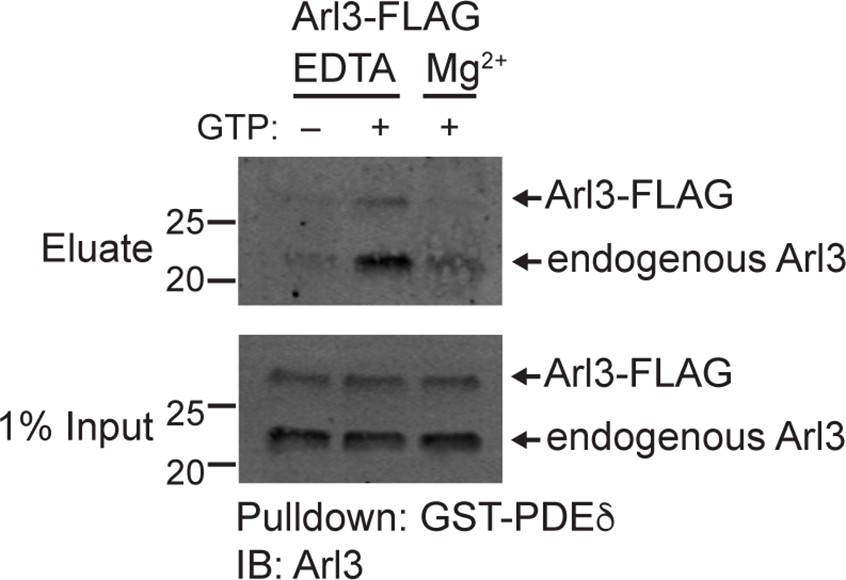
Arl3-Y90C is a fast cycling GTPase.
(A) 1% input (I) and eluates (E) from GST-PDEδ pulldowns using AD-293 lysates expressing 3XFLAG-tagged Arl3 mutants immunoblotted with anti-FLAG antibodies. (B) Arl3-Y90C-FLAG or Arl3-D129N-FLAG lysates were incubated with 10 mM ethylenediaminetetraacetic acid (EDTA) and/or 10 mM GTP, spiked with Mg2+, and precipitated with GST-PDEδ. Westerns immunoblotted for Arl3 with eluates shown on top, and 1% inputs shown below. Arl3-FLAG and endogenous Arl3 bands labeled. (C) Representative retinal cross-sections from Arl3-Y90C-FLAG- or Arl3-D129N-expressing rod photoreceptors stained with anti-FLAG antibodies (green) and counterstained with Hoechst (blue). Scale bars, 5 µm. Nuclear position of electroporated rods represented as described in Figure 1.
-
Figure 2—source data 1
Raw western blot images.
- https://cdn.elifesciences.org/articles/80533/elife-80533-fig2-data1-v2.zip
Figure 2—figure supplement 1
GTP loading of wild-type Arl3-FLAG.
Arl3-FLAG lysates were incubated with 10 mM EDTA and/or 10 mM GTP, spiked with Mg2+, and precipitated with GST-PDEδ. Westerns immunoblotted for Arl3 with eluates shown on top, and 1% inputs shown below. Arl3-FLAG and endogenous Arl3 bands labeled.
Figure 2—figure supplement 2
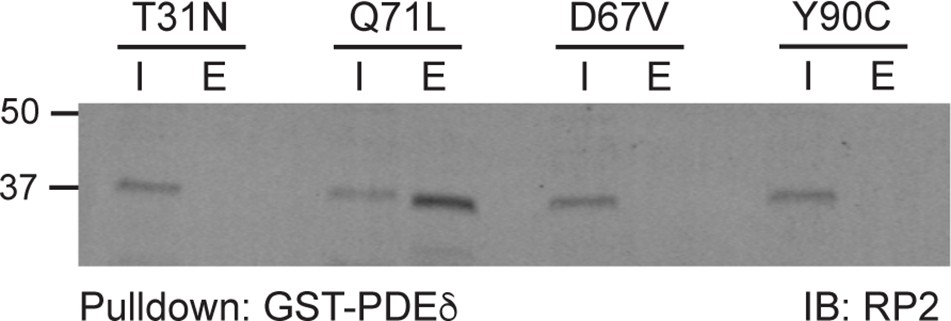
Unlike Arl3-Q71L, Arl3-D67V does not form a ternary complex with RP2 and PDEδ.
1% input (I) and eluates (E) from GST-PDEδ pulldowns using AD-293 lysates expressing 3XFLAG-tagged Arl3 mutants immunoblotted with anti-RP2 antibodies.
Figure 3 with 3 supplements
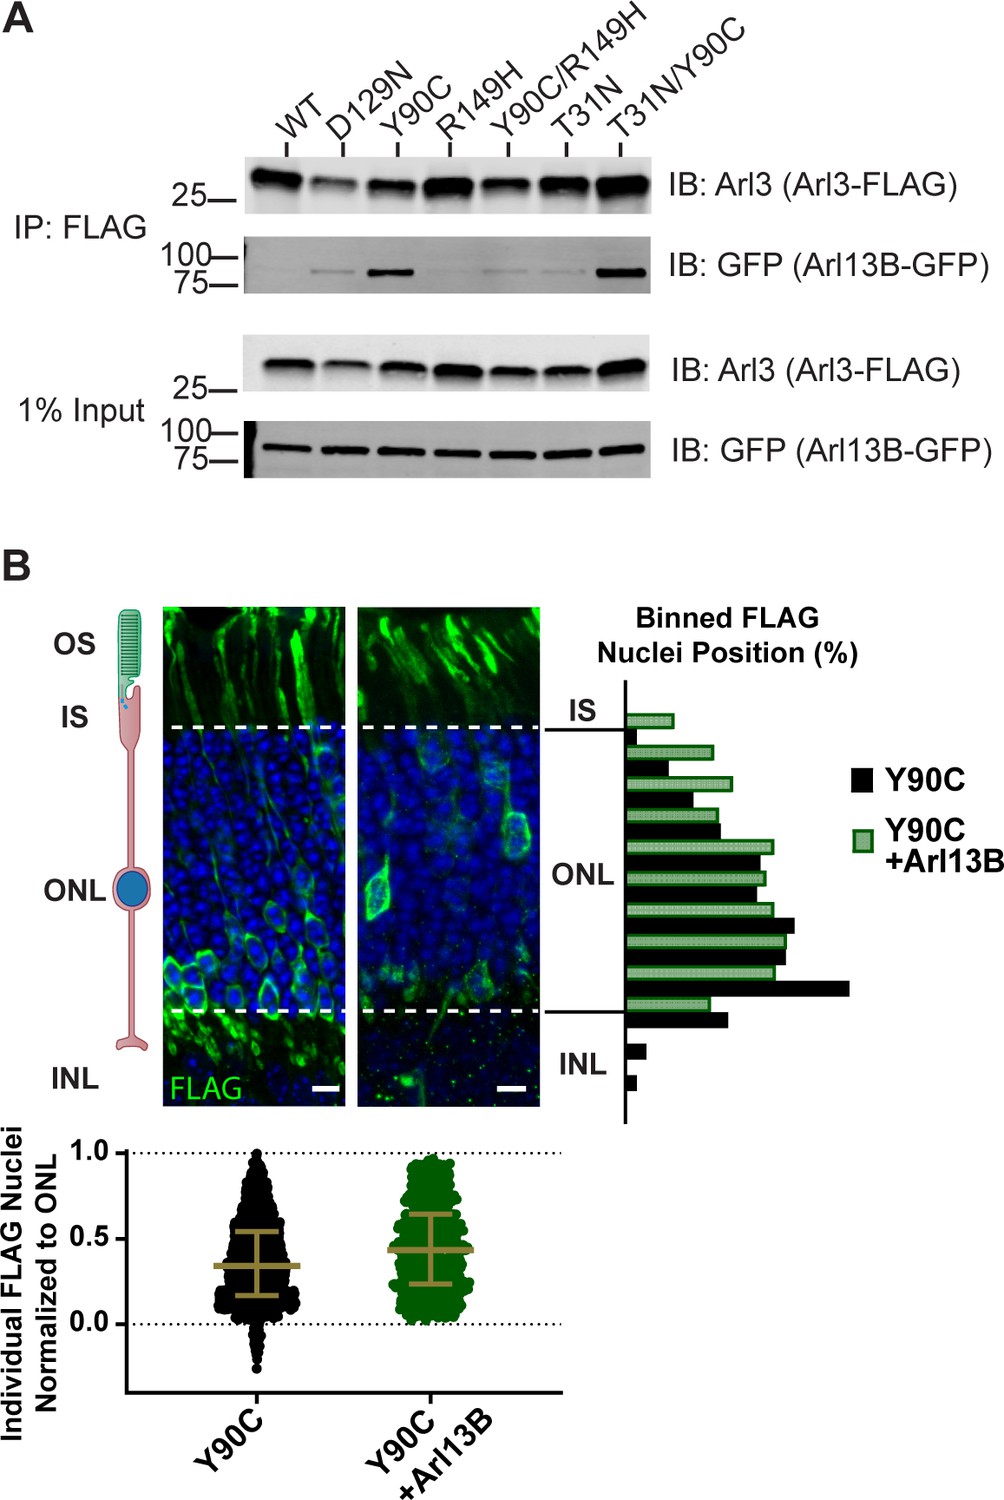
Arl3-Y90C acts as a dominant negative.
(A) FLAG immunoprecipitation from AD-293 lysates expressing Arl13B-GFP and Arl3-FLAG mutants. Westerns immunoblotted for Arl3 and GFP with 1% inputs shown on top and FLAG eluates on bottom. (B) Representative retinal cross-sections from Arl3-Y90C-FLAG alone or co-expressed with Arl13B-myc and rods stained with anti-FLAG antibodies (green) and counterstained with Hoechst (blue). Scale bars, 5 µm. Nuclear position of electroporated rods represented as described in Figure 1.
-
Figure 3—source data 1
Raw western blot images.
- https://cdn.elifesciences.org/articles/80533/elife-80533-fig3-data1-v2.zip
Figure 3—figure supplement 1
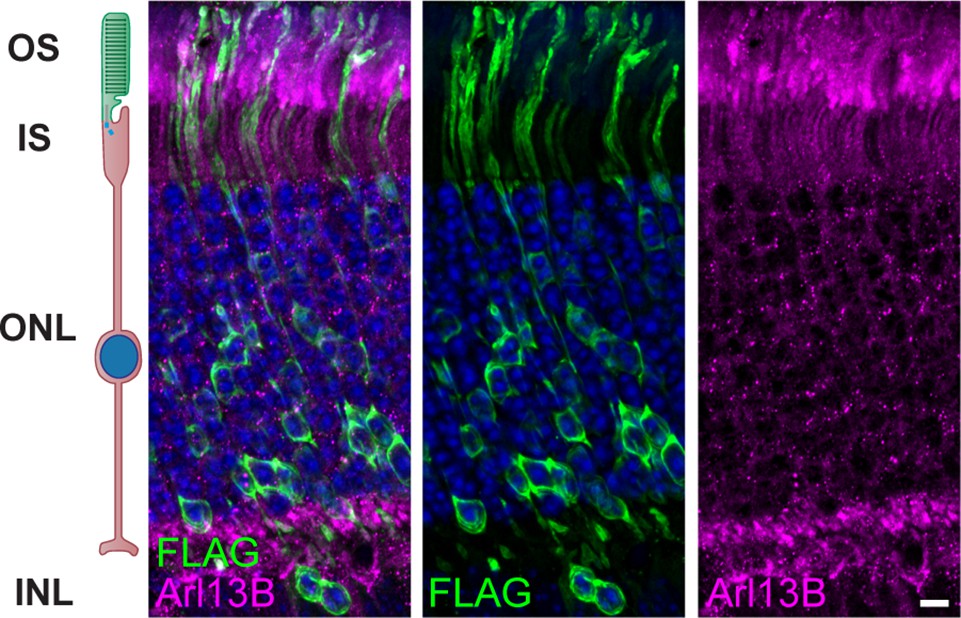
Arl3-Y90C overexpression in rods does not alter endogenous Arl13B localization.
Representative retinal cross-sections from Arl3-Y90C-FLAG stained with anti-FLAG (green) and anti-Arl13B (magenta) antibodies and counterstained with Hoechst (blue). Scale bar, 5 µm.
Figure 3—figure supplement 2
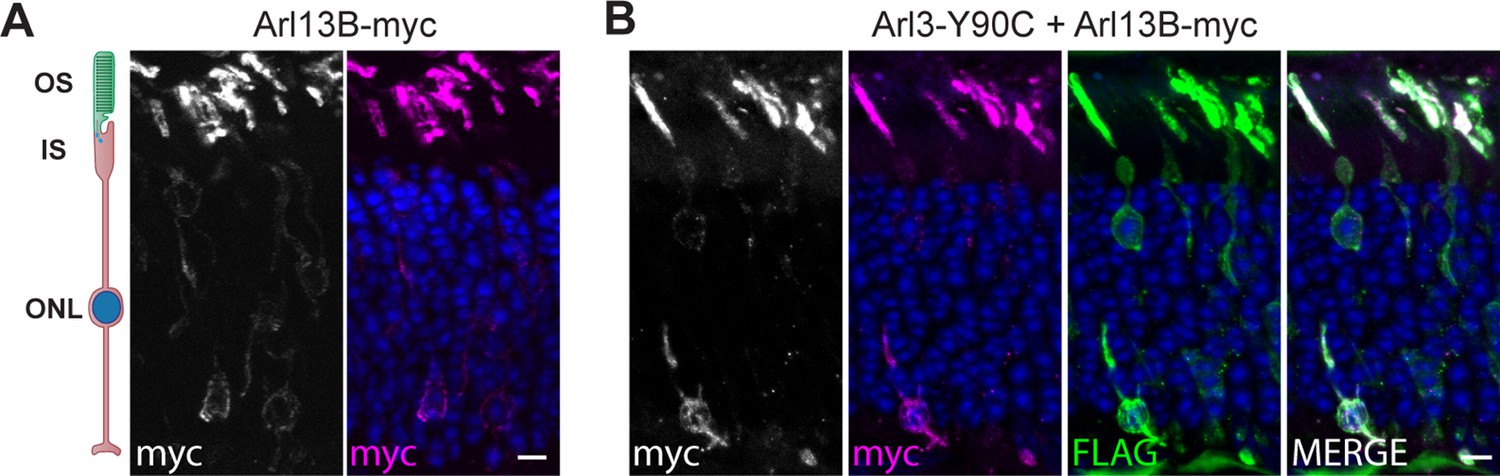
Arl13B-myc localization is not changed by co-expression with Arl3-Y90C-FLAG.
(A) Representative retinal cross-section from Arl13b-myc stained with anti-myc (magenta) antibody. (B) Representative retinal cross-section from Arl3-Y90C-FLAG co-expressed Arl13b-myc stained with anti-FLAG (green) and anti-myc (magenta) antibodies. Nuclei counterstained with Hoechst (blue). Gray images show some localization of Arl13B-myc within the rod cell body. Scale bars, 5 µm.
Figure 3—figure supplement 3
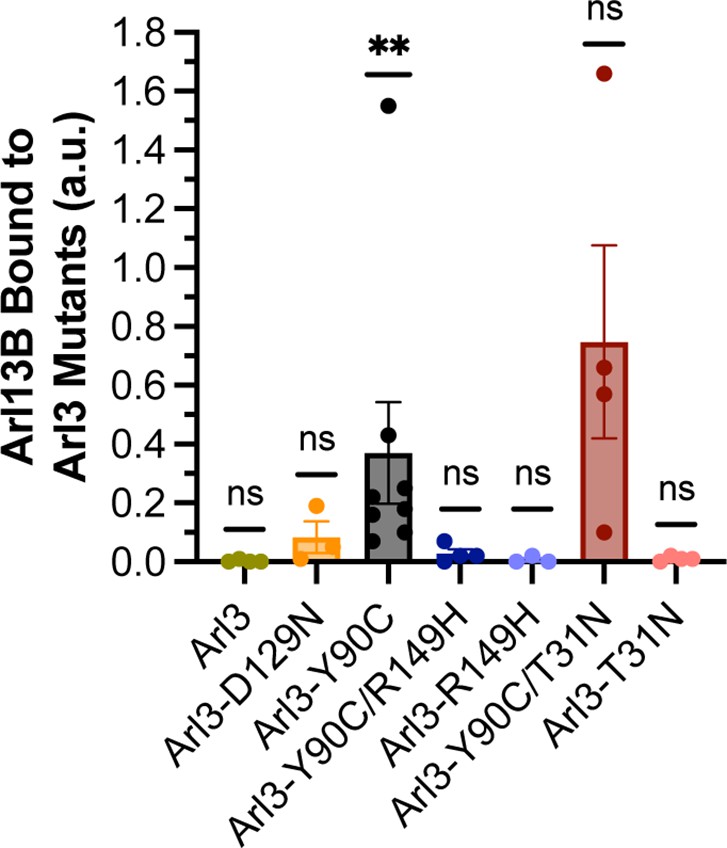
Analyzing the amount of Arl13B-GFP bound to Arl3-FLAG mutants expressed in AD-293 cells.
For each immunoprecipitation eluate, the Arl13B-GFP band was normalized to amount of Arl3-FLAG in the same lane. A Wilcoxon signed-rank test was performed to see whether the sample data were significantly different from 0, which represents no Arl13B-GFP bound. **p = 0.0078.
Figure 4 with 1 supplement
Arl3-Y90C undergoes guanine exchange factor (GEF)-independent activation in cell culture.
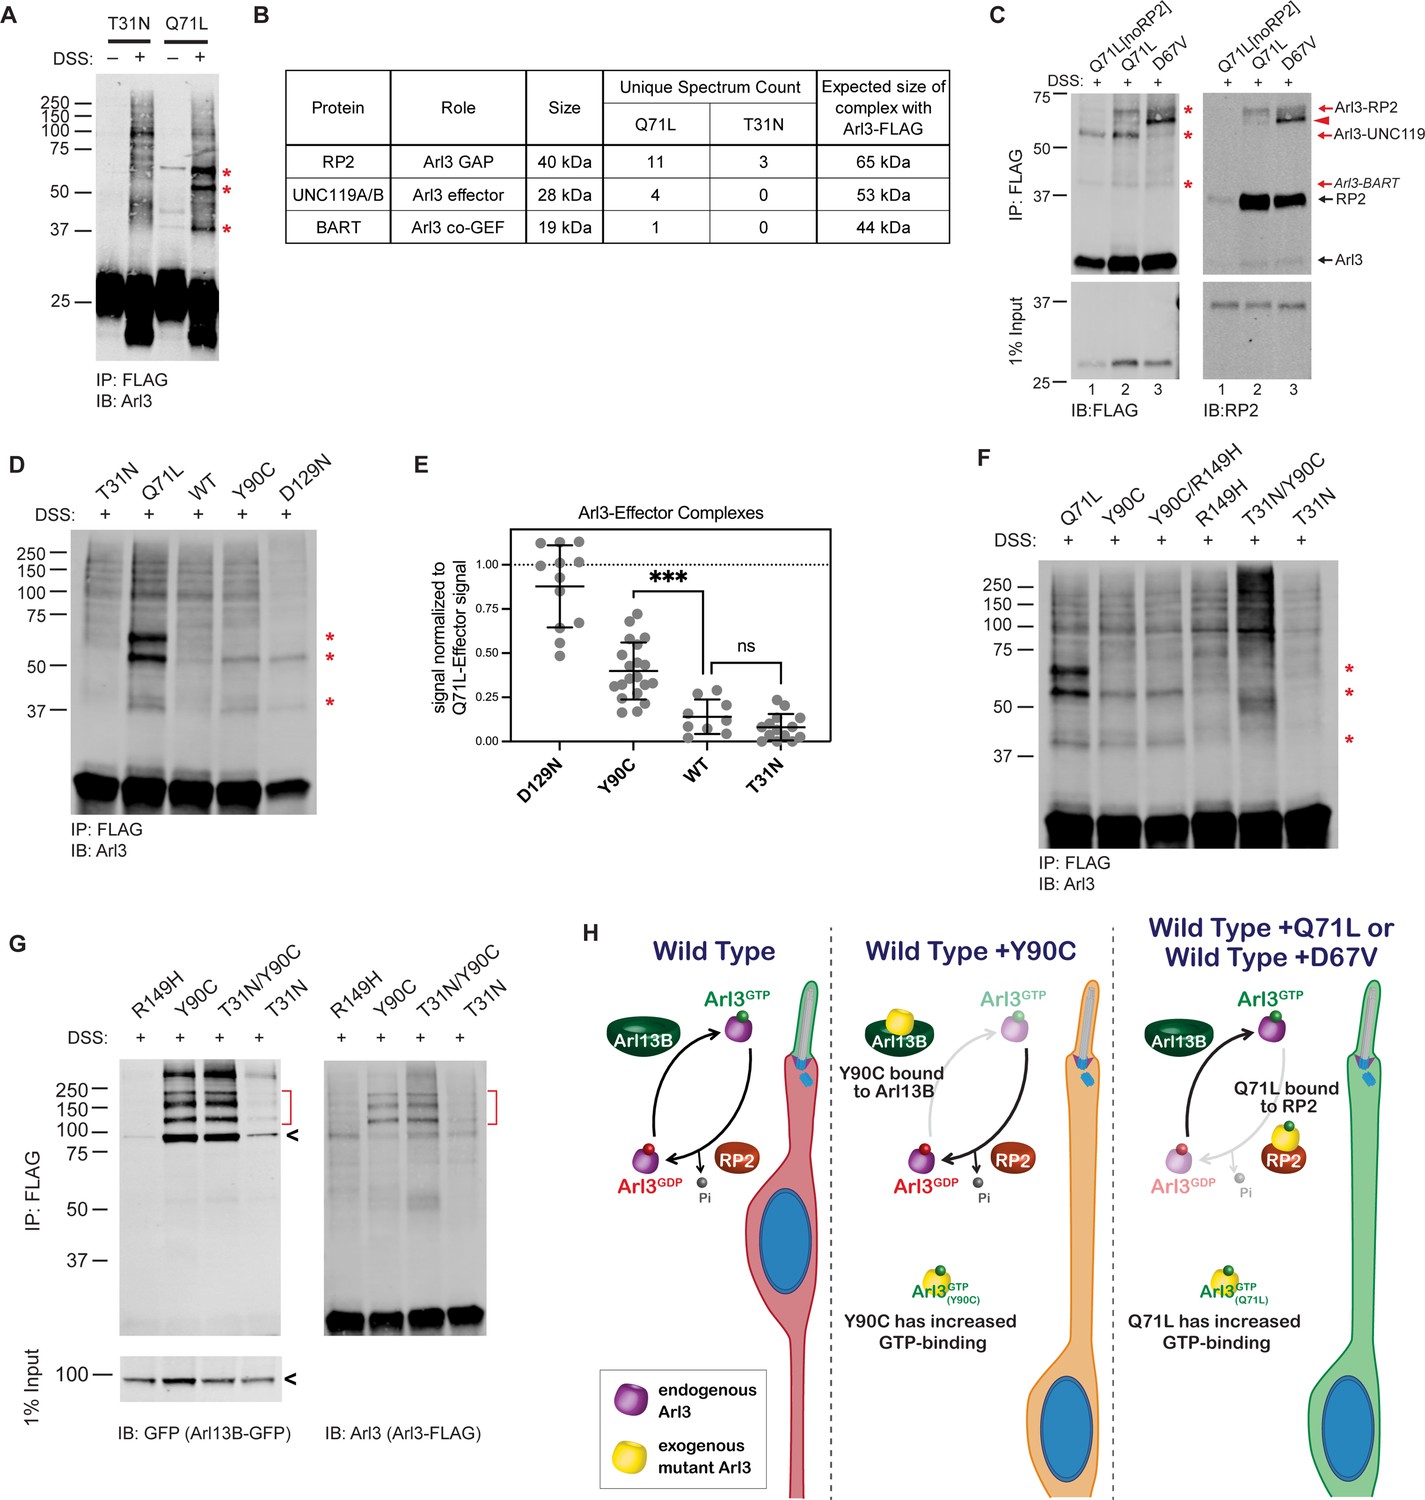
(A) FLAG immunoprecipitation from DSS-crosslinked or non-crosslinked AD-293 cell lysates expressing either Arl3-T31N-FLAG or Arl3-Q71L-FLAG immunoblotted with anti-Arl3 antibodies. Red asterisks indicate the three prominent bands that appear in crosslinked cells expressing Arl3-Q71L-FLAG. (B) Table displaying the Arl3-binding partners identified by mass spectroscopy of FLAG immunoprecipitations from either Arl3-Q71L-FLAG or Arl3-T31N-FLAG lysates after DSS crosslinking. (C) Crosslinked FLAG immunoprecipitation from either Arl3-Q71L/E164A/D168A-FLAG (Q71L[noRP2]), Arl3-Q71L-FLAG, or Arl3-D67V-FLAG probed with either anti-FLAG or anti-RP2 antibodies. Red asterisks and red arrows indicate crosslinked Arl3 complexes. Arl3-FLAG complexed with RP2 is found in two bands, the lower band indicated with red arrowhead. Black arrows indicate the non-crosslinked proteins. (D) Representative western blot showing crosslinked FLAG immunoprecipitation from Arl3-FLAG mutants: T31N, Q71L, Y90C, and D129N. Red asterisks indicate the three crosslinked Arl3 complexes identified from Arl3-Q71L. (E) The signal intensity of crosslinked Arl3 complexes for each mutant normalized to the intensity of Arl3-Q71L complexes on the same blot. ns, p = 0.8108 and ***p = 0.0007. (F) Crosslinked FLAG immunoprecipitation from Arl3-FLAG double mutants and controls. Red asterisks indicate the three bands that appear in the presence of Arl3-Q71L. (G) Crosslinked FLAG immunoprecipitation from lysates expressing both Arl13B-GFP and Arl3-FLAG mutants. The red brackets identify Arl13B-Arl3 complexes and the black arrowheads non-crosslinked Arl13B-GFP. (H) Cartoon model depicts Arl3 GTPase cycle in ‘immature’ rod photoreceptors under wild-type conditions and how it is disrupted in the presence of exogenous Arl3-Y90C, Arl3-D67V, or Arl3-Q71L. Red indicates the presence of inactive Arl3-GDP, green indicates the presence of active Arl3-GTP, and orange indicates a mixed population of Arl3-GDP/Arl3-GTP.
-
Figure 4—source data 1
Excel table with mass spectrometry data from Arl3-Q71L and Arl3-T31N crosslinking experiments.
- https://cdn.elifesciences.org/articles/80533/elife-80533-fig4-data1-v2.xlsx
-
Figure 4—source data 2
Raw western blot images.
- https://cdn.elifesciences.org/articles/80533/elife-80533-fig4-data2-v2.zip
Figure 4—figure supplement 1
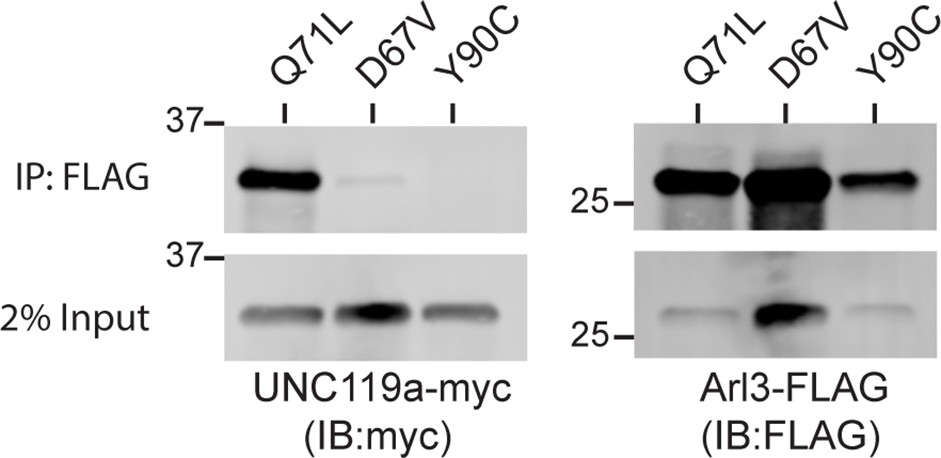
Unlike Arl3-Q71L, Arl3-D67V does not bind UNC119A.
FLAG immunoprecipitations using AD-293 lysates co-expressing 3XFLAG-tagged Arl3 mutants and myc-tagged UNC119a immunoblotted with anti-myc or anti-FLAG antibodies.
Figure 5
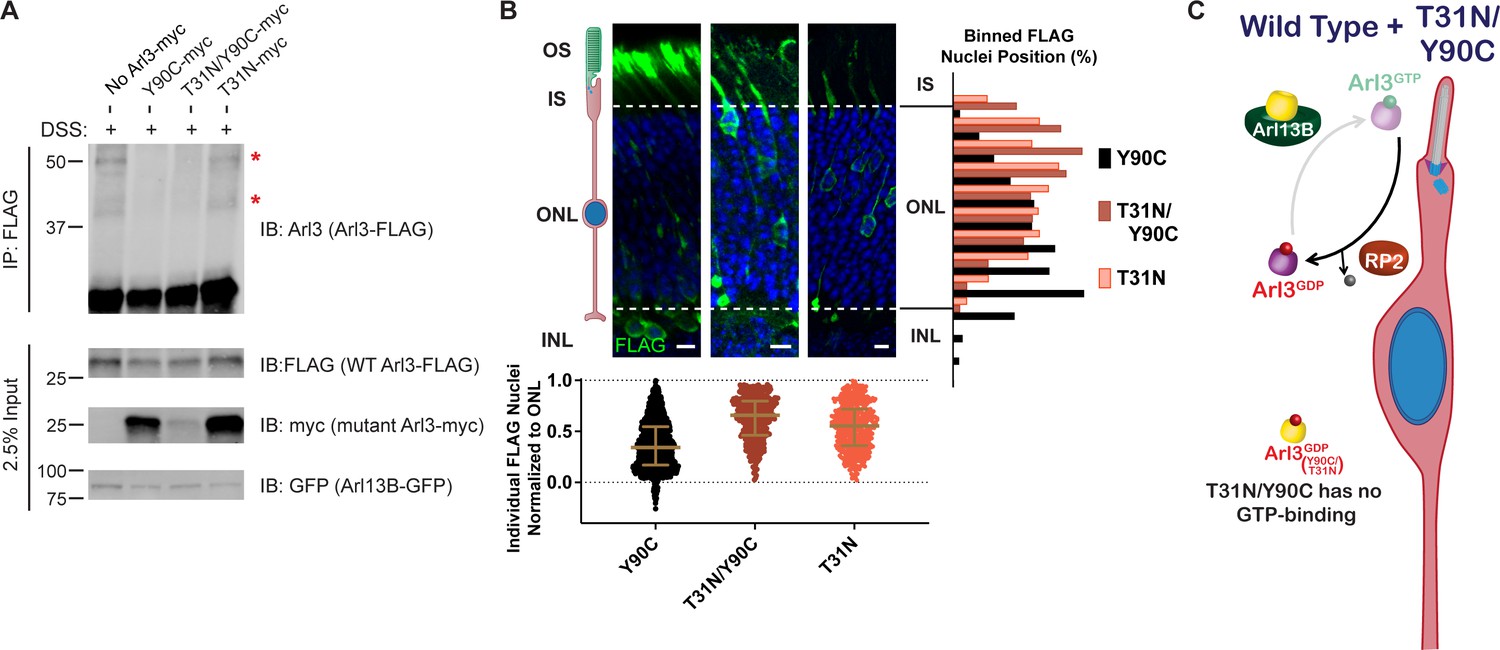
Aberrant Arl3 activity drives the rod nuclear migration phenotype.
(A) Crosslinked FLAG immunoprecipitation from AD-293 lysates expressing Arl13B-GFP, wild-type Arl3-FLAG, and myc-tagged Arl3 mutants. Red asterisks indicate the two crosslinked Arl3 complexes that appear in the presence of Arl3-Y90C. (B) Representative retinal cross-sections from Arl3-Y90C-FLAG-, Arl3-T31N/Y90C-FLAG-, or Arl3-T31N-FLAG-expressing rod photoreceptors stained with anti-FLAG antibodies (green) and Hoechst (blue). Scale bars, 5 µm. Nuclear position of electroporated rods represented as described in Figure 1. (C) Cartoon model portraying disrupted Arl3 GTPase cycle in ‘immature’ rod photoreceptors in the presence of exogenous Arl3-T31N/Y90C mutant (yellow). Red indicates Arl3 is inactive throughout the rod and nuclear positioning is normal.
-
Figure 5—source data 1
Raw western blot images.
- https://cdn.elifesciences.org/articles/80533/elife-80533-fig5-data1-v2.zip
Figure 6 with 1 supplement
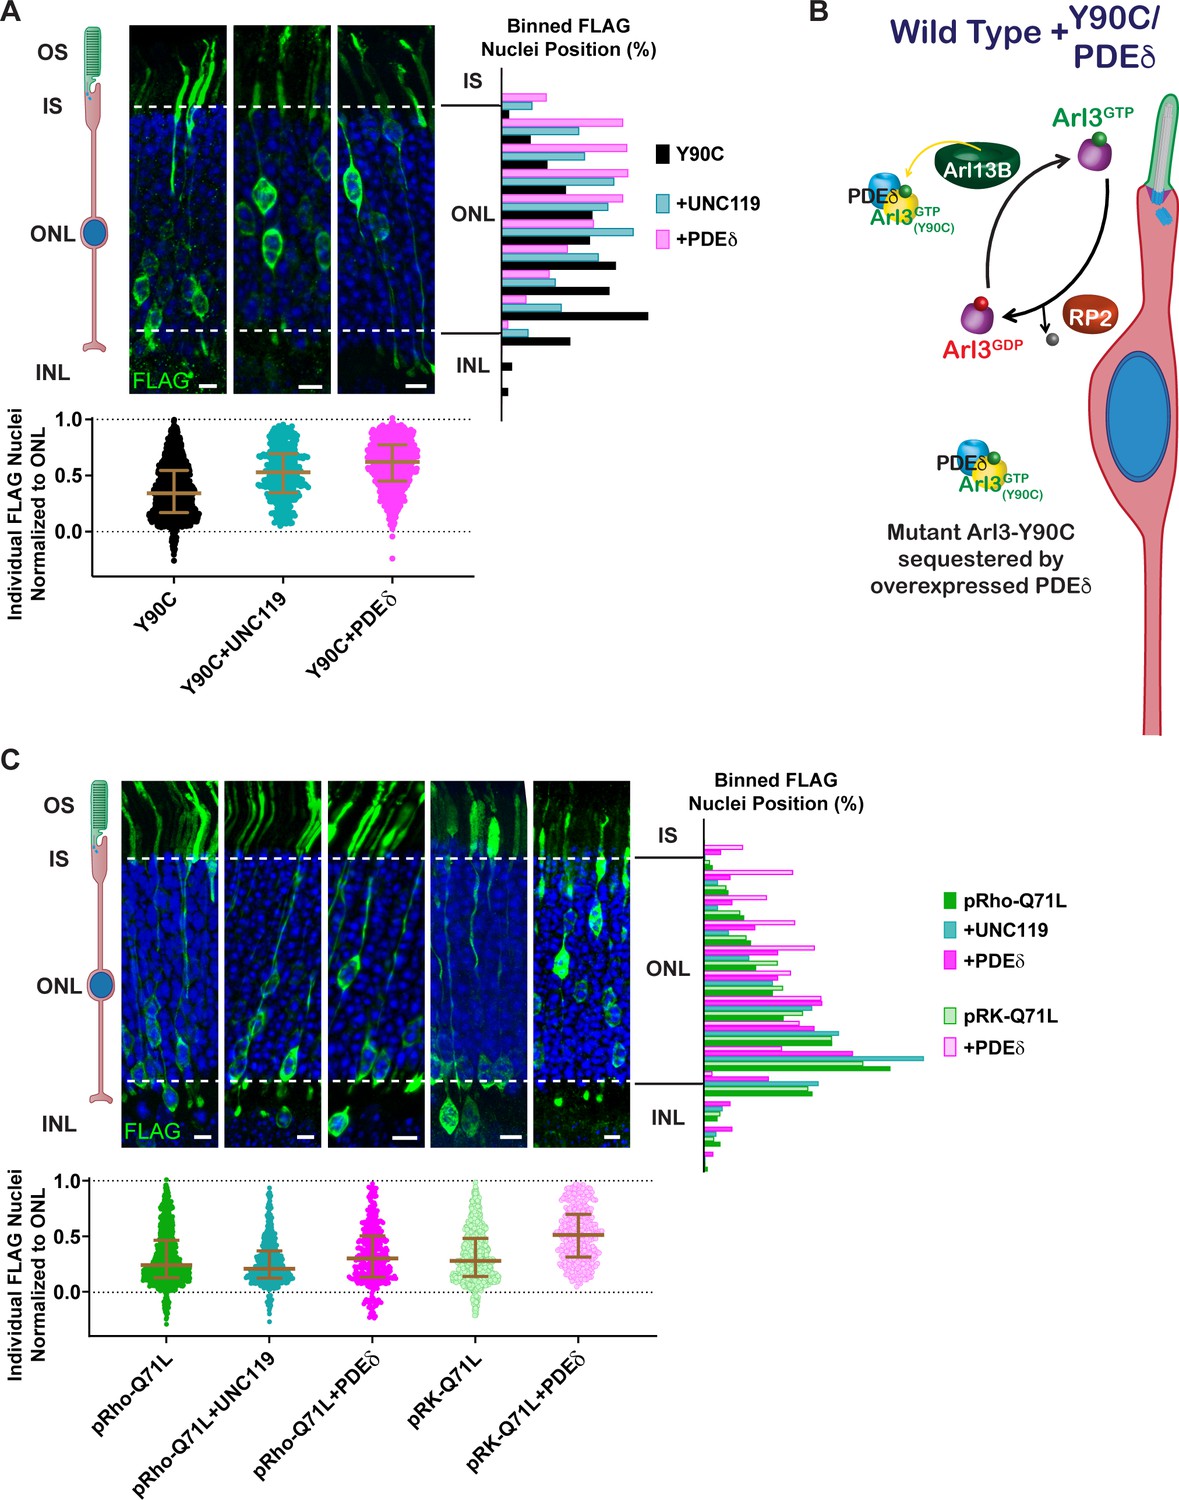
Arl3-driven nuclear migration defects are rescued by overexpressing Arl3 effectors in rods.
(A) Representative retinal cross-sections from Arl3-Y90C-FLAG co-expression with either the Arl3 effectors UNC119a or PDEδ. (B) Cartoon model illustrating the impact of Arl3 effector expression in the presence of Arl3-Y90C-FLAG in ‘immature’ rod photoreceptors. Arl3 effectors reduce active Arl3 levels by sequestering Arl3-GTP. The ciliary Arl3-GTP gradient is restored allowing for normal nuclear positioning. (C) Representative retinal cross-sections from high (pRho) or low (pRK) Arl3-Q71L-FLAG co-expressed with either the Arl3 effectors UNC119a or PDEδ. FLAG (green) and Hoechst (blue). Scale bars, 5 µm. Nuclear position of electroporated rods represented as described in Figure 1.
-
Figure 6—source data 1
Raw western blot images.
- https://cdn.elifesciences.org/articles/80533/elife-80533-fig6-data1-v2.zip
Figure 6—figure supplement 1
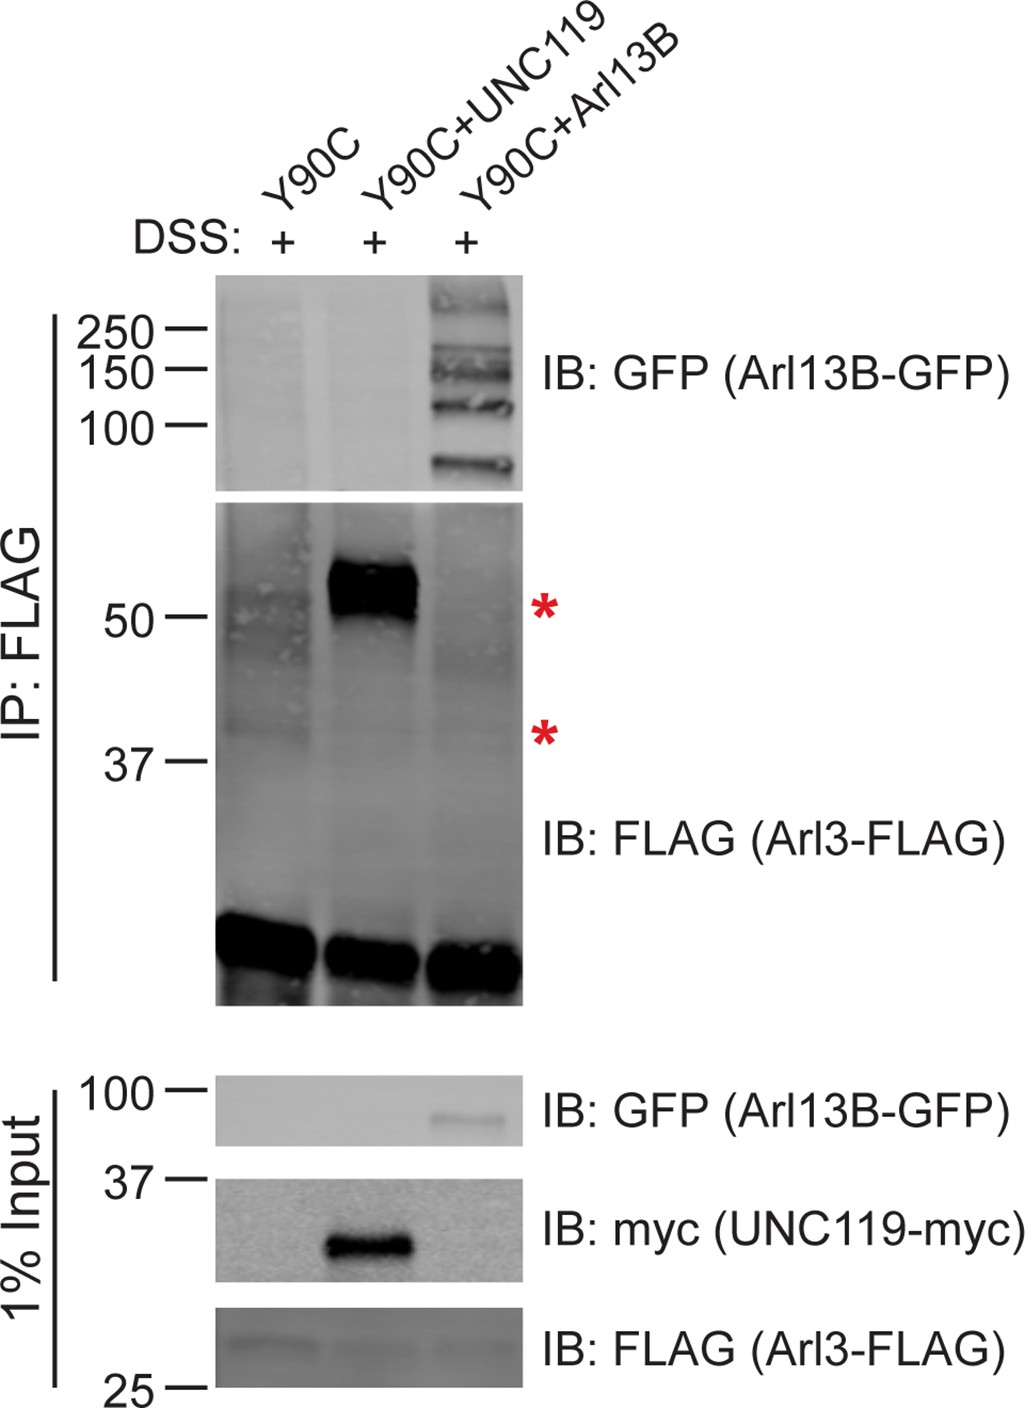
Co-expression of UNC119a-myc or Arl13B-GFP decreases Arl3-Y90C-FLAG activity in cells.
Crosslinked FLAG immunoprecipitation from AD-293 lysates co-expressing Arl3-Y90C-FLAG with either myc-tagged UNC119a or Arl13B-GFP. Red asterisks indicate Arl3-Y90C-FLAG crosslinked with effectors. Overexpression of UNC119a-myc with Arl3-Y90C forms a very strong Arl3-Y90C/UNC119 complex (top asterisk,~53 kDa) that decreases the ability of Arl3-Y90C-FLAG to form complexes with its other effector (bottom asterisk, ~44 kDa). A similar effect is also seen for both Arl3-Y90C effector complexes when Arl13B-GFP is overexpressed.
Figure 7 with 1 supplement
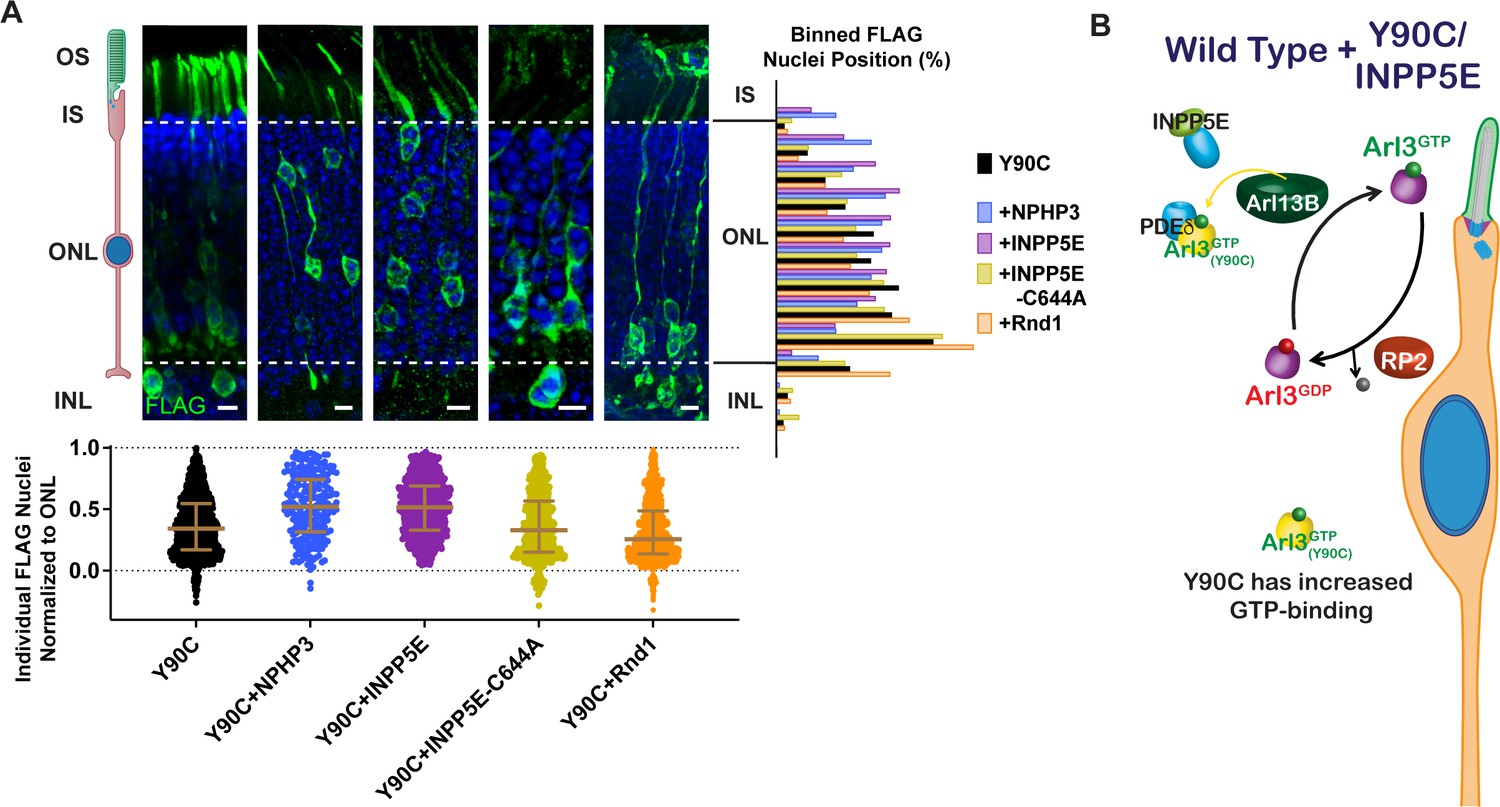
Arl3-Y90C migration defect is rescued by overexpressing lipidated cargos destined for the cilium.
(A) Representative retinal cross-sections from Arl3-Y90C-FLAG co-expression with different lipidated cargos: NPHP3, INPP5E, or non-lipidated INPP5E-C644A (see Figure 7—figure supplement 1), and Rnd1 (a PDEδ cargo, see Figure 7—figure supplement 1). FLAG (green) and Hoechst (blue). Scale bars, 5 µm. Nuclear position of electroporated rods represented as described in Figure 1. (B) Cartoon model illustrating the impact of ciliary lipidated cargo expression in the presence of Arl3-Y90C-FLAG in ‘immature’ rod photoreceptors. Specific delivery cargos to the cilium cause a sufficient local enrichment of Arl3 effector (e.g., PDEδ) for removal of Arl3-Y90C from Arl13B. Even with the presence of aberrant Arl3-Y90C-GTP in the rod cell body (orange) restoration of the endogenous Arl3 (purple) GTPase cycle allows for normal nuclear positioning.
-
Figure 7—source data 1
Raw western blot images.
- https://cdn.elifesciences.org/articles/80533/elife-80533-fig7-data1-v2.zip
Figure 7—figure supplement 1
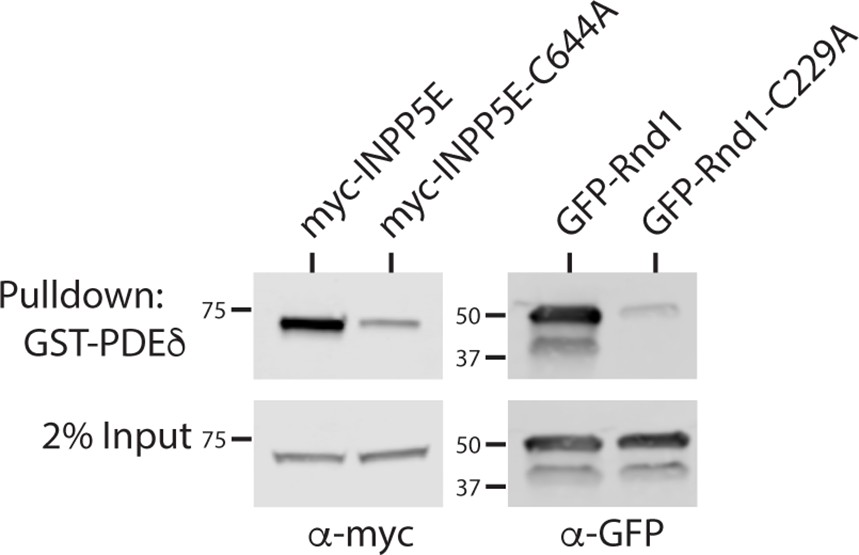
Lipid-dependent binding of INPP5E and Rnd1 to PDEδ.
GST-PDEδ pulldowns using AD-293 lysates expressing myc-tagged INPP5E and non-lipidated C644A mutant INPP5E immunoblotted with anti-RP2 antibodies. GST-PDEδ pulldowns using AD-293 lysates expressing GFP-tagged Rnd1 and non-lipidated C229A mutant Rnd1 immunoblotted with anti-GFP antibodies.
Figure 8
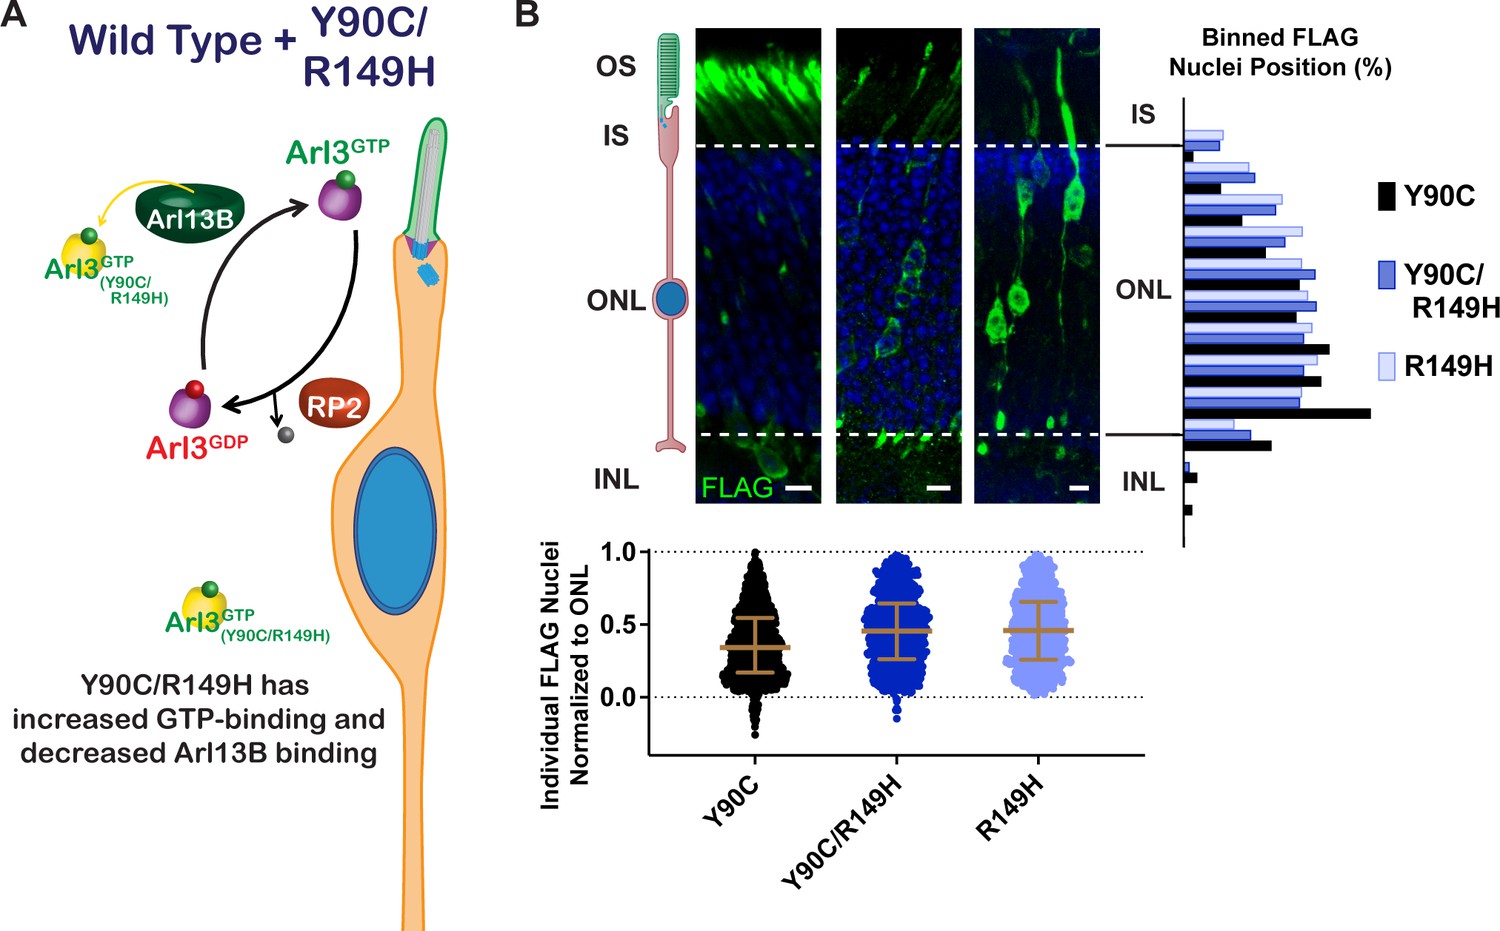
Restoring the endogenous Arl3 cycle is sufficient for normal nuclear migration in the presence of aberrant Arl3 activity.
(A) Cartoon model depicts the Arl3 GTPase cycle in ‘immature’ rod photoreceptors in the presence of Arl3-Y90C/R149H. Endogenous Arl3 (purple) can restore the Arl3-GTP ciliary gradient (green) even in the presence of aberrant Arl3-Y90C/R149H-GTP in the rod cell body (orange). (B) Representative retinal cross-sections from Arl3-Y90C-FLAG-, Arl3-Y90C/R149H-FLAG-, or Arl3-R149H-FLAG-expressing rod photoreceptors. FLAG (green) and Hoechst (blue). Scale bars, 5 µm. Nuclear position of electroporated rods represented as described in Figure 1.
Tables
Table 1
Summary of Arl3 mutants.
Human retinal phenotypes, GTPase function, mouse rod nuclear migration defect, and statistics are detailed with references listed.
Arl3 mutant | Co-expression | Neuronal migration defect | % INL | Skew | p value | Nucleotide-binding properties | Ref | Human disease | Ref |
|---|---|---|---|---|---|---|---|---|---|
| Wild-type | No | 0 | −0.2232 | GEF Arl13B/GAP RP2 | Gotthardt et al., 2015; Veltel et al., 2008b | ||||
| T31A | Unknown | Unknown | Compound RD | Fu et al., 2021 | |||||
| T31N | No | 0 | −0.1866 | 0.9997 | No GTP binding | Linari et al., 1999 | n/a | ||
| T31N/Y90C | No | 0 | −0.4093 | 0.8193 | No GTP binding | This paper | n/a | ||
| D67V | Yes | 7.37 | 0.5818 | <0.0001 | Active w/ select effector binding | This paper | Dominant RD | Ratnapriya et al., 2021 | |
| Q71L | Yes | 5.42 | 0.6195 | <0.0001 | No GTP hydrolysis | Linari et al., 1999; Veltel et al., 2008b | n/a | ||
| +UNC119 | Yes | 3.46 | 0.8616 | <0.0001 | |||||
| +PDEδ | Yes | 8.31 | 0.4449 | 0.0037 | |||||
| pRK-Q71L | Yes | 3.68 | 0.5328 | <0.0001 | No GTP hydrolysis | Linari et al., 1999; Veltel et al., 2008b | n/a | ||
| +PDEδ | No | 0 | 0.1224 | 0.4546 | |||||
| Y90C | Yes | 2.89 | 0.3053 | 0.0002 | Fast cycling | This paper | Dominant RD | Strom et al., 2016; Holtan et al., 2019 | |
| +Arl13B | No | 0 | 0.1108 | 0.1276 | |||||
| +UNC119 | No | 0 | −0.0898 | 0.995 | |||||
| +PDEδ | No | 0.26 | −0.4235 | 0.3665 | |||||
| +NPHP3 | No | 0.84 | −0.2929 | 0.9994 | |||||
| +INPP5E | No | 0 | −0.0367 | 0.7673 | |||||
| +INPP5E-C644A | Yes | 4.22 | 0.2357 | 0.0055 | |||||
| +Rnd1 | Yes | 2.94 | 0.5827 | <0.0001 | |||||
| Y90C/R149H | No | 0.71 | 0.0987 | 0.0921 | Fast cycling | This paper | n/a | ||
| R99I | Unknown | Unknown | Recessive RD | Sheikh et al., 2019 | |||||
| C118F | Unknown | Unknown | Compound RD | Fu et al., 2021 | |||||
| D129N | Yes | 3.67 | 0.2855 | 0.0113 | Fast cycling | Gotthardt et al., 2015 | n/a | ||
| R149H | No | 0 | 0.1229 | 0.051 | No GEF binding | Alkanderi et al., 2018 | Recessive RD | Alkanderi et al., 2018 |
Additional files
-
Supplementary file 1
Primer sequences and usage.
- https://cdn.elifesciences.org/articles/80533/elife-80533-supp1-v2.docx
-
MDAR checklist
- https://cdn.elifesciences.org/articles/80533/elife-80533-mdarchecklist1-v2.docx
Download links
A two-part list of links to download the article, or parts of the article, in various formats.
Downloads (link to download the article as PDF)
Open citations (links to open the citations from this article in various online reference manager services)
Cite this article (links to download the citations from this article in formats compatible with various reference manager tools)
Disrupting the ciliary gradient of active Arl3 affects rod photoreceptor nuclear migration
eLife 12:e80533.
https://doi.org/10.7554/eLife.80533


