Early stage NSCLS patients’ prognostic prediction with multi-information using transformer and graph neural network model
- Department of Diagnostic Radiology, Li Ka Shing Faculty of Medicine, The University of Hong Kong, China
- Department of Thoracic Surgery, Shanghai Pulmonary Hospital, Tongji University School of Medicine, China
- Department of Imaging and Interventional Radiology, The Chinese University of Hong Kong, China
- Department of Psychiatry, The Chinese University of Hong Kong, China
- Division of Applied Oral Sciences and Community Dental Care, Faculty of Dentistry, The University of Hong Kong, China
Figures
Figure 1
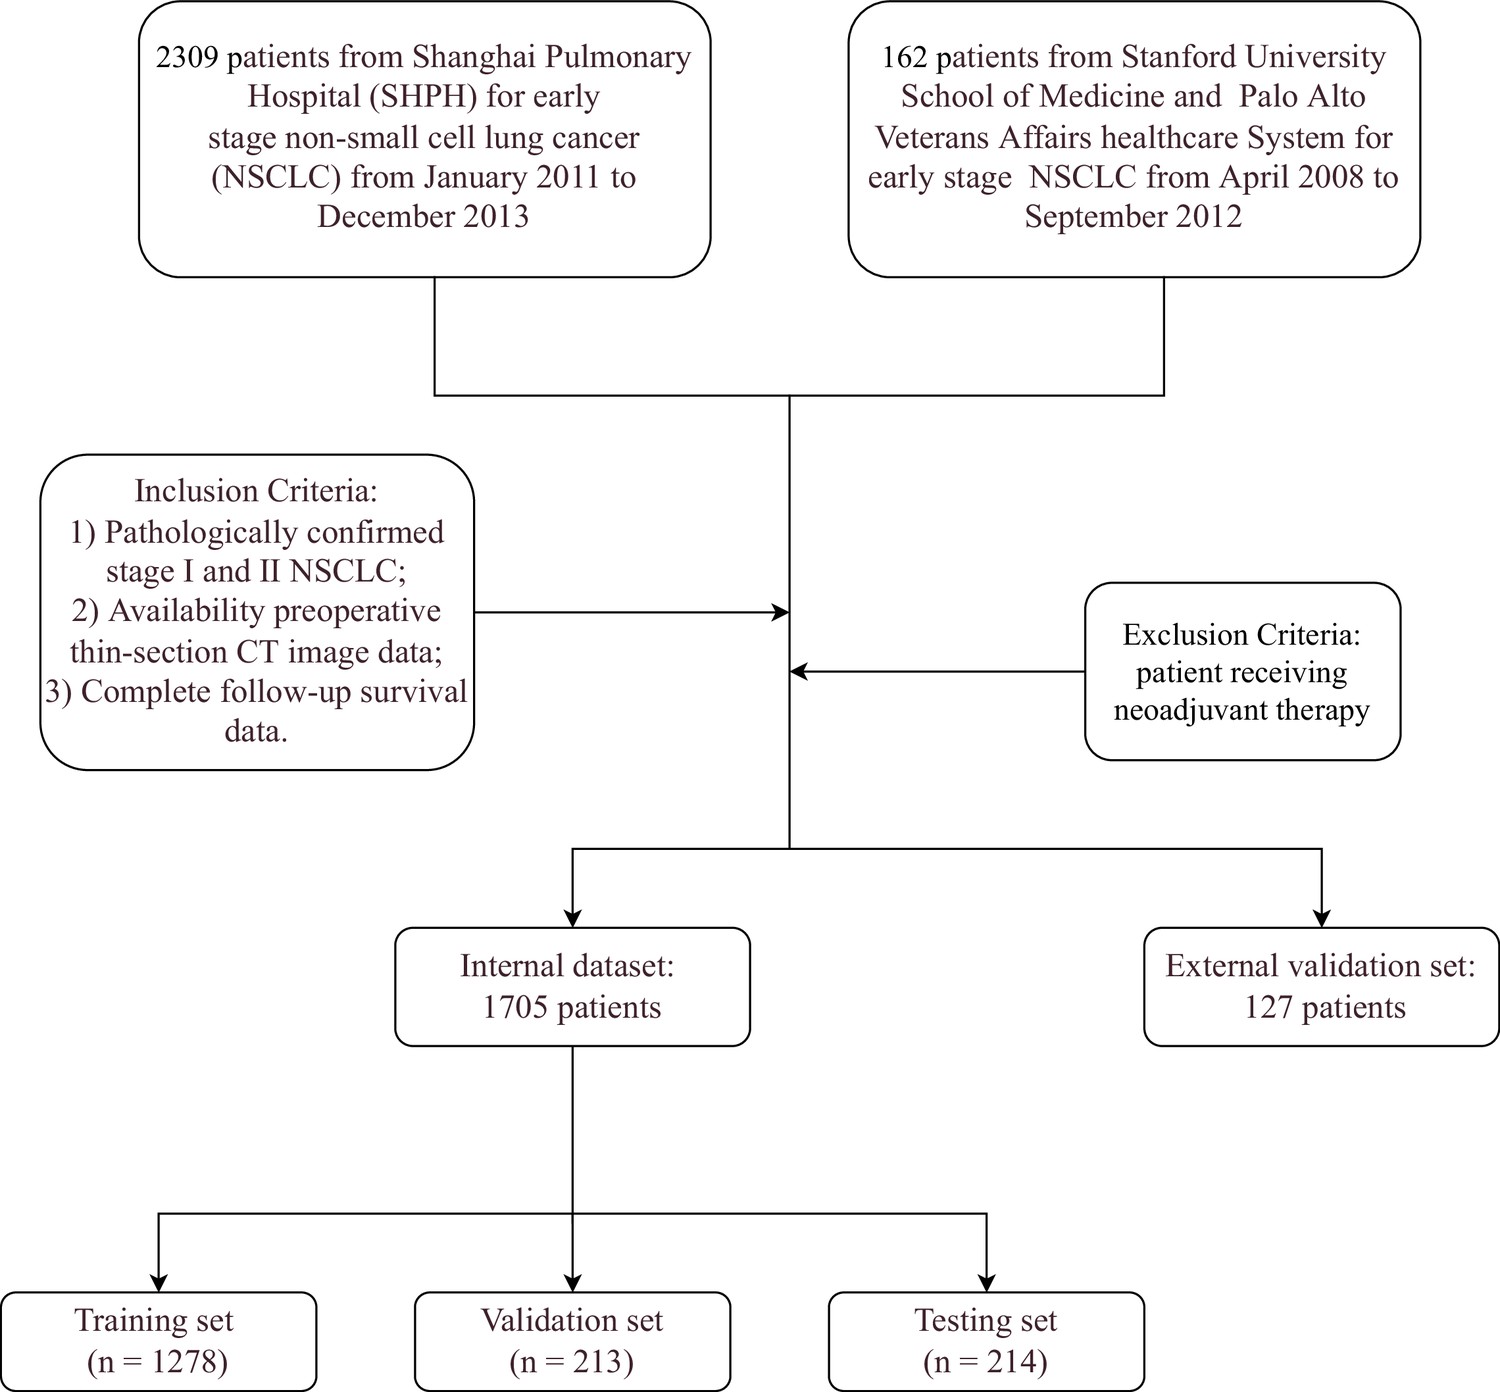
Overall flow of the study in both internal and external data set.
Figure 2
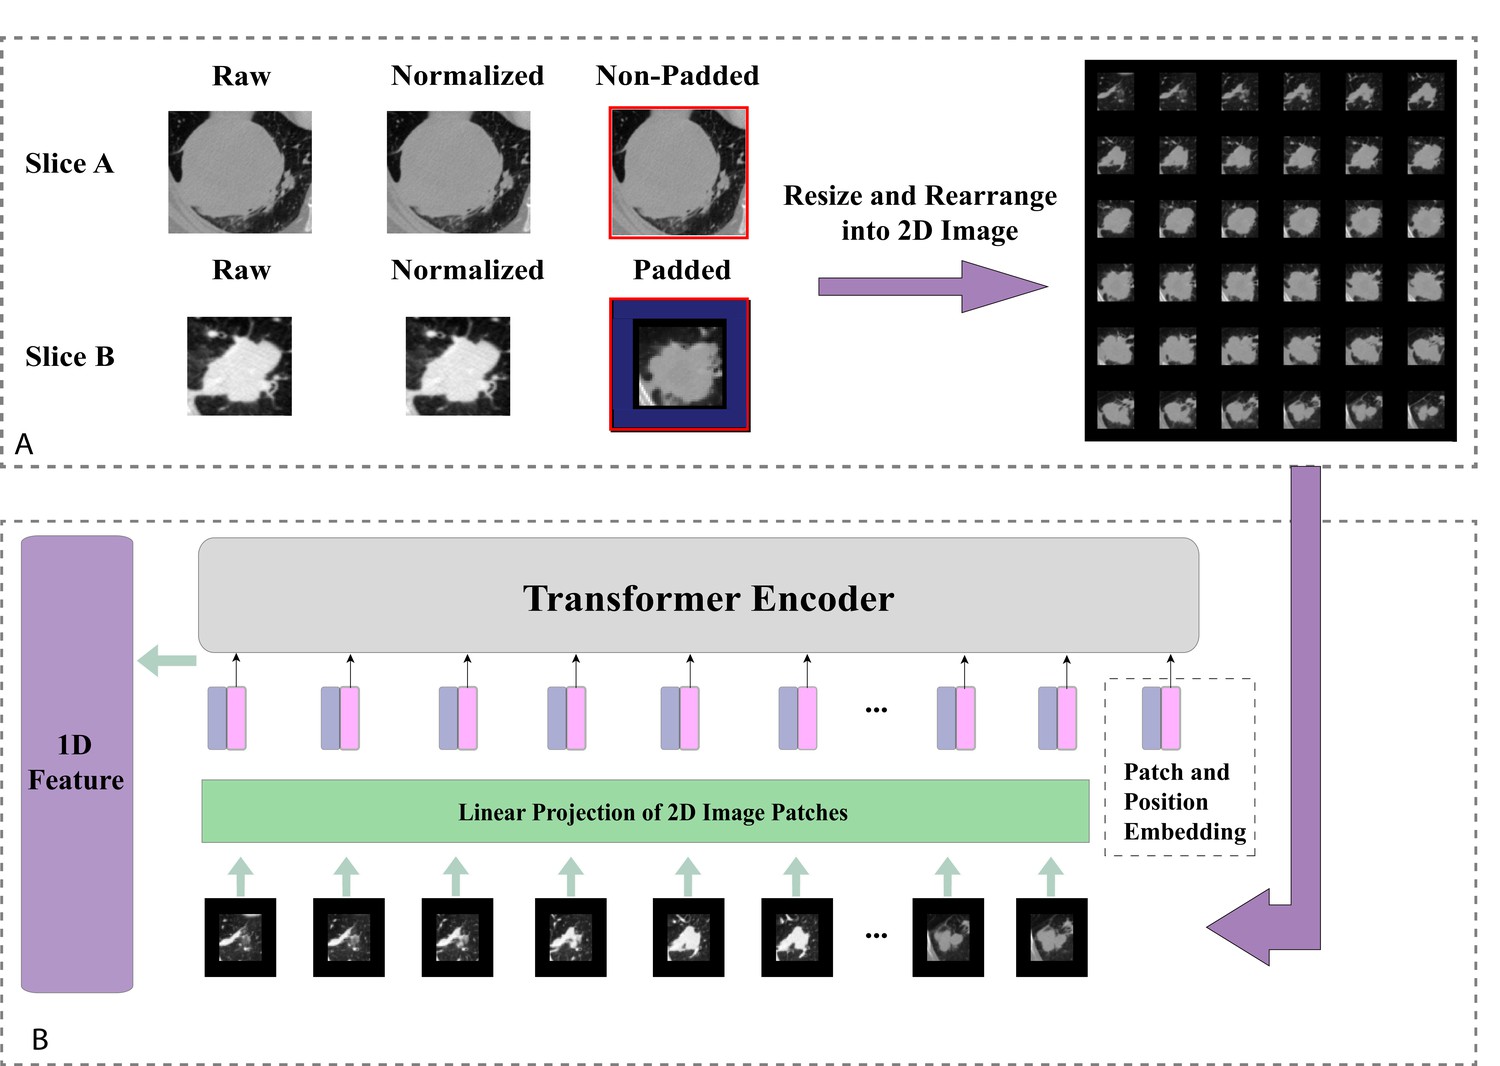
Tumour image processing and feature generation.
(A) Tumour images normalisation, reshaping, and padding to standard sizes, then re-arranged into 2D images. (B) Generating 1D Transformer survival features from pretrained Transformer model.
Figure 3
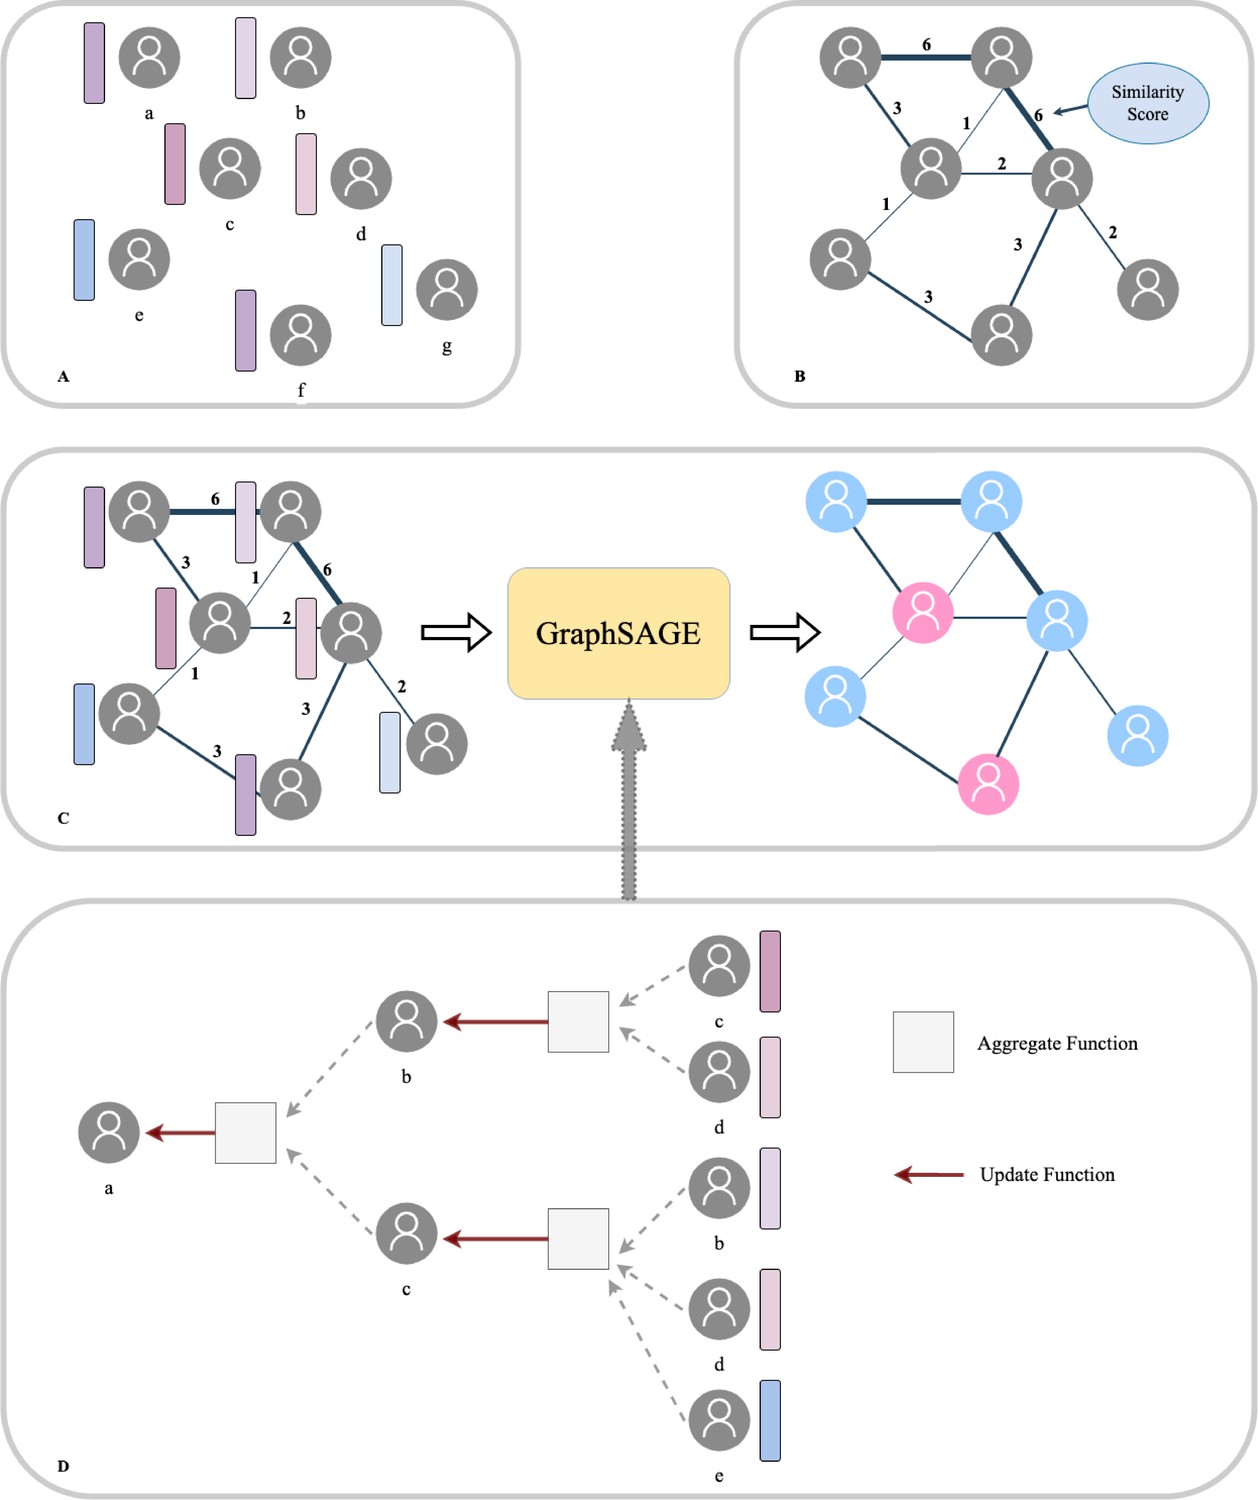
Population graph building and model prediction pipeline.
(A) Each patient was regarded as a node and the Transformer-generated feature was regarded as node features. (B) Graph edges and the relevant weights were defined by their similarity scores. (C) We then put the whole population graph to train the GraphSAGE network in order to make a prediction for each patient (pink indicates high risk and blue indicates low risk). (D) Node updating inside the GraphSAGE network.
Figure 4 with 1 supplement
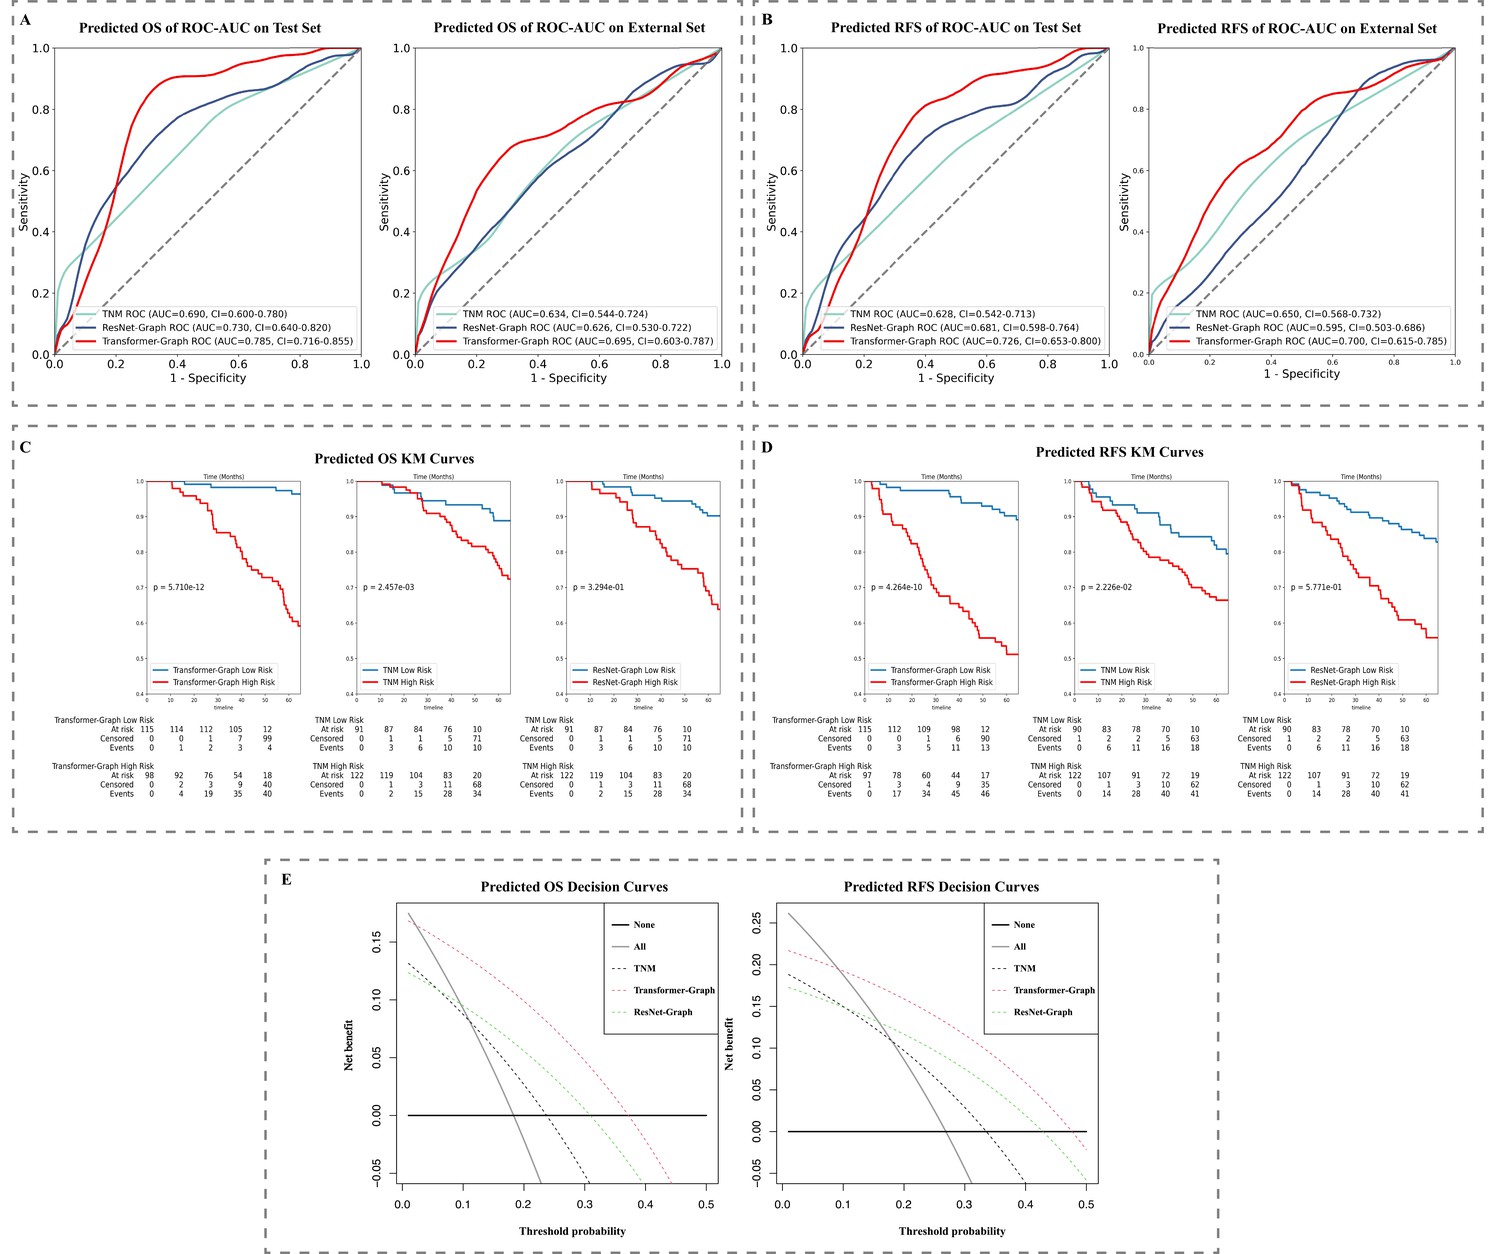
Model performance: (A) ROC-AUC curve on test data and external set for OS and (B) RFS prediction and (C) KM curve on test data set for OS and (D) RFS prediction.
(E) Decision curve on test data set for OS and RFS prediction. KM, Kaplan–Meier; OS, overall survival; RFS, recurrence-free survival; ROC-AUC, area under the receiver operator characteristic curve.
Figure 4—figure supplement 1
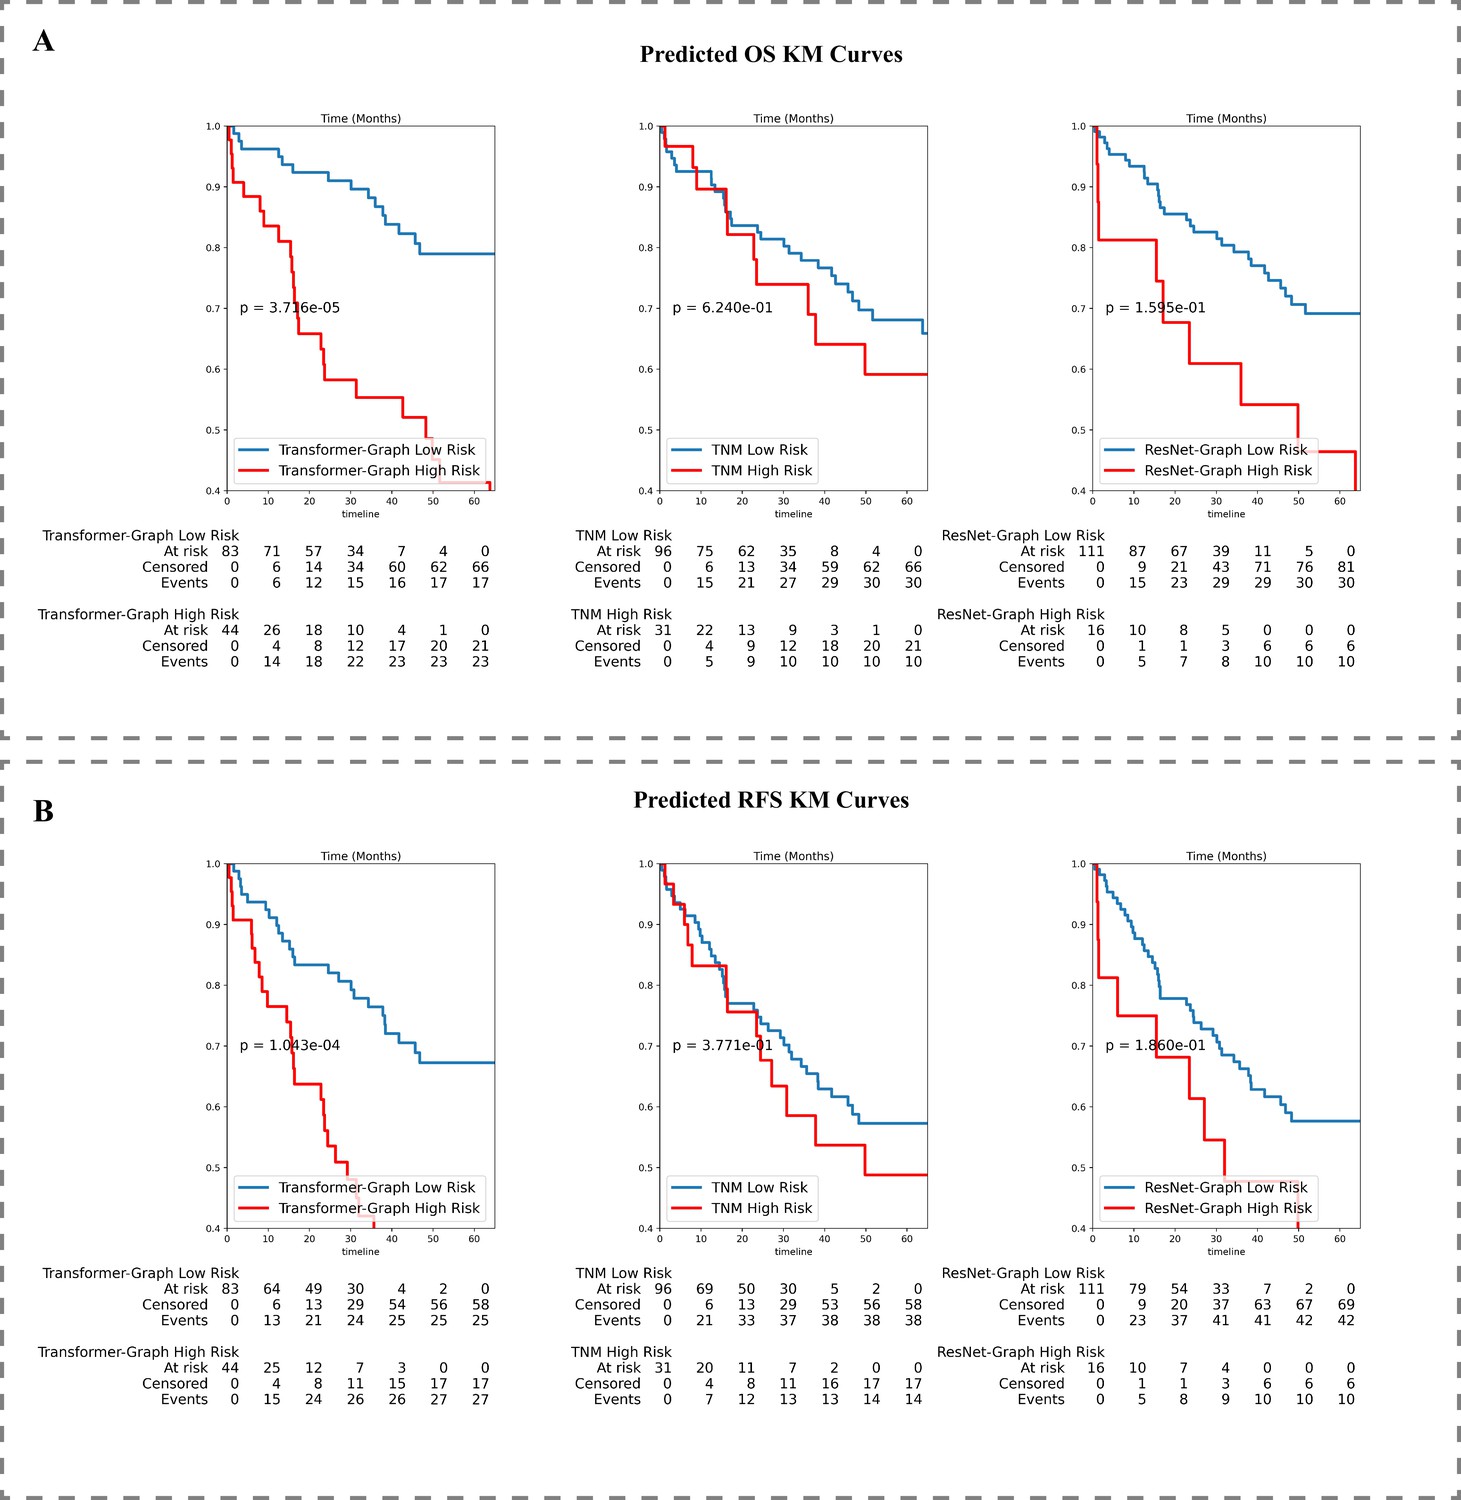
Kaplan-Meier survival analysis.
(A) KM curve on external data set for OS and (B) RFS prediction.
Figure 5
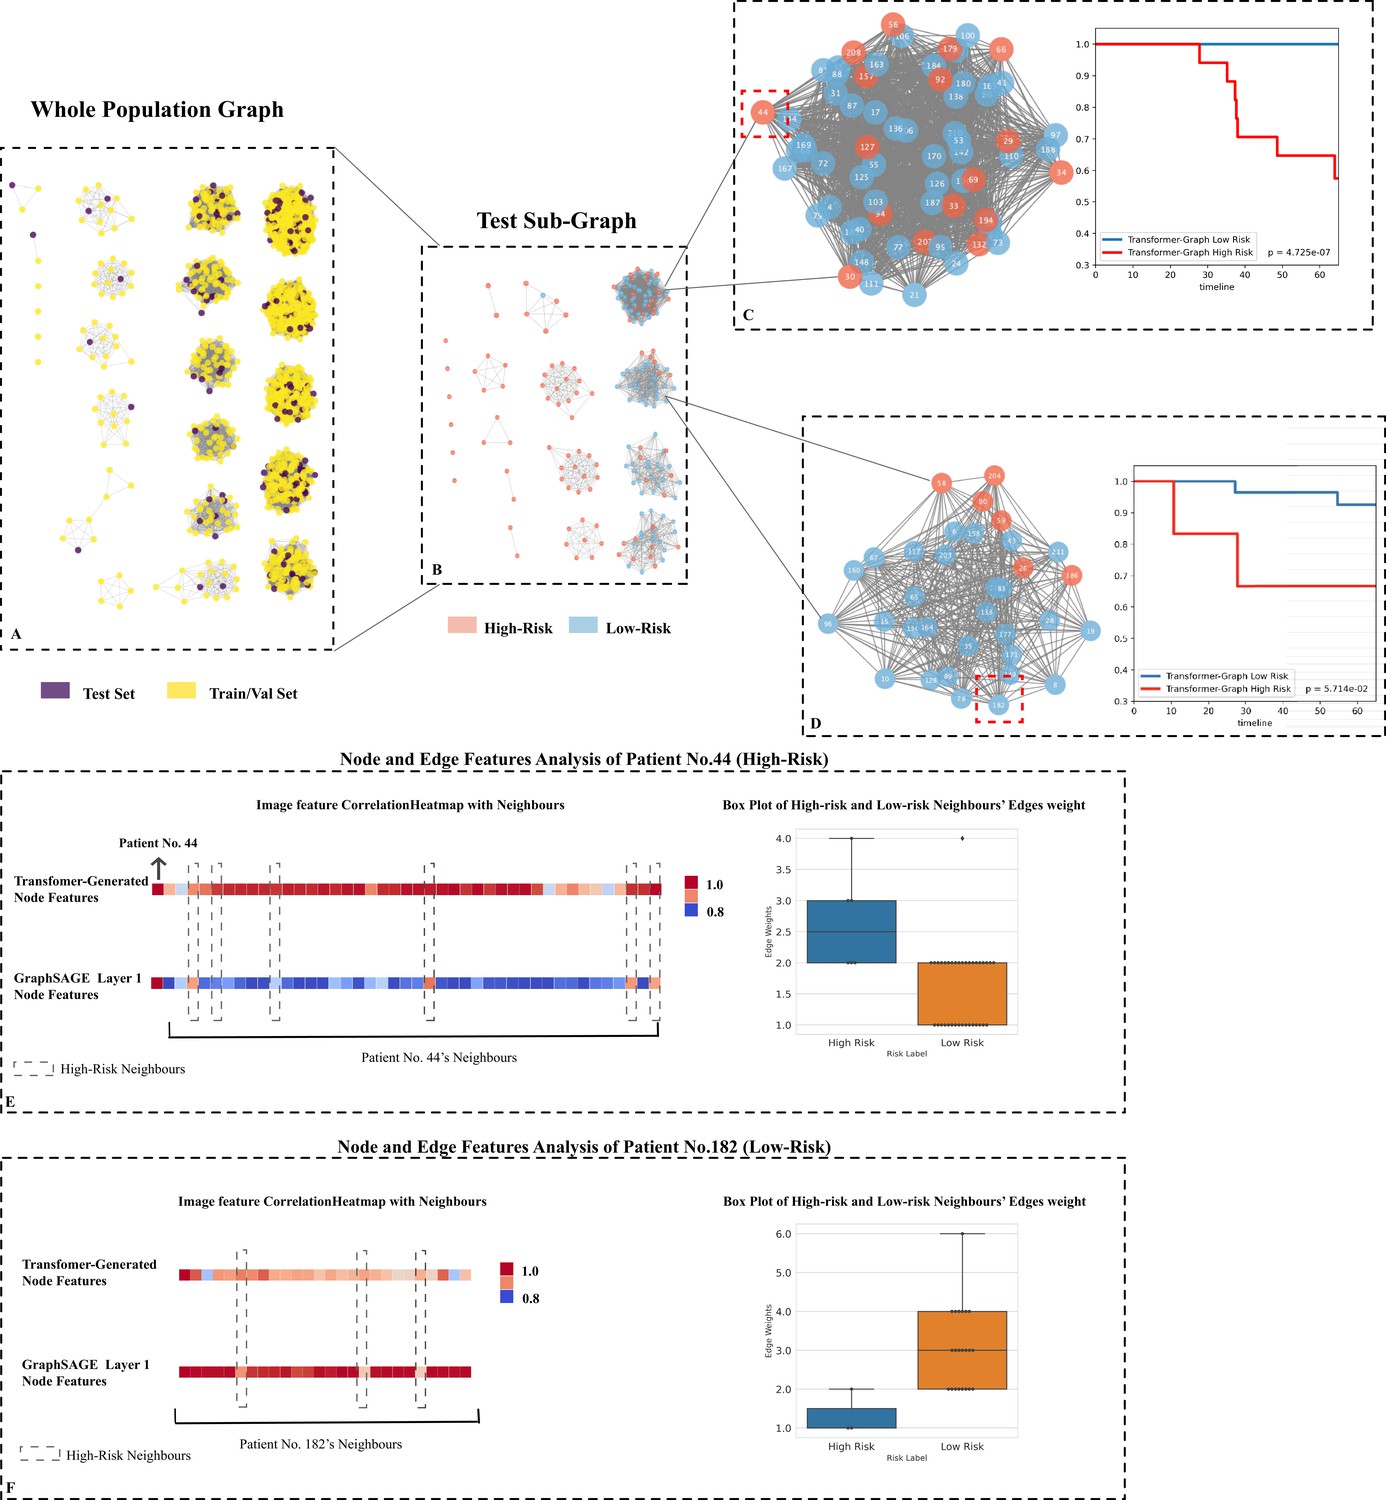
Testing set graph analysis.
(A) A visual representation of the whole cohort population graph of 1705 patients. (B) A visual representation of the testing sub-graph of 213 patients. (C) and (D) two sub-graphs containing challenging cases where the graphs contained both high- and low-risk patients. (E) Node features’ correlation heatmaps and edge weights distribution of patient No. 44: Each square represents a neighbour’s node features’ correlation coefficient, higher values (red colour) reveal closer relation with the target node; the box plot of 42 neighbours indicates that the high-risk neighbours (blue box) have higher edge weights median. (F) Node features’ correlation heatmaps and edge weights distribution of patient No. 182: The box plot of 25 neighbours indicates that the low-risk neighbours (orange box) have higher edge weights median.
Tables
Table 1
Feature distribution in the total patient cohorts, training and validation cohorts and the test cohorts.
| TRAIN and VAL(n=1492) | TEST(n=213) | EXTERNAL(n=127) | ||||
|---|---|---|---|---|---|---|
| Feature | Content | Mean, SD, 95% CI/Count, % | p | Mean, SD, 95% CI/Count, % | p | |
| Age | Age | 60.6, 8.7, (CI: 60.1, 61.0) | 60.7, 9.5, (CI: 59.4, 62.0) | >0.05 | 68.7, 9.1, (CI: 67.2, 70.1) | <0.01** |
| Sex | Female no. (%); Male no. (%) | 602 (33.3); 890 (66.7) | 93 (33.3); 120 (66.7) | >0.05 | 32 (25.2); 95 (74.8) | <0.01** |
| Resection | Sublobar resection no. (%); Lobectomy no. (%); Bilobectomy no. (%); Pneumonectomy no. (%) | 123 (8.2); 1292 (86.6); 59 (3.95); 18 (1.2) | 23 (10.8); 180 (84.5); 7 (3.3); 3 (1.4) | >0.05 | / | / |
| Histology | Adenocarcinoma no. (%); Squamous Cell Carcinoma no. (%); Others no. (%) | 1072 (71.4); 351 (23.5); 69 (4.6) | 163 (76.5); 40 (18.8); 10 (4.7) | >0.05 | 95 (74.8); 30 (23.6); 2 (1.6) | >0.05 |
| Tumour location | LUL no. (%); LLL no. (%); RUL no. (%); RML no. (%); RLL no. (%) | 384 (25.7); 211 (14.1); 504 (33.8); 146 (9.8); 247 (16.6) | 51 (23.9); 37 (17.4); 79 (37.1); 15 (7.0) 31 (14.6) | >0.05 | 30 (23.6); 22 (17.3); 46 (36.2); 15 (11.8); 14 (11.0). | >0.05 |
| Tumour size | Tumour size | 2.68, 1.38, (CI: 2.61, 2.75) | 2.55, 1.25, (CI: 2.38, 2.71) | >0.05 | / | / |
| pTNM stage | Stage I no. (%); Stage II no. (%); | 1219 (81.7); 273 (18.3) | 179 (84.0); 34 (16.0) | >0.05 | 97 (76.3); 30 (23.7) | <0.01** |
| RFS status | RFS no. (%) | 1089 (73.0) | 154 (72.3) | >0.05 | 75 (59.1) | >0.05 |
| RFS month | RFS month | 57.5, 24.5, (CI: 56.2, 58.7) | 58.4, 23.4, (CI: 55.2, 61.5) | >0.05 | 39.5, 26.9, (CI: 34.8, 44.2) | <0.01** |
| OS status | OS no. (survival %) | 1166 (78.2) | 167 (78.4) | >0.05 | 87 (68.5) | >0.05 |
| OS month | OS month | 62.4, 19.9, (CI: 61.4, 63.4) | 63.4, 18.4, (CI: 60.9, 65.9) | >0.05 | 44.8, 27.8, (CI: 40.9, 50.0) | <0.01** |
Additional files
-
Supplementary file 1
Ethnicity and Smoking information table of the external dataset.
- https://cdn.elifesciences.org/articles/80547/elife-80547-supp1-v1.docx
-
MDAR checklist
- https://cdn.elifesciences.org/articles/80547/elife-80547-mdarchecklist1-v1.pdf
Download links
A two-part list of links to download the article, or parts of the article, in various formats.
Downloads (link to download the article as PDF)
Open citations (links to open the citations from this article in various online reference manager services)
Cite this article (links to download the citations from this article in formats compatible with various reference manager tools)
Early stage NSCLS patients’ prognostic prediction with multi-information using transformer and graph neural network model
eLife 11:e80547.
https://doi.org/10.7554/eLife.80547


