Retinopathy of prematurity: Metabolic risk factors
- Department of Ophthalmology, Boston Children’s Hospital, Harvard Medical School, United States
- The Sahlgrenska Centre for Pediatric Ophthalmology Research, Department of Clinical Neuroscience, Institute of Neuroscience and Physiology, Sahlgrenska Academy, University of Gothenburg, Sweden
Figures
Figure 1
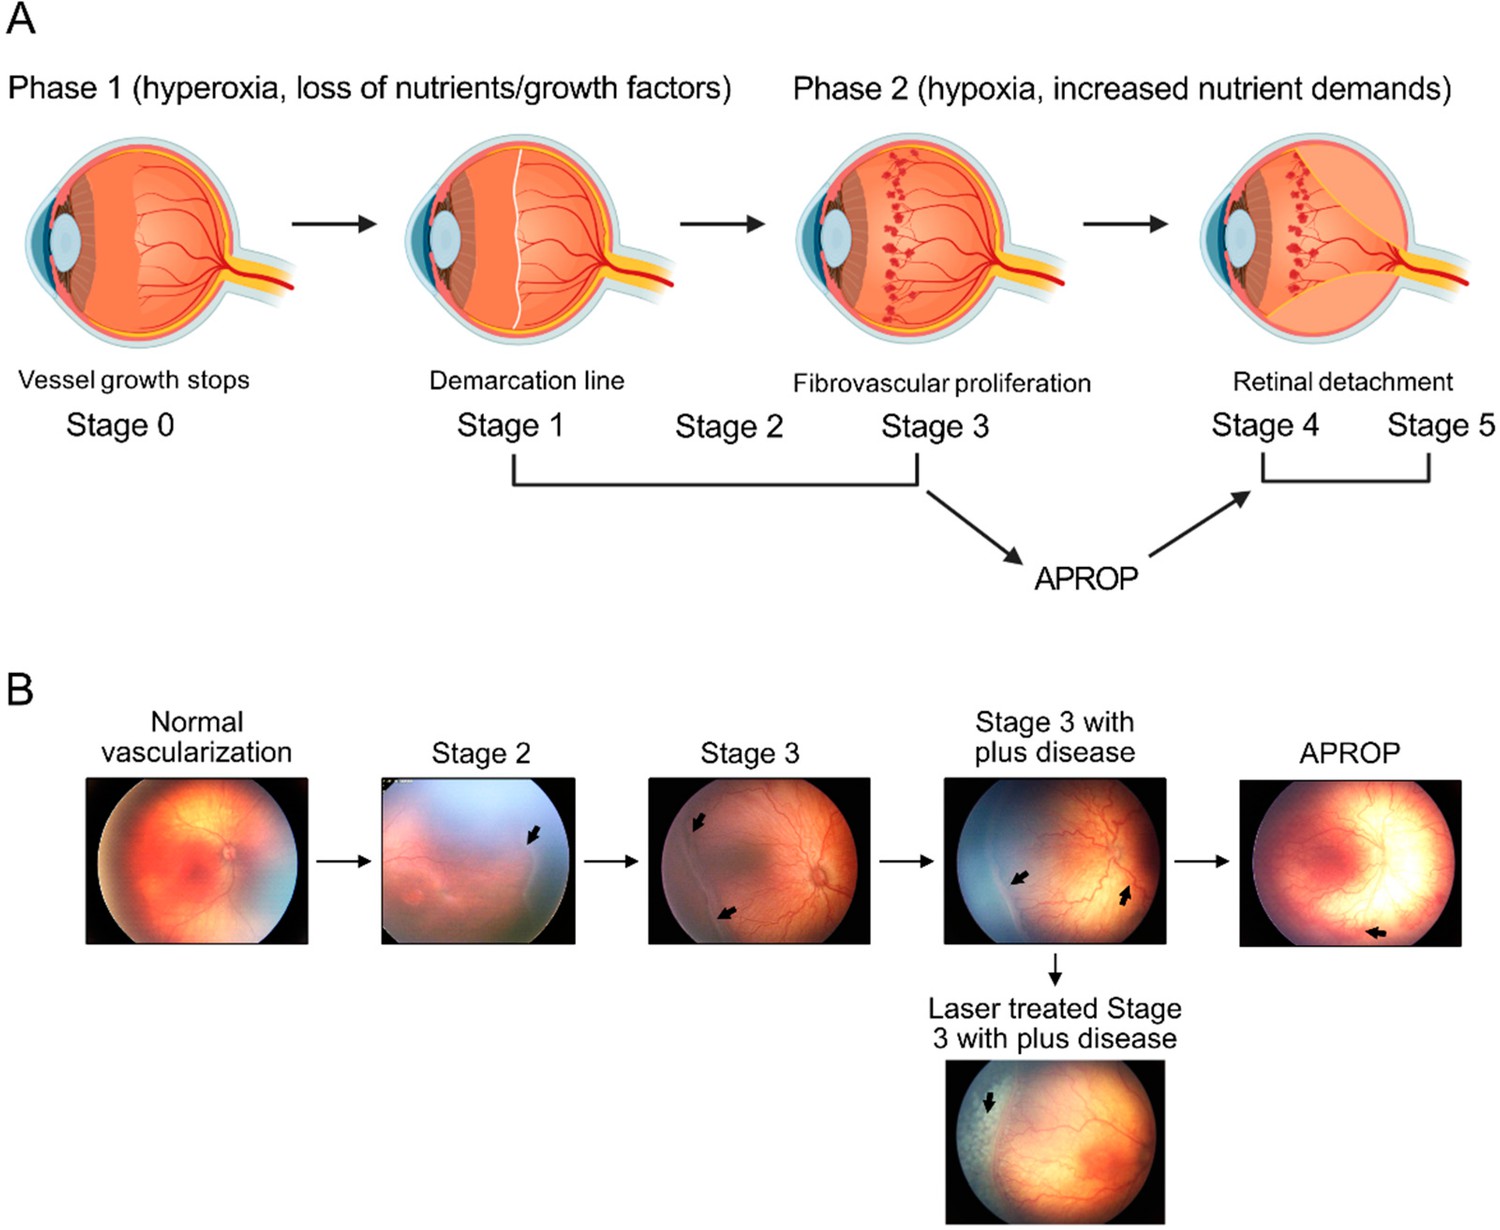
Schematics of ROP development (A) and illustration of human ROP development.
In ROP, hyperglycemia and hyperoxia causes retinal vessel growth cessation (Phase 1). As the neural retina matures, increasing nutrient and oxygen demand triggers retinal neovessel growth (Phase 2). Human neovascular ROP (Phase 2) develops through the following stages: stage 2 with ridge (arrow), stage 3 with neovascularization and hemorrhage (arrows), stage 3 with plus disease (dilation and tortuosity of vessels) (arrow), Aggressive posterior ROP (APROP) with central changes (arrow) is particularly pathological. Laser treatment (arrow) of stage 3 ROP is illustrated. Figure was reproduced from Figure 1 from Tomita et al., 2021b.
Figure 2
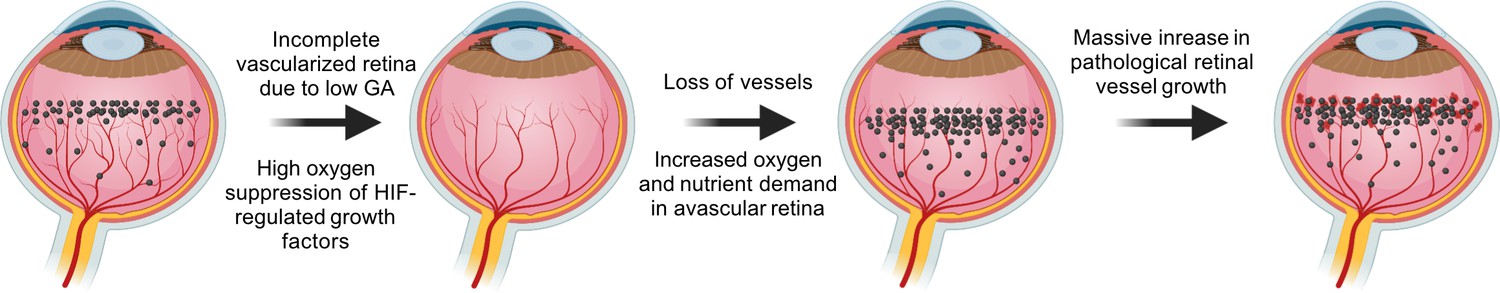
VEGF in the pathogenesis of ROP.
During normal retinal vascular development, growth factor like VEGF (black dots) is found anterior to the developing vasculature driving the normal retinal vessel development forward. After preterm birth, in Phase I ROP, hyperoxia suppresses HIF-regulated growth factor (VEGF) production, causing vaso-obliteration and vessel growth cessation. As the retina matures with increasing metabolic demand, the non-perfused peripheral retina becomes hypoxic and nutrient deprived and overproduces growth factors (VEGF). Neovascularization occurs in response to high levels of growth factors. Images were created using BioRender, adapted and modified from ‘retina’, ‘dots’ by BioRender.com (2022).
Figure 3

Schematics of mouse oxygen-induced retinopathy (OIR) and hyperglycemia-associated retinopathy (HAR).
In OIR, mouse pups and the nursing dam are exposed to 75% oxygen from postnatal day (P) 7 for 5 days causing vessel loss and cessation of vessel growth and returned to room air where the avascular retina becomes hypoxic and causes neovascularization. There is also a metabolic model of suppression of retinal vessel growth as seen in Phase I ROP. In HAR, mouse pups are given low dose streptozotocin (STZ 50 mg/kg) daily from P1 to P9, causing hyperglycemia which suppresses normal vascular development examined at P10. Images were created using BioRender, adapted and modified from “mouse” by BioRender.com (2022).
Figure 4
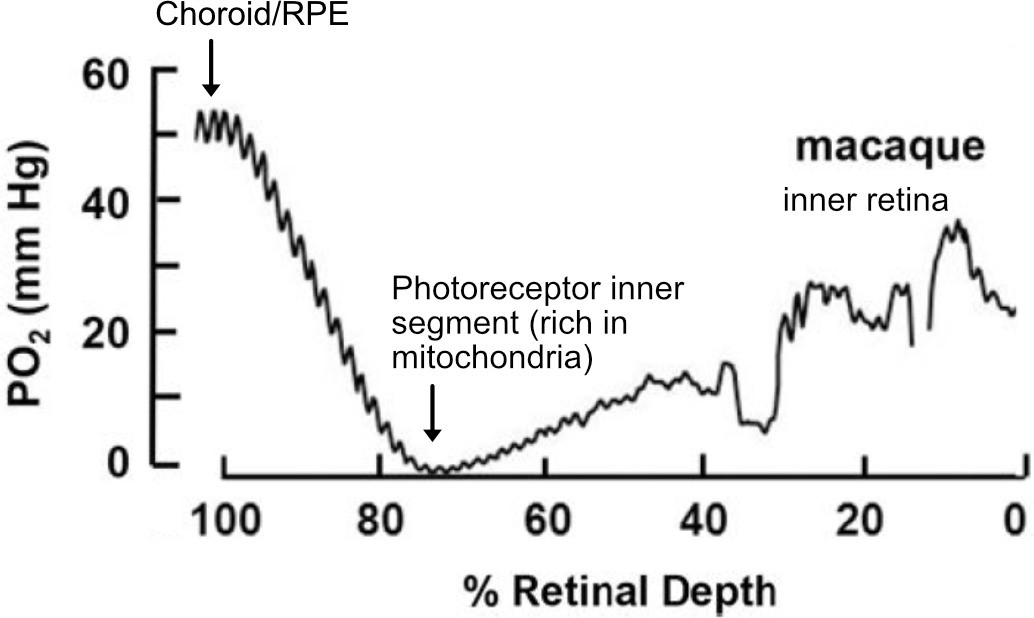
O2 profiles through the dark-adapted retina of rhesus monkey.
A retinal depth of zero is the vitreoretinal border and 100% is the RPE-choroid border. The lowest oxygen tension is found in the layer containing photoreceptor inner segments with very high mitochondrial density. Rising oxygen tension across the inner retinal layers is due to three layers of inner retinal vasculature. Figure was reproduced from Figure 1 from Linsenmeier and Zhang, 2017. License number 5416050680408.
Figure 5
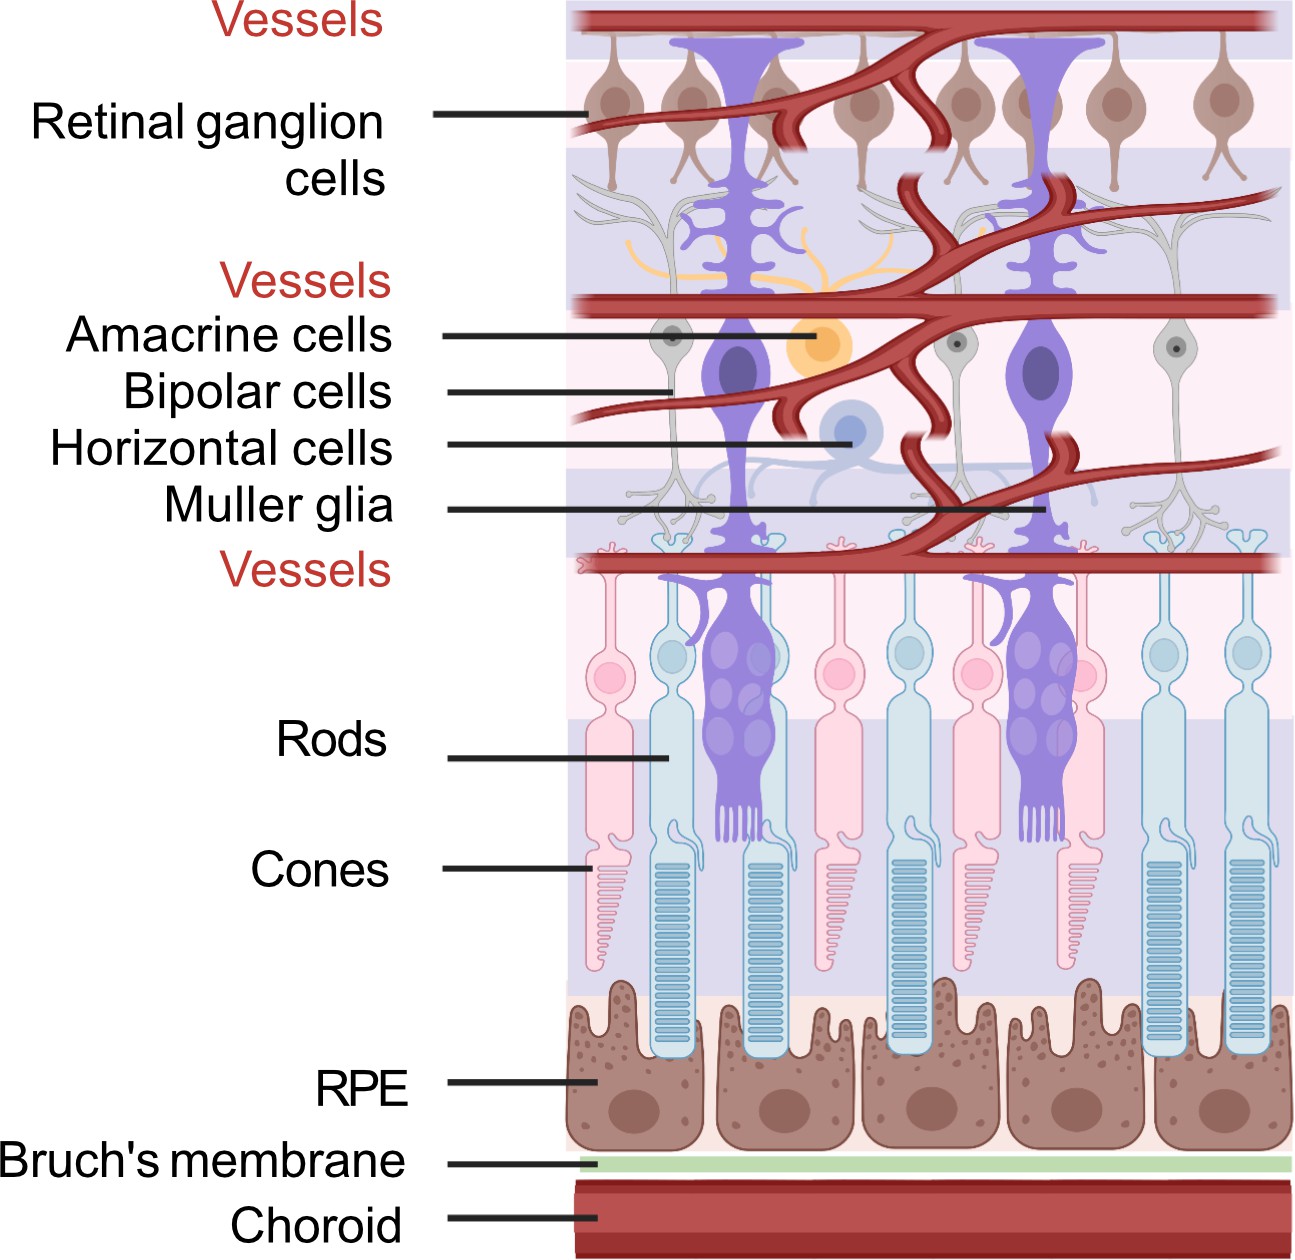
Schematic of retinal neuronal and vascular structure.
RGC, retinal ganglion cells, RPE, retinal pigment epithelium. Images were created using BioRender, adapted and modified from ‘eye’, ‘retinal cell’, ‘generic branching vessel’ by BioRender.com (2022).
Tables
Table 1
Summary of metabolic risk factors for ROP.
| Risk factors | Comparison | Outcomes | References |
|---|---|---|---|
| DHA | no ROP, mild or moderate ROP (stage 1–2), or severe ROP (stage 3 and type 1). | High serum DHA correlated with less severe ROP, only in infants with sufficiently high ARA levels | Hellström et al., 2021b |
| Enteral DHA vs. placebo | No difference in any stage of ROP, but DHA lowered the relative risk for severe ROP. | Bernabe-García et al., 2019 | |
| ARA | ROP vs. no ROP | Low serum ARA correlated with ROP development | Löfqvist et al., 2018 |
| DHA +ARA | Enteral DHA +ARA vs. no supplementation | DHA:ARA at 1:2 ratio lowered severe ROP (stage 3 and/or type 1). | Hellström et al., 2021a |
| Metabolites | ROP vs. no ROP | Higher levels of glycolytic intermediates (pyruvate, lactate), lower levels of TCA metabolites (citrate, aconitate, succinyl carnitine), higher malonyl carnitine (C3DC), glycine in ROP | Yang et al., 2022; Yang et al., 2020 |
| Insulin | No or mild ROP (1–2) vs. severe ROP (3-4) | Insulin exposure was a stronger predictor for severe ROP than hyperglycemia per se | Kaempf et al., 2011 |
| No or mild ROP vs severe ROP (needing treatment) | Blood glucose >150 mg/ml and insulin exposure associated with severe ROP | Lee et al., 2016 | |
| IGF-1 | No ROP, ROP (1,2, 3-4) | Low plasma IGF-1 correlated with high glucose levels and increased ROP severity | Cakir et al., 2020 |
| APN | No ROP stage vs. any ROP | Low serum APN correlated with ROP; serum APN positively correlated with serum DHA | Fu et al., 2015a |
| Plasma glucose tertiles and retinal vascular coverage in preterm infants | Low serum APN correlated with high glucose levels and delayed retinal vascularization | Fu et al., 2018a |
Table 2
Summary of current or potential treatments for Phase II ROP.
| Drug & dose | Sample size | Outcomes | References |
|---|---|---|---|
| Anti-VEGF (intravitreal) | |||
| Bevacizumab (0.625 mg) | 150 infants (BW <1500 g, GA <30 weeks) | Benefits zone I not zone II posterior stage 3+ROP | Mintz-Hittner et al, N Engl J Med. 2011 Feb 17;364(7):603–15. |
| Bevacizumab (0.25 mg, 0.125 mg, 0.063 mg, 0.031 mg) | 61 infants (mean BW = 709 g, mean GA = 24.9 weeks) | ROP regression by 6 months corrected age and very good retinal structure | Wallace et al, Ophthalmology. 2018 December; 125(12): 1961–1966. |
| Ranibizumab (0.12 mg and 0.2 mg) | 19 infants (mean GA = 36.4 weeks) | Required no rescue therapy; systemic VEGF levels not suppressed. | Stahl et al, JAMA Pediatr. 2018 Mar 1;172(3):278–286. |
| Conbercept (0.15 mg) | 20 infants (mean BW = 1297.5 g, mean GA = 28.6 weeks) | Complete regression of retinopathy and retinal vascularization to zone III | Cheng et al, Sci Rep. 2018 Jul 16;8 (1):10732. |
| Aflibercept (0.4 mg) | 118 infants (GA <32 weeks) | Rescue treatment required in 4.8% aflibercept group vs 11.1% with laser. Serious adverse event rates were similar. | Stahl et al, JAMA. 2022 Jul 26;328(4):348–359. |
| Dexamethasone | |||
| Eye drop (1 mg/ml, 1 drop daily) | 48 premature infants | Reduced laser ablation | Öhnell et al, Ophthalmol Retina. 2022 Feb;6 (2):181–182. |
| Antenatal systemic dexamethasone | 63 infants (mean BW = 981 g, mean GA = 27.8 weeks) | Decreased incidence of ROP of stage 2 or higher | Higgins et al, Arch Ophthalmol. 1998 May;116(5):601–5. |
| ≤1.8 mg/kg (low cumulative) or >1.8 mg/kg (high cumulative) body weight (via bolus intravenous infusion) | 115 infants (BW ≤1250 g, GA ≤32 weeks) | No association between dexamethasone and severe ROP incidence | Cuculich et al, Biol Neonate. 2001 Jan;79(1):9–14. |
| 0–0.9 mg/kg or 0–0.73 mg/kg (accumulative, systemic) | 74 infants (GA <28 weeks) | Higher dose was associated with severe ROP | Pediatr Neonatol. 2022 May;63(3):220–226 |
| Platelets | |||
| Low Platelets | 202 preterm infants (GA <34 weeks) | Less incidence of ROP with higher platelet count | Cakir et al, JCI Insight. 2018 Oct 4;3 (19):e99448 |
| Platelet transfusion | 136 infants (Mean GA = 25.3 weeks, mean BW = 782 g) | Less incidence of ROP | Faheem et al, Annals of R.S.C.B., 2021, 25 (6): 5442–5448 |
Download links
A two-part list of links to download the article, or parts of the article, in various formats.
Downloads (link to download the article as PDF)
Open citations (links to open the citations from this article in various online reference manager services)
Cite this article (links to download the citations from this article in formats compatible with various reference manager tools)
Retinopathy of prematurity: Metabolic risk factors
eLife 11:e80550.
https://doi.org/10.7554/eLife.80550


