Channel-independent function of UNC-9/Innexin in spatial arrangement of GABAergic synapses in C. elegans
- Department of Zoology, University of British Columbia, Canada
- Life Sciences Institute, University of British Columbia, Canada
- Department of Neuroscience, University of Connecticut Health Center, United States
- Graduate Program in Cell and Developmental Biology, University of British Columbia, Canada
- Janelia Research Campus, Howard Hughes Medical Institute, United States
- Djavad Mowafaghian Centre for Brain Health, University of British Columbia, Canada
Figures
Figure 1 with 2 supplements
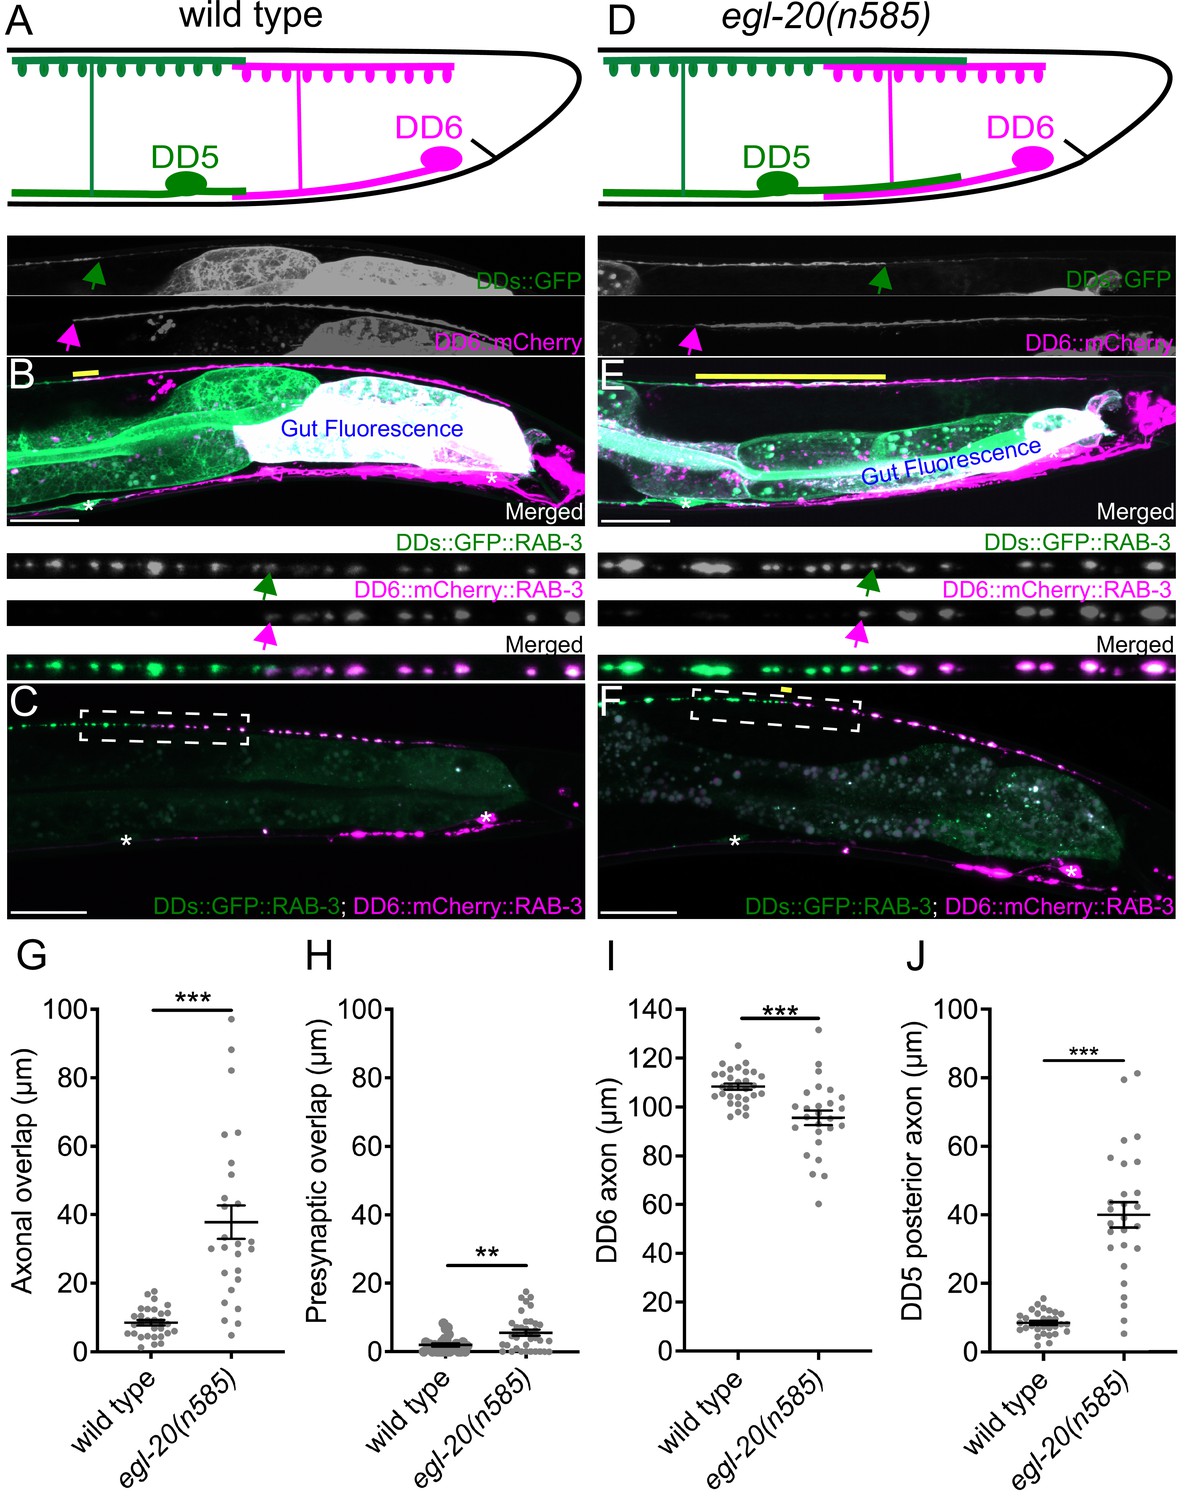
egl-20/wnt is required for axonal tiling between dorsal D-type 5 (DD5) and dorsal D-type 6 (DD6) neurons.
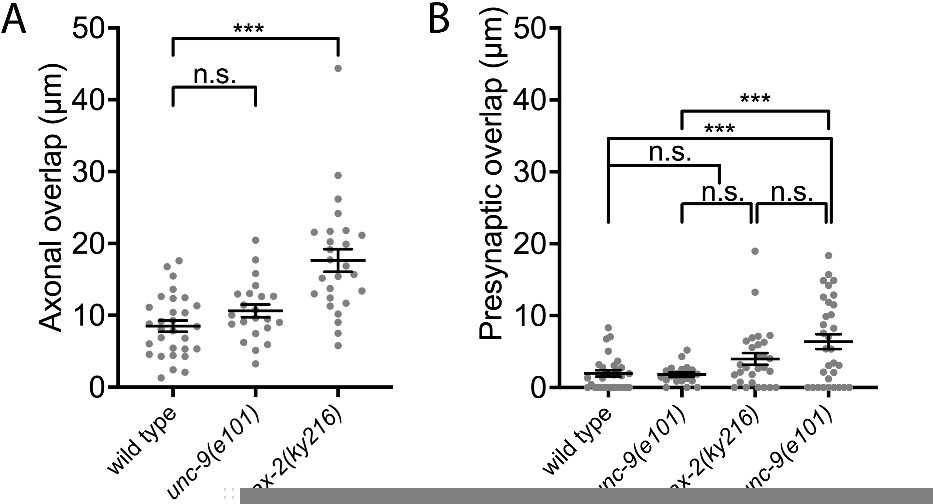
(A) Schematic of axonal, dendritic, and presynaptic tiling between DD5 and DD6 in wild type. (B) Representative image of axonal tiling in wild type animals. Yellow line represents region of axonal overlap between DD5 and DD6. Green arrow indicates the end of DD5 posterior axon (top panel). Magenta arrow indicates the end of DD6 anterior axon (middle panel). (C) Representative image of presynaptic tiling in wild type animals. The magnified straightened image of the presynaptic tiling border, indicated by the dashed box, is shown above. Green arrow indicates the most posterior DD5 synapse (top panel). Magenta arrow indicates the most anterior DD6 synapse (middle panel). (D) Schematic of axonal and dendritic overlap between DD5 and DD6 of the egl-20(n585) mutant. (E) Representative image of axonal tiling in egl-20(n585) mutant animals. Yellow line represents region of axonal overlap between DD5 and DD6. Green arrow indicates the end of DD5 posterior axon (top panel). Magenta arrow indicates the end of DD6 anterior axon (middle panel). (F) Representative image of presynaptic tiling in the egl-20(n585) mutant. Yellow line represents region of presynaptic overlap between DD5 and DD6. The magnified straightened image of the presynaptic tiling border, indicated by the dashed box, is shown above. Green arrow indicates the most posterior DD5 synapse (top panel). Magenta arrow indicates the most anterior DD6 synapse (middle panel). Asterisks: DD5 and DD6 cell bodies. Scale bar: 20 µm. (G) Quantification of axonal overlap between DD5 and DD6. See Figure 1—source data 1. (H) Quantification of presynaptic overlap between DD5 and DD6. See Figure 1—source data 2. (I) Quantification of DD6 axonal length. See Figure 1—source data 3. (J) Quantification of DD5 posterior axonal length. See Figure 1—source data 4. See Figure 1—figure supplement 1A for the definition of the DD5 posterior axon. Each dot represents a single animal. See source data for sample size and individual value. Black bars indicate mean ± SEM. **p<0.01; ***p<0.001.
-
Figure 1—source data 1
Quantification of axonal overlap between DD5 and DD6.
- https://cdn.elifesciences.org/articles/80555/elife-80555-fig1-data1-v1.xlsx
-
Figure 1—source data 2
Quantification of overlap between DD5 and DD6 presynaptic domains.
- https://cdn.elifesciences.org/articles/80555/elife-80555-fig1-data2-v1.xlsx
-
Figure 1—source data 3
Quantification of DD6 axon length.
- https://cdn.elifesciences.org/articles/80555/elife-80555-fig1-data3-v1.xlsx
-
Figure 1—source data 4
Quantification of DD5 posterior axon length.
- https://cdn.elifesciences.org/articles/80555/elife-80555-fig1-data4-v1.xlsx
Figure 1—figure supplement 1

Posterior overextension of dorsal D-type 5 (DD5) posterior dendrite and postsynaptic domain in the egl-20(n585) mutant.
(A) Schematic of posterior axon, dendrite, and postsynaptic sites of DD5 neuron in wild type. Green puncta represent DD5 postsynaptic sites. We defined the posterior axon of DD5 (Figure 1J) as DD5 axonal region posterior to the DD5 cell body. The length of the posterior DD5 postsynaptic domains was defined as a distance from the posterior end of DD5 cell body to the most posterior ACR-12::GFP punctum. (B) Representative image of posterior DD5 neurites labeled with mCherry::CAAX and postsynaptic sites labeled with ACR-12::GFP in wild type. Magnified straightened images of the DD5 posterior dendrite and postsynaptic sites, indicated by the dashed box, are shown above. Blue arrow indicates the tip of DD5 posterior dendrite. Orange arrowheads indicate the ACR-12 puncta. (C) Representative image of posterior DD5 axon and dendrite labeled with GFP::CAAX in wild type. DD5 posterior axon and dendrite are indicated with the yellow lines. (D) Representative image of ACR-12::GFP in the DD5 posterior dendrite of wild type. The postsynaptic domain is indicated with an orange line. Magnified straightened images of ACR-12::GFP puncta are shown above. Orange arrowheads indicate the ACR-12 puncta. (E) Schematic of posterior axon, dendrite, and postsynaptic sites of DD5 neuron in egl-20(n585) mutant. Green puncta represent DD5 postsynaptic sites. (F) Representative image of posterior DD5 neurites labeled with mCherry::CAAX and postsynaptic sites labeled with ACR-12::GFP in egl-20(n585) mutant. Magnified straightened images of the DD5 posterior dendrite and postsynaptic sites, indicated by the dashed box, are shown above. Blue arrow indicates the tip of the DD5 posterior dendrite. Orange arrowheads indicate the ACR-12 puncta. (G) Representative image of posterior DD5 axon and dendrite labeled with GFP::CAAX in the egl-20(n585) mutant. The DD5 posterior axon and dendrite are indicated by yellow lines. (H) Representative image of ACR-12::GFP in the DD5 posterior dendrite of egl-20(n585) mutant. The postsynaptic domain is indicated with an orange line. Magnified straightened images of ACR-12::GFP puncta are shown above. Orange arrowheads indicate the ACR-12 puncta. Asterisks: DD5 cell bodies. Scale bar: 20 µm. (I) Quantification of DD5 posterior dendrite length. Note that animals expressing GFP::CAAX from an integrated transgene (C and G) are used for this quantification. See Figure 1—figure supplement 1—source data 1. (J) Quantification of the DD5 postsynaptic domain length. See Figure 1—figure supplement 1—source data 2. Each dot represents a single animal. See source data for sample size and individual value. Black bars indicate mean ± SEM. ***p<0.001.
-
Figure 1—figure supplement 1—source data 1
Quantification of DD5 posterior dendrite length.
- https://cdn.elifesciences.org/articles/80555/elife-80555-fig1-figsupp1-data1-v1.xlsx
-
Figure 1—figure supplement 1—source data 2
Quantification of DD5 postsynaptic domain length.
- https://cdn.elifesciences.org/articles/80555/elife-80555-fig1-figsupp1-data2-v1.xlsx
Figure 1—figure supplement 2

The effects of egl-20 and unc-9 on axonal and dendritic length.
(A) Quantification of axonal overlap between dorsal D-type 5 (DD5) and dorsal D-type 6 (DD6). See Figure 1—figure supplement 2—source data 1. (B) Quantification of DD6 axonal length. See Figure 1—figure supplement 2—source data 2. (C) Quantification of DD5 posterior axonal length. See Figure 1—figure supplement 2—source data 3. (D) Quantification of DD5 posterior dendrite length. See Figure 1—figure supplement 2—source data 4. Each dot represents a single animal. See source data for sample size and individual value. Black bars indicate mean ± SEM. n.s.: not significant; ***p<0.001.
-
Figure 1—figure supplement 2—source data 1
Quantification of axonal overlap between DD5 and DD6.
- https://cdn.elifesciences.org/articles/80555/elife-80555-fig1-figsupp2-data1-v1.xlsx
-
Figure 1—figure supplement 2—source data 2
Quantification of DD6 axon length.
- https://cdn.elifesciences.org/articles/80555/elife-80555-fig1-figsupp2-data2-v1.xlsx
-
Figure 1—figure supplement 2—source data 3
Quantification of DD5 posterior axon length.
- https://cdn.elifesciences.org/articles/80555/elife-80555-fig1-figsupp2-data3-v1.xlsx
-
Figure 1—figure supplement 2—source data 4
Quantification of DD5 posterior dendrite length.
- https://cdn.elifesciences.org/articles/80555/elife-80555-fig1-figsupp2-data4-v1.xlsx
Figure 2 with 7 supplements
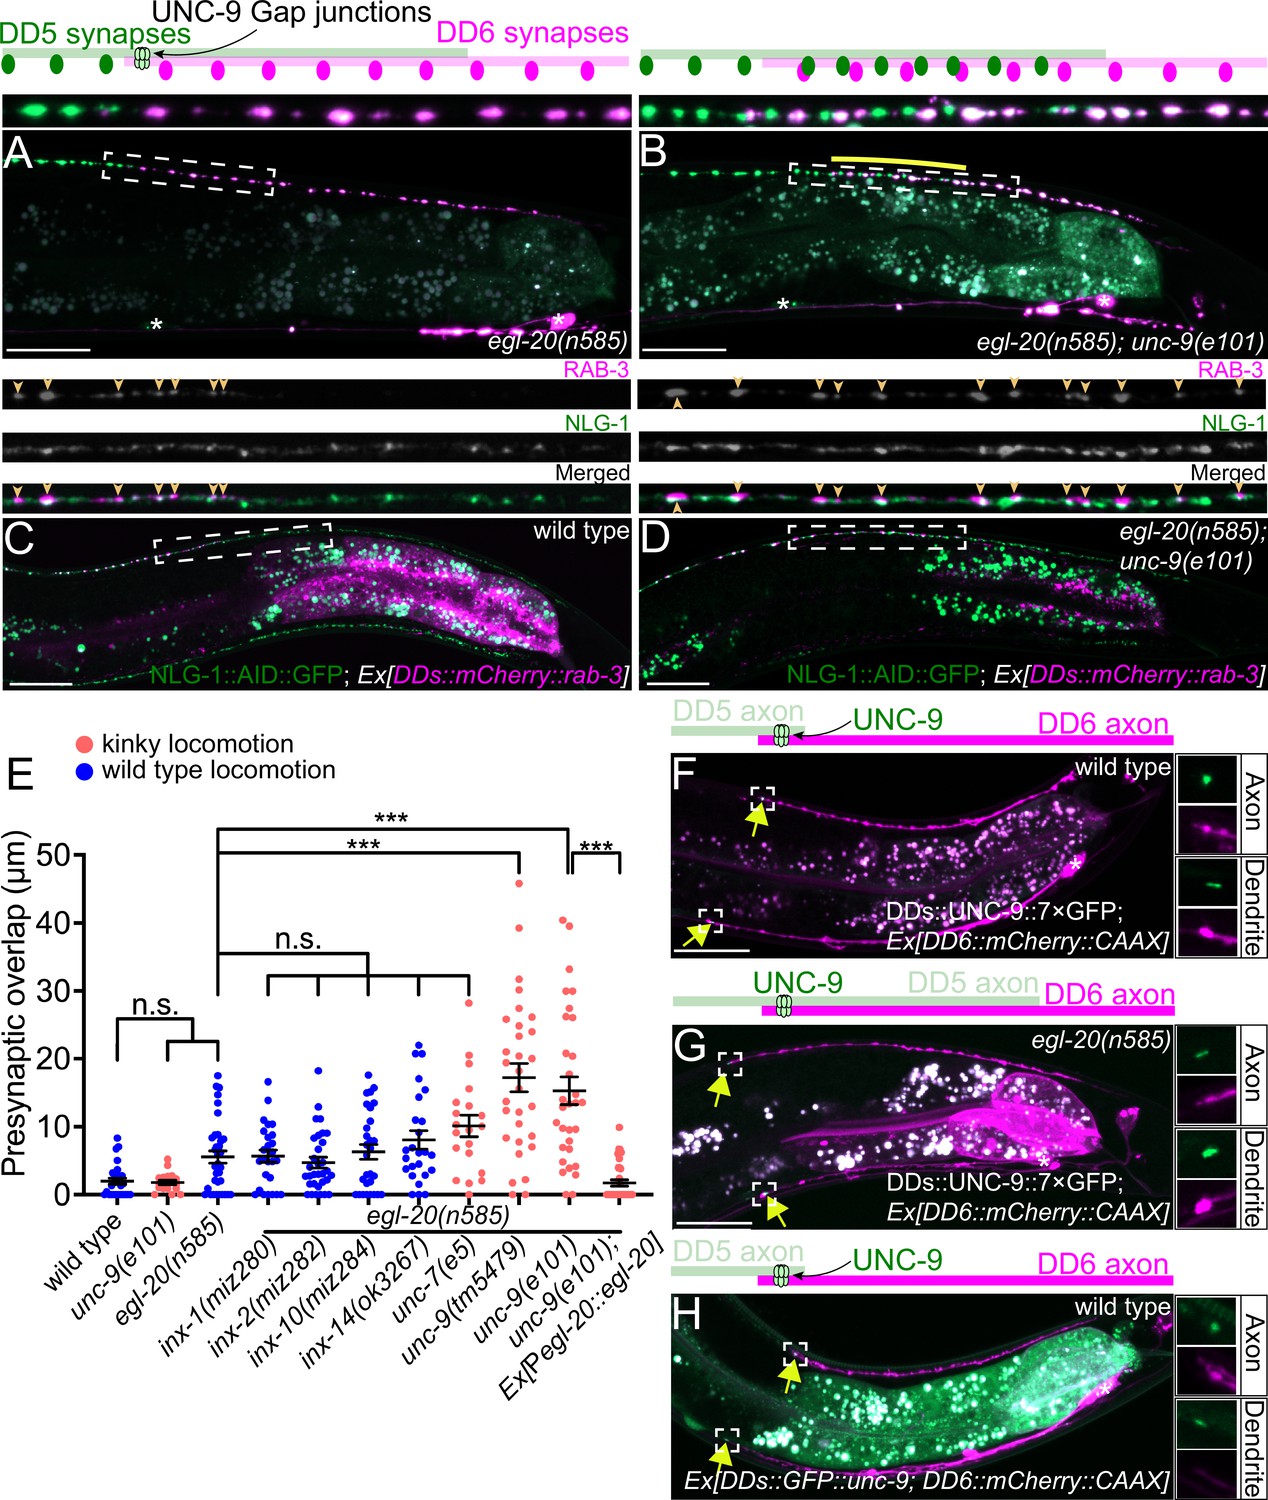
UNC-9/INX is localized at the presynaptic tiling border and is required for presynaptic tiling between dorsal D-type 5 (DD5) and dorsal D-type 6 (DD6) neurons.
(A–B) Representative images of presynaptic tiling in the egl-20(n585) (A), and egl-20(n585); unc-9(e101) (B) mutants. The magnified images of the presynaptic tiling border and their schematics (indicated by dashed box) are shown above. Yellow line indicates region of presynaptic overlap between DD5 and DD6. (C–D) Representative images of mCherry::RAB-3 expressed in DD5 and endogenous NLG-1::AID::GFP in wild type (C) and egl-20(n585); unc-9(e101) double mutant (D). Dashed boxes indicate the region straightened for mCherry::RAB-3 (top panels), NLG-1::AID::GFP (middle panels), and merged channels (bottom panels) shown above. Yellow arrowheads indicate mCherry::RAB-3 puncta. (E) Quantification of presynaptic overlap between DD5 and DD6. See Figure 2—source data 1. Each dot represents a single animal. See source data for sample size and individual value. Black bars indicate mean ± SEM. n.s.: not significant; ***p<0.001. (F–G) Representative image of UNC-9::7×GFP localization at the anterior tip of the DD6 axon and dendrite (indicated by yellow arrows) in wild type (F) and egl-20(n585) mutant (G). (H) Representative image of GFP::UNC-9 localization at the anterior tip of the DD6 axon and dendrite (indicated by yellow arrows) in wild type. The magnified UNC-9::7×GFP (F, G) and GFP::UNC-9 (H) puncta and mCherry::CAAX signals in the anterior tip of DD6 axon and dendrite, indicated by the dashed boxes, are shown to the right of the merged images. Asterisks: DD5 and DD6 cell bodies. Scale bar: 20 µm.
-
Figure 2—source data 1
Quantification of overlap between DD5 and DD6 presynaptic domains.
- https://cdn.elifesciences.org/articles/80555/elife-80555-fig2-data1-v1.xlsx
Figure 2—figure supplement 1

Quantification of the presynaptic tiling defect between dorsal D-type 5 and dorsal D-type 6 in the mutants of known gap junction effectors and presynaptic tiling regulators.
Each dot represents a single animal. See Figure 2—figure supplement 1—source data 1. Black bars indicate mean ± SEM. n.s.: not significant.
-
Figure 2—figure supplement 1—source data 1
Quantification of overlap between DD5 and DD6 presynaptic domains.
- https://cdn.elifesciences.org/articles/80555/elife-80555-fig2-figsupp1-data1-v1.xlsx
Figure 2—figure supplement 2

RAB-3 puncta in the dorsal D-type 5 (DD5) axon represent bona fide synapses.
(A–B) Representative images of animals expressing mCherry::RAB-3 and cytoplasmic 2×mTagBFP2 in DD5 with endogenous NLG-1::AID::GFP in wild type (A) and egl-20(n585); unc-9(e101) double mutant (B). Yellow arrowheads indicate mCherry::RAB-3 puncta. Straightened and magnified images of cytoplasmic 2×mTagBFP2 (top panel), mCherry::RAB-3 (second panel), NLG-1::AID::GFP (third panel), and merged channels (bottom panel) are shown above. Dashed boxes indicate the straightened and magnified region of the dorsal nerve cord. Black bracket on top of panel (B) indicates the most posterior DD5 axonal region that lacks RAB-3 puncta. Yellow arrowheads indicate the mCherry::RAB-3 puncta in the DD5 axon. (C–D) Representative images of animals expressing BFP::RAB-3 in DD5, UNC-10::tdTomato in the GABAergic neurons, and NLG-1::YFP in the postsynaptic body wall muscles (Maro et al., 2015) in wild type (C) and egl-20(n585); unc-9(e101) double mutant (D). Yellow arrowheads indicate BFP::RAB-3 puncta in the DD5 axon. Straightened and magnified images of BFP::RAB-3 (top panel), UNC-10::tdTomato (second panel), NLG-1::YFP (third panel), and merged channels (bottom panel) are shown above. Dashed boxes indicate the straightened and magnified region of the dorsal nerve cord. Green and magenta lines represent the DD5 and DD6 presynaptic domains, respectively. Scale bar: 20 µm.
Figure 2—figure supplement 3

Axonal and presynaptic tiling defects at the L2 stage.
(A–B) Representative images of axonal tiling in wild type (A) and the egl-20(n585) mutant (B) animals at the L2 stage. Yellow lines indicate the region of axonal overlap between dorsal D-type 5 (DD5) and dorsal D-type 6 (DD6). Straightened and magnified images of DDs::GFP (top panel), DD6::mCherry (middle panel), and merged channels (bottom panel) are shown above. Green arrow indicates the end of DD5 axon (top panel). Magenta arrow indicates the end of DD6 axon (middle panel). Dashed boxes indicate the magnified region of the dorsal nerve cord. (C–D) Representative images of presynaptic tiling in the egl-20(n585) (C), and egl-20(n585); unc-9(e101) (D) mutants at the L2 stage. Yellow line indicates the region of presynaptic overlap between DD5 and DD6. Magnified images of DDs::GFP::RAB-3 (top panel), DD6::mCherry::RAB-3 (middle panel), and merged channels (bottom panel) are shown above. Green arrow indicates the most posterior DD5 synapses (top panel). Magenta arrow indicates the most anterior DD6 synapses (middle panel). Dashed boxes indicate the magnified region of the dorsal nerve cord. Scale bar: 20 µm. Asterisks: DD5 and DD6 cell bodies. (E) Quantification of axonal overlap between DD5 and DD6. See Figure 2—figure supplement 3—source data 1. (F) Quantification of presynaptic overlap between DD5 and DD6. See Figure 2—figure supplement 3—source data 2. Each dot represents a single animal. See source data for sample size and individual value. Black bars indicate mean ± SEM. **p<0.01; ***p<0.001.
-
Figure 2—figure supplement 3—source data 1
Quantification of axonal overlap between DD5 and DD6.
- https://cdn.elifesciences.org/articles/80555/elife-80555-fig2-figsupp3-data1-v1.xlsx
-
Figure 2—figure supplement 3—source data 2
Quantification of overlap between DD5 and DD6 presynaptic domains.
- https://cdn.elifesciences.org/articles/80555/elife-80555-fig2-figsupp3-data2-v1.xlsx
Figure 2—figure supplement 4

Heat-shock-induced expression of unc-9 at L2 stage did not rescue presynaptic tiling defect of egl-20(n585); unc-9(e101).
Quantification of presynaptic tiling defect. See Figure 2—figure supplement 4—source data 1. Each dot represents a single animal. Black bars indicate mean ± SEM. n.s.: not significant; ***p<0.001.
-
Figure 2—figure supplement 4—source data 1
Quantification of overlap between DD5 and DD6 presynaptic domains.
- https://cdn.elifesciences.org/articles/80555/elife-80555-fig2-figsupp4-data1-v1.xlsx
Figure 2—figure supplement 5

UNC-9/INX localization at the anterior tip of the dorsal D-type 6 (DD6) dendrite and axon in L1 animals.
(A–B) Representative images of UNC-9::7×GFP localization at the anterior tip of the DD6 dendrite and axon (indicated by yellow arrows) in wild type (A) and the egl-20(n585) mutant (B) at the L1 stage. The magnified UNC-9::7×GFP puncta and mCherry::CAAX signals in the anterior tip of the DD6 axon and dendrite, indicated by dashed boxes, are shown to the right of the merged images. Note that at the L1 stage, the dorsal neurite is dendritic, and the ventral neurite is axonal. Asterisks: DD6 cell body. Scale bar: 20 µm.
Figure 2—figure supplement 6

UNC-9/INX localization in the mutants of egl-20(n585), zoo-1(tm4133), nlr-1(gk366849), and unc-104(e1265).
(A–C) Representative images of UNC-9::7×GFP localization in the anterior tip of the dorsal D-type 6 (DD6) axon and dendrite, indicated by yellow arrows, in the zoo-1(tm4133) (A), nlr-1(gk366849) (B), and unc-104(e1265) (C) mutants. The magnified UNC-9::7×GFP puncta and mCherry::CAAX signals in the anterior tip of the DD6 axon and dendrite, indicated by dashed boxes, are shown to the right of the merged images. Asterisks: DD6 cell bodies. Scale bar: 20 µm. (D) Quantification of axonal UNC-9::7×GFP signal intensity. See Figure 2—figure supplement 6—source data 1. Each dot represents a single animal. See source data for sample size and individual value.n.s.: not significant; **p<0.01; ***p<0.001.
-
Figure 2—figure supplement 6—source data 1
Quantification of UNC-9::7×GFP signal intensity at the tip of DD6 axon.
- https://cdn.elifesciences.org/articles/80555/elife-80555-fig2-figsupp6-data1-v1.xlsx
Figure 2—figure supplement 7

unc-9 mutant does not exhibit presynaptic tiling defect between dorsal-anterior 8 (DA8) and dorsal-anterior 9 (DA9) cholinergic motor neurons.
(A–C) Representative images of presynaptic tiling in wild type (A) and unc-9(101) (B), and plx-1(nc36) (C) mutant animals. The magnified straightened image of the presynaptic tiling border, indicated by the dashed boxes, is shown above. (D) Quantification of presynaptic overlap between DA8 and DA9. See Figure 2—figure supplement 7—source data 1. Each dot represents a single animal. See source data for sample size and individual value.n.s.: not significant; ***p<0.001. (E) Representative image of UNC-9::7×GFP localization in the DA9 axon and the distal dendrite. The magnified straightened images of the UNC-9::7×GFP and membrane-mCherry in the axonal region and distal dendrite, indicated by the dashed boxes, are shown above and below the image, respectively. Arrowheads indicate the perisynaptic UNC-9::7×GFP puncta at the presynaptic varicosities. Asterisk: DA9 cell body. Scale bar: 20 µm.
-
Figure 2—figure supplement 7—source data 1
Quantification of overlap between DA8 and DA9 presynaptic domains.
- https://cdn.elifesciences.org/articles/80555/elife-80555-fig2-figsupp7-data1-v1.xlsx
Figure 3

UNC-9/INX functions cell-autonomously to control presynaptic tiling between dorsal D-type 5 (DD5) and dorsal D-type 6 (DD6) neurons.
(A–B) Representative images of presynaptic tiling in the egl-20(n585); unc-9(e101) double mutants with pan-neuronal expression of unc-9 from the rgef-1 promoter (A), and DD-neuron-specific expression of unc-9 from the flp-13 promoter (B). The magnified straightened image of the presynaptic tiling border, indicated by the dashed box, is shown above. Yellow lines indicate region of presynaptic overlap between DD5 and DD6. Asterisks: DD5 and DD6 cell bodies. Scale bar: 20 µm. (C) Quantification of presynaptic overlap between DD5 and DD6. Tissue-specific promoters used in these experiments are rgef-1 (pan-neuronal), flp-13 (DDs), plx-2 (DD6), myo-3 (body wall muscles). See Figure 3—source data 1. Each dot represents a single animal. See source data for sample size and individual value. Black bars indicate mean ± SEM. n.s.: not significant; *p<0.05; ***p<0.001.
-
Figure 3—source data 1
Quantification of overlap between DD5 and DD6 presynaptic domains.
- https://cdn.elifesciences.org/articles/80555/elife-80555-fig3-data1-v1.xlsx
Figure 4 with 1 supplement
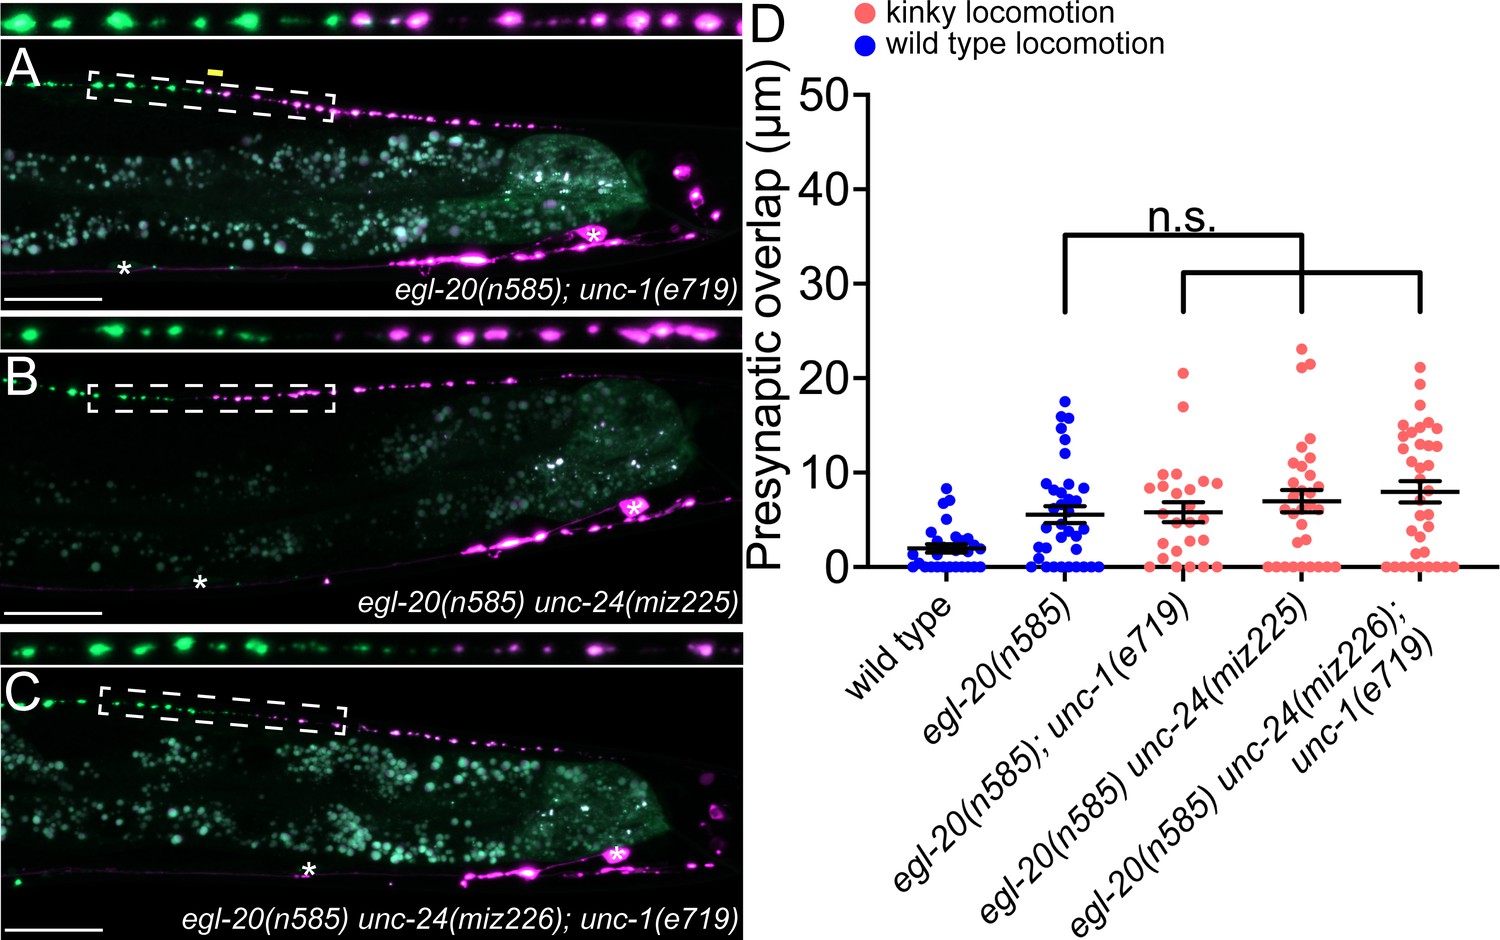
unc-1/stomatin is not required for presynaptic tiling between dorsal D-type 5 (DD5) and dorsal D-type 6 (DD6) neurons.
(A–B) Representative images of presynaptic tiling in the egl-20(n585); unc-1(e719) (A), egl-20(n585) unc-24(miz225) (B), and egl-20(n585) unc-24(miz226); unc-1(e719) (C) mutants. The magnified straightened images of the presynaptic tiling border, indicated by the dashed box, are shown above. Yellow line indicates region of presynaptic overlap between DD5 and DD6. Asterisks: DD5 and DD6 cell bodies. Scale bar: 20 µm. (D) Quantification of presynaptic overlap between DD5 and DD6. See Figure 4—source data 1. Each dot represents a single animal. See source data for sample size and individual value. Black bars indicate mean ± SEM. n.s.: not significant.
-
Figure 4—source data 1
Quantification of overlap between DD5 and DD6 presynaptic domains.
- https://cdn.elifesciences.org/articles/80555/elife-80555-fig4-data1-v1.xlsx
Figure 4—figure supplement 1

Locomotion defects of UNC-9-gap junction channel defective mutants.
(A-J) Representative stereoscope images of wild type (A), egl-20(n585) (B), unc-9(e101) (C), unc-1(e719) (D), unc-24(e448) (E), unc-9(syb3236 [unc-9ΔN18]) (F), unc-9(miz81 [unc-9::7×gfp11]) (G), unc-9(e101) Ex[neuronal::unc-9] (H), unc-9(e101) Ex[neuronal::unc-9(ΔN18)] (I), unc-9(e101) Ex[neuronal::unc-9::mTagBFP2] (J) mutants. Images were taken 5 min after four animals were placed onto the center of the nematode growth medium plates. Left images are the low magnification, and right images capture normal sinusoidal or kinky locomotion pattern of single animal.
Figure 5
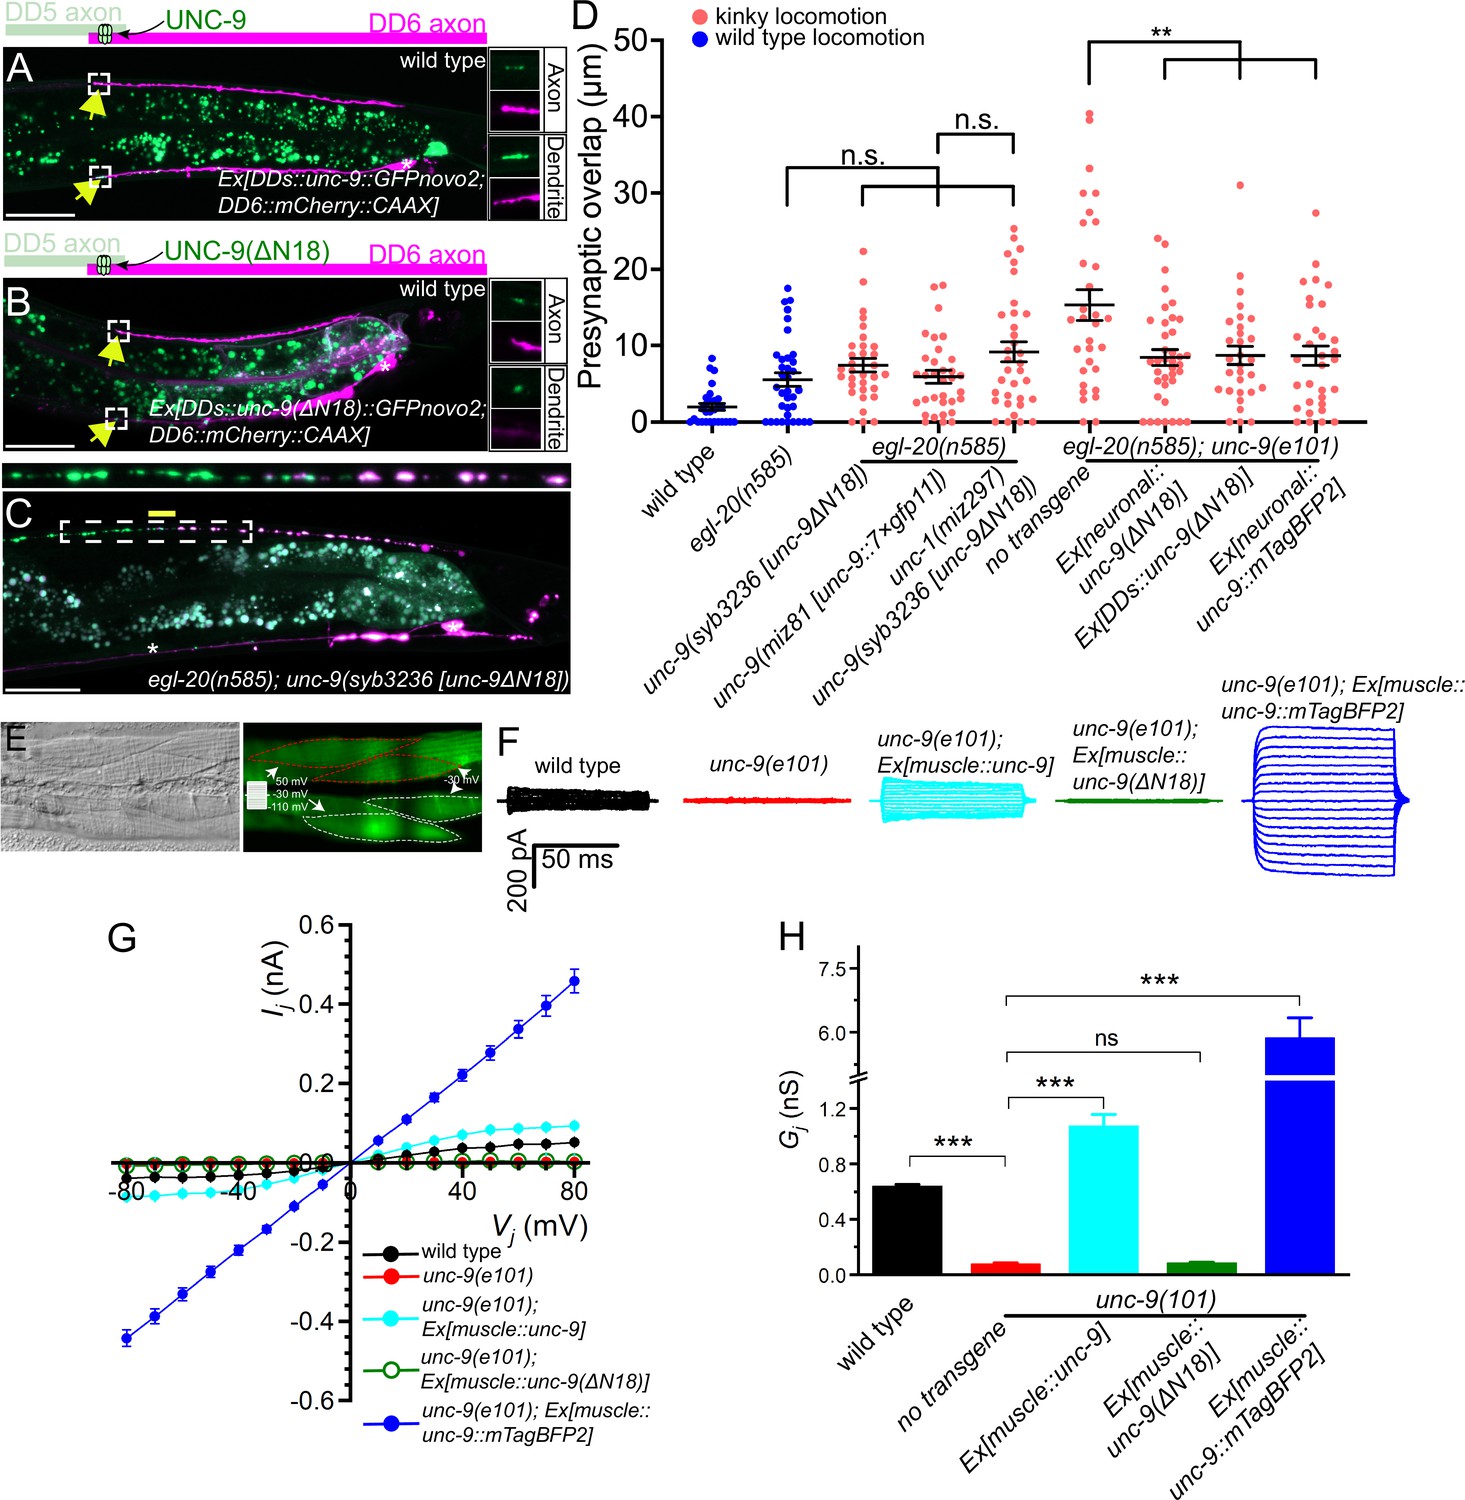
UNC-9 gap junction channel activity is dispensable for its function in presynaptic patterning.
(A–B) Representative images of UNC-9::GFP (A) and UNC-9(ΔN18)::GFP (B) localization at the anterior tip of dorsal D-type 6 (DD6) axon and dendrite (indicated by yellow arrows) in wild type. The magnified UNC-9::GFP (A) and UNC-9(ΔN18)::GFP (B) and mCherry::CAAX signals in the anterior tip of DD6 axon and dendrite, indicated by the dashed box, are shown to the right of merged images. (C) Representative image of presynaptic tiling in the egl-20(n585); unc-9(syb3236 [unc-9ΔN18]) double mutant. The magnified straightened image of the presynaptic tiling border, indicated by the dashed box, is shown above. Yellow line indicates region of presynaptic overlap between dorsal D-type 5 (DD5) and DD6. Asterisks: DD5 and DD6 cell bodies. Scale bar: 20 µm. (D) Quantification of presynaptic overlap between DD5 and DD6. See Figure 5—source data 1. Each dot represents a single animal. See source data for sample size and individual value. Black bars indicate mean ± SEM. n.s.: not significant; **p<0.01. (E) Representative image of adjacent body wall muscles expressing unc-9 and GFPnovo2. (F) Sample traces of junctional currents (Ij) recorded from pairs of muscle cells like those surrounded by red or white dotted lines in panel E. (G) Graph of the junctional currents (Ij) and transjunctional voltage (Vj). See Figure 5—source data 2. See source data for sample size and individual value. (H) Quantification of the junctional conductance (Gj). See Figure 5—source data 3. See source data for sample size and individual value. Bars indicate mean ± SEM. n.s.: not significant; ***p<0.001.
-
Figure 5—source data 1
Quantification of overlap between DD5 and DD6 presynaptic domains.
- https://cdn.elifesciences.org/articles/80555/elife-80555-fig5-data1-v1.xlsx
-
Figure 5—source data 2
Measurement of junctional currents (Ij) and transjunctional voltage (Vj).
- https://cdn.elifesciences.org/articles/80555/elife-80555-fig5-data2-v1.xlsx
-
Figure 5—source data 3
Quantification of the junctional conductance (Gj).
- https://cdn.elifesciences.org/articles/80555/elife-80555-fig5-data3-v1.xlsx
Author response image 1
Additional files
Download links
A two-part list of links to download the article, or parts of the article, in various formats.
Downloads (link to download the article as PDF)
Open citations (links to open the citations from this article in various online reference manager services)
Cite this article (links to download the citations from this article in formats compatible with various reference manager tools)
Channel-independent function of UNC-9/Innexin in spatial arrangement of GABAergic synapses in C. elegans
eLife 11:e80555.
https://doi.org/10.7554/eLife.80555


