Plasticity-induced actin polymerization in the dendritic shaft regulates intracellular AMPA receptor trafficking
- Janelia Research Campus, Howard Hughes Medical Institute, United States
Figures
Figure 1 with 17 supplements
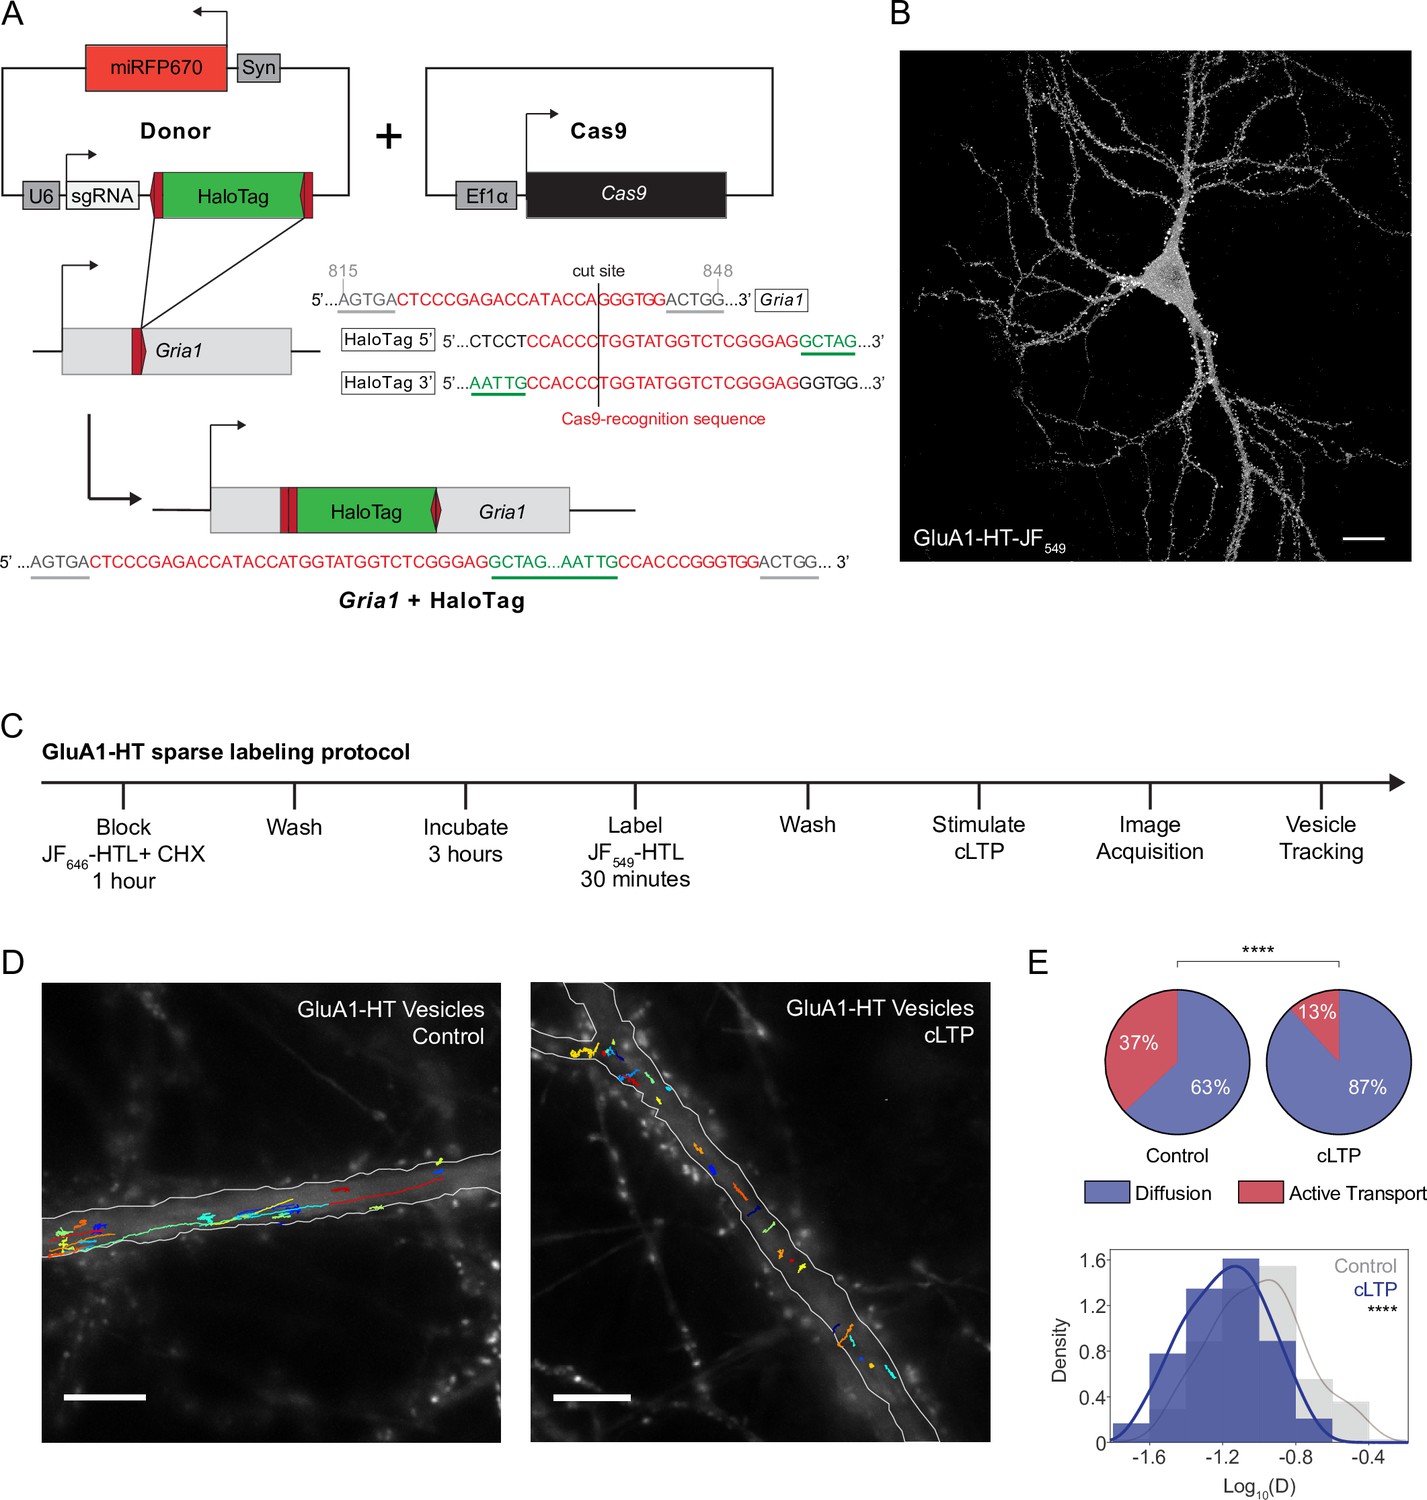
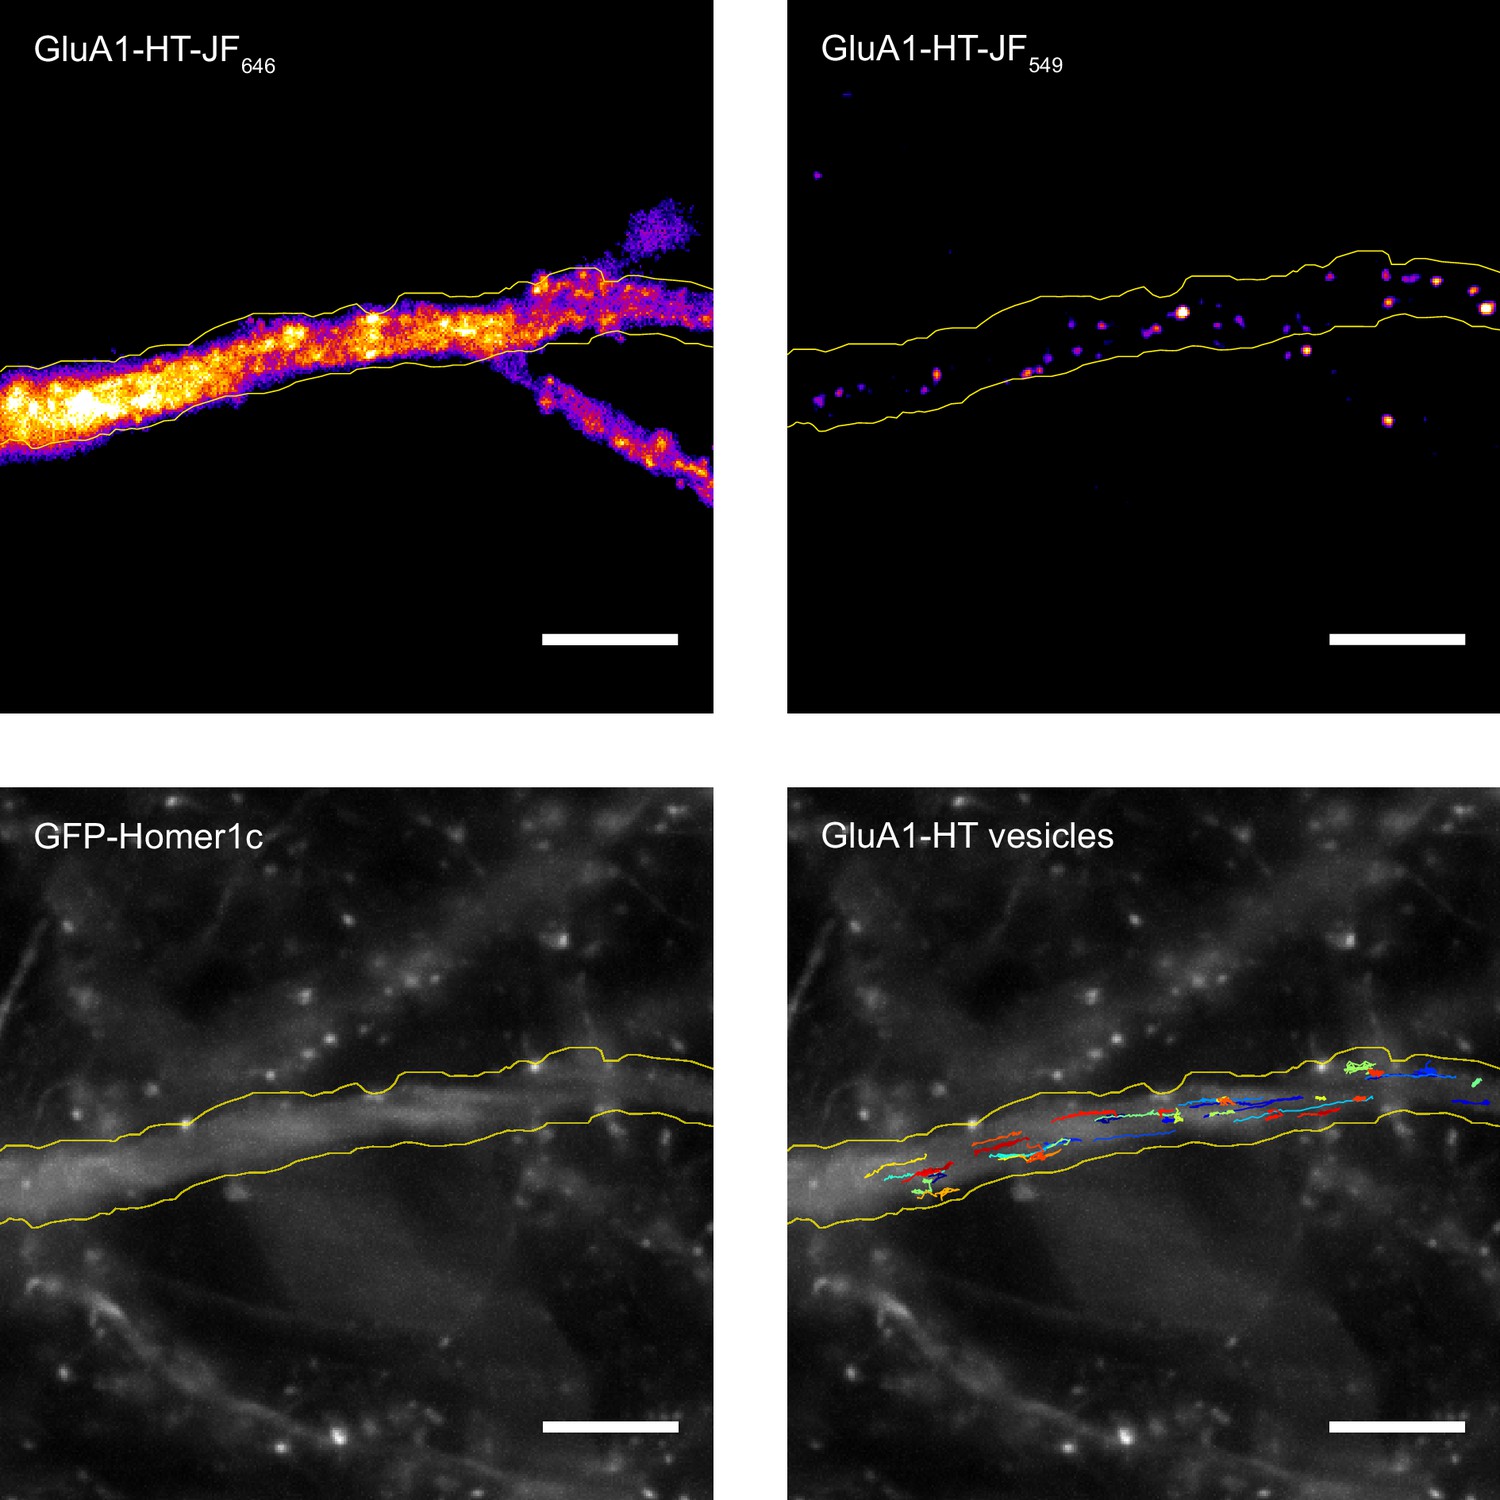
Chemical LTP induction reduces active transport and diffusion of GluA1-HT vesicles in the dendritic shaft.
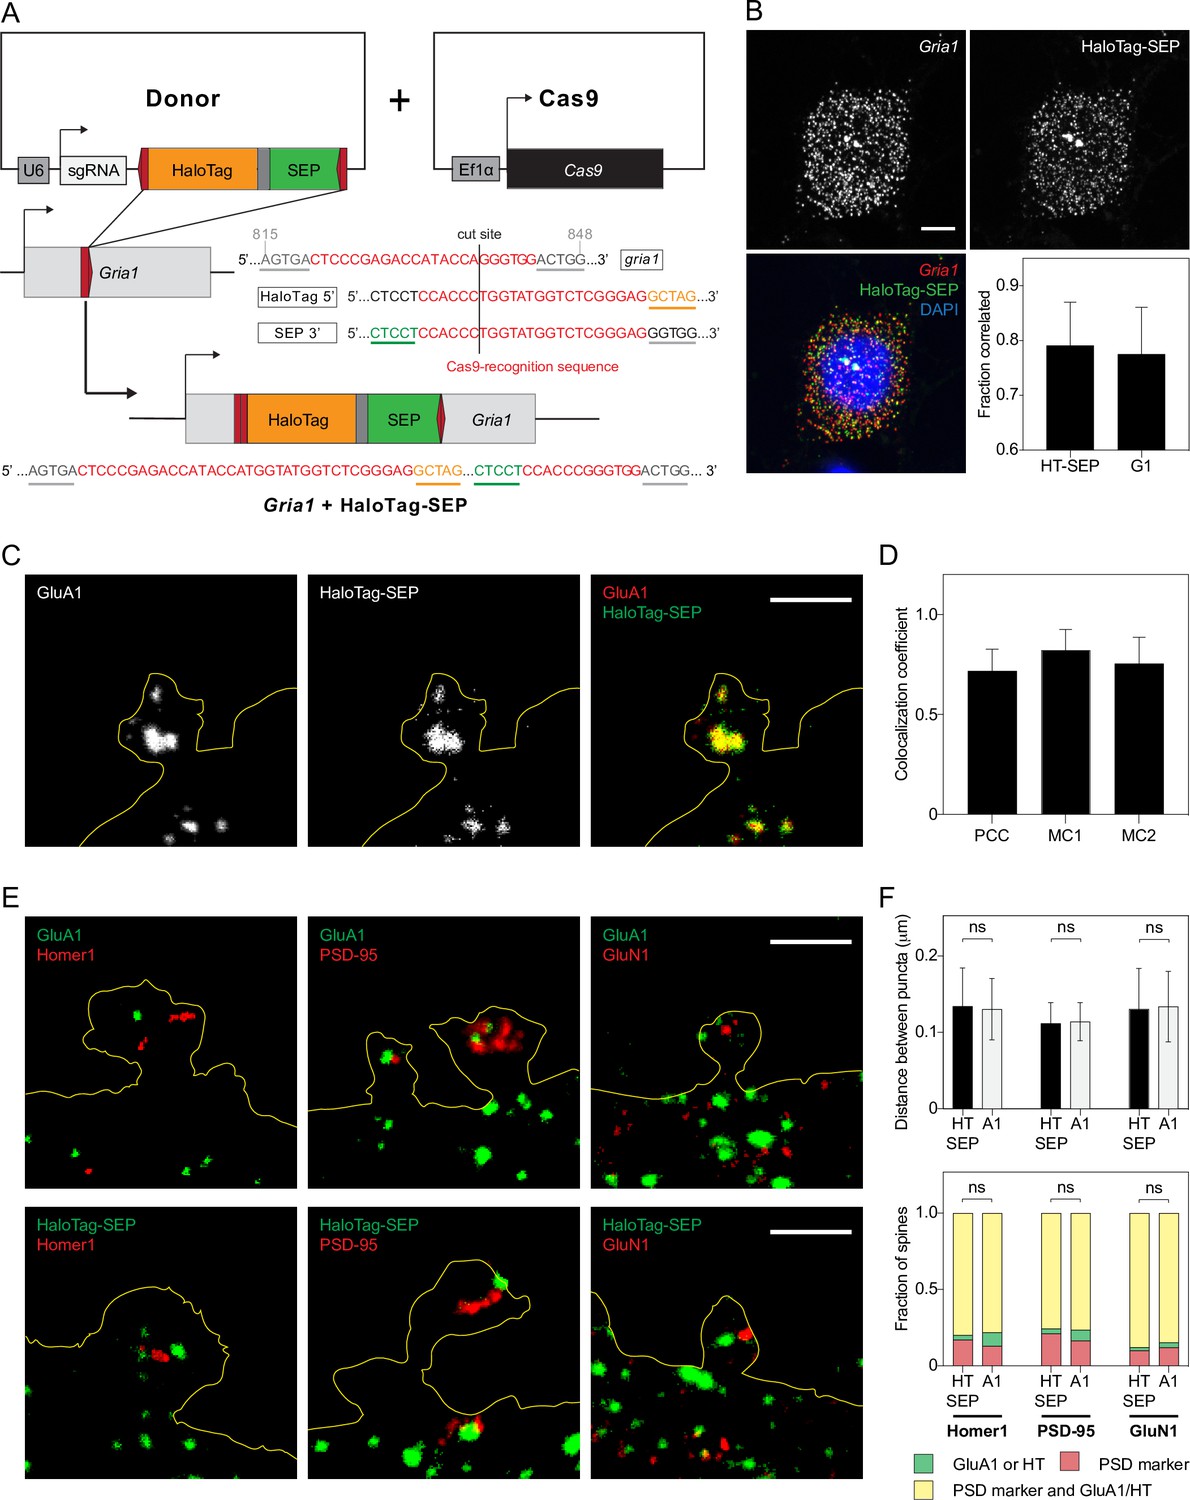
(A) Schematic of Gria1 gene targeting with HaloTag (HT) by homology-independent targeted integration (HITI). A donor construct for HaloTag integration (Donor) is co-transfected into rat hippocampal neurons with a construct expressing Cas9 (Cas9). The donor contains HaloTag flanked on each side by one copy of the Gria1 sequence to be targeted by Cas9, a single guide RNA (sgRNA), and a neuronal transfection marker (e.g. miRFP670). In neurons transfected with both the Cas9 and Donor constructs, Cas9 creates a double strand break in the genomic copy of Gria1 and also excises the HaloTag sequence from the donor construct. The freed HaloTag sequence can be inserted into the genomic cut site when the double strand break is repaired by non-homologous end joining (NHEJ). (B) Representative confocal image of a cultured rat hippocampal neuron expressing endogenous GluA1 tagged with HaloTag and labeled with JF549-HaloTag ligand (GluA1-HT-JF549). Scale bar, 20 μm. (C) Experimental workflow to achieve sparse GluA1-HT labeling for GluA1-HT vesicle identification and single-particle tracking (SPT) analysis. (D) GluA1-HT vesicle trajectories in a dendritic shaft with no treatment (Control) and during cLTP induction (cLTP). Trajectories are overlaid on epifluorescence images of GFP-Homer1c, which was used to identify and segment the dendritic shaft. Scale bar, 10 μm. For videos, see Figure 1—video 5 and Figure 1—video 6. (E) Pie charts: fractions of vesicles exhibiting diffusion or active transport in dendritic shafts with no treatment (Control) and during cLTP induction (cLTP). ****p<0.0001 by Mann-Whitney test. n=12–14 timelapse imaging sequences (each timelapse captures the motion of GluA1-HT vesicles in one region of dendrite in one neuronal culture) for each condition. Histogram: distributions of diffusion coefficients for GluA1-HT vesicles without treatment (Control; gray) and during cLTP induction (cLTP; blue). Line represents the probability density function of each histogram estimated by kernel density estimation (KDE). ****p<0.0001 by Kolmogorov-Smirnov test. n=227–360 GluA1-HT vesicle trajectories pooled from 12 to 14 timelapses for each condition.
-
Figure 1—source data 1
Related to Figure 1.
- https://cdn.elifesciences.org/articles/80622/elife-80622-fig1-data1-v1.xlsx
Figure 1—figure supplement 1
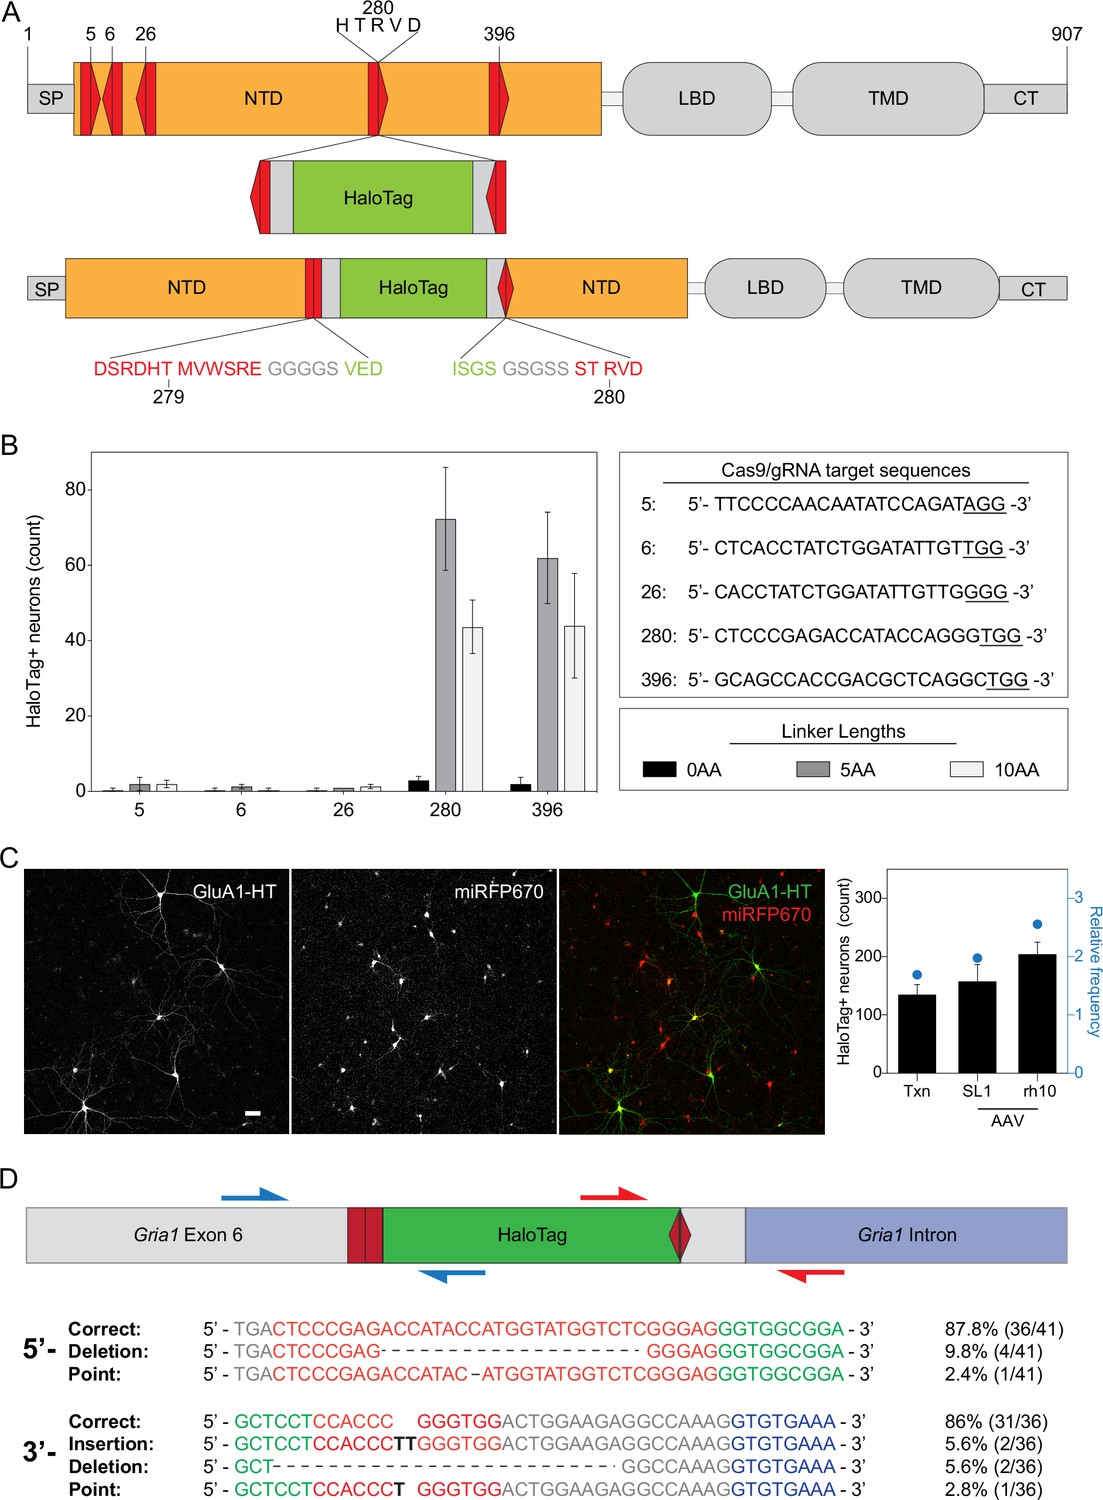
Successful insertion of HaloTag into Gria1 depends on target site and linker length.
(A) Schematic of GluA1 protein domains after HaloTag insertion via homology-independent targeted integration (HITI). SP, signal peptide; NTD, amino terminal domain; LBD, ligand binding domain; TMD, transmembrane domain; CT, C-terminus. The NTD and LBD are extracellular. Red pentagons represent the relative locations of attempted Cas9/guide RNA (gRNA) target sequences. Direction indicates whether the upper or lower DNA strand of Gria1 was targeted (pointing right or left, respectively). Number indicates amino acid position. Copies of Cas9/gRNA target sequence flanking HaloTag sequence face the opposite direction as the genomic Gria1 Cas9/gRNA target sequence. When HaloTag is inserted in the correct orientation, the Cas9/gRNA target sequence will not be restored, preventing Cas9 from cutting the same sites after repair. Gray rectangles flanking HaloTag represent peptide linkers. (B) Bar graph: mean number of cells with HaloTag knock-ins for different insertion sites and with different peptide linker lengths. n=3 independent transfections for each Cas9/gRNA target sequence and linker length. Error bars represent standard deviation. Top right panel: Cas9/gRNA target sequences with the protospacer adjacent motif (PAM) sequence underlined. Lower right panel: different linker lengths tested. Insertion at GluA1 280 R with a linker length of 5 amino acids was used for all GluA1 tagging experiments because it has the highest knock-in efficiency. (C) Images: representative widefield images of electroporated neurons expressing GluA1-HaloTag and labeled with JF549-HTL (GluA1-HT) or an miRFP670 neuronal transfection marker (miRFP670). Scale bar, 100 μm. Bar graph: efficiencies for HaloTag insertion for electroporation (txn) vs AAV-infection with SL1 or rh10 pseudotyped vectors. Bars represent the mean count and standard deviation for HaloTag positive neurons per dish. Blue dots represent relative efficiencies (HaloTag positive cells divided by cells transfected with both Donor and Cas9). n=6 independent transfections or infections for each condition. (D) Indel frequencies for Gria1 with HaloTag insertions. Diagram: schematic of Gria1 Exon 6 with HaloTag inserted by HITI. Genomic DNA was extracted from cultured neurons co-transfected with HaloTag donor and Cas9 expression constructs. Gria1 sequences containing HaloTag knock-ins were amplified with primers flanking the 5’ insertion site (blue arrows) and the 3’ insertion site (red arrows). Amplicons were inserted into pUC expression vectors and then transformed into DH5α E. coli. DNA was then extracted from single colonies and sequenced to check for errors. To test the orientation of HaloTag knock-ins, we reversed the primers that target HaloTag, but did not amplify genomic DNA, indicating that the majority of HaloTag insertions are in the correct orientation. Sequences: 5’ and 3’ sequences of HaloTag correctly inserted into Gria1 as well as examples of insertions, deletions, and point mutations, and the frequency of each type of error.
-
Figure 1—figure supplement 1—source data 1
Related to Figure 1—figure supplement 1.
- https://cdn.elifesciences.org/articles/80622/elife-80622-fig1-figsupp1-data1-v1.xlsx
Figure 1—figure supplement 2
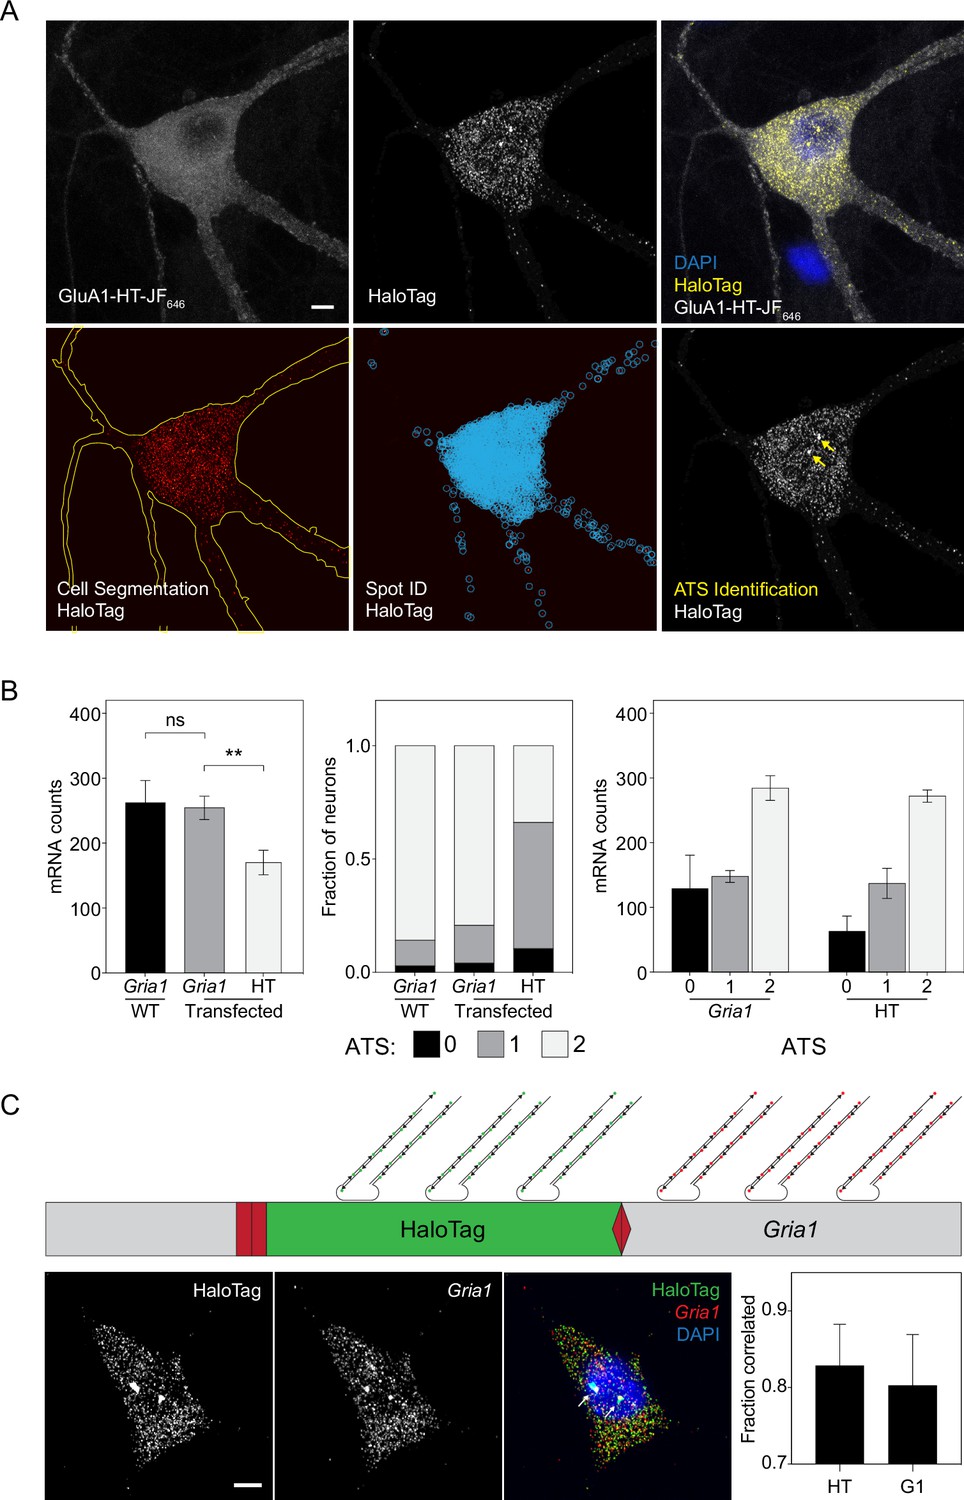
Identification and quantification of Gria1-HaloTag mRNA transcripts using HCR RNA-FISH.
(A) Labeling HaloTag mRNA using hybridization chain reaction RNA fluorescence in situ hybridization (HCR RNA-FISH; Choi et al., 2018) followed by quantification using FISH-Quant (Mueller et al., 2013). Top row: representative confocal images of a cell expressing GluA1-HT labeled with JF646-HTL and also labeled with HCR RNA-FISH probes targeting HaloTag mRNA. Scale bar, 5 μm. Bottom row: neurons were segmented based on GluA1-HT-JF646 labeling, then mRNA spots and active transcription sites (ATS) were identified using FISH-Quant. (B) Left: mean number of Gria1 mRNA per cell in untransfected neurons (WT) and Gria1 and HaloTag mRNA per cell in transfected neurons. **p=0.0044 by t-test with Welch’s correction. n=3 independent HCR RNA-FISH labeling experiments for each condition. Center: fraction of cells that contain no ATS, one ATS, or two ATS when labeled with Gria1 or HaloTag probes. Right: average number of mRNA spots per cell when cells are separated based on the number of ATS. There is no significant difference in the average number of mRNA spots per cell. Significance was determined by t-test with Welch’s correction. The initial quantification of Gria1 and HaloTag mRNA revealed a significantly higher number of Gria1 transcripts per cell when compared to HaloTag mRNA (left bar graph). This observation led us to hypothesize that for neurons expressing Gria1-HaloTag mRNA, many contain only one edited Gria1 allele (i.e. HaloTag was only being expressed by one allele). Consequently, we counted the number of ATS per cell as a proxy for whether one or two alleles are edited (center bar graph). We then binned transcript counts based on the number of ATS a cell contains and found no significant difference. Moreover, we compared Gria1 expression in untransfected neurons versus transfected neurons to ensure that HITI did not disrupt Gria1 expression. We find a similar number of Gria1 transcripts and ATS in transfected versus untransfected neurons. (C) Schematic: two-color HCR RNA-FISH labeling targeting Gria1 and HaloTag mRNA to validate HaloTag knock-in. Probes conjugated to Alexa Fluor 488 (green) were used to label HaloTag mRNA while probes conjugated to Alexa Fluor 546 (red) were used to label Gria1 mRNA. Images: representative confocal images of a two-color HCR RNA-FISH labeling experiment. Arrows indicate ATS. Scale bar, 5 μm. Bar graph: fraction of HaloTag mRNA spots located within 0.5 μm of Gria1 mRNA spots, and fraction of Gria1 mRNA spots located within 0.5 μm of HaloTag mRNA spots. n=7 labeled neurons. Gria1 signals do not colocalize perfectly with HaloTag signals because probes targeting Gria1 mRNA can be separated by a distance of up to 2940 basepairs from probes targeting HaloTag mRNA. A distance cutoff of 0.5 μm corresponds to a physical distance of 1470 linearized basepairs (half the maximum distance in which probes from the two channels can be separated if they are both on the same mRNA – that is if Gria1-HaloTag is synthesized as a single mRNA). Signals that fall within this distance cutoff have correlated localization and thus come from a single transcript (Materials and methods).
-
Figure 1—figure supplement 2—source data 1
Related to Figure 1—figure supplement 2.
- https://cdn.elifesciences.org/articles/80622/elife-80622-fig1-figsupp2-data1-v1.xlsx
Figure 1—figure supplement 3
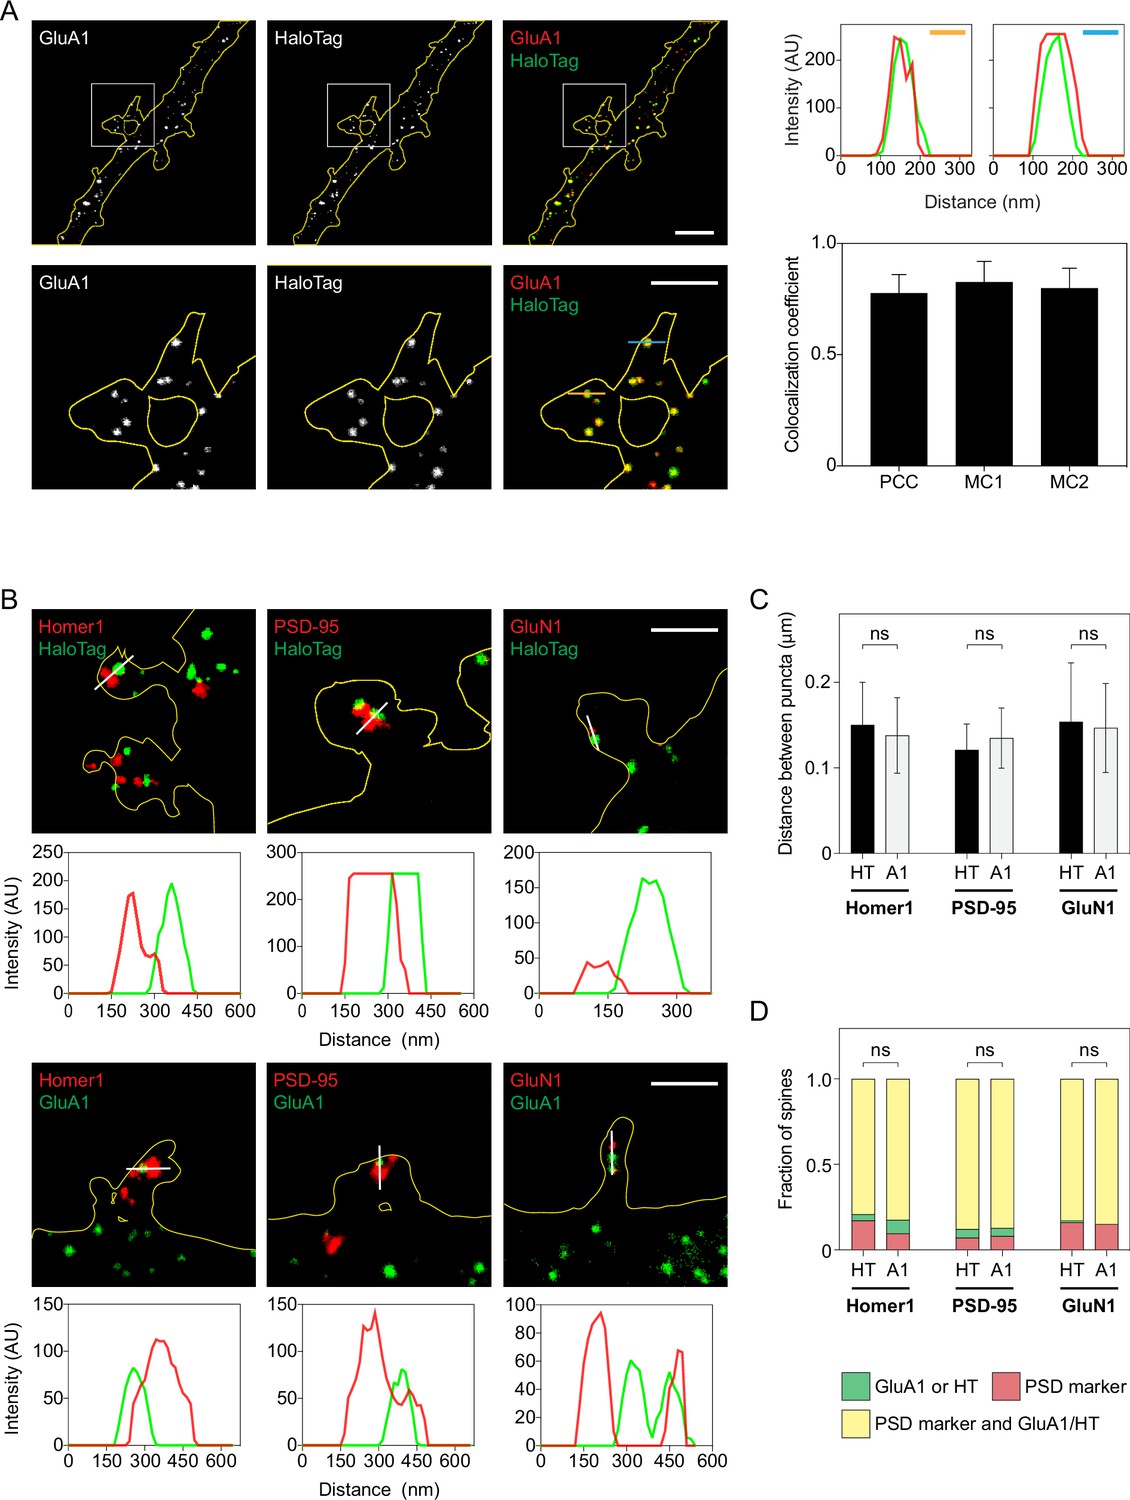
HaloTag is correctly inserted into the N-terminal domain of GluA1 and GluA1-HT is trafficked to postsynaptic densities.
(A) Images: representative stimulation emission depletion (STED) images of a dendrite expressing endogenous GluA1 tagged with HaloTag and labeled with anti-GluA1 antibody (GluA1) and anti-HaloTag antibody (HaloTag). Bottom row: magnified images of spines. Scale bars, 2 μm. Line profiles: fluorescence intensity profiles of GluA1 and HaloTag signals denoted by orange and blue lines. Bar graph: Pearson correlation coefficients (PCC) and Manders’ overlap coefficients (MC1 and MC2) between HaloTag and GluA1 labeling. Bars represent mean and standard deviation. n=9 dendrite images (each image is of a region of dendrite from one neuron labeled with anti-GluA1 and anti-HaloTag antibodies). (B) Representative STED images of dendritic spines labeled with anti-HaloTag or anti-GluA1 antibodies and anti-Homer1, anti-PSD-95, or anti-GluN1 antibodies. Scale bars, 2 μm. Fluorescence intensity profiles (below images) denoted by white lines. (C) Mean distances between the centers of HaloTag (HT) or GluA1 (A1) fluorescence puncta and Homer1, PSD-95, or GluN1 fluorescence puncta. Error bars represent standard deviation. n=55–166 unique pairs of puncta from 9 to 12 dendrite images for each labeling combination (e.g. HaloTag and Homer1). Significance was determined by Mann-Whitney test. (D) Fractions of spines with only GluA1 or HaloTag; only a postsynaptic density (PSD) marker; or both GluA1 or HaloTag and a PSD marker. n=65–122 spines from 9 to 12 dendrite images for each labeling combination. Significance was determined by Mann-Whitney test. Using STED, we could distinguish structures at a resolution of 75 nm. At these length scales, GluA1/HaloTag does not perfectly colocalize with PSD markers. Nevertheless, we find that the average distance between HaloTag and PSD markers is similar to the average distance between GluA1 and PSD markers (C). Furthermore, HaloTag co-occurs in spines with PSD markers at the same rate as GluA1 (D). Combined, these observations demonstrate that GluA1-HT is trafficked to spines in a similar manner as GluA1.
-
Figure 1—figure supplement 3—source data 1
Related to Figure 1—figure supplement 3.
- https://cdn.elifesciences.org/articles/80622/elife-80622-fig1-figsupp3-data1-v1.xlsx
Figure 1—figure supplement 4
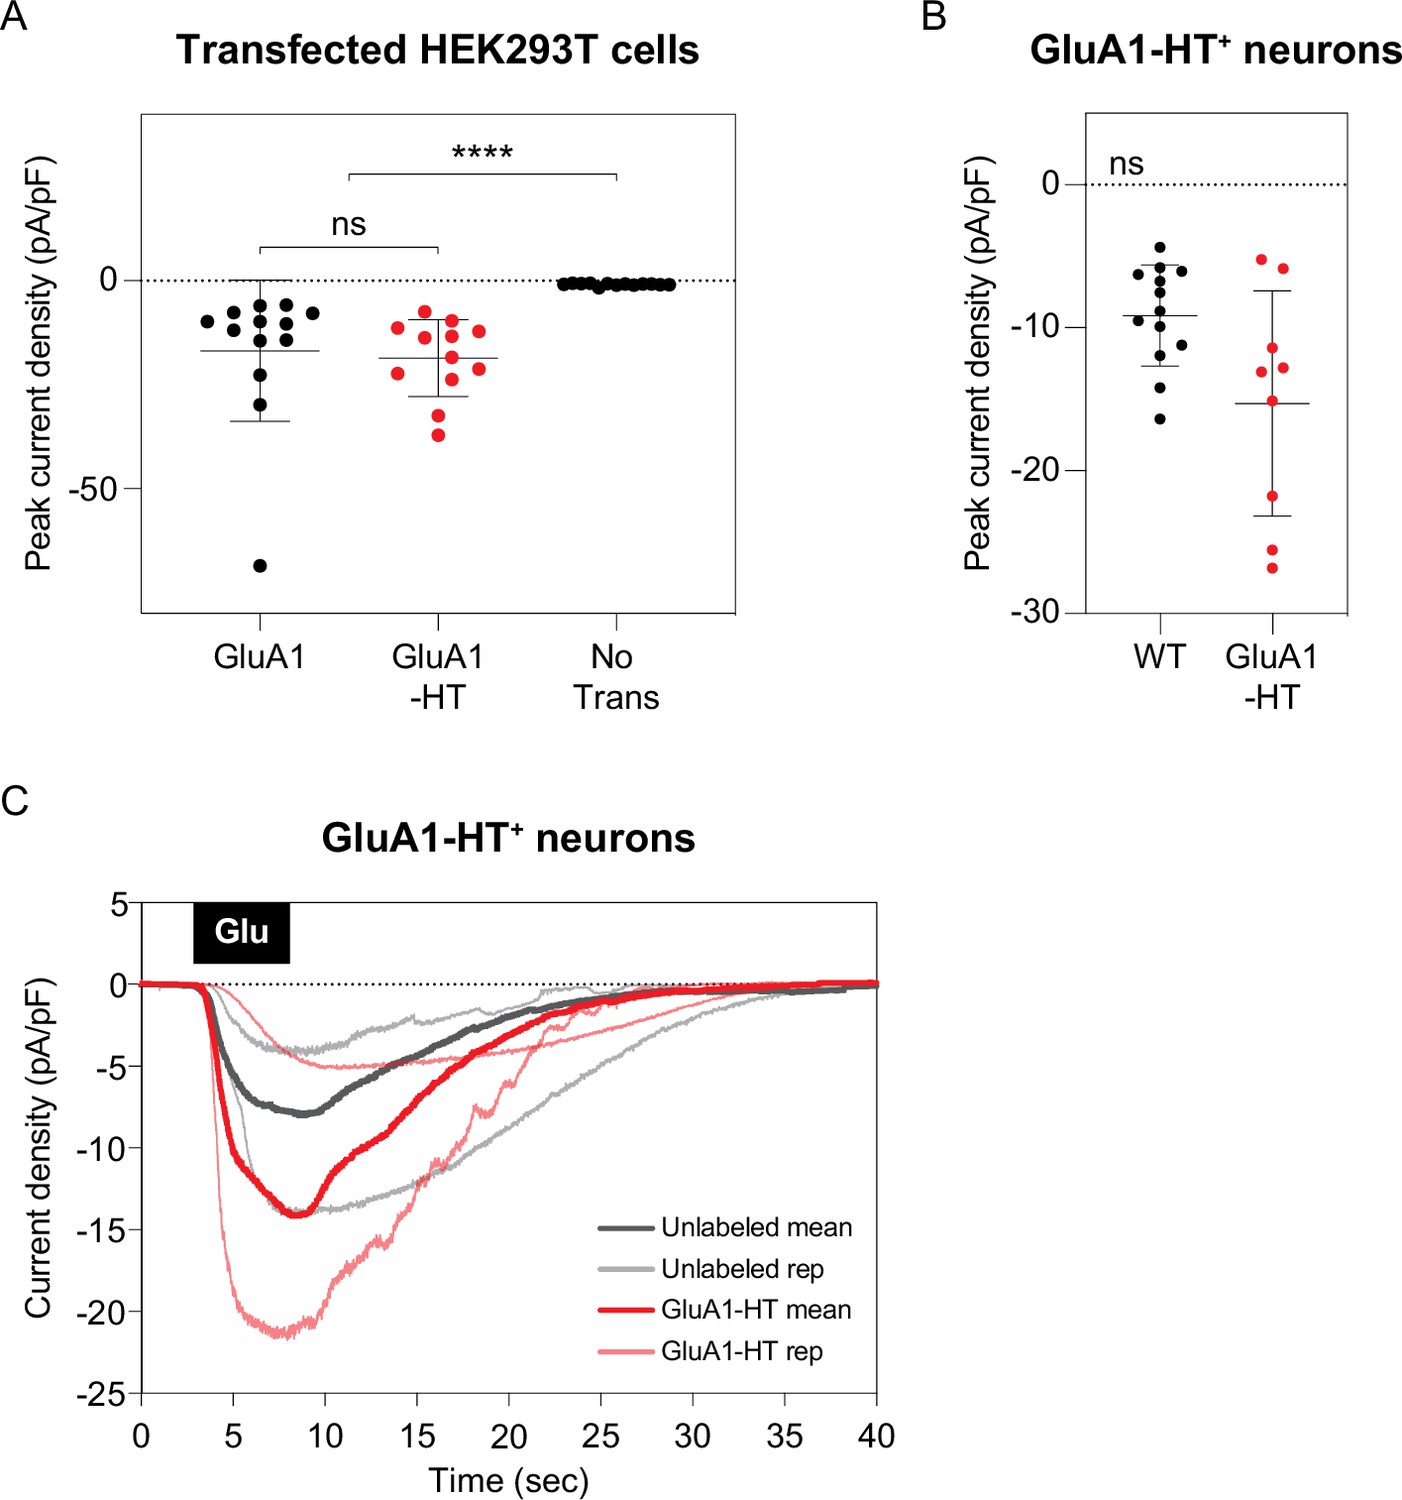
Currents elicited by GluA1-HT are similar to currents elicited by untagged GluA1.
(A) Currents elicited by human embryonic kidney (HEK) 293T cells expressing GluA1 or GluA1-HT in response to locally perfused glutamate. Crosshairs represent mean and standard deviation of peak current densities (pA/pF) for each condition. Each dot represents a single recording. ****p<0.0001 by Mann-Whitney test. GluA1, n=13; GluA1-HT, n=12; No Transfection, n=13. Current densities for HEK293T cells were recorded following local application of 2 mM glutamate with 50 µM cyclothiazide for 10 s. (B) Currents elicited by GluA1-HT and unlabeled neurons in response to locally perfused glutamate. GluA1-HT, n=9; unlabeled, n=13. Significance was determined by Mann-Whitney test. Current densities for GluA1-HT neurons and unlabeled neurons were recorded following a 5 s 100 µM glutamate stimulation at a –70 mV holding potential. (C) Current density traces for GluA1-HT and unlabeled neurons in response to glutamate. Thin lines represent currents from two individual cells under each condition while thick lines represent mean currents. The small but notable reduction in mean trace peak amplitudes is a consequence of data decimation necessary for figure generation.
-
Figure 1—figure supplement 4—source data 1
Related to Figure 1—figure supplement 4.
- https://cdn.elifesciences.org/articles/80622/elife-80622-fig1-figsupp4-data1-v1.xlsx
Figure 1—figure supplement 5
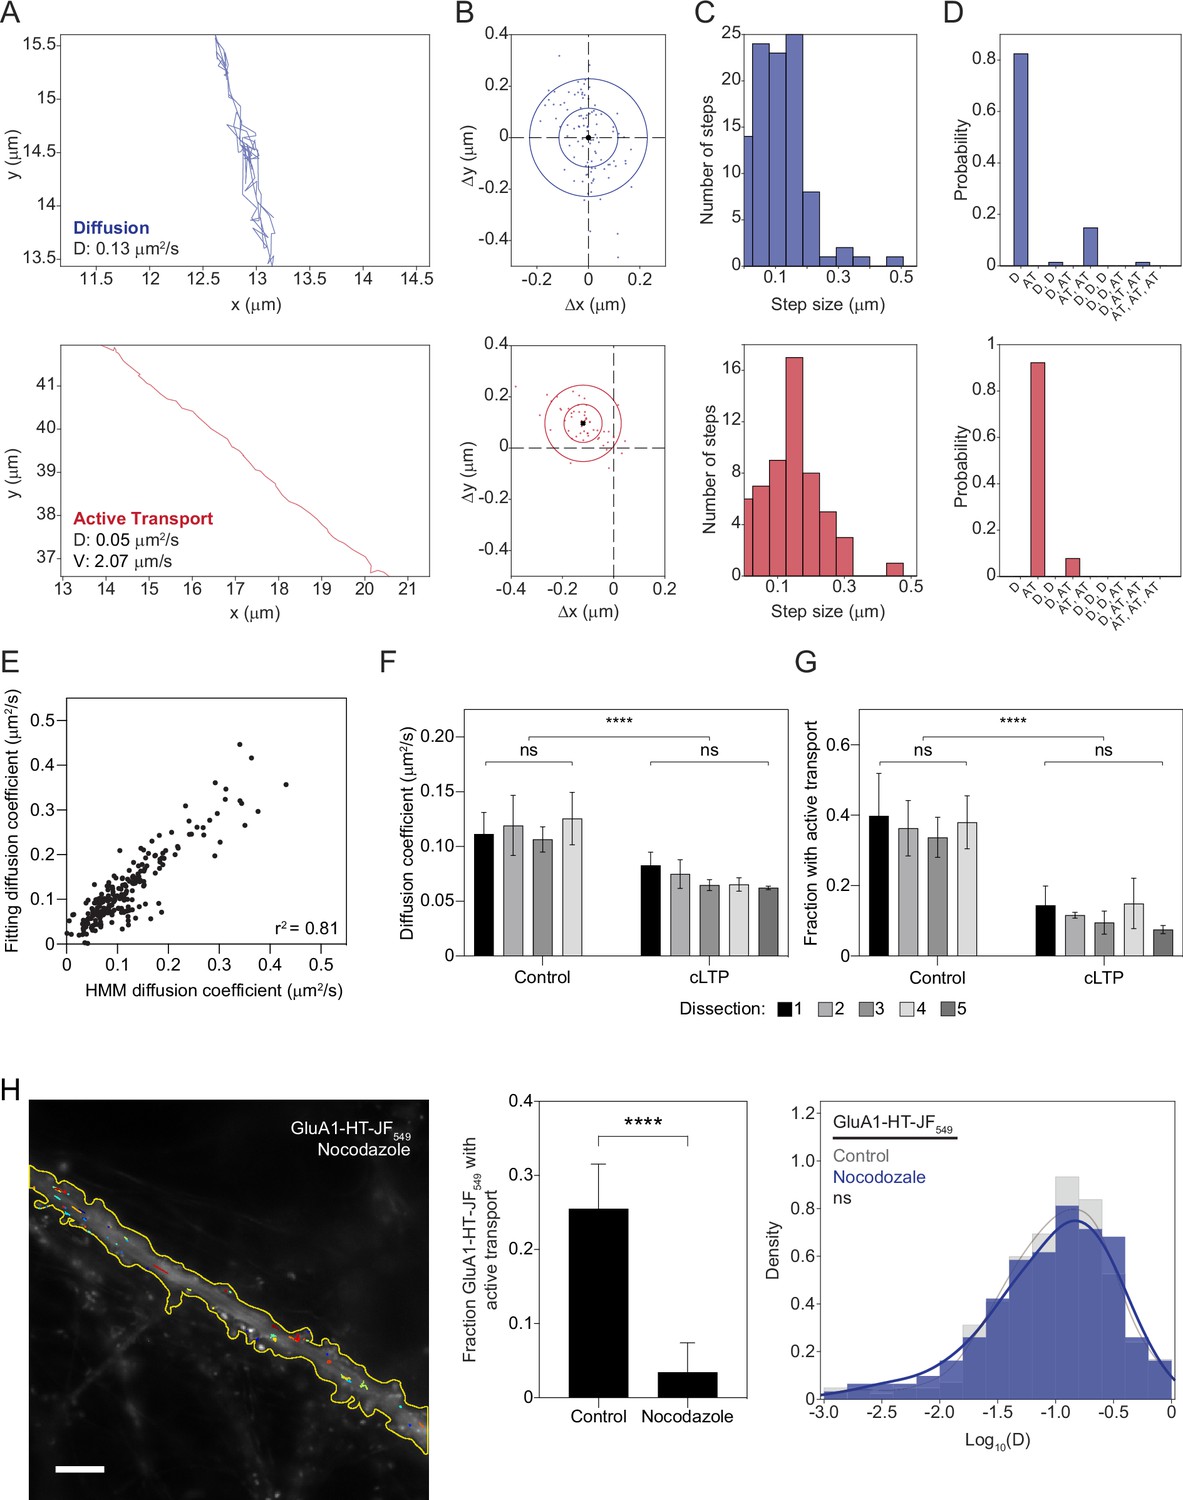
HMM-Bayes analysis can be used to infer the motion states of GluA1-HT-JF549 particles and determine motion parameters.
(A) Representative trajectories for GluA1-HT-JF549 particles after block-and-chase protocol undergoing diffusion (top) and active transport (bottom). (B) Scatter plot of observed displacements (i.e. the vector between two successive points) along a trajectory for a particle exhibiting diffusion (top) or active transport (bottom). (C) Distributions of step sizes for the displacements presented in B. (D) Model probabilities for motion states (D, diffusion; AT, active transport) inferred by HMM-Bayes based on the observed displacements and step size distributions in (B) and (C). For a diffusive process, the displacements fit a normal distribution, from which HMM-Bayes can infer important motion parameters, such as the diffusion coefficient (D) and velocity (V; shown in A). Importantly, HMM-Bayes accounts for active transport by allowing for distributions of displacements with nonzero means (for example, B, bottom). (E) Scatterplot of diffusion coefficients for GluA1-HT-JF549 particles determined by fitting the linear portion of mean square displacement curves (y-axis) versus diffusion coefficients inferred by HMM-Bayes (x-axis). Diffusion coefficients determined by each method are highly correlated, demonstrating that HMM-Bayes accurately infers diffusion coefficients for diffusing trajectories. n=227 diffusion coefficients. (F) Mean diffusion coefficients for GluA1-HT-JF549 particles from different hippocampal dissections (i.e. different rats). Neurons from four different hippocampal dissections were used for Control experiments, while neurons from five different hippocampal dissections were used for chemical LTP (cLTP) stimulation experiments. For each dissection, we performed two to three timelapse imaging experiments to capture the motion of GluA1-HT-JF549 particles under the indicated conditions (Control versus cLTP). Error bars denote standard deviation. Significance between different dissections under the same treatment was determined by Kruskal-Wallis test. Control versus cLTP, ****p<0.0001. Significance between Control and cLTP was determined by Mann-Whitney test. (G) Fractions of GluA1-HT-JF549 particles with active transport from different hippocampal dissections. Error bars denote standard deviation. Significance between different dissections under the same treatment was determined by Kruskal-Wallis test. Control versus cLTP, ****p<0.0001. Significance between Control and cLTP was determined by Mann-Whitney test. These experiments (F–G) demonstrate that the variation in motion states and parameters between dissections is not significant. By contrast, variation due to cLTP stimulation is significantly greater than variation due to different dissections. Consequently, we can attribute differences in motion states and parameters to different treatment conditions rather than to biological differences between rats. (H) Images: trajectories for GluA1-HT-JF549 particles (after blocking with JF646-HTL and chasing with JF549-HTL) under Nocodazole treatment overlaid onto an epifluorescence image of GFP-Homer1c. GFP-Homer1c was used to define the boundaries of the dendritic shaft and spines. Scale bar, 5 μm. For video, see Figure 1—video 2. Bar graph: fraction of GluA1-HT-JF549 particles that exhibit active transport under control conditions versus Nocodazole treatment. ****p<0.0001 by Mann-Whitney test. n=8–10 timelapse imaging experiments for each condition. Each timelapse captures GluA1-HT-JF549 particle motion in one region of dendrite in one neuronal culture. Histogram: diffusion coefficients for GluA1-HT-JF549 particles under control conditions (Control; gray) versus Nocodazole treatment (Nocodazole; blue). n=154–209 GluA1-HT-JF549 particle trajectories pooled from 8 to 10 timelapses. Nocodazole treatment interferes with the polymerization of microtubules, thereby blocking kinesin- and dynein-based active transport. We demonstrate that Nocodazole dramatically reduces the fraction of GluA1-HT-JF549 particles that exhibit active transport based on HMM-Bayes analysis. Consequently, we believe that HMM-Bayes accurately infers motion states.
-
Figure 1—figure supplement 5—source data 1
Related to Figure 1—figure supplement 5.
- https://cdn.elifesciences.org/articles/80622/elife-80622-fig1-figsupp5-data1-v1.xlsx
Figure 1—figure supplement 6
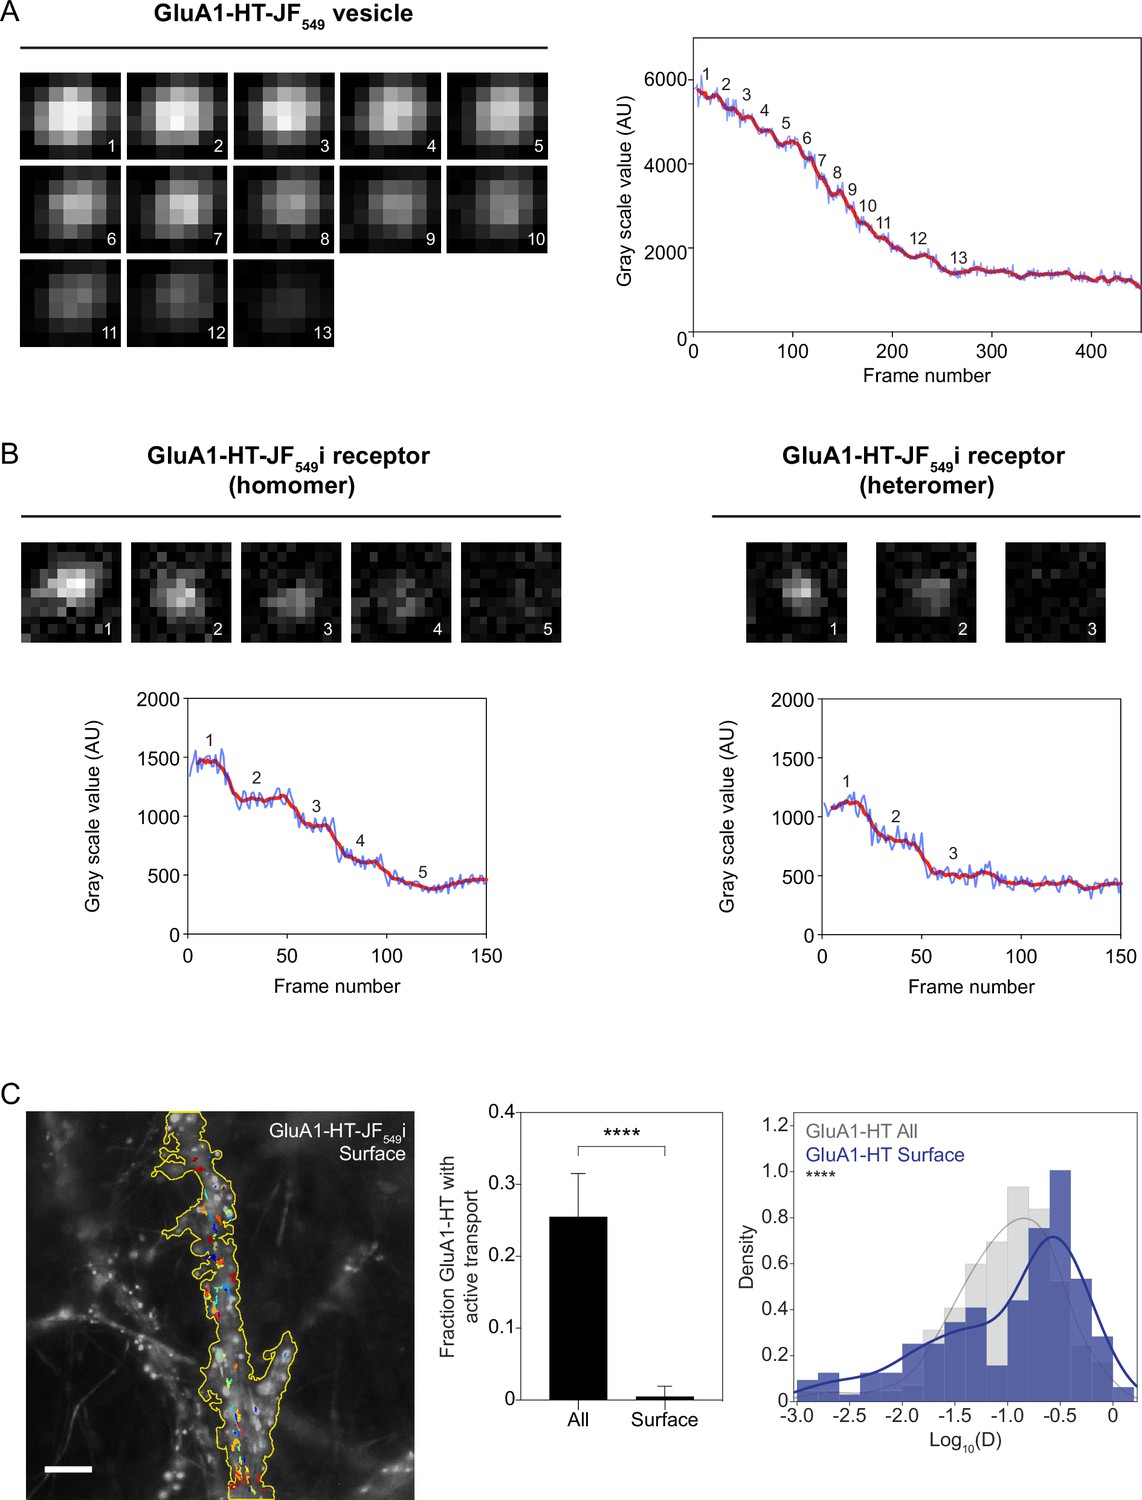
Identifying GluA1-HT vesicles based on their bleaching characteristics and motion.
(A) Images: representative epifluorescence images of a GluA1-HT-JF549 vesicle as it is bleached due to repeated light exposure. Graph: mean fluorescence intensity of vesicle plotted against frame number. Red line represents a running average of 9 frames. Number indicates step that corresponds to representative image. Vesicles contain multiple GluA1-HT particles and therefore can bleach over many steps. (B) Images: representative epifluorescence images of a GluA1-HT-JF549i receptor on the surface of the cell membrane as it is bleached. GluA1-HT is labeled with a cell-membrane impermeable version of the JF549-HaloTag ligand (JF549i-HTL: ‘i’ for impermeable). Graphs: mean fluorescence intensity of receptor plotted against frame number. GluA1-HT-JF549i on the surface of dendritic shafts are individual receptors, which can contain up to four labeled subunits and therefore bleach in four steps (homomer, left). The most abundant AMPAR receptor type is the GluA1-GluA2 heterotetramer which will bleach in one to two steps (heteromer, right). (C) Images: trajectories for GluA1-HT-JF549i receptors (after blocking with JF646-HTL and chasing with JF549i-HTL) on the cell surface overlaid onto an epifluorescence image of GFP-Homer1c. Scale bar, 5 μm. For video, see Figure 1—video 3. Bar graph: fraction of GluA1-HT particles that exhibit active transport. All, GluA1-HT labeled with JF549-HTL (i.e. intracellular and surface GluA1-HT). Surface, GluA1-HT labeled with JF549i-HTL (i.e. surface GluA1-HT only). ****p<0.0001 by Mann-Whitney test. All, n=10 timelapse imaging experiments (each timelapse captures the motion of GluA1-HT-JF549 in one region of dendrite in one neuronal culture). Surface, n=8 timelapse imaging experiments. Histogram: diffusion coefficients for all GluA1-HT (All; gray) versus surface GluA1-HT (Surface; blue). ****p<0.0001 by Kolmogorov-Smirinov test. All, n=209 GluA1-HT-JF549 trajectories pooled from 10 timelapse experiments. Surface, n=159 GluA1-HT-JF549i trajectories pooled from eight timelapse experiments. In order to distinguish GluA1-HT vesicles from GluA1-HT receptors on neuronal surfaces, we labeled surface GluA1-HT receptors with JF549i-HTL, the cell-membrane impermeable variant of JF549-HTL, and characterized the bleaching rate and motion of surface receptors. These experiments demonstrate that surface receptors bleach much more rapidly than vesicles. We find that GluA1-HT surface receptors bleach within 100 frames. Importantly, GluA1-HT surface receptors very rarely exhibit active transport and generally have a higher diffusion coefficient than GluA1-HT vesicles unless GluA1-HT is trapped in a postsynaptic density (see Figure 1—figure supplement 7). GluA1-HT-JF549 particles (intracellular and surface) have a mean diffusion coefficient of 0.16±0.17 μm2/s, while GluA1-HT-JF549i particles (surface) have a mean diffusion coefficient of 0.22 ± 0.23 μm2/s. We consider particles with a diffusion coefficient of greater than 0.45 μm2/s (one standard deviation above the mean diffusion coefficient for GluA1-HT-JF549i particles) to likely be surface receptors. These features help us to further distinguish between the vesicular and surface population of GluA1-HT.
-
Figure 1—figure supplement 6—source data 1
Related to Figure 1—figure supplement 6.
- https://cdn.elifesciences.org/articles/80622/elife-80622-fig1-figsupp6-data1-v1.xlsx
Figure 1—figure supplement 7
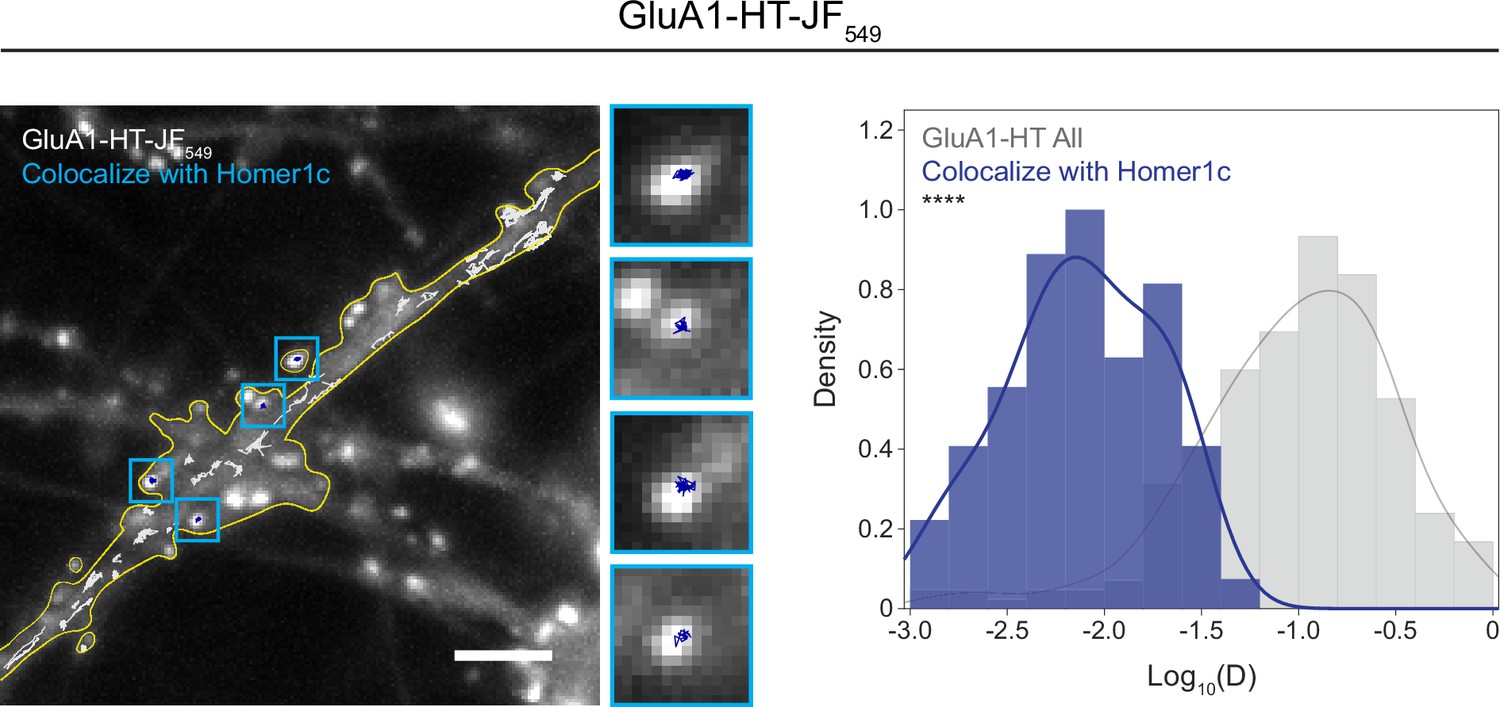
GluA1-HT-JF549 receptors trapped in postsynaptic densities have very low diffusion coefficients.
Images: trajectories of GluA1-HT-JF549 particles (after blocking with JF646-HTL and chasing with JF549-HTL) overlaid onto an epifluorescence image of GFP-Homer1c. Blue squares are enlarged images of GluA1-HT trajectories that colocalize with GFP-Homer1c. Scale bar, 5 μm. For video, see Figure 1—video 4. Histogram: distributions of diffusion coefficients of GluA1-HT-JF549 particles that colocalize with GFP-Homer1c (Colocalize with Homer1c; blue) versus diffusion coefficients of all GluA1-HT-JF549 particles (All; gray). ****p<0.0001 by Kolmogorov-Smirnov test. n=209 trajectories for all GluA1-HT-JF549 particles and n=135 trajectories for GluA1-HT-JF549 particles that colocalize with Homer1c. Line represents the probability density function of each histogram estimated by kernel density estimation (KDE). GluA1-HT-JF549 particles that colocalize with Homer1c are likely receptors that are captured in postsynaptic densities, not receptors in vesicles, and therefore have very low diffusion coefficients (the mean diffusion coefficient for GluA1-HT-JF549 particles that colocalize with Homer1c is 0.01±0.009 μm2/s). Consequently, we filtered out GluA1-HT-JF549 particles from analysis (i.e. did not consider them to be vesicles) if they exhibited a diffusion coefficient below 0.02 μm2/s (one standard deviation above the mean diffusion coefficient for GluA1-HT-JF549 particles that colocalize with Homer1c).
-
Figure 1—figure supplement 7—source data 1
Related to Figure 1—figure supplement 7.
- https://cdn.elifesciences.org/articles/80622/elife-80622-fig1-figsupp7-data1-v1.xlsx
Figure 1—figure supplement 8
Block-and-chase protocol enables sparse labeling of GluA1-HT and the identification of GluA1-HT vesicles.
Top row: representative widefield images of GluA1-HT blocked with JF646-HTL (GluA1-HT-JF646; top left) and chased with JF549-HTL (GluA1-HT-JF549; top right). Bottom row: epifluorescence image of GFP-Homer1c (GFP-Homer1c; bottom left) and trajectories for GluA1-HT vesicles (GluA1-HT vesicles; bottom right). Scale bar, 5 μm. For video, see Figure 1—video 1. To identify vesicles, we first filter particles that are clearly localized inside spines for the majority of steps in their trajectories. We then separate particles based on motion type (i.e. those that exhibit active transport). For particles that exhibit purely diffusive motion, we remove particles that bleach in fewer than 100 frames (i.e. the maximum number of frames required for a homomer with four labeled GluA1 subunits to bleach; Figure 1—figure supplement 6B). Lastly, we remove particles that have a diffusion coefficient greater than 0.45 μm2/s (i.e. particles on cell surface; Figure 1—figure supplement 6C) or less than 0.02 μm2/s (i.e. particles trapped in postsynaptic densities; Figure 1—figure supplement 7).
Figure 1—figure supplement 9
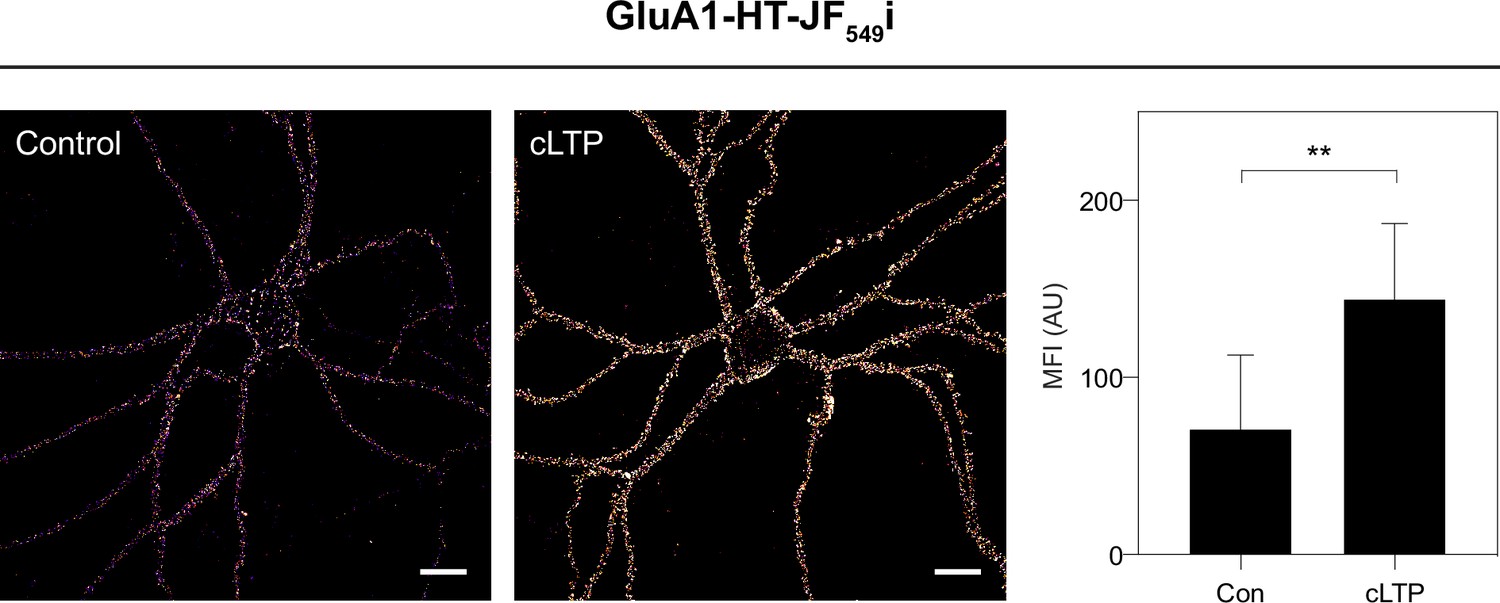
cLTP stimulation results in increased surface labeling of GluA1-HT by JF549i-HTL.
Images: representative confocal images of the selective labeling of GluA1-HT on neuronal membranes using a membrane impermeable version of the JF549-HaloTag ligand (JF549i-HTL: ‘i’ for impermeable) without treatment (Control) and after cLTP (cLTP). Scale bars, 20 μm. Bar graph: mean fluorescence intensities (MFI) of JF549i-HTL-labeled GluA1-HT without treatment and after cLTP. Bars represent mean and standard deviation, **p=0.0047 by Mann-Whitney test. n=8 labeled neurons from three independent neuronal cultures for each condition.
-
Figure 1—figure supplement 9—source data 1
Related to Figure 1—figure supplement 9.
- https://cdn.elifesciences.org/articles/80622/elife-80622-fig1-figsupp9-data1-v1.xlsx
Figure 1—figure supplement 10
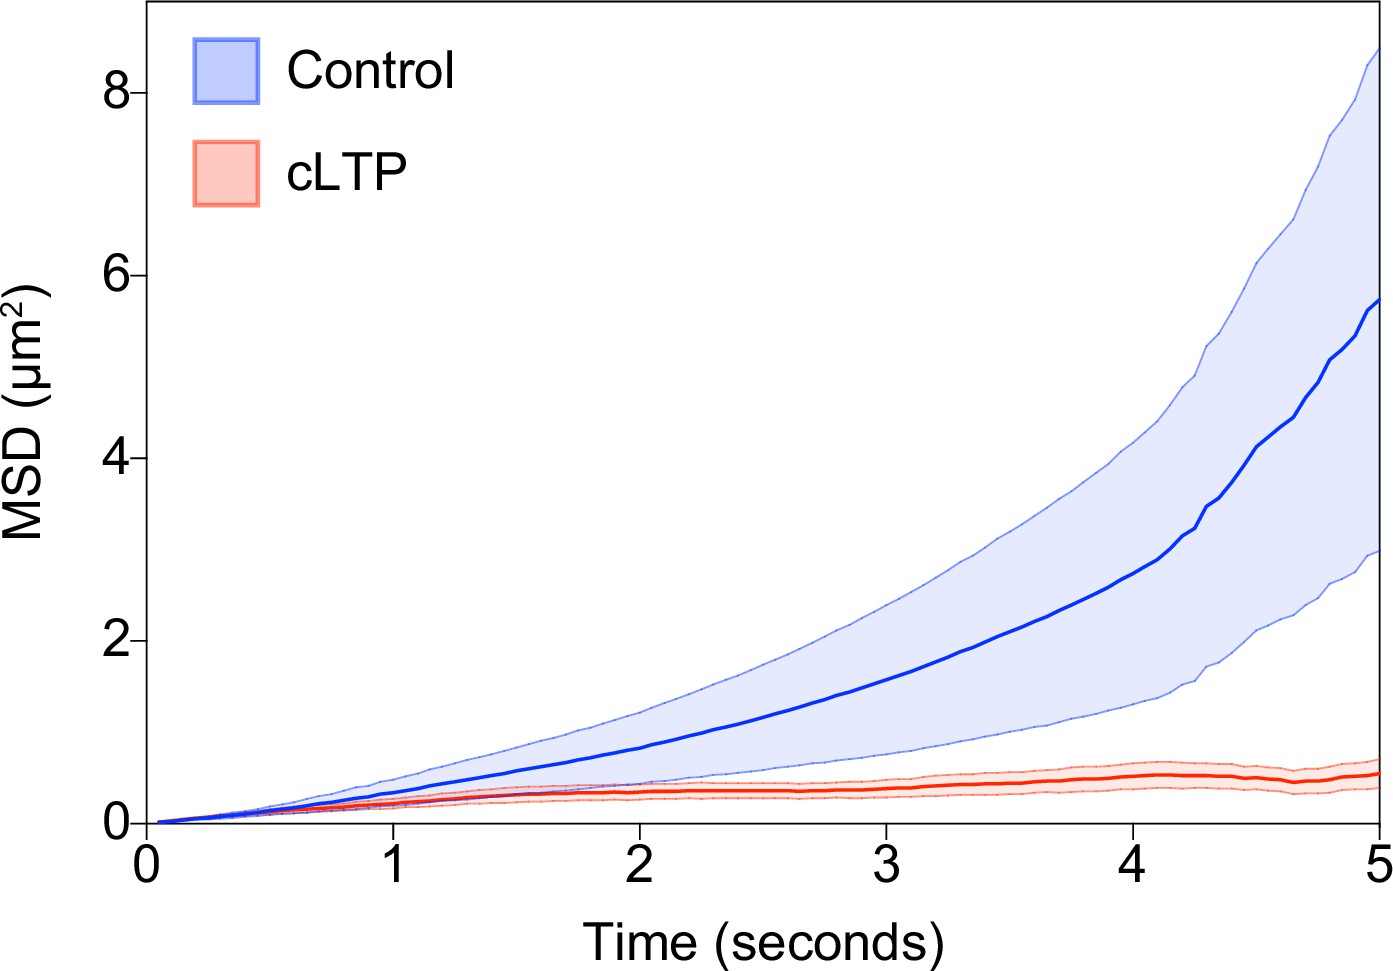
GluA1-HT vesicles exhibit subdiffusive motion during cLTP induction.
Mean square displacement (MSD) of GluA1-HT vesicles under no treatment control condition (Control; blue) and during cLTP induction (cLTP; red). Thick lines represent mean while area represents standard error. n=41–48 Glu1-HT vesicle trajectories for each condition.
-
Figure 1—figure supplement 10—source data 1
Related to Figure 1—figure supplement 10.
- https://cdn.elifesciences.org/articles/80622/elife-80622-fig1-figsupp10-data1-v1.xlsx
Figure 1—figure supplement 11
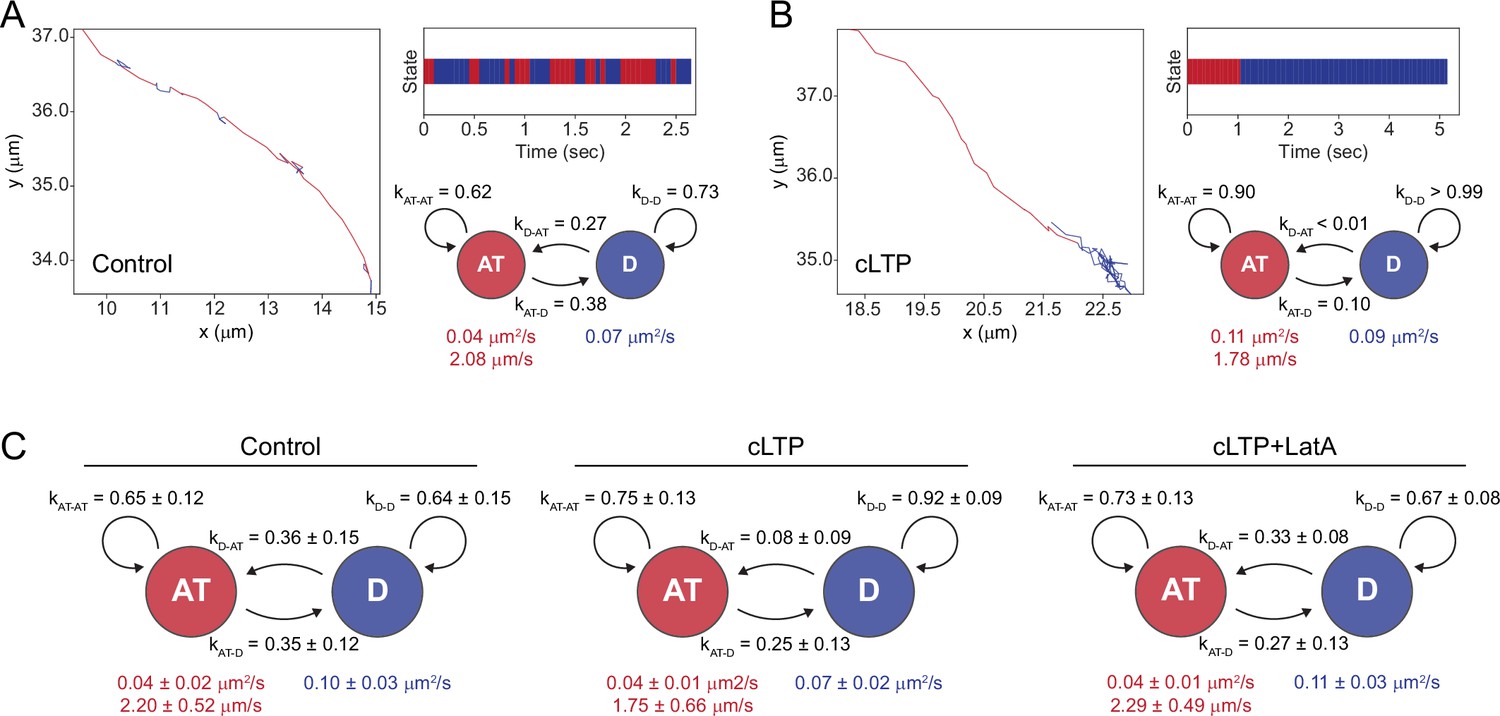
cLTP induction increases the probability GluA1-HT vesicles switch from active transport to diffusion.
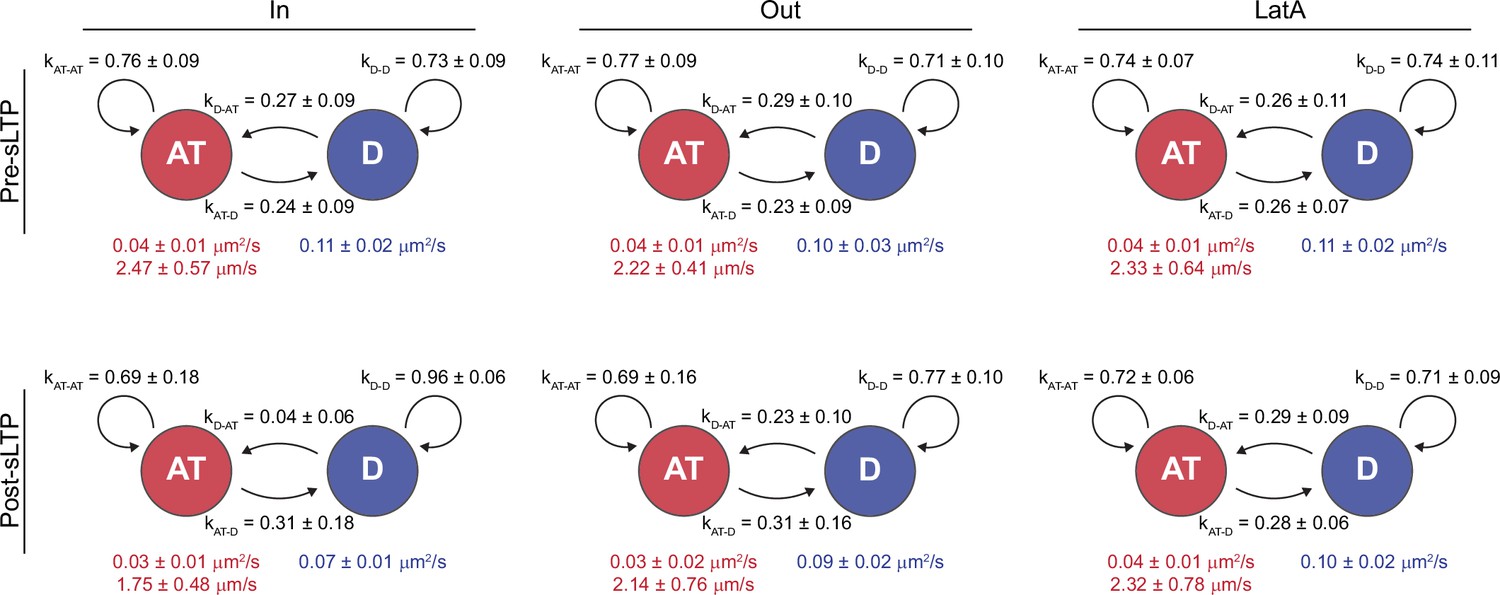
(A) Left: representative trajectory of a GluA1-HT vesicle under control conditions exhibiting stochastic switching between active transport (AT) and diffusive motion (D). Right top: temporal state sequence inferred by HMM-Bayes of the trajectory depicted on the left. Right bottom: transition probabilities and motion parameters for each motion state for the trajectory depicted on the left. kAT-AT, probability that a GluA1-HT vesicle remains in active transport; kAT-D, probability that a vesicle switch from active transport to diffusion; kD-AT, probability that a vesicle switch from diffusion to active transport; kD-D, probability that a vesicle remains in diffusion. Values in red are the velocity and diffusion coefficient of the vesicle during active transport while the value in blue is the diffusion coefficient of the vesicle during diffusion. (B) Left: representative trajectory of a GluA1-HT vesicle under cLTP induction exhibiting stochastic switching between active transport and diffusive motion. Right top: temporal state sequence inferred by HMM-Bayes of the trajectory depicted on the left. Right bottom: transition probabilities and motion parameters for each motion state for the trajectory depicted on the left. (C) Mean state-switching probabilities for multi-state GluA1-HT vesicles under control conditions (Control), cLTP induction (cLTP), and cLTP induction in the presence of Latrunculin A (cLTP +LatA). Control, kAT-D vs kD-AT, p=0.8065; cLTP, kAT-D vs kD-AT, ****p<0.0001; cLTP +LatA, kAT-D vs kD-AT, *p=0.0348. Significance was determined by Mann-Whitney test. n=26–30 multi-state GluA1-HT vesicles trajectories for each condition.
-
Figure 1—figure supplement 11—source data 1
Related to Figure 1—figure supplement 11.
- https://cdn.elifesciences.org/articles/80622/elife-80622-fig1-figsupp11-data1-v1.xlsx
Figure 1—video 1
Timelapse sequence of GluA1-HT-JF549 after block-and-chase labeling with JF646-HTL and JF549-HTL in the dendrite of a cultured rat hippocampal neuron.
Scale bar, 5 μm. Top left: all GluA1-HT labeled with JF646-HTL (block; GluA1-HT-JF646). Top right: newly synthesized GluA1-HT labeled with JF549-HTL (chase; GluA1-HT-JF549). Bottom left: GFP-Homer1c. Bottom right: GluA1-HT-JF549 (green) overlaid onto GFP-Homer1c (magenta).
Figure 1—video 2
Timelapse sequence of GluA1-HT-JF549 after block-and-chase labeling with JF646-HTL and JF549-HTL in a dendrite that has been treated with Nocodazole.
Scale bar, 5 μm. Left: GFP-Homer1c. Center: GluA1-HT-JF549 (chase). Right: GluA1-HT-JF549 (green) overlaid onto GFP-Homer1c (magenta). Related to Figure 1—figure supplement 5.
Figure 1—video 3
Timelapse sequence of GluA1-HT-JF549i on the surface of a dendrite after block-and-chase labeling with JF646-HTL and JF549i-HTL.
Scale bar, 5 μm. Left: GFP-Homer1c. Center: GluA1-HT-JF549i (chase; surface). Right: GluA1-HT-JF549i (green) overlaid onto GFP-Homer1c (magenta). Related to Figure 1—figure supplement 6.
Figure 1—video 4
Timelapse sequence of GluA1-HT-JF549 after block-and-chase labeling with JF646-HTL and JF549-HTL, with GluA1-HT-JF549 particles that colocalize with GFP-Homer1c highlighted.
Scale bar, 5 μm. Left: GFP-Homer1c. Center: GluA1-HT-JF549 (chase). Right: GluA1-HT-JF549 (green) overlaid onto GFP-Homer1c (magenta). Blue boxes highlight GluA1-HT-JF549 particles that colocalize with GFP-Homer1c. Related to Figure 1—figure supplement 7.
Figure 1—video 5
Timelapse sequence of GluA1-HT-JF549 after block-and-chase labeling with JF646-HTL and JF549-HTL in a dendrite with no stimulation.
Scale bar, 5 μm. Left: GFP-Homer1c. Center: GluA1-HT-JF549 (chase). Right: GluA1-HT-JF549 (green) overlaid onto GFP-Homer1c (magenta).
Figure 1—video 6
Timelapse sequence of GluA1-HT-JF549 after block-and-chase labeling with JF646-HTL and JF549-HTL in a dendrite during cLTP induction.
Scale bar, 5 μm. Left: GFP-Homer1c. Center: GluA1-HT-JF549 (chase). Right: GluA1-HT-JF549 (green) overlaid onto GFP-Homer1c (magenta).
Figure 2 with 5 supplements
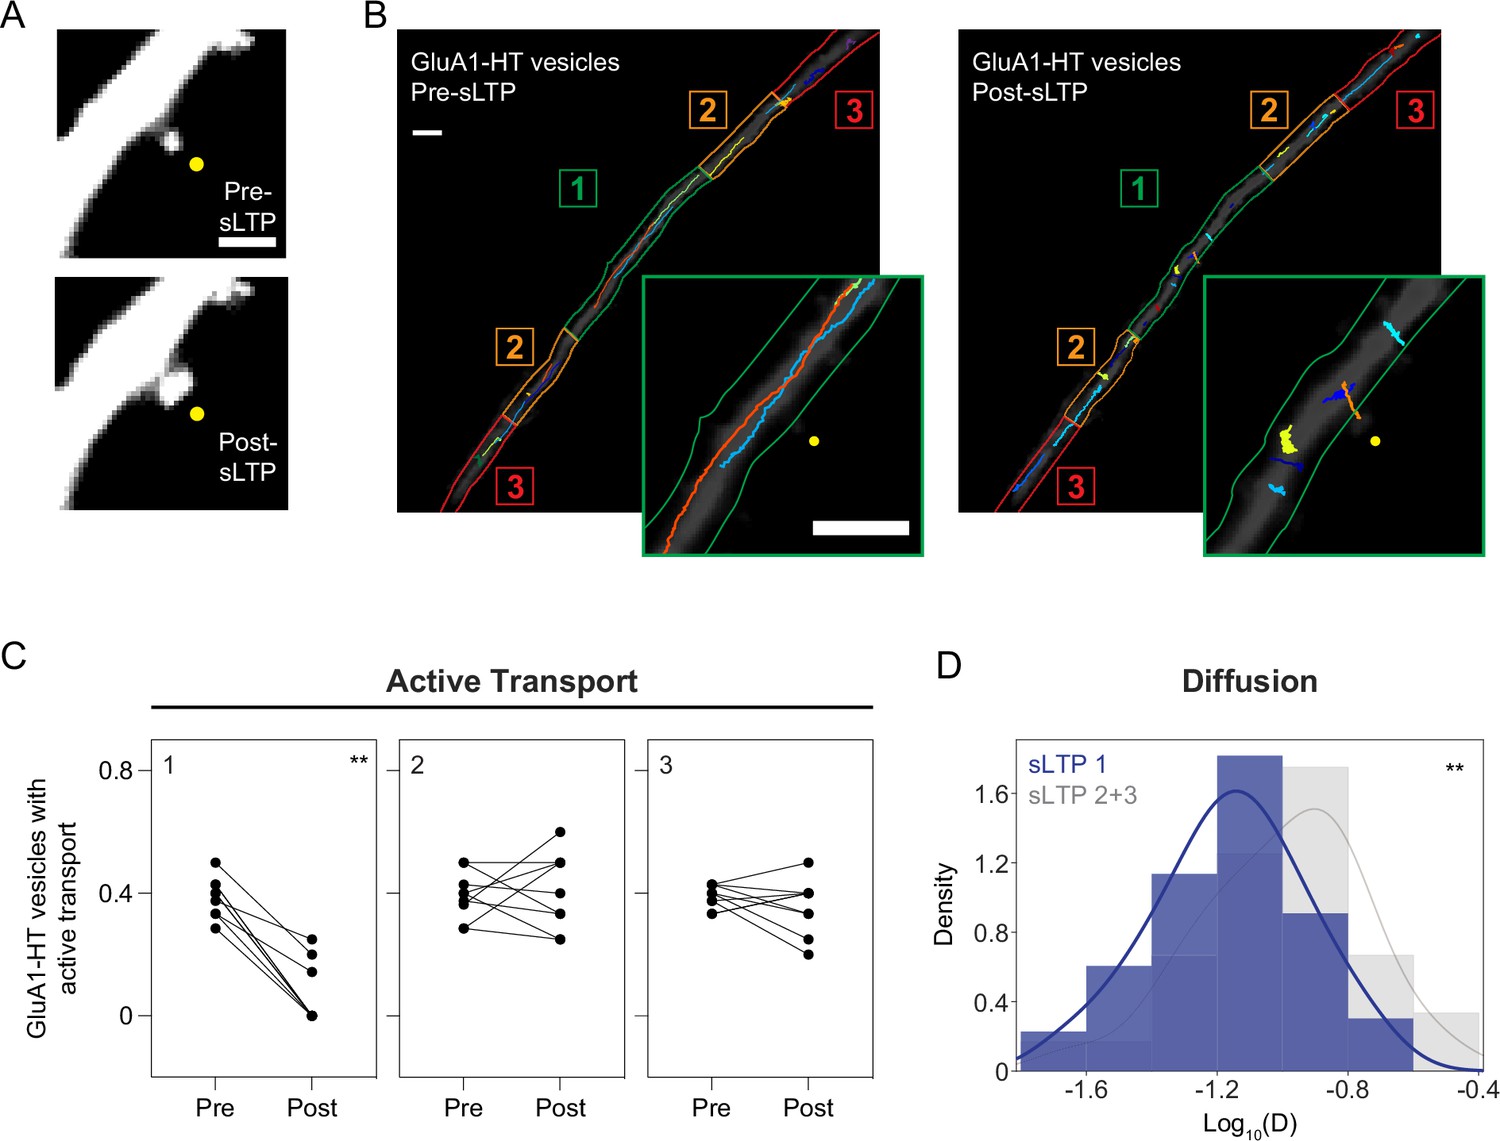
Structural LTP stimulation reduces active transport and diffusion of GluA1-HT vesicles proximal to the site of synaptic activity.
(A) Representative epifluorescence images of a dendritic spine expressing GFP immediately before sLTP (Pre-sLTP) and after sLTP (Post-sLTP). Yellow dot indicates the site of uncaging. Scale bar, 2 μm. (B) GluA1-HT vesicle trajectories immediately before sLTP (Pre-sLTP) and after sLTP (Post-sLTP) overlaid on a dendrite expressing GFP. Dendrite is separated into three equal zones based on proximity to the stimulated spine to distinguish proximal and distal areas (Materials and methods). Insets: magnified images of trajectories near the site of uncaging (yellow dot). Scale bars, 5 μm. For video, see Figure 2—video 1. (C) Fractions of GluA1-HT vesicles exhibiting active transport pre- and post-sLTP in each zone. **p=0.0039 by Wilcoxon matched pairs test. Each dot represents the fraction of vesicles exhibiting active transport in the indicated zone for one sLTP stimulation experiment. n=9 sLTP stimulation experiments (each experiment targets one spine on one neuron) where GluA1-HT vesicle motion in the dendrite is captured immediately before and after sLTP stimulation. (D) Distributions of diffusion coefficients for GluA1-HT vesicles in Zone 1 (sLTP 1; blue) versus Zone 2+3 (sLTP 2+3; gray) after sLTP stimulation. Line represents the probability density function of each histogram estimated by kernel density estimation (KDE). **p=0.0037 by Kolmogorov-Smirnov test. n=60–66 GluA1-HT vesicle trajectories pooled together from nine sLTP stimulation experiments.
-
Figure 2—source data 1
Related to Figure 2.
- https://cdn.elifesciences.org/articles/80622/elife-80622-fig2-data1-v1.xlsx
Figure 2—figure supplement 1
MNI uncaging calibration.
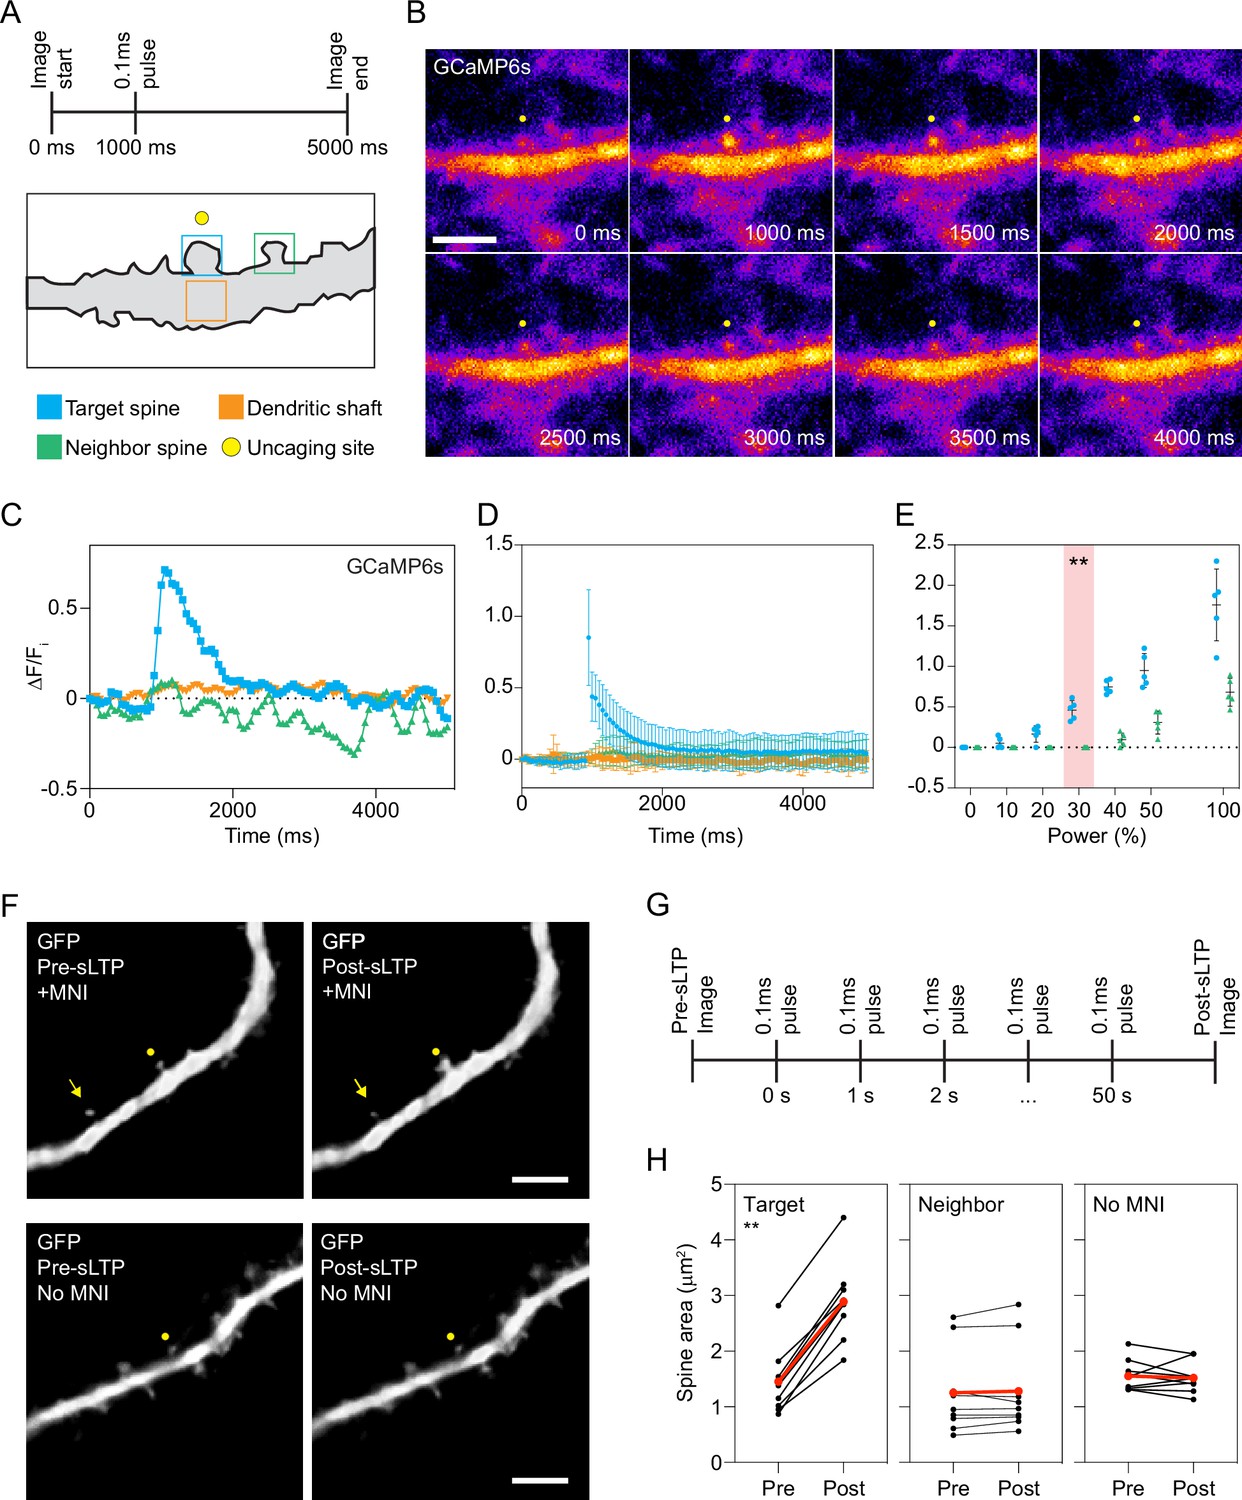
(A) Top: laser stimulation protocol for MNI-caged-ʟ-glutamate (MNI) uncaging. Bottom: diagram of a dendrite and regions where GCaMP6s (Chen et al., 2013) fluorescence was measured over time (colored boxes) to calibrate laser power. (B) Representative epifluorescence timelapse images of GCaMP6s after MNI uncaging. Yellow dot indicates uncaging site. Scale bar, 5 μm. (C) Change in GCaMP6s fluorescence intensity (ΔF/Fi) over time in the regions depicted in (A) after MNI uncaging. (D) Mean ΔF/Fi for GCaMP6s over time in a targeted spine (blue), in the dendritic shaft below the target spine (orange), or in a neighboring spine (green) after MNI uncaging. Error bars represent standard deviation. n=9 MNI uncaging timelapse imaging experiments. For each experiment, one spine is stimulated using the uncaging protocol depicted in (A). A new neuron is selected for each experiment. (E) Peak ΔF/Fi for GCaMP6s in a targeted spine (blue) or a neighboring spine (green) after MNI uncaging with increasing laser power. Crosshairs represent mean and standard deviation, and each dot represents a single uncaging experiment. Red bar indicates the laser power at which there was maximum activation of GCaMP6s in the target spine without appreciable activation of GCaMP6s in the neighboring spines. **p=0.0079 by Mann-Whitney test. n=5 MNI uncaging experiments per laser power. (F) Representative epifluorescence images of a dendritic spine immediately before sLTP (Pre-sLTP) and after sLTP (Post-sLTP) in the presence (above) or absence (below) of MNI. Yellow dot indicates uncaging site; yellow arrow indicates neighboring spine. Scale bars, 5 μm. (G) sLTP stimulation protocol to induce structural plasticity in dendritic spines. (H) Area of dendritic spines targeted for sLTP stimulation (left) and neighboring spines (middle) pre- and post-sLTP. Area of dendritic spines targeted for sLTP stimulation in the absence of MNI (right). Red dots and lines represent the mean spine area pre- and post-sLTP. **p=0.0032 by Wilcoxon matched pairs test. n=9 sLTP stimulation experiments (each sLTP experiment targets one spine on one neuron) for each condition.
-
Figure 2—figure supplement 1—source data 1
Related to Figure 2—figure supplement 1.
- https://cdn.elifesciences.org/articles/80622/elife-80622-fig2-figsupp1-data1-v1.xlsx
Figure 2—figure supplement 2
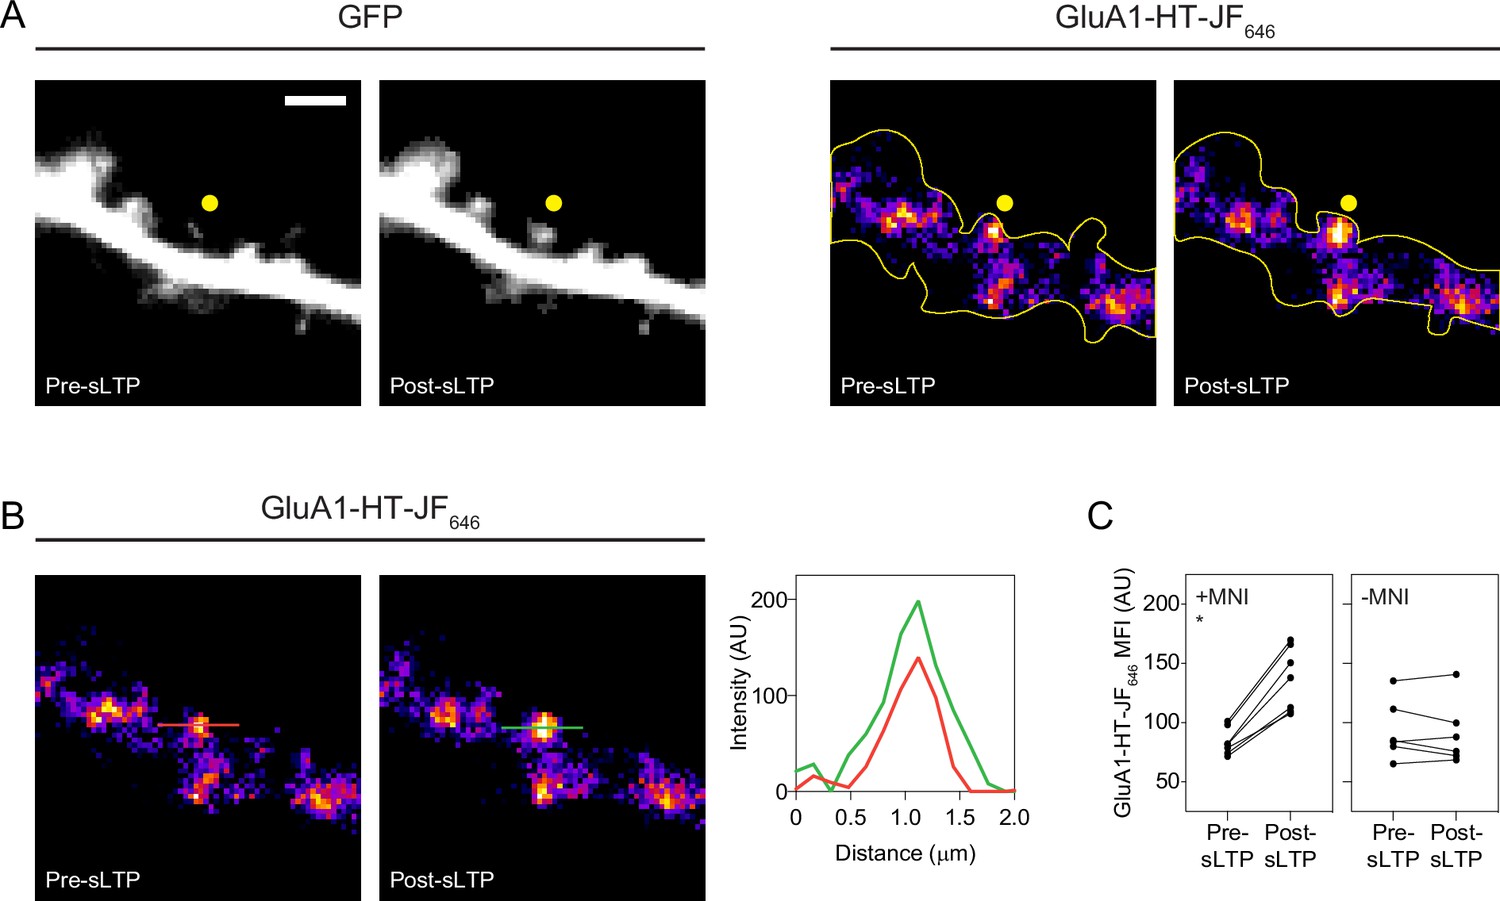
sLTP stimulation increases GluA1-HT-JF646 in targeted spines.
(A) GFP: representative epifluorescence images of a dendritic spine expressing GFP immediately before sLTP (Pre-sLTP) and after sLTP (Post-sLTP). Yellow dot indicates the site of uncaging. Scale bar, 2 μm. GluA1-HT-JF646: representative epifluorescence images of GluA1-HT-JF646 in dendritic spine pre- and post-sLTP. (B) Line profiles: fluorescence intensity profiles of GluA1-HT-JF646 signals denoted by red (Pre-sLTP) and green (Post-sLTP) lines. (C) Line graph of GluA1-HT-JF646 mean fluorescence intensity (MFI) pre- and post-sLTP in the presence or absence of MNI. *p=0.0156 by Wilcoxon matched pairs test. n=6–7 sLTP stimulation experiments (each sLTP experiment targets one spine on one neuron) for each condition.
-
Figure 2—figure supplement 2—source data 1
Related to Figure 2—figure supplement 2.
- https://cdn.elifesciences.org/articles/80622/elife-80622-fig2-figsupp2-data1-v1.xlsx
Figure 2—figure supplement 3
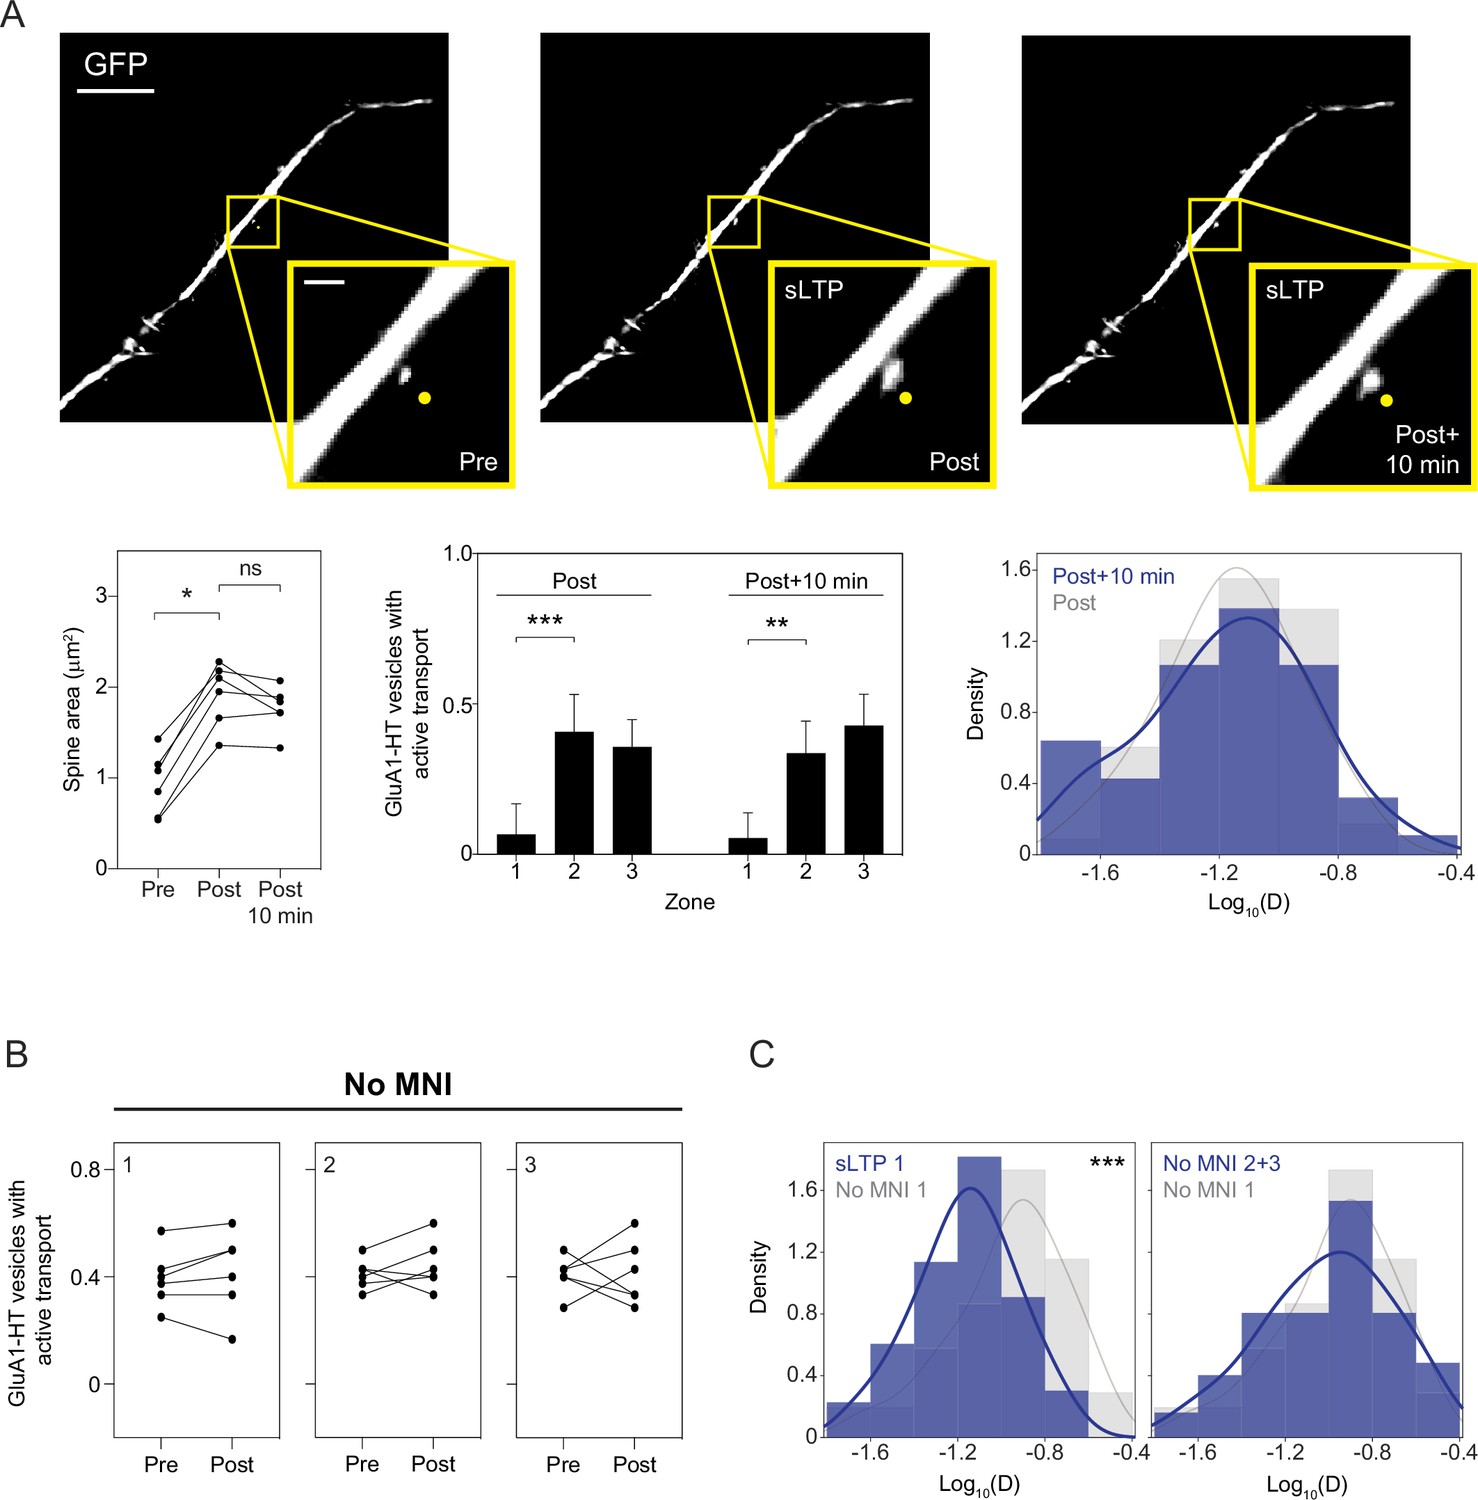
Motion of GluA1-HT vesicles 10 min after the cessation of sLTP stimulation is similar to the motion of vesicles immediately after sLTP stimulation.
(A) Images: representative epifluorescence images of a dendritic spine immediately before sLTP (Pre-sLTP), immediately after sLTP (Post-sLTP), or 10 min after sLTP (Post +10 min). Scale bar, 10 μm. Insets: enlarged images of dendritic spine. Scale bar, 2 μm. Yellow dot, uncaging site. Left line graph: Spine areas of targeted spines pre-sLTP, post-sLTP, and 10 min after the cessation of sLTP. Pre vs Post, *p=0.0312. Significance was determined by Wilcoxon matched pairs test. n=6 sLTP stimulation experiments (each sLTP experiment targets one spine on one neuron). Center bar graph: mean fractions of GluA1-HT vesicles exhibiting active transport immediately after sLTP (Post) or 10 min after sLTP (Post +10 min) in each zone. Error bars represent standard deviation. Post: Zone 1 vs Zone 2, ***p=0.0001. Post +10 min: Zone 1 vs Zone 2, **p=0.0022. Significance was determined by Mann-Whitney test. n=6–9 sLTP stimulation experiments where GluA1-HT vesicle motion in the dendrite is captured immediately after sLTP stimulation or 10 min after the cessation of sLTP stimulation. Right histogram: distributions of diffusion coefficients in Zone 1 immediately after sLTP stimulation (Post; gray) versus 10 min after sLTP (Post +10 min; blue). Line represents the probability density function of each histogram estimated by kernel density estimation (KDE). n=47–66 GluA1-HT vesicle trajectories pooled from six to nine sLTP stimulation experiments for each condition. (B) Fractions of GluA1-HT vesicles exhibiting active transport pre- or post-sLTP stimulation in each zone in the absence of MNI. n=6 sLTP stimulation experiments. (C) Left: distributions of diffusion coefficients for GluA1-HT vesicles in Zone 1 after sLTP (sLTP 1; blue) versus vesicles in Zone 1 after stimulation in the absence of MNI (No MNI 1; gray). ***p=0.0002 by Kolmogorov-Smirnov test. Right: diffusion coefficients for GluA1-HT vesicles in Zone 1 (No MNI 1; gray) versus Zone 2+3 (No MNI 2+3; blue) after sLTP in the absence of MNI. n=52–66 GluA1-HT vesicle trajectories pooled from six to nine sLTP stimulation experiments for each condition.
-
Figure 2—figure supplement 3—source data 1
Related to Figure 2—figure supplement 3.
- https://cdn.elifesciences.org/articles/80622/elife-80622-fig2-figsupp3-data1-v1.xlsx
Figure 2—figure supplement 4
sLTP increases the probability GluA1-HT vesicles switch from active transport to diffusion proximal to the site of stimulation.
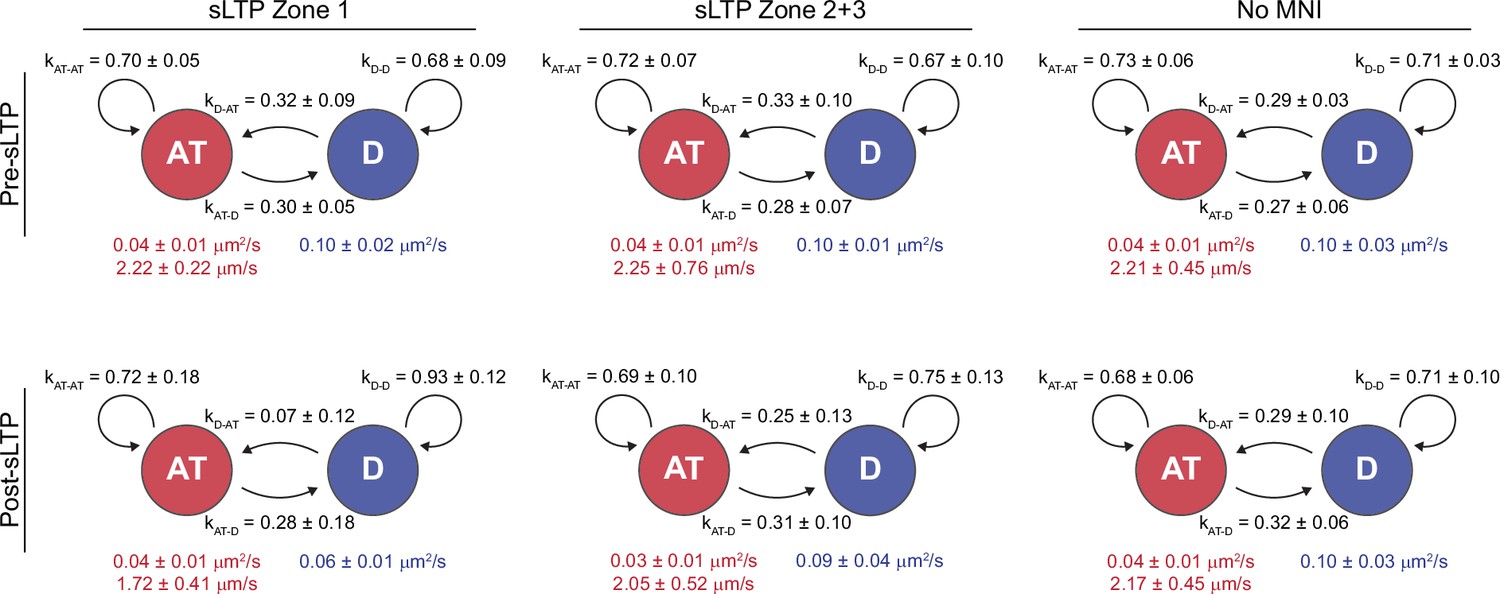
Average state-switching probabilities for multi-state GluA1-HT vesicles before and after sLTP stimulation in Zone 1 (Zone 1), Zone 2+3 (Zone 2+3), and in Zone 1 in the absence of MNI (No MNI). kAT-AT, probability that a GluA1-HT vesicle remains in active transport (AT); kAT-D, probability that a vesicle switch from active transport to diffusion (D); kD-AT, probability that a vesicle switch from diffusion to active transport; kD-D, probability that a vesicle remains in diffusion. Values in red are the velocity and diffusion coefficient of the vesicle during active transport while the value in blue is the diffusion coefficient of the vesicle during diffusion. sLTP Zone 1: pre-sLTP, kAT-D vs kD-AT, p=0.7104; post-sLTP, kAT-D vs kD-AT, *p=0.0195. sLTP Zone 2+3: pre-sLTP, kAT-D vs kD-AT, p=0.6200; post-sLTP, kAT-D vs kD-AT, p=0.5887. No MNI: pre-sLTP, kAT-D vs kD-AT, p=0.3829; post-sLTP, kAT-D vs kD-AT, p=0.8182. Significance was determined by Mann-Whitney test. n=6–7 multi-state GluA1-HT vesicle trajectories for each condition.
-
Figure 2—figure supplement 4—source data 1
Related to Figure 2—figure supplement 4.
- https://cdn.elifesciences.org/articles/80622/elife-80622-fig2-figsupp4-data1-v1.xlsx
Figure 2—video 1
Timelapse sequences of GluA1-HT-JF549 after block-and-chase labeling with JF646-HTL and JF549-HTL pre-sLTP (Figure 2—video 1, Pre-sLTP, left) and post-sLTP (Figure 2—video 1, Post-sLTP, right).
Scale bar, 5 μm. Yellow dot indicates site of MNI uncaging.
Figure 3 with 9 supplements
Reduced motion of GluA1-HT vesicles during synaptic activity is mediated by actin polymerization in the dendritic shaft.
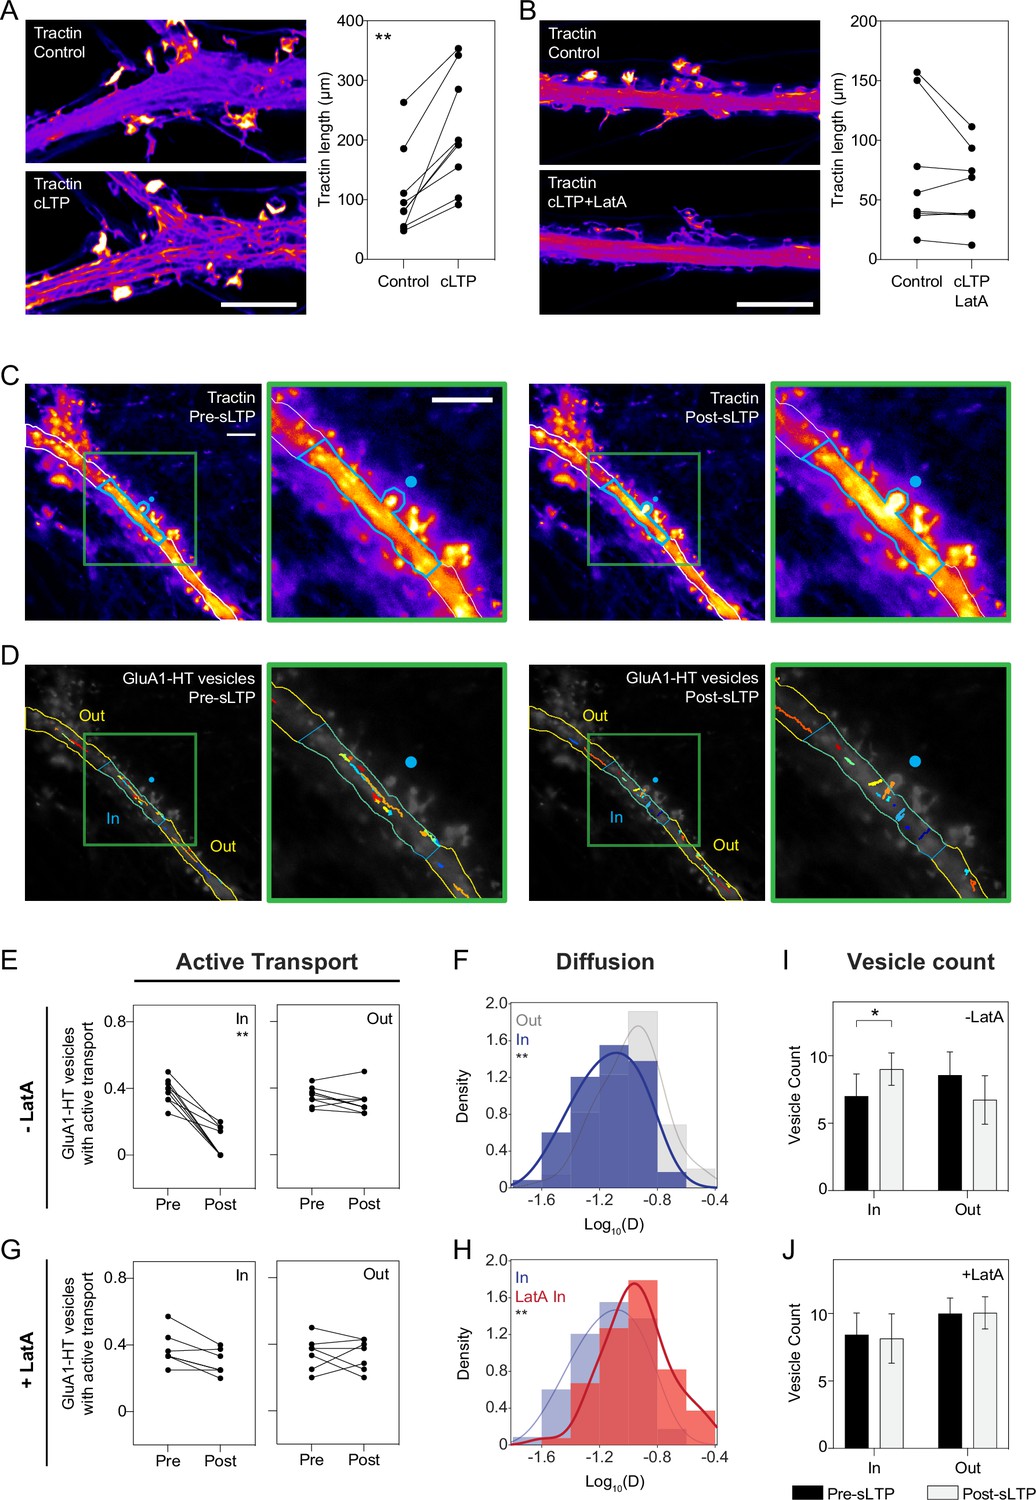
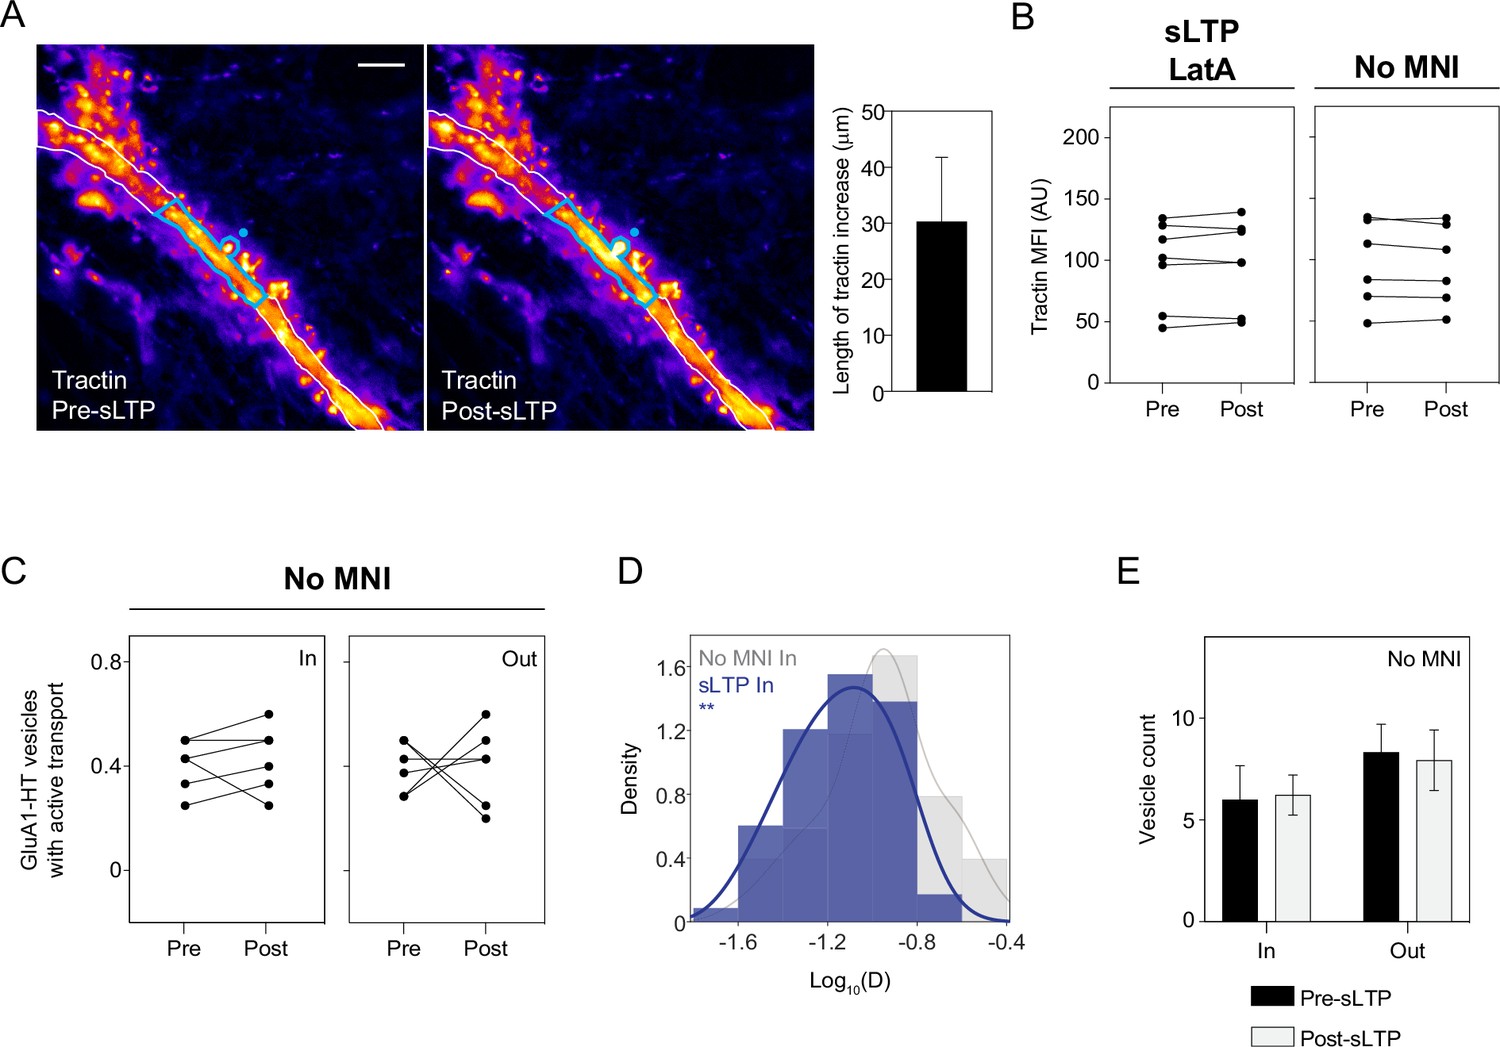
(A) Images: representative Airyscan images of F-tractin-mNeongreen (Tractin) in a dendrite before treatment (Control) and during cLTP (cLTP). Scale bar, 5 μm. Graph: combined length of tractin filaments (Tractin length) before treatment and during cLTP. **p=0.0039 by Wilcoxon matched pairs test. Each dot represents the tractin length in an imaged region of a dendrite. n=9 dendrite regions (each from one neuronal culture). (B) Same as (A), but in the presence of Latrunculin A (LatA). Scale bar, 5 μm. n=8 dendrite regions. (C) Representative epifluorescence images of tractin immediately before sLTP (Pre-sLTP) and after sLTP (Post-sLTP). Blue dot represents the site of uncaging. Blue outline denotes area with increased tractin signal after sLTP stimulation. Green inset: magnified image of tractin around the uncaging site. Scale bars, 10 μm. (D) GluA1-HT vesicle trajectories immediately before sLTP (Pre-sLTP) and after sLTP (Post-sLTP) inside (IN) and outside (OUT) the region where there was increased actin polymerization after sLTP stimulation. Green inset: magnified image of trajectories around the uncaging site. For video, see Figure 3—video 1. (E) Line graphs of fractions of GluA1-HT vesicles exhibiting active transport inside (IN) and outside (OUT) regions of actin polymerization pre- and post-sLTP. **p=0.0039 by Wilcoxon matched pairs test. Each dot represents the fraction of vesicles exhibiting active transport inside or outside the region with actin polymerization for a single sLTP stimulation experiment. n=9 sLTP stimulation experiments (each experiment targets one spine on one neuron) where GluA1-HT vesicle motion in the dendrite is captured immediately before and after sLTP stimulation. (F) Distributions of diffusion coefficients for GluA1-HT vesicles in regions with actin polymerization (IN; blue) versus regions without actin polymerization (OUT; gray) after sLTP stimulation. Lines represent the probability density function of each histogram estimated by kernel density estimation (KDE). **p=0.0053 by Kolmogorov-Smirnov test. n=59–73 GluA1-HT vesicle trajectories pooled together from nine sLTP stimulation experiments. (G) Same as (E), but in the presence of LatA. IN region defined as the 30 μm region flanking the uncaging site (the average length of dendrite where actin polymerization occurs after sLTP; Figure 3—figure supplement 3A), as we do not detect actin polymerization in the presence of LatA. n=7 sLTP stimulation experiments. (H) Distributions of diffusion coefficients for GluA1-HT vesicles in regions with actin polymerization (IN; blue) versus GluA1-HT vesicles in similar sized regions in the presence of LatA (LatA IN; red). **p=0.0013 by Kolmogorov-Smirnov test. n=59–67 GluA1-HT vesicle trajectories pooled together from seven to nine sLTP stimulation experiments for each condition. (I–J) Bar graphs of adjusted vesicle counts inside (IN) or outside (OUT) regions with actin polymerization after sLTP (I) or sLTP in the presence of LatA (J). Error bars represent standard deviation. *p=0.0111 by Mann-Whitney test. n=7–9 sLTP stimulation experiments for each condition.
-
Figure 3—source data 1
Related to Figure 3.
- https://cdn.elifesciences.org/articles/80622/elife-80622-fig3-data1-v1.xlsx
Figure 3—figure supplement 1
Measuring the length of tractin filaments.
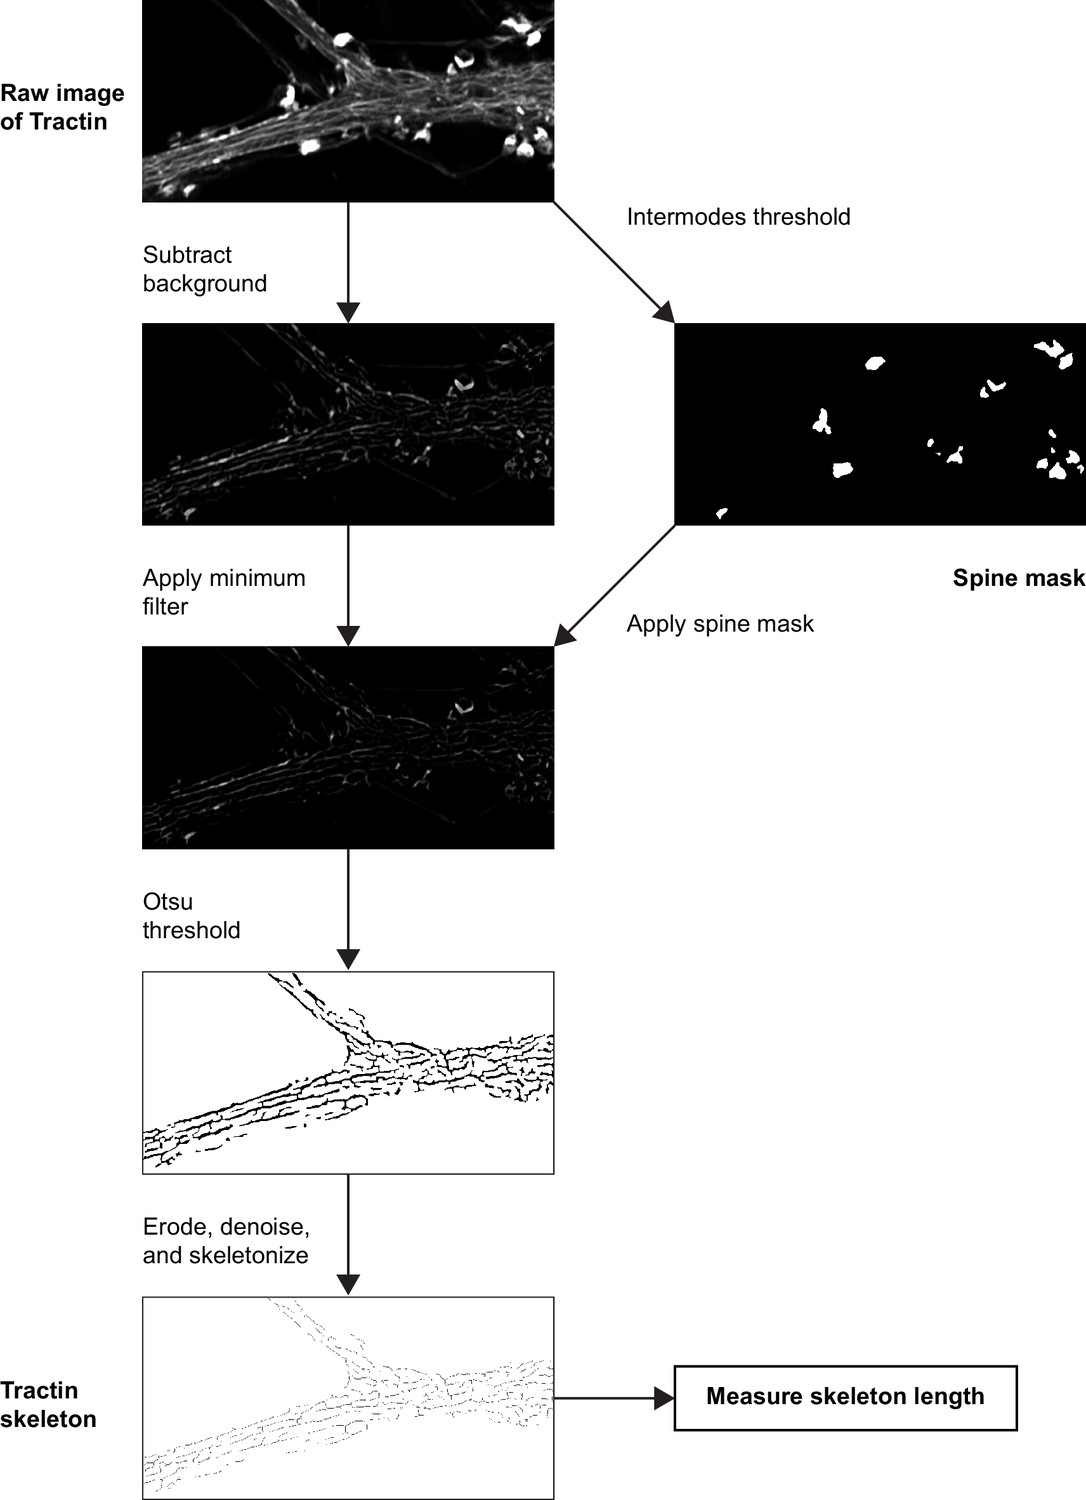
To measure the length of tractin filaments, we first generated a mask for spines by thresholding the brightest signals in an image (as F-actin is concentrated in spines, tractin signal is typically strongest in spines) using the Intermodes method, an automatic intensity thresholding method. Next, we applied rolling ball background subtraction and a minimum filter to improve the signal-to-noise ratio of tractin filaments. We then applied the spine mask to remove tractin signals from spines. We used Otsu’s method to threshold the resulting image and generate a binary mask of the tractin filaments. We then eroded and denoised the image to remove punctate signal and reduce thick signals that cannot be properly skeletonized. Finally, we skeletonized this binary mask and used the AnalyzeSkeleton ImageJ plugin (Arganda-Carreras et al., 2010) to measure the length of filaments. Dendrites prior to cLTP stimulation often did not have obvious tractin filaments. Consequently, we first processed post-cLTP images, and then applied thresholding values used for the post-cLTP images (identified using Otsu’s method) to the pre-cLTP image.
Figure 3—figure supplement 2
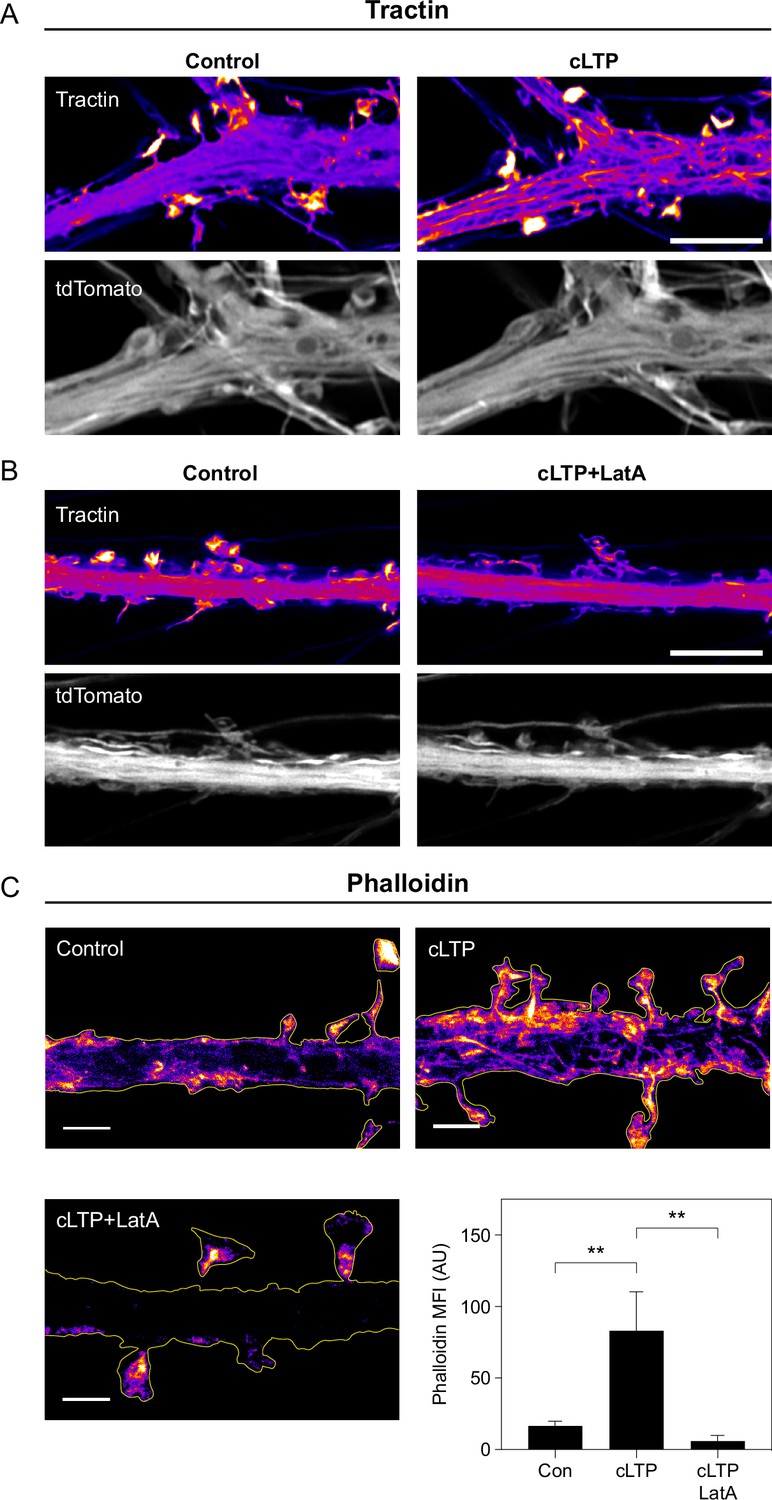
cLTP stimulation leads to increased actin polymerization.
(A) Representative Airyscan images of tractin and tdTomato in a dendrite under control conditions and during cLTP. Scale bar, 5 μm. (B) Representative Airyscan images of tractin and tdTomato in a dendrite under control conditions and during cLTP in the presence of Latrunculin A (LatA). Scale bar, 5 μm. (C) Images: representative STED images of phalloidin staining in dendrites without treatment (Control), during cLTP (cLTP), and during cLTP in presence of LatA (cLTP +LatA). Scale bars, 2 μm. Graph: mean fluorescence intensity (MFI) of phalloidin staining. Bars represent mean and standard deviation. Con vs cLTP, **p=0.0079; cLTP vs cLTP +LatA, **p=0.0079. Significance was determined by Mann-Whitney test. n=5 phalloidin images (each image is of one region of dendrite from one neuron) for each condition.
-
Figure 3—figure supplement 2—source data 1
Related to Figure 3—figure supplement 2.
- https://cdn.elifesciences.org/articles/80622/elife-80622-fig3-figsupp2-data1-v1.xlsx
Figure 3—figure supplement 3
sLTP stimulation increases actin polymerization in the dendritic shaft proximal to the site of stimulation.
(A) Images: representative epifluorescence images of tractin immediately before sLTP (Pre-sLTP) and after sLTP (Post-sLTP). Blue dot indicates the site of uncaging. Blue outline denotes area with increased tractin signal after stimulation. Scale bar, 10 μm. Bar graph: mean length (along the length of the dendrite) of the regions proximal to stimulated spines where increased tractin MFI was observed after sLTP (i.e. length of the blue outline). Error bar represents standard deviation. n=9 sLTP stimulation experiments (each experiment targets one spine on one neuron). (B) Mean fluorescence intensity (MFI) of tractin in dendrites pre- and post-sLTP in the presence of LatA (sLTP +LatA) and sLTP stimulation in the absence of MNI (No MNI). Tractin intensity was measured across the entire length of the dendrite because there were no specific regions where an increase in tractin intensity could be observed. n=6–7 sLTP stimulation experiments for each condition. (C) Line graphs of fractions of GluA1-HT vesicles exhibiting active transport before and after sLTP stimulation in the absence of MNI (No MNI). Because we did not detect significant increases in actin polymerization for No MNI, IN regions were determined by isolating the 30 μm region flanking the uncaging site, which was the mean length of the region where actin polymerization occurred after sLTP. n=6 sLTP stimulation experiments where GluA1-HT vesicle motion in the dendrite is captured immediately before and after sLTP stimulation. (D) Distributions of diffusion coefficients for GluA1-HT vesicles in regions with actin polymerization after sLTP (sLTP IN; blue) versus in equivalent regions after stimulation in the absence of MNI (No MNI IN; gray). Lines represent the probability density function of each histogram estimated by kernel density estimation (KDE). **p=0.0064 by Kolmogorov-Smirnov test. n=51–59 GluA1-HT vesicle trajectories pooled from six to nine sLTP stimulation experiments. (E) Bar graphs of adjusted vesicle counts after sLTP stimulation in the absence of MNI (No MNI). Error bars represent standard deviation. n=6 sLTP stimulation experiments.
-
Figure 3—figure supplement 3—source data 1
Related to Figure 3—figure supplement 3.
- https://cdn.elifesciences.org/articles/80622/elife-80622-fig3-figsupp3-data1-v1.xlsx
Figure 3—figure supplement 4
sLTP-induced actin polymerization increases the probability GluA1-HT vesicles switch from active transport to diffusion.
Average state-switching probabilities for multi-state GluA1-HT vesicles before and after sLTP stimulation inside regions with actin polymerization (IN), outside regions with actin polymerization (OUT), and in the presence of LatA (LatA). kAT-AT, probability that a GluA1-HT vesicle remains in active transport (AT); kAT-D, probability that a vesicle switch from active transport to diffusion (D); kD-AT, probability that a vesicle switch from diffusion to active transport; kD-D, probability that a vesicle remains in diffusion. Values in red are the velocity and diffusion coefficient of the vesicle during active transport while the value in blue is the diffusion coefficient of the vesicle during diffusion. IN: pre-sLTP, kAT-D vs kD-AT, p=0.4848; post-sLTP, kAT-D vs kD-AT, *p=0.0317. OUT: pre-sLTP, kAT-D vs kD-AT, p=0.3823; post-sLTP, kAT-D vs kD-AT, p=0.4848. LatA: pre-sLTP, kAT-D vs kD-AT, p=0.9015; post-sLTP, kAT-D vs kD-AT, p>0.9999. Significance was determined by Mann-Whitney test. n=5–8 multi-state GluA1-HT vesicle trajectories for each condition.
-
Figure 3—figure supplement 4—source data 1
Related to Figure 3—figure supplement 4.
- https://cdn.elifesciences.org/articles/80622/elife-80622-fig3-figsupp4-data1-v1.xlsx
Figure 3—figure supplement 5
Blocking actin polymerization with LatA disrupts the effect of cLTP on the motion of GluA1-HT vesicles.
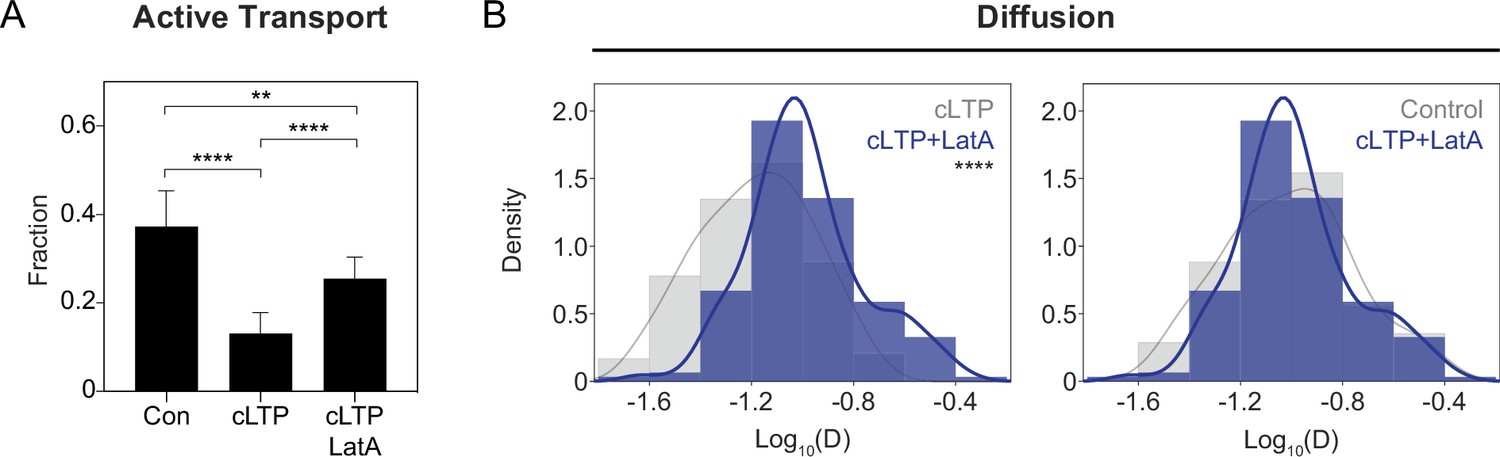
(A) Fraction of GluA1-HT vesicles exhibiting active transport in dendritic shafts without treatment (Con), during cLTP (cLTP), and during cLTP in the presence of LatA (cLTP +LatA). Con vs cLTP, ****p<0.0001; Con vs cLTP +LatA, **p=0.0010; cLTP vs cLTP +LatA, ****p<0.0001. Significance was determined by Mann-Whitney test. n=9–14 timelapse imaging sequences (each timelapse captures the motion of GluA1-HT vesicles in one region of dendrite in one neuronal culture) for each condition. (B) Histograms: distributions of diffusion coefficients for GluA1-HT vesicles in dendritic shafts during cLTP +LatA (blue) versus cLTP (gray; left) or Control (gray; right). Line represents the probability density function of each histogram estimated by kernel density estimation (KDE). cLTP vs cLTP +LatA, ****p<0.0001 by Kolmogorov-Smirnov test. n=227–360 GluA1-HT vesicle trajectories pooled from 9 to 14 timelapse imaging sequences.
-
Figure 3—figure supplement 5—source data 1
Related to Figure 3—figure supplement 5.
- https://cdn.elifesciences.org/articles/80622/elife-80622-fig3-figsupp5-data1-v1.xlsx
Figure 3—figure supplement 6
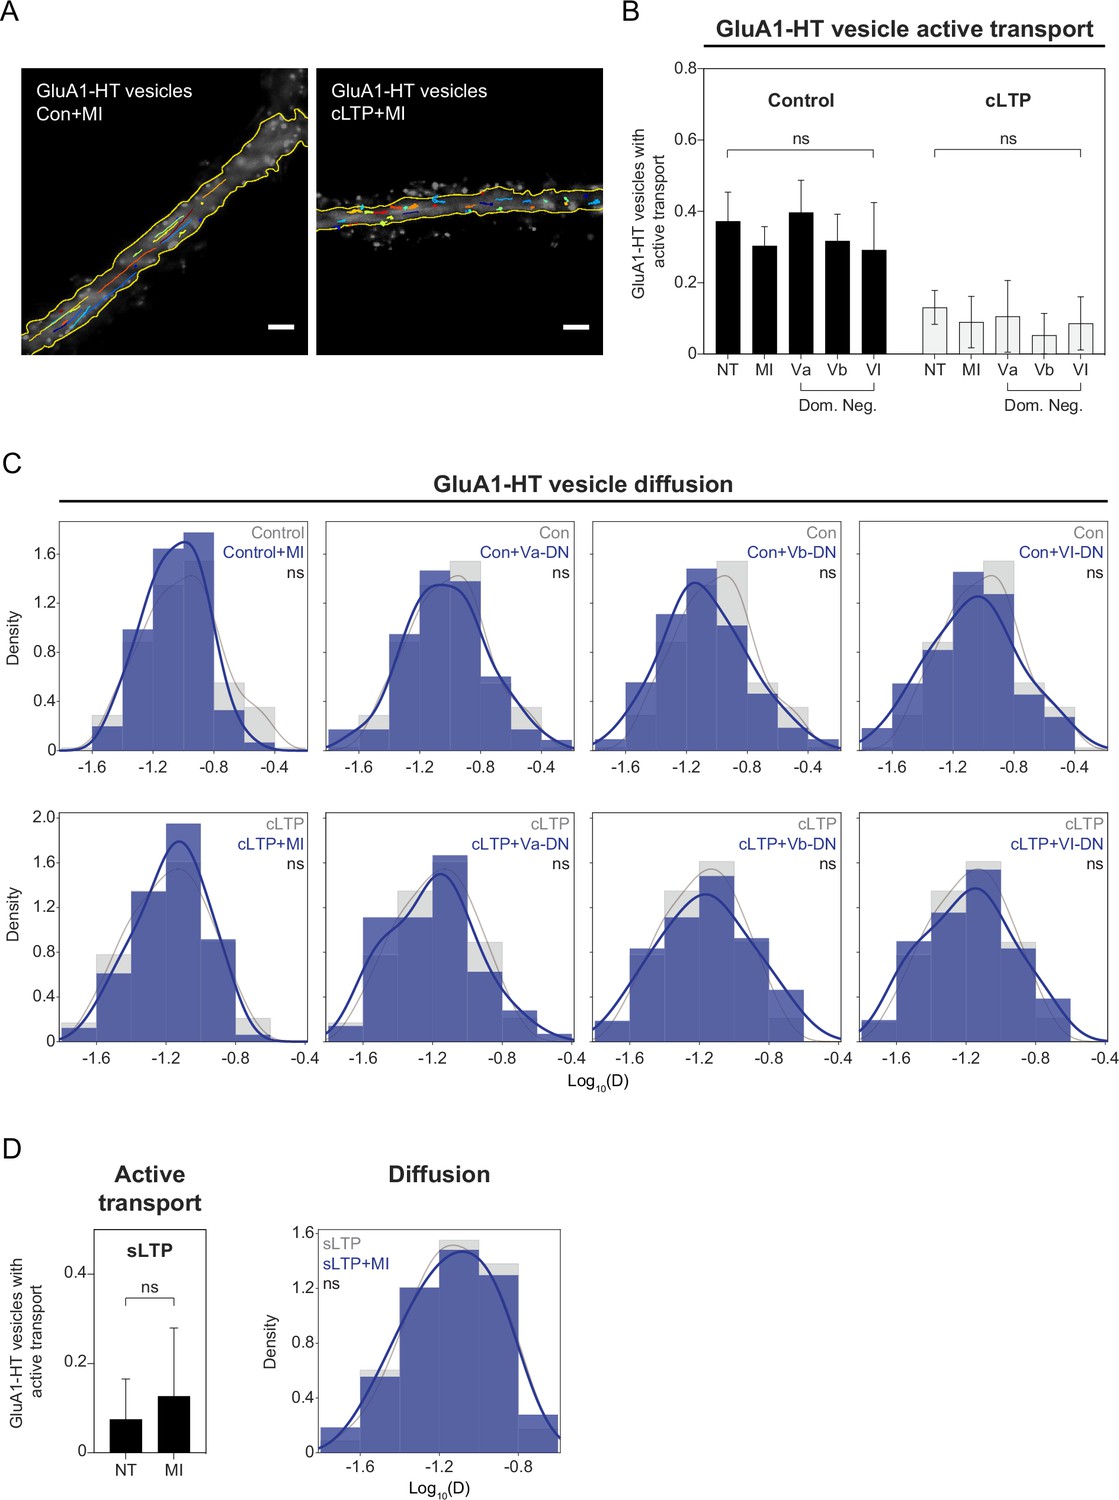
Inhibition of myosin V and VI does not affect the motion states of GluA1-HT vesicles.
(A) GluA1-HT vesicle trajectories in the presence of a myosin V and VI inhibitor cocktail (MI) without stimulation (Con +MI) or during cLTP induction (cLTP +MI). Trajectories are overlaid onto images of GFP-Homer1c. Scale bars, 5 μm. For videos, see Figure 3—video 2 and Figure 3—video 3. (B) Fractions of GluA1-HT vesicles exhibiting active transport in the presence of inhibitory C-terminal domains of Myosin Va, Vb, or VI (dominant-negative), or pharmacological inhibition (MI), without stimulation or during cLTP. NT, not treated with inhibitors or dominant-negative C-terminal domains. Bars represent mean and standard deviation. Significance was determined by Mann-Whitney test. n=3–14 timelapse imaging sequences (each timelapse captures the motion of GluA1-HT vesicles in one region of dendrite in one neuronal culture) for each condition. (C) Distributions of diffusion coefficients of GluA1-HT vesicles in dendritic shafts in the presence of inhibitory C-terminal domains of Myosin Va, Vb, or VI (dominant-negative; blue), or pharmacological inhibition (MI; blue), without stimulation (top row) or during cLTP (bottom row). Lines represent the probability density function of each histogram estimated by kernel density estimation (KDE). n=54–360 GluA1-HT vesicle trajectories pooled from 3 to 14 timelapse imaging sequences for each condition. (D) Left bar graph: fractions of GluA1-HT vesicles exhibiting active transport in the presence of a myosin inhibitor cocktail (MI) without stimulation or after sLTP. NT, not treated with inhibitors. Bars represent mean and standard deviation. Significance was determined by Mann-Whitney test. n=6–9 sLTP stimulation experiments (each experiment targets one spine on one neuron) where GluA1-HT vesicle motion in the dendrite is captured immediately after sLTP stimulation. Right histogram: distribution of diffusion coefficients of GluA1-HT vesicles after sLTP stimulation in dendritic shafts in the presence of a myosin inhibitor cocktail (MI; blue). Lines represent the probability density function of each histogram estimated by kernel density estimation (KDE). Significance was determined by Kolmogorov-Smirnov test. n=54–59 GluA1-HT vesicle trajectories pooled from six to nine sLTP stimulation experiments for each condition.
-
Figure 3—figure supplement 6—source data 1
Related to Figure 3—figure supplement 6.
- https://cdn.elifesciences.org/articles/80622/elife-80622-fig3-figsupp6-data1-v1.xlsx
Figure 3—video 1
Timelapse sequences of GluA1-HT-JF549 after block-and-chase labeling with JF646-HTL and JF549-HTL pre-sLTP (Figure 3—video 1, Pre-sLTP, left) and post-sLTP (Figure 3—video 1, Post-sLTP, right).
Scale bar, 5 μm. Yellow dot indicates site of MNI uncaging. Performed in neuron also expressing tractin to characterize the motion of GluA1-HT vesicles in areas where actin polymerization occurs.
Figure 3—video 2
Timelapse sequence of GluA1-HT-JF549 after block-and-chase labeling with JF646-HTL and JF549-HTL in a dendrite that has been treated with a myosin inhibitor cocktail with no cLTP stimulation (Con +MI).
Scale bar, 5 μm. Left: GFP-Homer1c. Center: GluA1-HT-JF549 (chase). Right: GluA1-HT-JF549 (green) overlaid onto GFP-Homer1c (magenta). Related to Figure 3—figure supplement 6.
Figure 3—video 3
Timelapse sequence of GluA1-HT-JF549 after block-and-chase labeling with JF646-HTL and JF549-HTL in a dendrite that has been treated with a myosin inhibitor cocktail during cLTP induction (cLTP +MI).
Scale bar, 5 μm. Left: GFP-Homer1c. Center: GluA1-HT-JF549 (chase). Right: GluA1-HT-JF549 (green) overlaid onto GFP-Homer1c (magenta). Related to Figure 3—figure supplement 6.
Figure 4 with 1 supplement
F-actin-induced molecular crowding inhibits the motion of particles near the sites of synaptic activity.
(A) Fractions of GluA1-HT vesicles exhibiting active transport in dendritic shafts without treatment (Con) versus during treatment with Jasplakinolide (Jsp) or Jsp with pharmacological inhibition of myosin (Jsp +MI). Bars represent mean and standard deviation. Con vs Jsp, ****p<0.0001. Significance was determined by Mann-Whitney test. n=9–12 timelapse imaging sequences (each timelapse captures the motion of GluA1-HT vesicles in one region of dendrite in one neuronal culture) for each condition. (B) Left: distributions of diffusion coefficients of GluA1-HT vesicles in dendritic shafts without treatment (Control; gray) versus during treatment with Jsp (Jsp; blue). Lines represent the probability density function of each histogram estimated by kernel density estimation (KDE). Control vs Jsp, ****p<0.0001 by Kolmogorov-Smirnov test. Right: distributions of diffusion coefficients of GluA1-HT vesicles in dendritic shafts during treatment with Jsp (Jsp; blue) versus Jsp with pharmacological inhibition of myosin (Jsp +MI; red). n=60–227 GluA1-HT vesicle trajectories pooled from 9 to 12 timelapse imaging sequences for each condition. (C) Schematic: GEM-HT-ST rheological probe (top). GEM-HT-ST was created by fusing HaloTag (HT) and SNAP-tag (ST) to the PfV protein from Pyroccocus furiosus (bottom; Delarue et al., 2018). When expressed, PfV-HT-ST fusion proteins self-assemble into a 40 nm encapsulin scaffold that can be labeled with either JF549-HTL or JF549-SNAP-tag ligand (JF549-STL). Image: trajectories of GEM-HT-ST labeled with JF549-HTL. Scale bar, 10 μm. For video, see Figure 4—video 1. (D) Distributions of diffusion coefficients of GEM-HT-ST after chemical stimulation. Control (gray) vs cLTP (blue), **p=0.0047; Control (gray) vs Jsp (blue), **p=0.0011. Significance was determined by Kolmogorov-Smirnov test. n=57–94 GEM-HT-ST trajectories pooled together from six to nine timelapse imaging sequences for each condition. (E) Distributions of diffusion coefficients of GEM-HT-ST after sLTP in regions where actin polymerization occurred versus controls. IN region was determined by isolating a 30 μm region flanking the uncaging site (the average length of dendrite where actin polymerization occurs after sLTP; Figure 3—figure supplement 3A). sLTP IN (blue) vs sLTP OUT (gray), **p=0.0083; sLTP IN (blue) vs No MNI IN (gray), *p=0.0446. n=44–59 GEM-HT-ST trajectories pooled together from six to nine sLTP stimulation experiments (each experiment targets one spine on one neuron) where GEM-HT-ST motion in the dendrite is captured immediately after sLTP stimulation.
-
Figure 4—source data 1
Related to Figure 4.
- https://cdn.elifesciences.org/articles/80622/elife-80622-fig4-data1-v1.xlsx
Figure 4—video 1
Timelapse sequence of GEM-HT-ST labeled with JF549-HTL in the dendrite of a cultured rat hippocampal neuron under control conditions.
Scale bar, 5 μm.
Figure 5 with 6 supplements
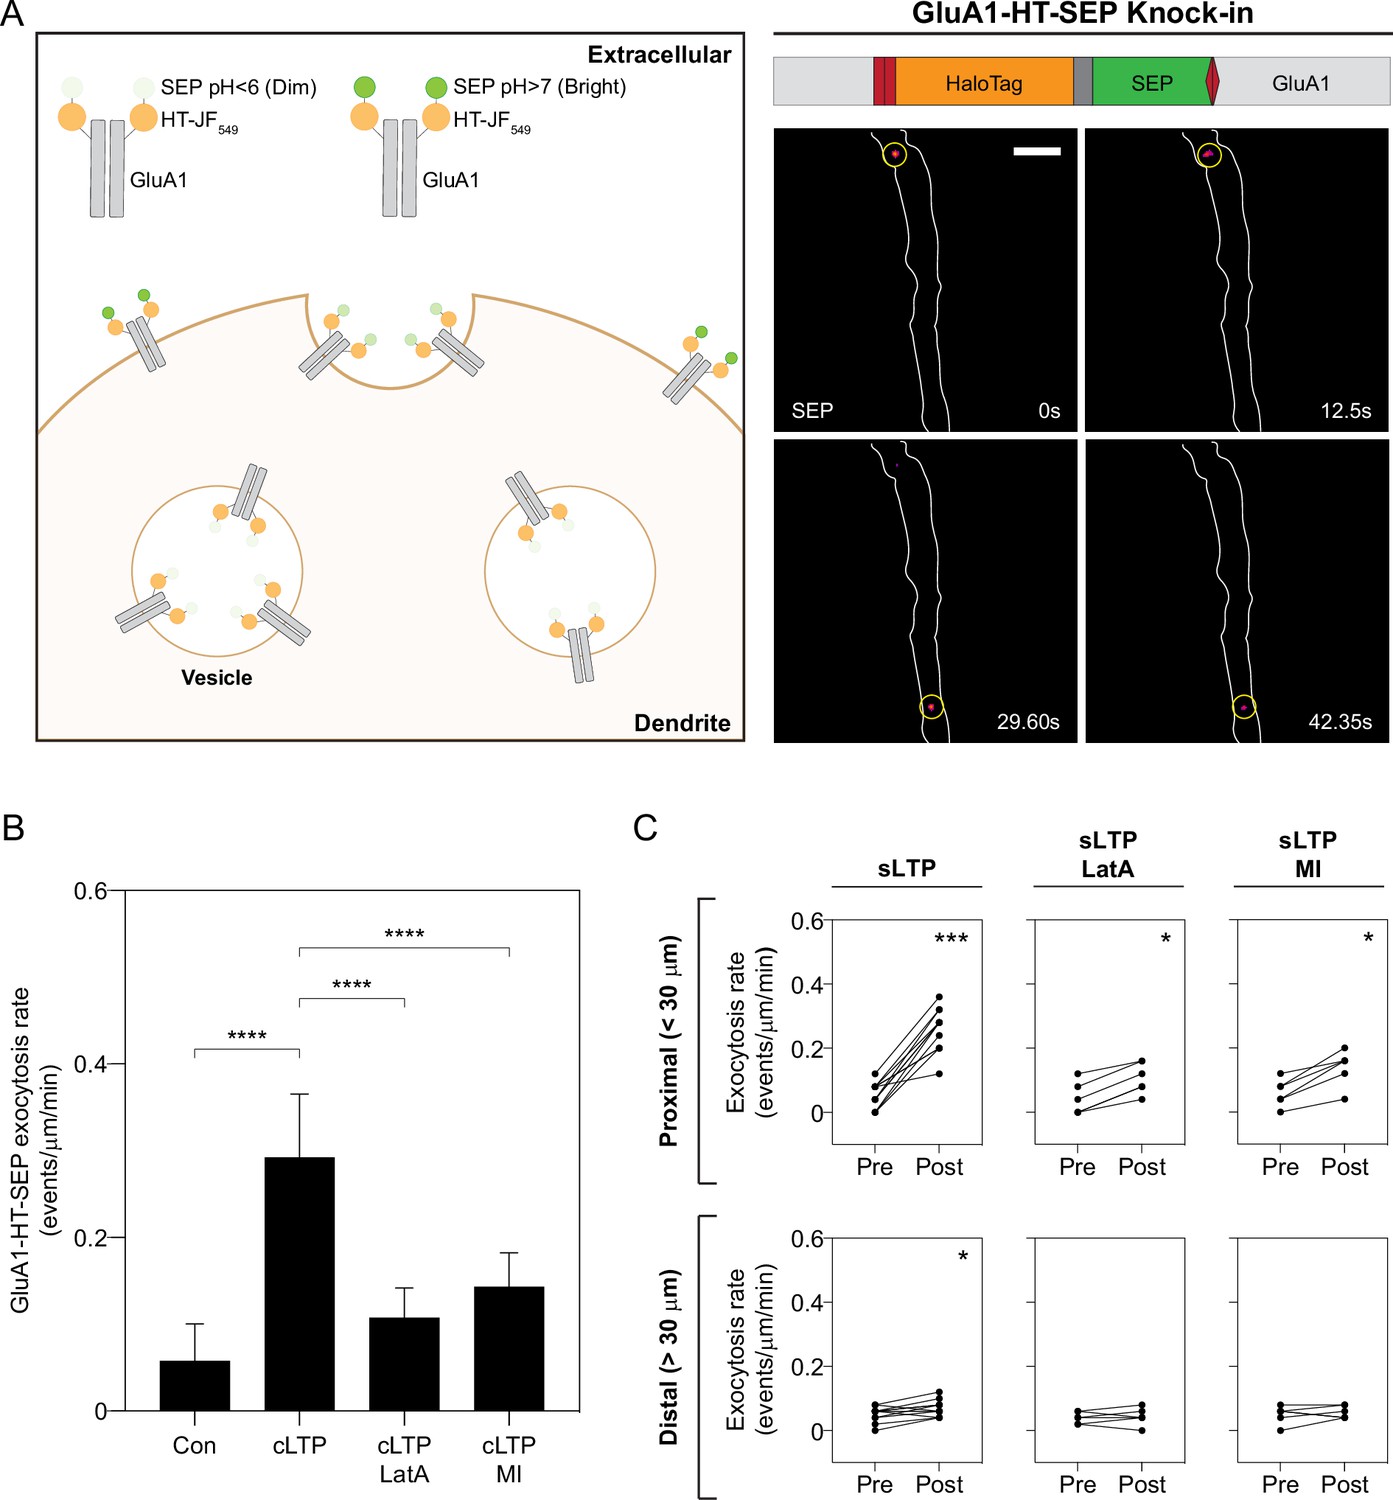
Increased GluA1-HT-SEP exocytosis triggered by synaptic activity is dependent on actin polymerization and myosin activity.
(A) Tagging endogenous GluA1 with a HaloTag-pHluorin tandem fusion reporter (HT-SEP) to track GluA1 exocytosis events. Diagram: endogenous GluA1 tagged with HT-SEP (GluA1-HT-SEP, schematic of fusion on right) has low SEP fluorescence inside vesicles due to the low pH of the vesicle lumen. When a GluA1 exocytosis event occurs, SEP will be exposed to the neutral pH of the extracellular medium, resulting in increased fluorescence. Because receptors are temporarily spatially restricted during exocytosis, a spot with fluorescence can be observed during the event. Images: timelapse of two GluA1-HT-SEP exocytosis events (yellow circles). Scale bar, 5 μm. For video, see Figure 5—video 1. (B) Bar graph of GluA1-HT-SEP exocytosis in response to cLTP in the absence or presence of Latrunculin A (LatA) or pharmacological myosin inhibition (MI). Bars represent mean events per μm per min and standard deviation. Con vs cLTP, ****p<0.0001; cLTP vs cLTP +LatA, ****p<0.0001; cLTP vs cLTP +MI, ****p<0.0001. Significance was determined by Mann-Whitney test. n=12 timelapse imaging sequences (each timelapse captures GluA1-HT-SEP exocytosis in one region of dendrite in one neuronal culture) for each condition. (C) Line graphs of GluA1-HT-SEP exocytic events before and after sLTP (sLTP), sLTP in the presence of LatA (sLTP +LatA), and sLTP in the presence of MI (sLTP +MI). Proximal: GluA1-HT-SEP exocytic events within the 30 μm region surrounding the site of uncaging (i.e. the average length of dendrite where actin polymerization occurs near the site of uncaging after sLTP; see Figure 3—figure supplement 3A). sLTP, ***p=0.0005; sLTP +LatA, *p=0.0312; sLTP +MI, *p=0.0312. Distal: GluA1-HT-SEP exocytic events outside of the 30 μm region surrounding the site of uncaging. sLTP, *p=0.0430. Significance was determined by Wilcoxon matched pairs test. Each dot represents the number of exocytic events in the indicated region. n=6–12 sLTP stimulation experiments (each experiment targets one spine on one neuron) where GluA1-HT-SEP exocytosis in the dendrite is captured immediately before and after sLTP stimulation.
-
Figure 5—source data 1
Related to Figure 5.
- https://cdn.elifesciences.org/articles/80622/elife-80622-fig5-data1-v1.xlsx
Figure 5—figure supplement 1
Endogenous GluA1 tagged with HaloTag-SEP reporter via HITI is trafficked to postsynaptic densities.
(A) Schematic of Gria1 gene targeting with HaloTag-SEP by HITI. (B) Images: representative confocal images of a two-color HCR RNA-FISH labeling experiment with probes targeting HaloTag-SEP mRNA (HaloTag-SEP) or Gria1 mRNA (Gria1). Scale bar, 5 µm. Bar graph: fraction of HaloTag-SEP mRNA spots located within 0.5 μm of Gria1 mRNA spots, and fraction of Gria1 mRNA spots located within 0.5 μm of HaloTag-SEP mRNA spots. n=10 images (each image is of a neuron labeled with both probes for Gria1 mRNA and HaloTag-SEP mRNA). Correlated localization was used to establish intramolecular labeling between two probe sets (Materials and methods). (C) Representative STED images of a dendritic spine expressing endogenous GluA1 tagged with HaloTag-SEP labeled with anti-GluA1 antibody (GluA1) and anti-HaloTag antibody (HaloTag-SEP). Scale bar, 2 μm. (D) Pearson correlation coefficients (PCC) and Manders’ overlap coefficients (MC1 and MC2) between HaloTag and GluA1 labeling. Bars represent mean and standard deviation. Significance was determined by Mann-Whitney test. n=8 images (each image is of a region of dendrite from one neuron labeled with anti-GluA1 and anti-HaloTag antibodies). (E) Representative STED images of dendritic spines labeled with anti-GluA1 (top) or anti-HaloTag (bottom) antibodies and anti-Homer1, anti-PSD-95, or anti-GluN1 antibodies. Scale bars, 2 μm. (F) Top: mean distances between the centers of HaloTag-SEP (HT-SEP) or GluA1 (A1) fluorescence puncta and Homer1, PSD-95, or GluN1 fluorescence puncta. Bars represent mean and standard deviation. n=50–145 unique pairs of puncta from seven to nine dendrite images for each labeling combination (e.g. HaloTag-SEP and Homer1). Bottom: fractions of spines with only GluA1 or HaloTag-SEP; only a postsynaptic density (PSD) marker; or both GluA1 or HaloTag-SEP and a PSD marker. n=50–110 spines from seven to nine dendrite images for each labeling combination. Significance was determined by Mann-Whitney test.
-
Figure 5—figure supplement 1—source data 1
Related to Figure 5—figure supplement 1.
- https://cdn.elifesciences.org/articles/80622/elife-80622-fig5-figsupp1-data1-v1.xlsx
Figure 5—figure supplement 2
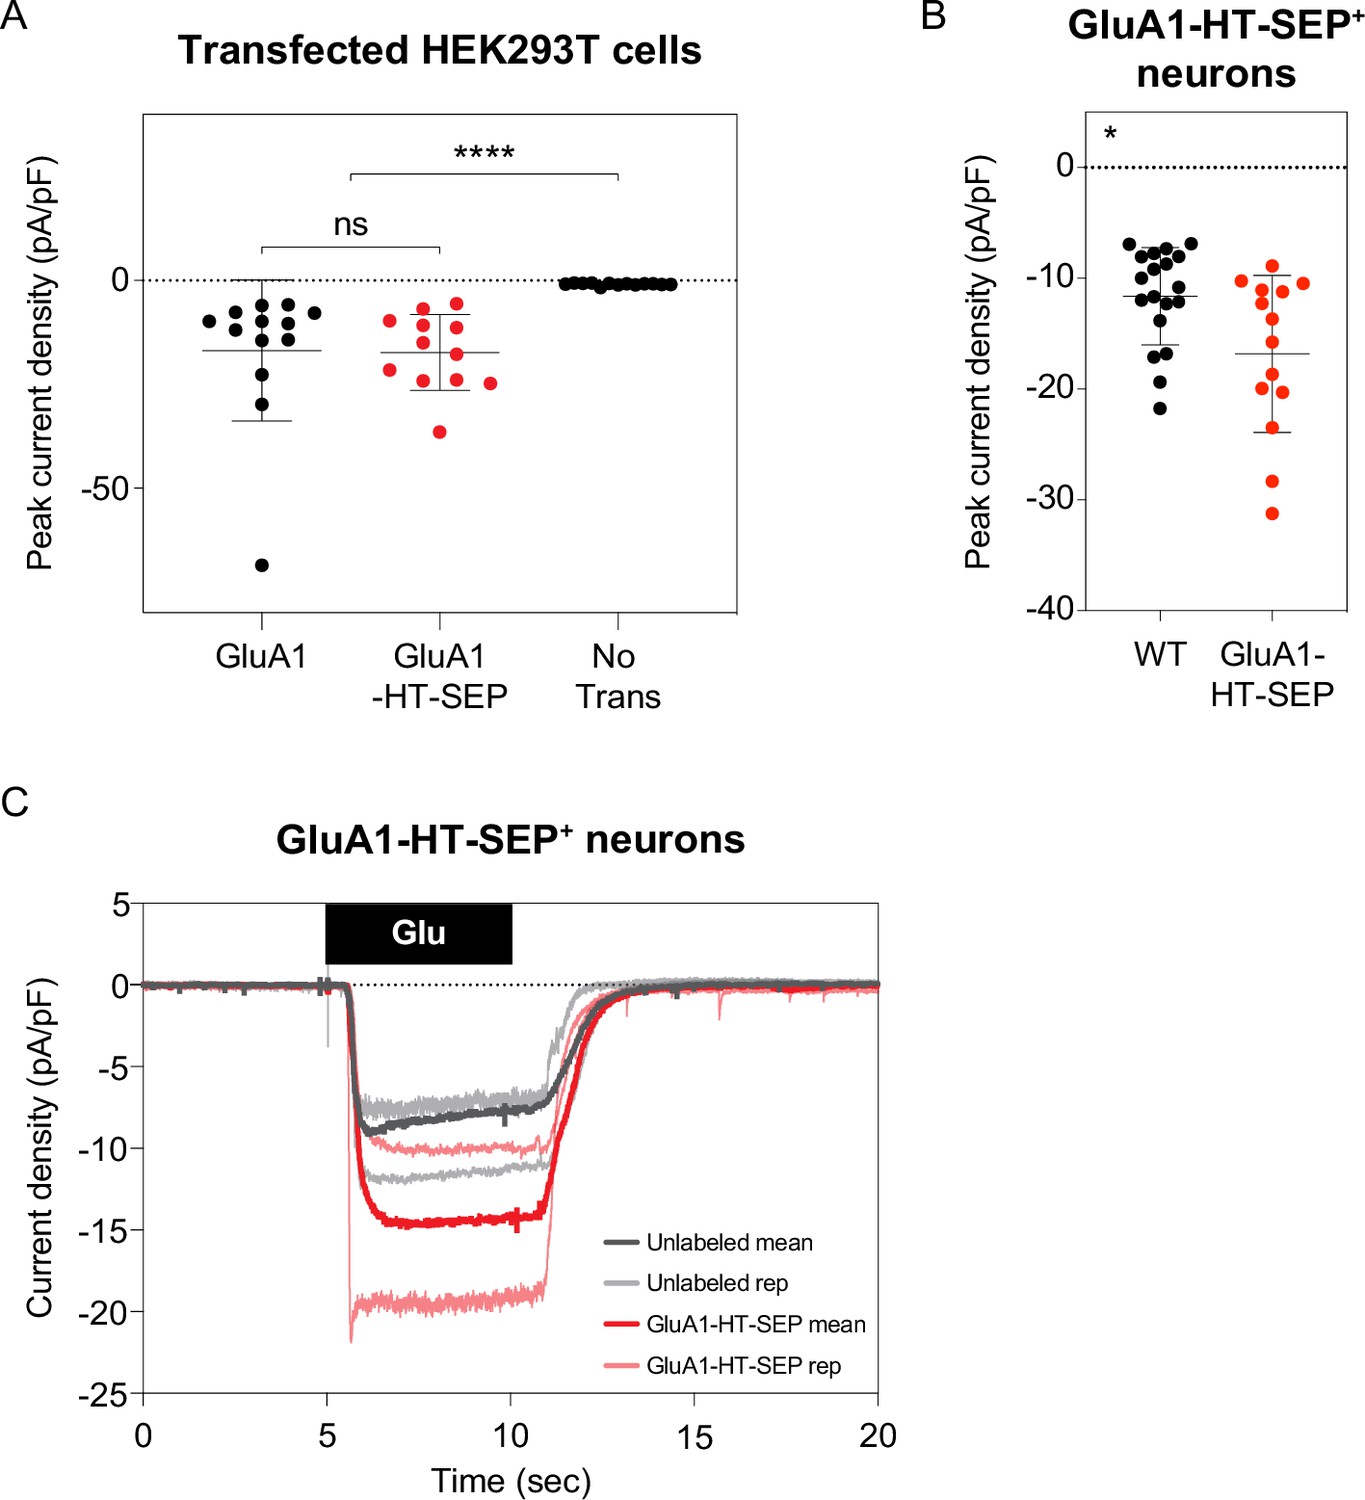
Currents elicited by GluA1-HT-SEP are similar to currents elicited by untagged GluA1.
(A) Currents elicited by human embryonic kidney (HEK) 293T cells expressing GluA1 or GluA1-HT-SEP in response to locally perfused glutamate. Crosshairs represent mean and standard deviation of peak current densities (pA/pF) for each condition. Each dot represents a single recording. ****p<0.0001 by Mann-Whitney test. GluA1, n=13; GluA1-HT-SEP, n=12; No Transfection, n=13. Current densities for HEK293T cells were recorded following local application of 2 mM glutamate with 50 µM cyclothiazide for 10 s. (B) Currents elicited by GluA1-HT-SEP and unlabeled neurons in response to locally perfused glutamate. *p=0.0192 by Mann-Whitney test. GluA1-HT-SEP, n=14; unlabeled, n=19. Current densities for GluA1-HT-SEP neurons and unlabeled neurons were recorded following a 5 s 100 µM glutamate stimulation at a –70 mV holding potential. (C) Current density traces for GluA1-HT-SEP and unlabeled neurons in response to glutamate. Thin lines represent currents from two individual cells under each condition while thick lines represent mean currents. The small but notable reduction in mean trace peak amplitudes is a consequence of data decimation necessary for figure generation. GluA1-HT-SEP exhibits a modest but significant increase in current in edited neurons, possibly reflecting some disruptive properties of the HT-SEP tandem reporter. Nevertheless, GluA1-HT-SEP is trafficked to synapses in a similar manner to GluA1, and its function is not inhibited by the insertion of HT-SEP.
-
Figure 5—figure supplement 2—source data 1
Related to Figure 5—figure supplement 2.
- https://cdn.elifesciences.org/articles/80622/elife-80622-fig5-figsupp2-data1-v1.xlsx
Figure 5—figure supplement 3

sLTP stimulation in the absence of MNI does not increase GluA1-HT-SEP exocytosis.
Line graphs of GluA1-HT-SEP exocytic events before and after sLTP stimulation in the absence of MNI (No MNI). Proximal: GluA1-HT-SEP exocytic events within the 30 μm region surrounding the site of uncaging (i.e. the average length of dendrite where actin polymerization occurs near the site of uncaging during sLTP; see Figure 3—figure supplement 3A). Distal: GluA1-HT-SEP exocytic events outside of the 30 μm region surrounding the site of uncaging. n=6 sLTP stimulation experiments (each experiment targets one spine on one neuron) where GluA1-HT-SEP exocytosis in the dendrite is captured immediately before and after sLTP stimulation.
-
Figure 5—figure supplement 3—source data 1
Related to Figure 5—figure supplement 3.
- https://cdn.elifesciences.org/articles/80622/elife-80622-fig5-figsupp3-data1-v1.xlsx
Figure 5—video 1
Timelapse sequence of GluA1-HT-SEP exocytosis in the dendrite of a cultured rat hippocampal neuron under control conditions.
Scale bar, 5 μm. White circles denote sites of exocytosis.
Figure 5—video 2
Timelapse sequence of GluA1-HT-SEP exocytosis in a dendrite during cLTP induction.
Scale bar, 5 μm. White circles denote sites of exocytosis.
Figure 5—video 3
Timelapse sequence of GluA1-HT-SEP exocytosis in a dendrite pre-sLTP (Figure 5—video 3, Pre-sLTP, left) and post-sLTP (Figure 5—video 3, Post-sLTP, right).
Scale bar, 5 μm. Yellow dot indicates site of MNI uncaging. White circles denote sites of exocytosis outside the 30 μm region flanking the uncaging site (OUT). Green circles denote sites of exocytosis inside the 30 μm region flanking the uncaging site (IN).
Figure 6 with 3 supplements
GluA1-HT-SEP vesicles are drawn from a local pool in the dendritic shaft prior to exocytosis and exhibit lateral motion that is dependent on actin polymerization and myosin in the shaft during synaptic activity.
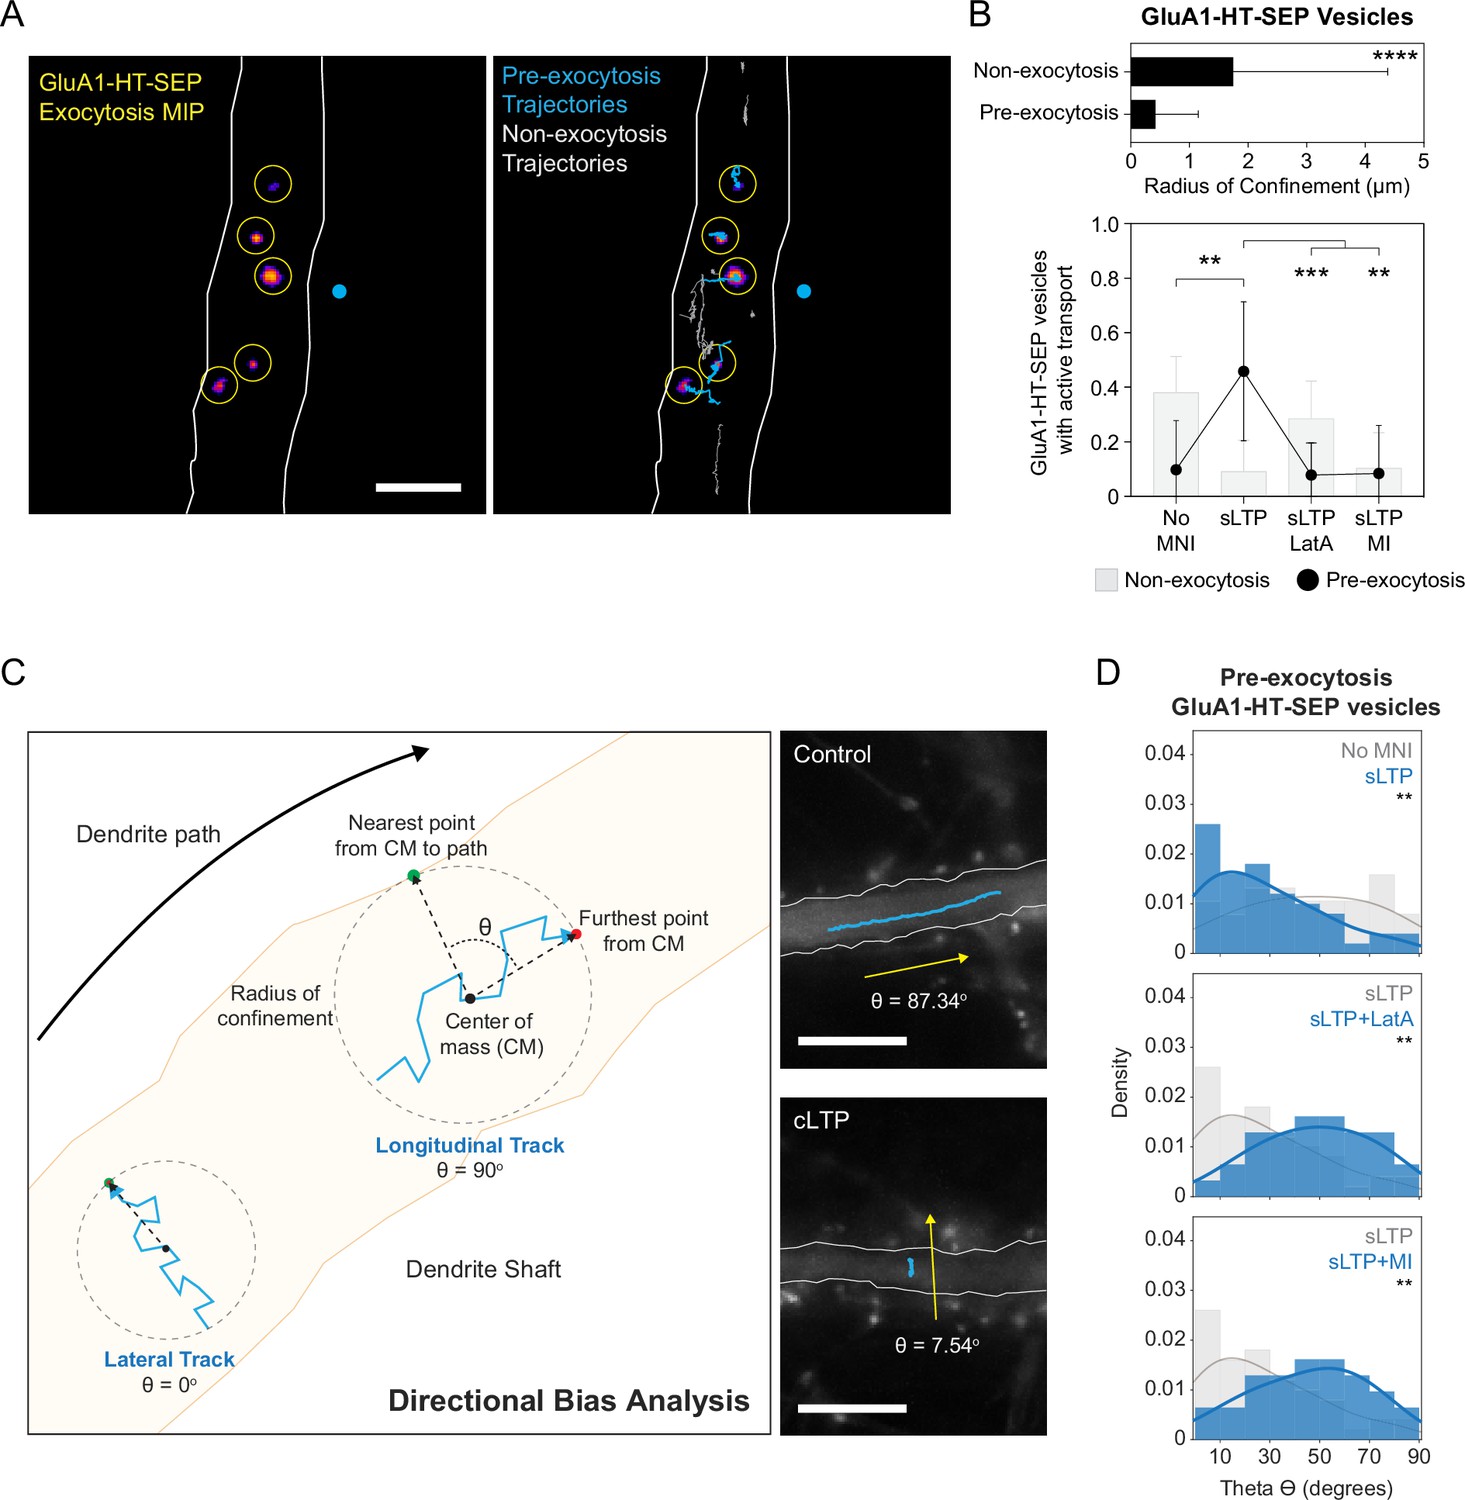
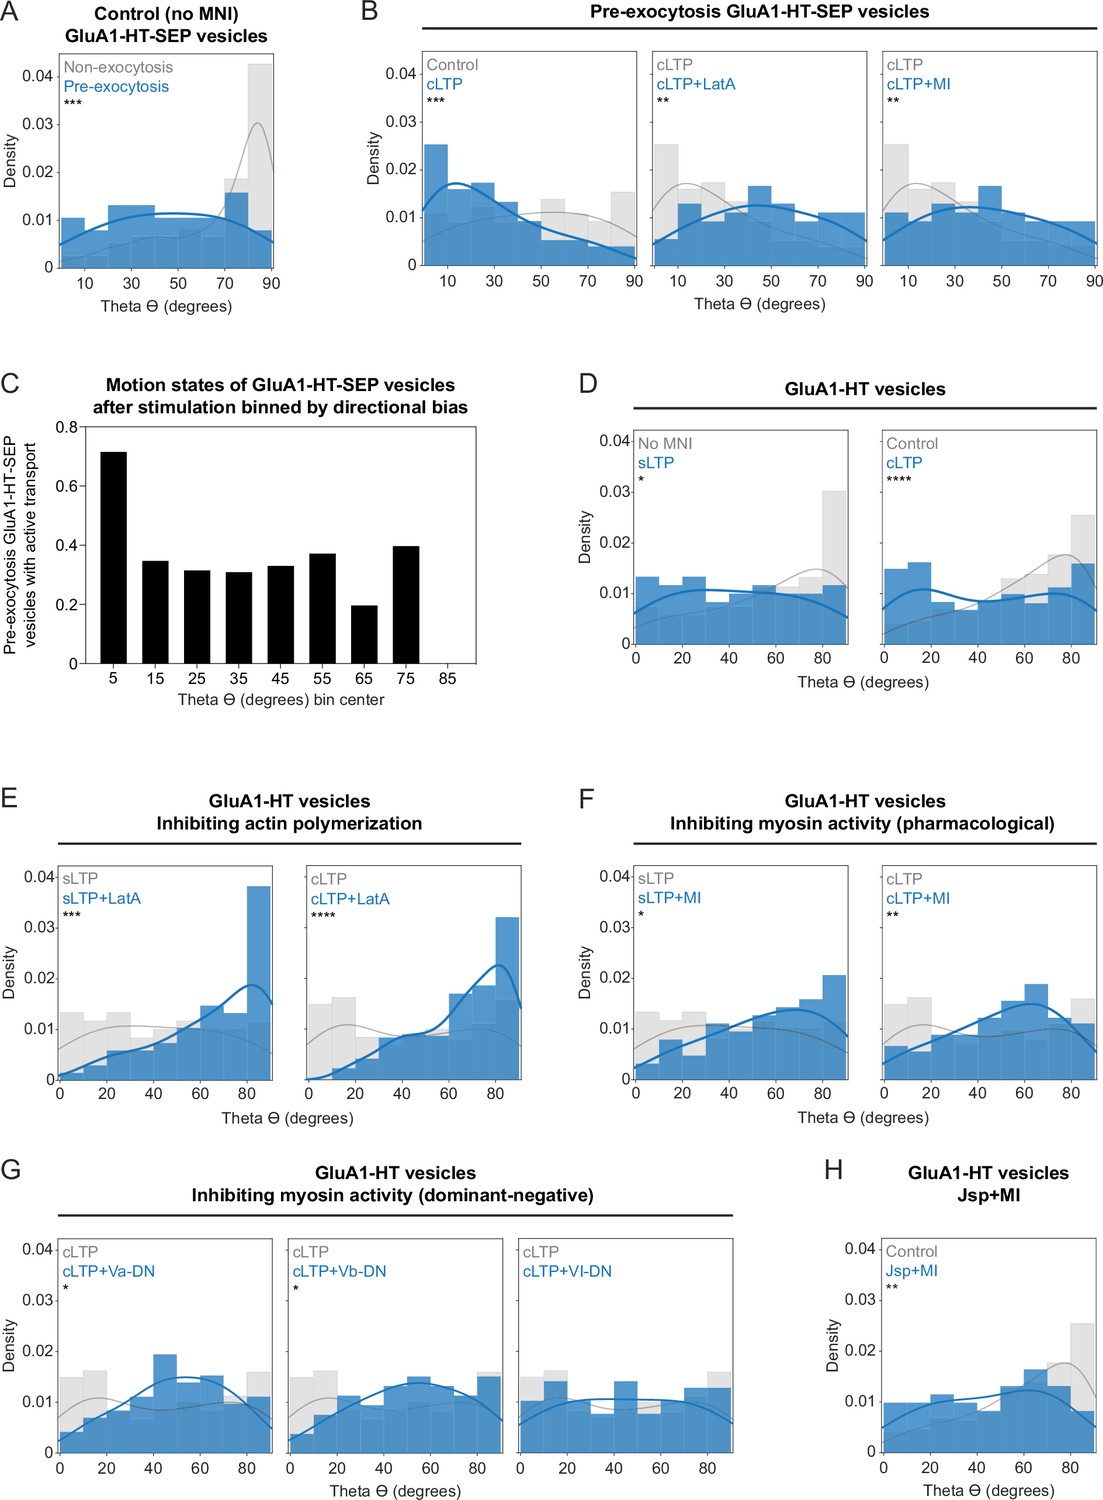
(A) Left: representative maximum intensity projection (MIP) of GluA1-HT-SEP exocytosis over time after sLTP (i.e. the brightest pixels from each image in a timelapse compressed into a single image). Yellow circles indicate exocytic events. Blue dot indicates site of uncaging. Right: GluA1-HT-SEP vesicle trajectories overlaid on the MIP of exocytosis over time. Blue trajectories are GluA1-HT-SEP vesicles that undergo exocytosis (Pre-exocytosis). Gray trajectories are GluA1-HT-SEP vesicles with no detected exocytosis (Non-exocytosis) during the span of imaging. Scale bar, 5 μm. For video. See Figure 6—video 1. (B) Top: mean radius of confinement for the trajectories of GluA1-HT-SEP vesicles that do not undergo exocytosis (Non-exocytosis) and that do undergo exocytosis (Pre-exocytosis) under unstimulated conditions. Error bars represent standard deviation. ****p<0.0001 by Kolmogorov-Smirnov test. n=65–176 GluA1-HT-SEP vesicle trajectories pooled from five timelapses imaging experiments (each timelapse captures GluA1-HT-SEP motion and exocytosis in one region of dendrite in one neuronal culture). Bottom: bar graph of motion types (Figure 6—figure supplement 1) for non-exocytosis GluA1-HT-SEP vesicles (gray bars) and pre-exocytosis GluA1-HT-SEP vesicles (black dots) after sLTP. Only trajectories in regions where actin polymerization occurred were used (see Figure 3—figure supplement 3A). No MNI vs sLTP, **p=0.0018; sLTP vs sLTP +LatA, ***p=0.0003; sLTP vs sLTP +MI, **p=0.0017. Significance was determined by Mann-Whitney test. n=9–12 sLTP stimulation experiments (each experiment targets one spine on one neuron) where GluA1-HT-SEP motion and exocytosis in the dendrite are captured immediately after sLTP stimulation. (C) Diagram of directional bias analysis. The directional bias of a trajectory can be determined by calculating the angle, theta (Θ), created between the line from the center of mass of a trajectory (CM) to the nearest point on the dendrite path and the line from the CM to the furthest point from the CM. Theta of 90o indicates longitudinal movement while theta of 0o indicates lateral movement. Images: representative trajectories of GluA1-HT vesicles traveling longitudinally under control conditions (Control; top) or laterally after cLTP (cLTP; bottom). (D) Directional bias for GluA1-HT-SEP vesicles prior to exocytosis (pre-exocytosis) after sLTP. Top: distribution of theta for vesicles after sLTP. sLTP (blue) vs No MNI (gray), **p=0.0067. Middle: distribution of theta for vesicles after sLTP in the presence of an actin polymerization inhibitor (LatA). sLTP +LatA (blue) vs sLTP (gray), **p=0.0032. Bottom: distribution of theta for vesicles after sLTP in the presence of acute myosin inhibition (MI). sLTP +MI (blue) vs sLTP (gray), **p=0.0078. Lines represent the probability density function of each histogram estimated by kernel density estimation (KDE). Significance was determined by Kolmogorov-Smirnov test. n=31–50 GluA1-HT-SEP trajectories pooled from 9 to 12 sLTP stimulation experiments for each condition.
-
Figure 6—source data 1
Related to Figure 6.
- https://cdn.elifesciences.org/articles/80622/elife-80622-fig6-data1-v1.xlsx
Figure 6—figure supplement 1
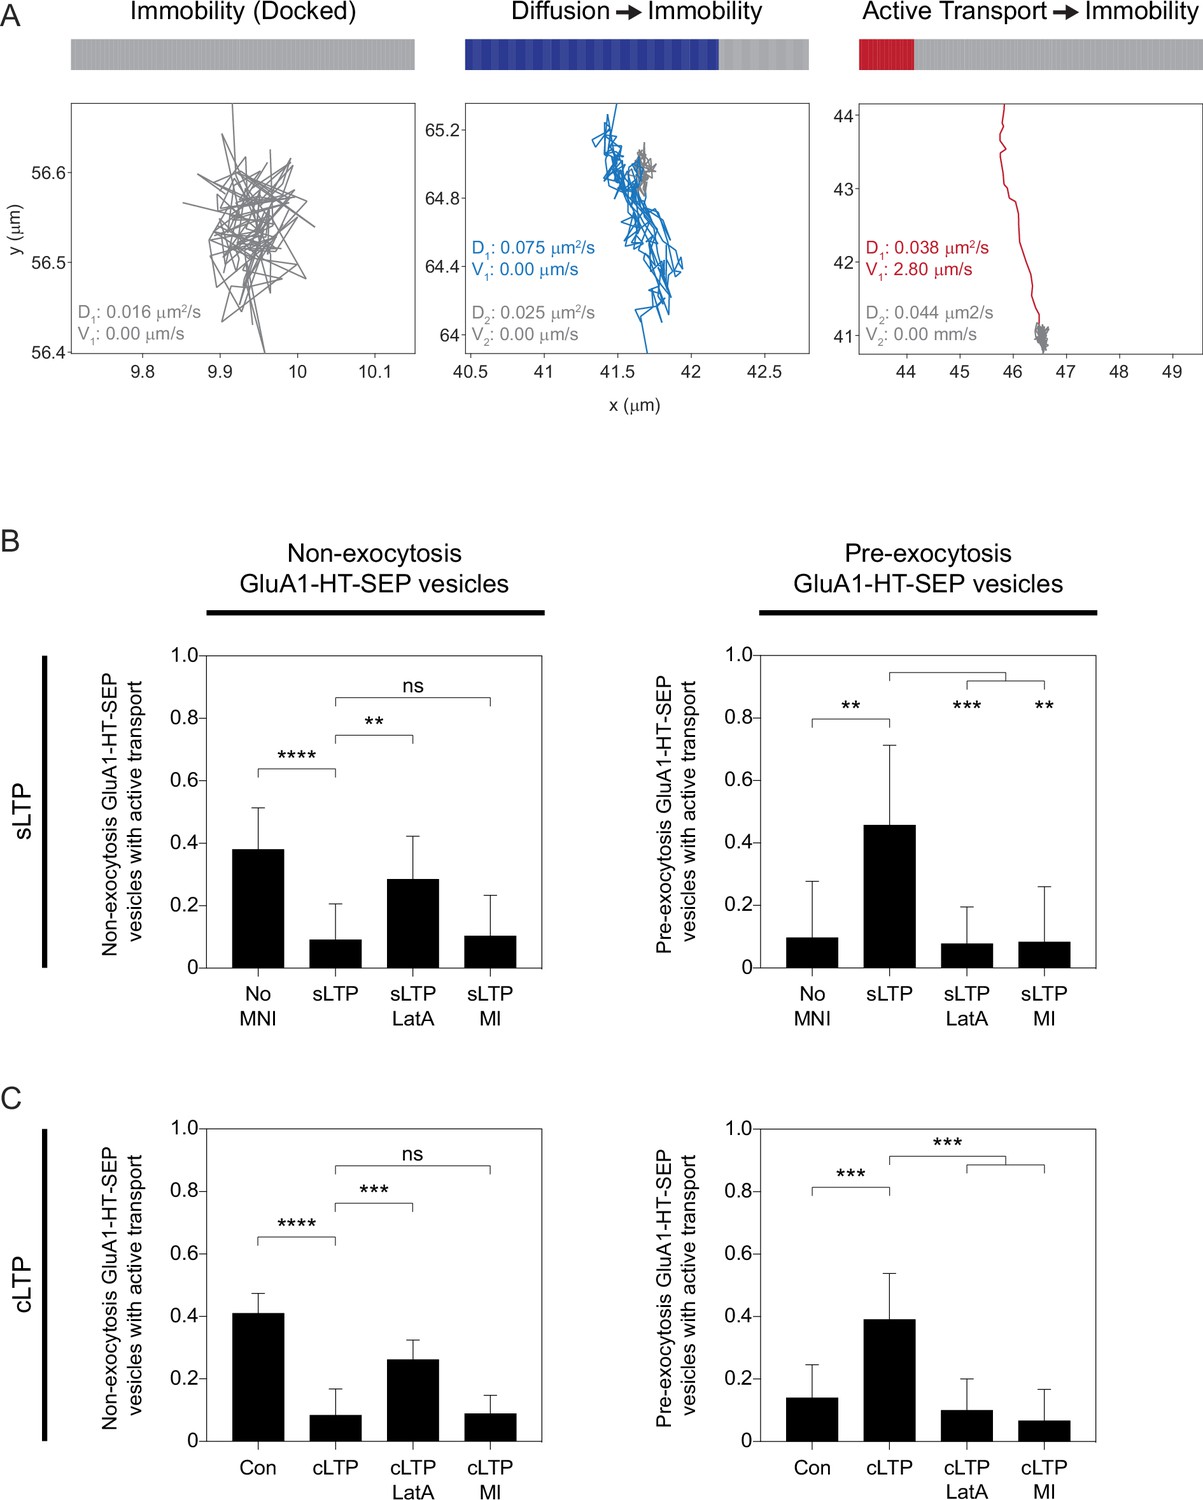
Stimulation increases the fractions of pre-exocytosis GluA1-HT-SEP vesicles exhibiting active transport prior to docking.
(A) Temporal state sequences (top) and trajectories (bottom) for pre-exocytosis GluA1-HT-SEP vesicles exhibiting immobility, diffusion followed by immobility, and active transport followed by immobility. Pre-exocytosis GluA1-HT-SEP vesicles exhibit at least two motion states before exocytosis, where the final motion state is immobility. We therefore interpret immobility to be vesicle docking prior to exocytosis. (B) Fractions of non-exocytosis (left) or pre-exocytosis (right) GluA1-HT-SEP vesicles exhibiting active transport after sLTP, sLTP in the presence of LatA (sLTP +LatA), or sLTP in the presence of pharmacological myosin inhibitors (sLTP +MI). Error bars represent standard deviation. Non-exocytosis: No MNI vs sLTP, ****p<0.0001; sLTP vs sLTP +LatA, **p=0.0017. Pre-exocytosis: No MNI vs sLTP, **p=0.0018; sLTP vs sLTP +LatA, ***p=0.0003; sLTP vs sLTP +MI, **p=0.0017. Significance was determined by Mann-Whitney test. n=9–12 sLTP stimulation experiments (each experiment targets one spine on one neuron) where GluA1-HT-SEP motion and exocytosis in the dendrite are captured immediately after sLTP stimulation. (C) Fractions of non-exocytosis (left) or pre-exocytosis (right) GluA1-HT-SEP vesicles exhibiting active transport during cLTP, cLTP in the presence of LatA (cLTP +LatA), or cLTP in the presence of pharmacological myosin inhibitors (cLTP +MI). Error bars represent standard deviation. Non-exocytosis: Control vs cLTP, ****p<0.0001; cLTP vs cLTP +LatA, ***p<0.0001. Pre-exocytosis: Control vs cLTP, ***p=0.0001; cLTP vs cLTP +LatA, ***p=0.0001; cLTP vs cLTP +MI, ***p=0.0001. Significance was determined by Mann-Whitney test. n=9–12 timelapses imaging experiments (each timelapse captures GluA1-HT-SEP motion and exocytosis in one region of dendrite in one neuronal culture) for each condition.
-
Figure 6—figure supplement 1—source data 1
Related to Figure 6—figure supplement 1.
- https://cdn.elifesciences.org/articles/80622/elife-80622-fig6-figsupp1-data1-v1.xlsx
Figure 6—figure supplement 2
Stimulation changes the directional bias of GluA1-HT vesicles and pre-exocytosis GluA1-HT-SEP vesicles.
(A) Distributions of theta for non-exocytosis (gray) and pre-exocytosis (blue) GluA1-HT-SEP vesicles after sLTP stimulation in the absence of MNI (No MNI). Lines represent the probability density function of each histogram estimated by kernel density estimation (KDE). ***p=0.0002. n=113 GluA1-HT-SEP vesicle trajectories pooled from 12 sLTP stimulation experiments (each experiment targets one spine on one neuron) where GluA1-HT-SEP motion and exocytosis in the dendrite are captured immediately after sLTP stimulation. (B) Distributions of theta for pre-exocytosis GluA1-HT-SEP vesicles during cLTP, cLTP in the presence of LatA (cLTP +LatA), or cLTP in the presence of pharmacological myosin inhibitors (cLTP +MI). Con vs cLTP, ***p=0.0004; cLTP vs cLTP +LatA, **p=0.0011; cLTP vs cLTP +MI, **p=0.0088. n=54–75 GluA1-HT-SEP vesicle trajectories pooled from 9 to 12 timelapses imaging experiments (each timelapse captures GluA1-HT-SEP motion and exocytosis in one region of dendrite in one neuronal culture) for each condition. (C) Fraction of pre-exocytosis GluA1-HT-SEP vesicles with active transport after sLTP or cLTP stimulation sorted into bins based on their directional biases. n=125 GluA1-HT-SEP vesicle trajectories pooled from 12 sLTP stimulation experiments and 12 cLTP experiments. (D) Distributions of theta for GluA1-HT vesicles after sLTP or cLTP. No MNI vs sLTP, *p=0.0158; control vs cLTP, ****p<0.0001. n=51–59 GluA1-HT vesicle trajectories pooled from six to nine sLTP stimulation experiments and n=227–360 GluA1-HT vesicle trajectories pooled from 12 to 14 cLTP experiments for each condition. (E) Distributions of theta for GluA1-HT vesicles after sLTP or cLTP in the presence of LatA. sLTP vs sLTP +LatA, ***p=0.0004; cLTP vs cLTP +LatA, ****p<0.0001. n=59–67 GluA1-HT vesicle trajectories pooled from six to nine sLTP stimulation experiments and n=227–307 GluA1-HT vesicle trajectories pooled from 12 to 14 cLTP experiments for each condition. (F) Distributions of theta for GluA1-HT vesicles after sLTP or cLTP in the presence of pharmacological myosin inhibitors (MI). sLTP vs sLTP +MI, *p=0.0263; cLTP vs cLTP +MI, **p=0.0090. n=54–69 GluA1-HT vesicle trajectories pooled from six to nine sLTP stimulation experiments and n=82–360 GluA1-HT vesicle trajectories pooled from 9 to 14 cLTP experiments for each condition. (G) Distributions of theta for GluA1-HT vesicles after cLTP in the presence of dominant-negative inhibition of myosin Va (cLTP +Va DN), Vb (cLTP +Vb DN), or VI (cLTP +VI DN). cLTP vs cLTP +Va DN, *p=0.0121; cLTP vs cLTP +Vb DN, *p=0.0205. n=53–360 GluA1-HT vesicle trajectories pooled from 3 to 14 cLTP experiments for each condition. We note that inhibition of myosin VI by expressing its dominant-negative c-terminal domain does not alter the directional bias of vesicles in response to cLTP. Consequently, we believe that the change in directional bias exhibited by vesicles in response to synaptic activity is primarily driven by myosin Va and Vb. (H) Distributions of theta for GluA1-HT vesicles in response to Jasplakinolide treatment in the presence of pharmacological inhibitors for myosin (Jsp +MI). **p=0.0095. n=60–227 GluA1-HT vesicle trajectories pooled from three to nine chemical stimulation experiments for each condition. Significance was determined by Kolmogorov-Smirnov test for all distributions.
-
Figure 6—figure supplement 2—source data 1
Related to Figure 6—figure supplement 2.
- https://cdn.elifesciences.org/articles/80622/elife-80622-fig6-figsupp2-data1-v1.xlsx
Figure 6—video 1
Timelapse sequence of GluA1-HT-SEP labeled with JF549-HTL (after blocking with JF646-HTL) in a dendrite after sLTP stimulation.
Scale bar, 5 μm. Left: particle motion of GluA1-HT-SEP labeled with JF549-HTL (chase; JF549). Center: GluA1-HT-SEP exocytosis (SEP). Right: timelapse of GluA1-HT-SEP particle motion (JF549; green) merged with GluA1-HT-SEP exocytosis (SEP; magenta). White circles denote sites of exocytosis.
Figure 7
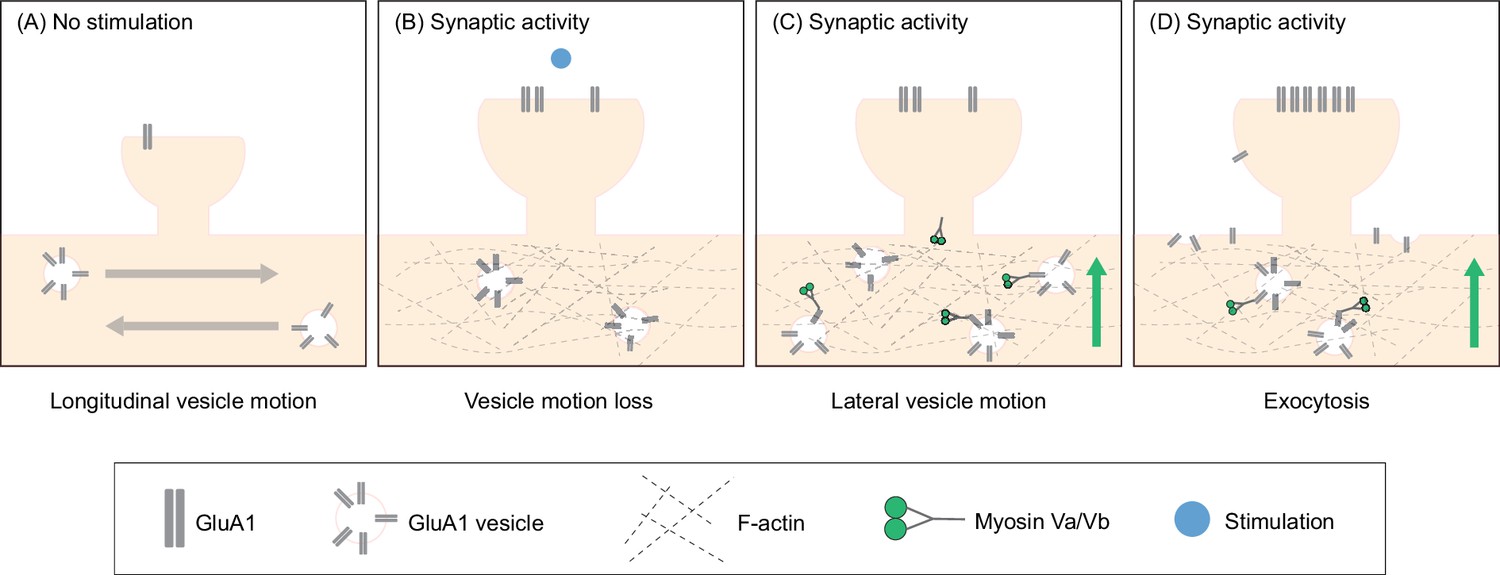
Actin polymerization in the dendritic shaft proximal to the site of synaptic activity promotes GluA1 exocytosis by increasing the local pool of GluA1 vesicles and facilitating myosin-dependent transport to the dendrite periphery.
(A) Under unstimulated conditions, GluA1 vesicles are transported longitudinally along the dendritic shaft. (B) When synaptic activity is induced, actin polymerizes in the dendritic shaft near the site of activity. Actin polymerization disrupts the longitudinal motion of vesicles resulting in an increased pool of GluA1 vesicles near the site of activity. (C) Myosin V, which is inactive and sequestered in dendritic spines in unstimulated conditions, is activated by calcium influx during synaptic activity. Myosin subsequently translocates to the base of the dendritic spines. (D) Myosin V recruits GluA1 vesicles to the periphery resulting in increased exocytosis of GluA1.
Tables
Table 1
Localization and tracking parameters for the MTT program.
| Localization error | 1E-6 | |
| Deflation loops | 3 | |
| Maximum number competitors | 3 | |
| Maximum diffusion coefficient (µm2/s) | 1 | For GluA1-HT |
| Maximum diffusion coefficient (µm2/s) | 3 | For GEM |
Appendix 1—key resources table
| Reagent type (species) or resource | Designation | Source or reference | Identifiers | Additional information |
|---|---|---|---|---|
| Antibody | anti-AMPA receptor 1 (GluA1; Extracellular; Guinea pig polyclonal) | Alomone Labs | AGP-009 | IF(1:250) |
| Antibody | anti-Chicken IgY, Alexa Fluor Plus 647 (Goat polyclonal) | Thermo Fisher Scientific | A-32933 | IF(1:500) |
| Antibody | anti-Chicken IgY, Star Orange (Goat polyclonal) | abberior GmbH | STORANGE-1005–500 UG | IF(1:500) |
| Antibody | anti-Chicken IgY, Star Red (Goat polyclonal) | abberior GmbH | STRED-1005–500 UG | IF(1:500) |
| Antibody | anti-GluA1 (Mouse monoclonal) | Synaptic Systems | 182 011 | IF(1:500) |
| Antibody | anti-GluN1 (Mouse monoclonal) | Synaptic Systems | 114 011 | IF(1:1000) |
| Antibody | anti-Guinea Pig, Alexa Fluor 488 (Goat polyclonal) | Thermo Fisher Scientific | A-11073 | IF(1:500) |
| Antibody | anti-Guinea Pig IgG, Alexa Fluor 555 (Goat polyclonal) | Thermo Fisher Scientific | A-21435 | IF(1:500) |
| Antibody | anti-Guinea Pig IgG, Alexa Fluor 594 (Goat polyclonal) | Thermo Fisher Scientific | A-11076 | IF(1:500) |
| Antibody | anti-Guinea Pig IgG, Alexa Fluor 647 (Goat polyclonal) | Thermo FIsher Scientific | A-21450 | IF(1:500) |
| Antibody | anti-HaloTag (Rabbit polyclonal) | Promega | G9281 | IF(1:500) |
| Antibody | anti-Homer1 (Chicken polyclonal) | Synaptic Systems | 160 006 | IF(1:1000) |
| Antibody | anti-Mouse IgG, Alexa Fluor 488 (Goat polyclonal) | Thermo Fisher Scientific | A-11001 | IF(1:500) |
| Antibody | anti-Mouse IgG, Alexa Fluor 546 (Goat polyclonal) | Thermo Fisher Scientific | A-11030 | IF(1:500) |
| Antibody | anti-Mouse IgG, Alexa Fluor 594 (Goat polyclonal) | Thermo Fisher Scientific | A-32742 | IF(1:500) |
| Antibody | anti-Mouse IgG, Alexa Fluor 647 (Goat polyclonal) | Thermo Fisher Scientific | A-21236 | IF(1:500) |
| Antibody | anti-Mouse IgG, Atto 647 N (Goat polyclonal) | Rockland Immunochemicals Inc. | 610-156-121 | IF(1:500) |
| Antibody | anti-PSD-95 (7E3-1B8; Mouse monoclonal) | Thermo Fisher Scientific | MA1-046 | IF(1:1000) |
| Antibody | anti-PSD-95 (Guinea pig polyclonal) | Synaptic Systems | 124 014 | IF(1:2000) |
| Antibody | anti-Rabbit IgG, Alexa Fluor 488 (Goat polyclonal) | Thermo Fisher Scientific | A-11034 | IF(1:500) |
| Antibody | anti-Rabbit IgG, Alexa Fluor 546 (Goat polyclonal) | Thermo Fisher Scientific | A-11035 | IF(1:500) |
| Antibody | anti-Rabbit IgG, Alexa Fluor 647 (Goat polyclonal) | Thermo Fisher Scientific | A-21245 | IF(1:500) |
| Antibody | anti-Rabbit IgG, Atto 594 (Goat polyclonal) | Rockland Immunochemicals Inc. | 611-155-122 | IF(1:500) |
| Antibody | anti-Rabbit IgG, Star Red (Goat polyclonal) | abberior GmbH | STRED-1002–500 UG | IF(1:500) |
| Cell line (Homo sapiens) | Human embryonic kidney (HEK) 293T | ATCC | CRL-3216 | |
| Chemical compound, drug | 2,4,6-Triiodophenol (TIP) | Thermo Fisher Scientific | AAA1714506 | 4 μM |
| Chemical compound, drug | 20 x SSC | Thermo Fisher Scientific | AM9763 | |
| Chemical compound, drug | Cycloheximide (CHX) | Sigma-Aldrich | C4859 | 50 nM |
| Chemical compound, drug | DABCO | Sigma-Aldrich | D27802 | |
| Chemical compound, drug | D-AP5 | Tocris | 0106 | 10 μM |
| Chemical compound, drug | Dimethyl sulfoxide (DMSO), Anhydrous | Thermo Fisher Scientific | D12345 | |
| Chemical compound, drug | Glycine | Tocris | 0219 | 0.2 mM |
| Chemical compound, drug | Jasplakinolide (Jsp) | Tocris | 2792 | |
| Chemical compound, drug | JF549-HTL | Grimm et al., 2015 | N/A | 10 nM |
| Chemical compound, drug | JF549i-HTL | Xie et al., 2017 | N/A | 10 nM |
| Chemical compound, drug | JF646-HTL | Grimm et al., 2015 | N/A | 20 nM |
| Chemical compound, drug | Latrunculin A (LatA) | Tocris | 3973 | 1 μM |
| Chemical compound, drug | Lipofectamine 3000 | Thermo Fisher Scientific | L3000001 | |
| Chemical compound, drug | MNI-caged-L-glutamate (MNI) | Tocris | 14-905-0 | 2 mM |
| Chemical compound, drug | Mowoil 4–88 | Sigma-Aldrich | 813831 | |
| Chemical compound, drug | MyoVin-1 | Sigma-Aldrich | 475984 | 10 μM |
| Chemical compound, drug | NbActiv4 Minus Phenol Red | Transnetyx | NB4PR500 | |
| Chemical compound, drug | Nocodazole | Tocris | 1228 | 500 nM |
| Chemical compound, drug | Normal Goat Serum | Thermo Fisher Scientific | 31873 | |
| Chemical compound, drug | Papain | Worthington Biochemical Corporation | LK003176 | |
| Chemical compound, drug | Paraformaldehyde (PFA) | Electron Microscopy Sciences | 15713 | |
| Chemical compound, drug | Pentabromopseudilin (PBP) | Sigma-Aldrich | SML2428 | 4 μM |
| Chemical compound, drug | Phalloidin Star 635 p | abberior GmbH | ST635P-0100–20 UG | 0.17 μM |
| Chemical compound, drug | Poly-ᴅ-Lysine (PDL) Hydrobromine | Sigma-Aldrich | P6407 | |
| Chemical compound, drug | ProLong Diamond Antifade Mountant with DAPI | Thermo Fisher Scientific | P36971 | |
| Chemical compound, drug | Saponin | Sigma-Aldrich | 47036 | |
| Chemical compound, drug | Tetrodotoxin Citrate (TTX) | Tocris | 1069 | 200 nM |
| Chemical compound, drug | Triton X-100 | Sigma-Aldrich | T8787 | |
| Commercial assay or kit | HCR RNA-FISH Bundle for HaloTag and gria1 mRNA | Molecular Instruments | N/A | |
| Commercial assay or kit | P3 Primary Cell 96-well Nucleofector Kit (96 RCT) | Lonza | V4SP-3096 | |
| Recombinant DNA reagent | CAG-tdTomato (plasmid) | James Wilson | Addgene #105554 | |
| Recombinant DNA reagent | hSyn-GEM (plasmid) | This paper | N/A | Plasmid for expressing GEM-HT-ST in neurons |
| Recombinant DNA reagent | hSyn-GFP (plasmid) | James Wilson | Addgene #105539 | |
| Recombinant DNA reagent | hSyn-tractin (plasmid) | This paper | N/A | Plasmid for expressing F-tractin-mNeongreen in neurons |
| Recombinant DNA reagent | ITPKA-mNeongreen (plasmid) | Chertkova et al., 2017 | Addgene # 98883 | |
| Recombinant DNA reagent | LZ10 PBREBAC-H2BHalo (plasmid) | Li et al., 2016 | Addgene #91564 | |
| Recombinant DNA reagent | pAS1NB c Rosella I (plasmid) | Rosado et al., 2008 | Addgene #71245 | |
| Recombinant DNA reagent | pBAD/His-miRFP670 (plasmid) | Shcherbakova et al., 2016 | Addgene #79884 | |
| Recombinant DNA reagent | pCAGGS (plasmid) | Niwa et al., 1991 | BCCM/LMBP #2453 | |
| Recombinant DNA reagent | pCAG-GluA1-P2A-GFP (plasmid) | This paper | N/A | Plasmid for expressing GluA1-P2A-GFP in HEK293T cells for patching assays |
| Recombinant DNA reagent | pCAG-GluA1-HT-P2A-GFP (plasmid) | This paper | N/A | Plasmid for expressing GluA1-HT-P2A-GFP in HEK293T cells for patching assays |
| Recombinant DNA reagent | pCAG-GluA1-HT-SEP-P2A-mScarlet (plasmid) | This paper | N/A | Plasmid for expressing GluA1-HT-SEP-P2A-mScarlet in HEK293T cells for patching assays |
| Recombinant DNA reagent | pCMV-PfV-Sapphire-IRES-DSRed (plasmid) | Delarue et al., 2018 | Addgene #116934 | |
| Recombinant DNA reagent | pCMV2-SEP-GluA1 (plasmid) | Blanco-Suarez and Hanley, 2014 | Addgene #64942 | |
| Recombinant DNA reagent | pEGFP-C1 (plasmid) | N/A | Clontech | |
| Recombinant DNA reagent | pEGFP-MyosinVa-Ctail (plasmid) | Correia et al., 2008 | Addgene #110169 | |
| Recombinant DNA reagent | pEGFP-MyosinVb-Ctail (plasmid) | Correia et al., 2008 | Addgene #110170 | |
| Recombinant DNA reagent | pEGFP-MyosinVI-Ctail (plasmid) | This paper | N/A | Plasmid for expressing the dominant-negative myosin VI C-tail to inhibit myosin VI function |
| Recombinant DNA reagent | PX551 (plasmid) | Swiech et al., 2015 | Addgene #60957 | |
| Recombinant DNA reagent | PX552 (plasmid) | Swiech et al., 2015 | Addgene #60958 | |
| Recombinant DNA reagent | px552-sg-gria1-HT (plasmid) | This paper | N/A | The donor plasmid for knocking HaloTag into Gria1 via HITI |
| Recombinant DNA reagent | px552-sg-gria1-HT-SEP (plasmid) | This paper | N/A | The donor plasmid for knocking HaloTag-SEP into Gria1 via HITI |
| Recombinant DNA reagent | Cas9 target sequence for sgRNA insert | Integrated DNA Technologies | N/A | 5'-ACCCTCCCGAG ACCATACCAGGG-3' 5'-AACCCCTGGTATG GTCTCGGGAG-3' |
| Recombinant DNA reagent | Sequencing primers for 5’ insertion site of HaloTag into Gria1 | Integrated DNA Technologies | N/A | 5’-ATGCCTGCAGGTC GAAGAGACCTACCCA GACGATG-3’ 5’-GTGAATTCGAGCTCG GGCGGATGAACTCCATAAATGC-3’ |
| Recombinant DNA reagent | Sequencing primers for 3’ insertion site of HaloTag into Gria1 | Integrated DNA Technologies | N/A | 5’-ATGCCTGCAGGTCGA TGCATTTATGGAGTTCATCCGC-3’ 5’-GTGAATTCGAGCTCGT GTGTTCTGCTGTTCAGGAG-3’ |
| Software, algorithm | Directional Bias | This paper | N/A | MATLAB script used to determine the directional bias of particles |
| Software, algorithm | Fiji | Schindelin et al., 2012 | N/A | |
| Software, algorithm | FISH-Quant | Mueller et al., 2013 | https://fish-quant.github.io/ | |
| Software, algorithm | HMM-Bayes, v1 | Monnier et al., 2015; Bathe BioNanoLab, 2021 | https://github.com/lcbb/HMM-Bayes | MATLAB script used to predict motion states of particles |
| Software, algorithm | Imaris 9.3 | Bitplane (Belfast, United Kingdom) | N/A | |
| Software, algorithm | Impsector | abberior GmbH (Göttingen, Germany) | N/A | |
| Software, algorithm | MATLAB 2016a | Mathworks (Natick, MA) | https://www.mathworks.com/ | |
| Software, algorithm | MSDanalyzer, v1.3 | Tarantino et al., 2014; Tinevez, 2020 | https://github.com/tinevez/msdanalyzer | MATLAB script used to determine diffusion coefficients of particles |
| Software, algorithm | Prism 9, v8 | GraphPad (San Diego, CA) | https://www.graphpad.com/ | |
| Software, algorithm | SLIMfast | This paper | N/A | MATLAB program for 2D single-particle tracking |
| Software, algorithm | Zen Black | Zeiss (Jena, Germany) | N/A | |
| Strain, strain background (AAV) | AAV2/9-CAG-TdTomato | Janelia Research Campus Viral Services | N/A | |
| Strain, strain background (AAV) | AAV2/9-hSyn-GCaMP6s | Janelia Research Campus Viral Services | N/A | |
| Strain, strain background (AAV) | AAV2/9-hSyn-GEM | Janelia Research Campus Viral Services | N/A | |
| Strain, strain background (AAV) | AAV2/9-hSyn-GFP | Janelia Research Campus Viral Services | N/A | |
| Strain, strain background (AAV) | AAV2/9-hSyn-tractin | Janelia Research Campus Viral Services | N/A | |
| Strain, strain background (AAV) | rAAV2-PX551 | Janelia Research Campus Viral Services | N/A | |
| Strain, strain background (AAV) | rAAV2-px552-sg-gria1-HT | Janelia Research Campus Viral Services | N/A | |
| Strain, strain background (AAV) | rAAV2-px552-sg-gria1-HT-SEP | Janelia Research Campus Viral Services | N/A | |
| Strain, strain background (AAV) | rh10-PX551 | Janelia Research Campus Viral Services | N/A | |
| Strain, strain background (AAV) | rh10-px552-sg-gria1-HT | Janelia Research Campus Viral Services | N/A | |
| Strain, strain background (AAV) | rh10-px552-sg-gria1-HT-SEP | Janelia Research Campus Viral Services | N/A | |
| Strain, strain background (Rattus norvegicus) | Sprague-Dawley rats, CD1 (Sprague-Dawley postnatal pups P0, M and F) | Charles River Laboratories | Strain code: 400 | |
| Strain, strain background (Escherichia coli) | Stbl3 | Invitrogen | C737303 |
Additional files
Download links
A two-part list of links to download the article, or parts of the article, in various formats.
Downloads (link to download the article as PDF)
Open citations (links to open the citations from this article in various online reference manager services)
Cite this article (links to download the citations from this article in formats compatible with various reference manager tools)
Plasticity-induced actin polymerization in the dendritic shaft regulates intracellular AMPA receptor trafficking
eLife 13:e80622.
https://doi.org/10.7554/eLife.80622


