Discovery and biological evaluation of a potent small molecule CRM1 inhibitor for its selective ablation of extranodal NK/T cell lymphoma
- School of Bioengineering, Dalian University of Technology, China
- School of Software, Dalian University of Technology, China
- Department of Oncology, Shengjing Hospital of China Medical University, China
Figures
Figure 1 with 4 supplements
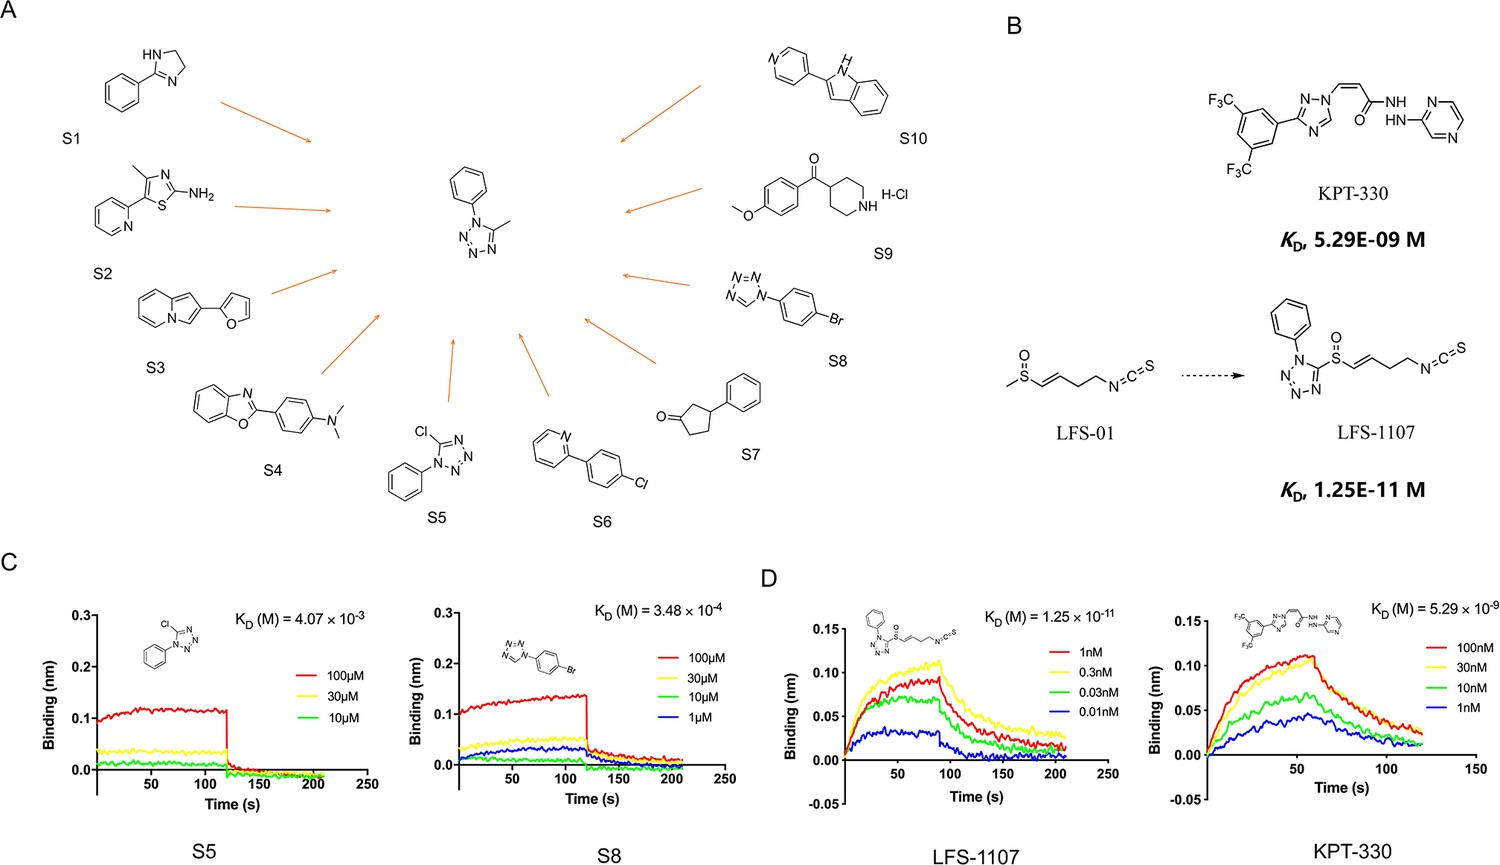
The discovery of sulforaphene synthetic analogue LFS-1107.
(A) The identification of ten commercial-accessible aromatic fragments aided by deep reinforcement learning model; (B) Synthesis of LFS-1107 via the installation of aromatic tetrazole moiety selected from the previous step to the sulforaphene parent structure; (C) Assessment of protein-ligand binding kinetics and binding affinity of tetrazole aromatic fragments via Bio-layer interferometry (BLI) assay; (D) Binding affinity of LFS-1107 and KPT-330 determined via BLI assay: LFS-1107, Kd~1.25E-11 M; KPT-330: Kd~5.29E-09 M.
-
Figure 1—source data 1
The chemical structure of 10 commercial-accessible aromatic fragments.
- https://cdn.elifesciences.org/articles/80625/elife-80625-fig1-data1-v2.zip
-
Figure 1—source data 2
The synthesis of compound LFS-1107.
- https://cdn.elifesciences.org/articles/80625/elife-80625-fig1-data2-v2.zip
-
Figure 1—source data 3
The data of affinities and binding kinetics of CRM1 to S5 and S8.
- https://cdn.elifesciences.org/articles/80625/elife-80625-fig1-data3-v2.zip
-
Figure 1—source data 4
The data of affinities and binding kinetics of CRM1 to LFS-1107 and KPT-330.
- https://cdn.elifesciences.org/articles/80625/elife-80625-fig1-data4-v2.zip
Figure 1—figure supplement 1

Binding affinities and binding kinetics of ten commercial-accessible fragments with CRM1 were determined using Bio-layer interferometry (BLI) assay.
-
Figure 1—figure supplement 1—source data 1
The data of affinities and binding kinetics of CRM1 to ten commercial-accessible aromatic fragments.
- https://cdn.elifesciences.org/articles/80625/elife-80625-fig1-figsupp1-data1-v2.zip
Figure 1—figure supplement 2
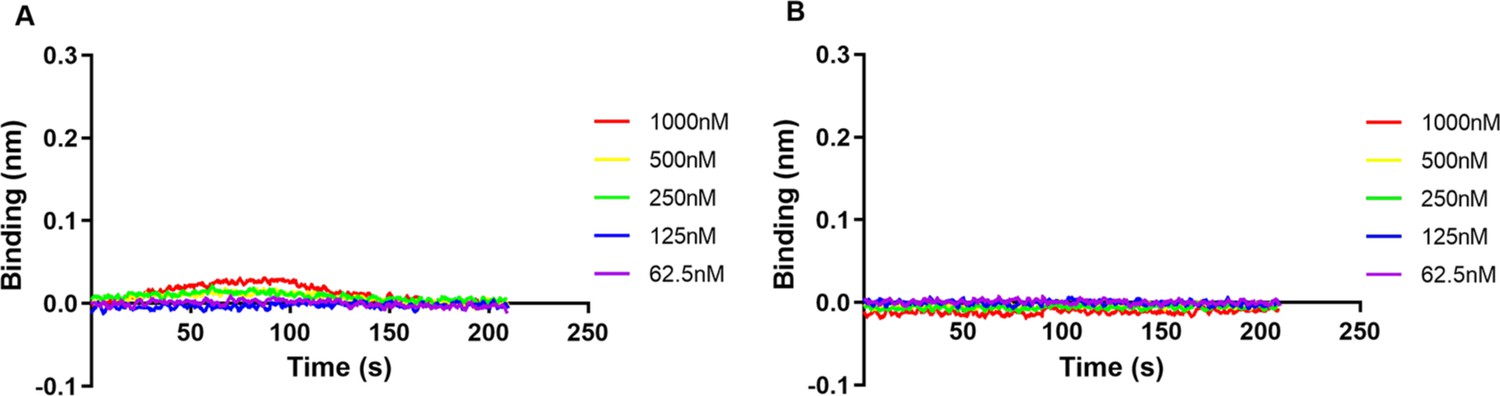
The BLI results of two control proteins Keap1 (A) and IκBα (B).
No binding affinities were detected for the two control proteins during BIL assay with compound LFS-1107.
-
Figure 1—figure supplement 2—source data 1
The data of affinities and binding kinetics of Keap1 and IκBα to LFS-1107.
- https://cdn.elifesciences.org/articles/80625/elife-80625-fig1-figsupp2-data1-v2.zip
Figure 1—figure supplement 3
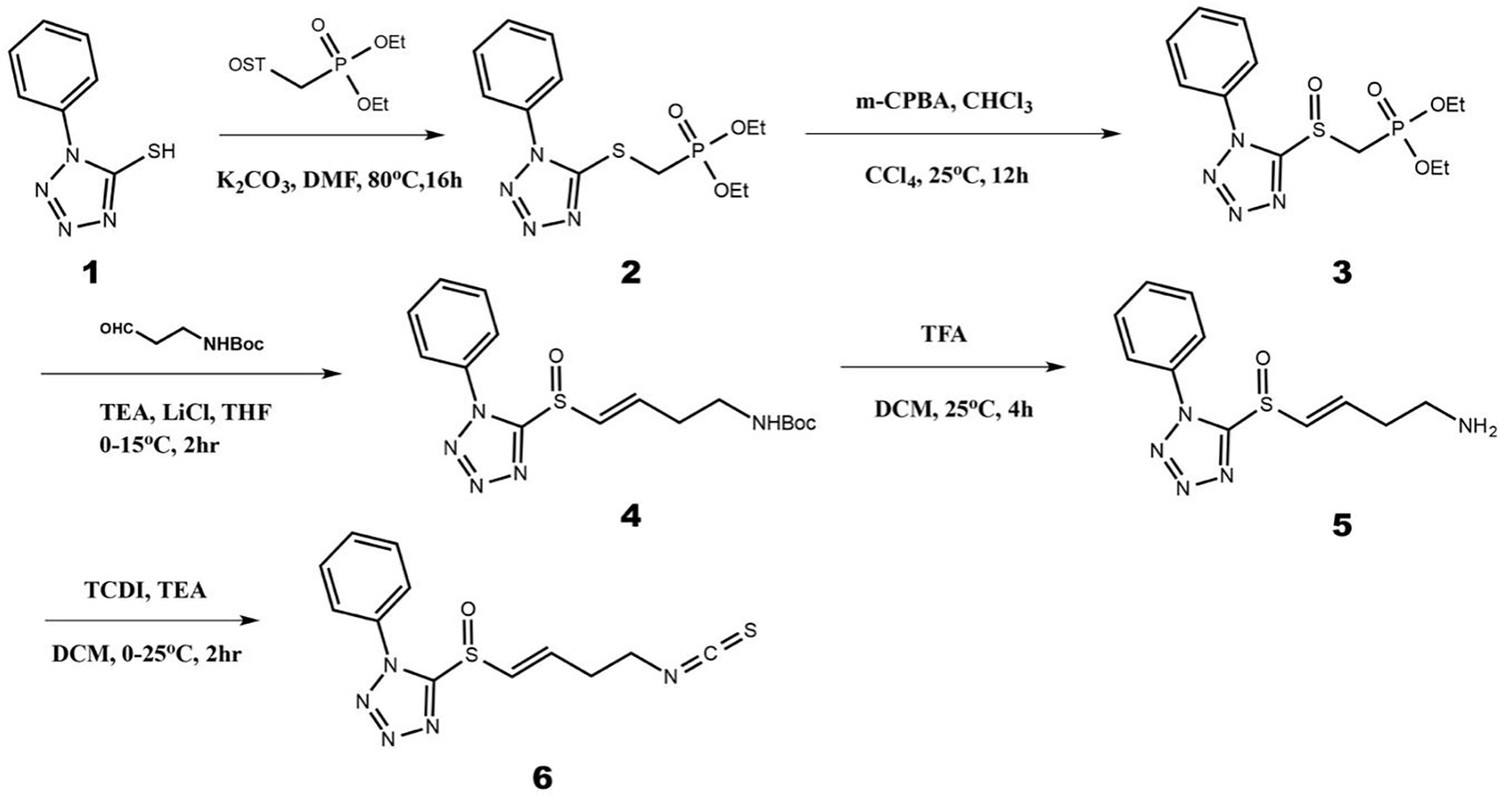
Organic synthesis scheme of compound LFS-1107.
-
Figure 1—figure supplement 3—source data 1
Organic synthesis scheme of compound LFS-1107.
- https://cdn.elifesciences.org/articles/80625/elife-80625-fig1-figsupp3-data1-v2.zip
Figure 1—figure supplement 4
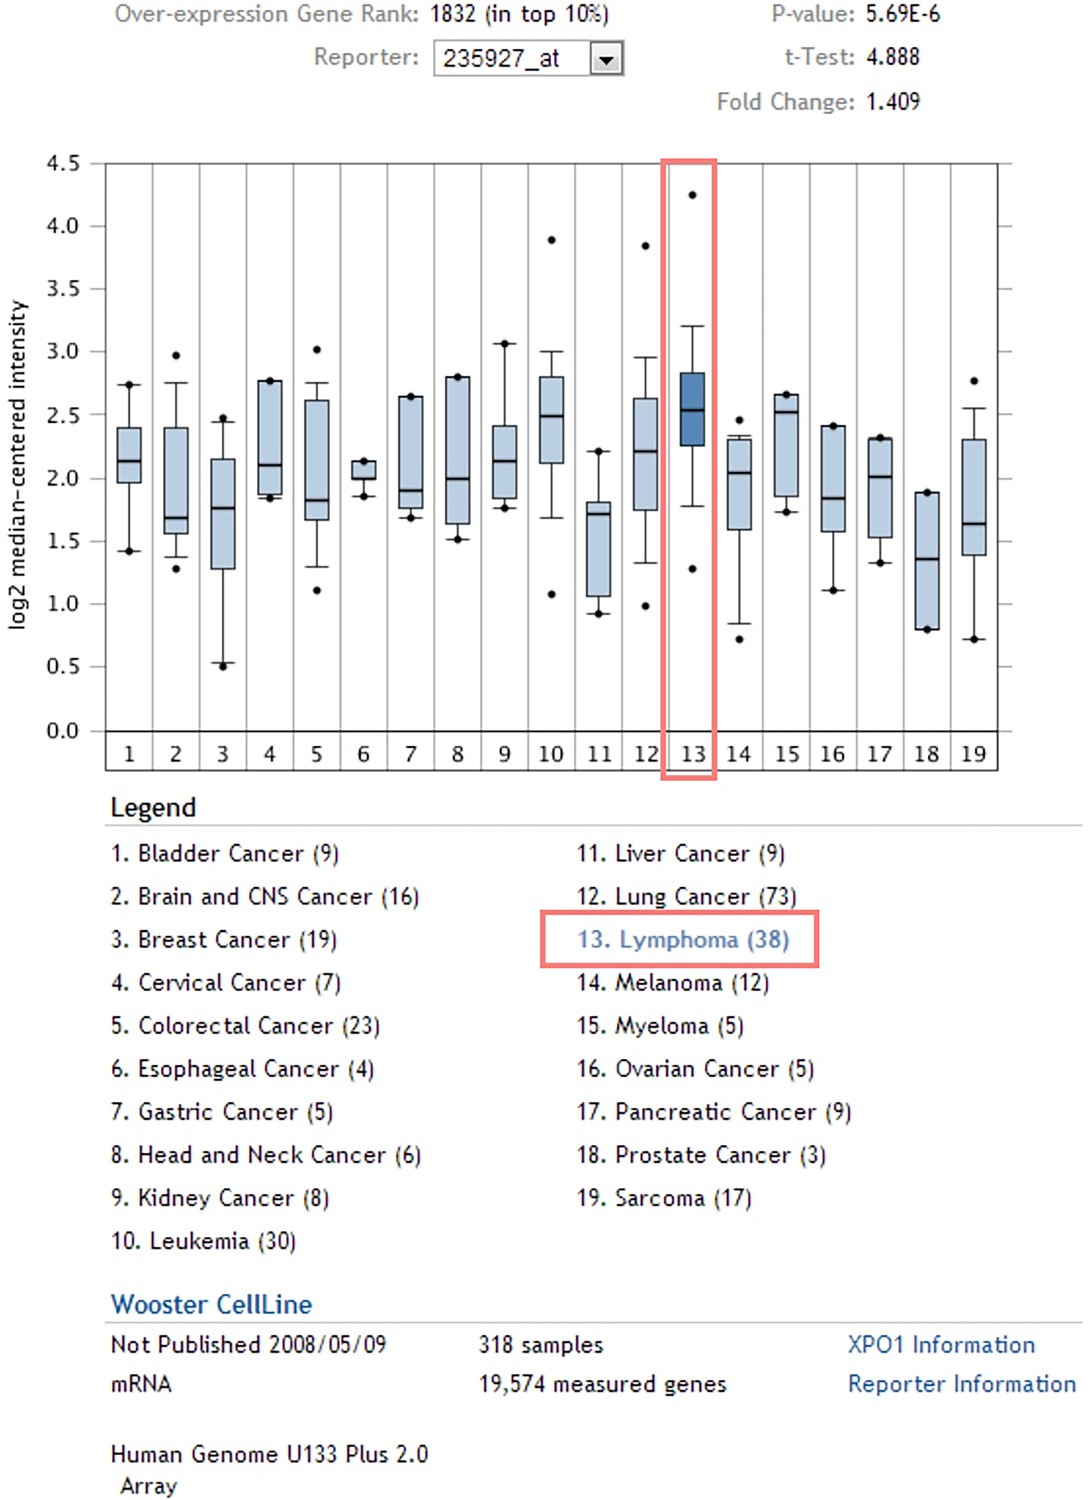
Expression of CRM1 mRNA in different tumor types.
It shows that CRM1 was significantly elevated in patients with Lymphoma.
-
Figure 1—figure supplement 4—source data 1
The expression of CRM1 mRNA in different tumor types.
- https://cdn.elifesciences.org/articles/80625/elife-80625-fig1-figsupp4-data1-v2.zip
Figure 2 with 3 supplements
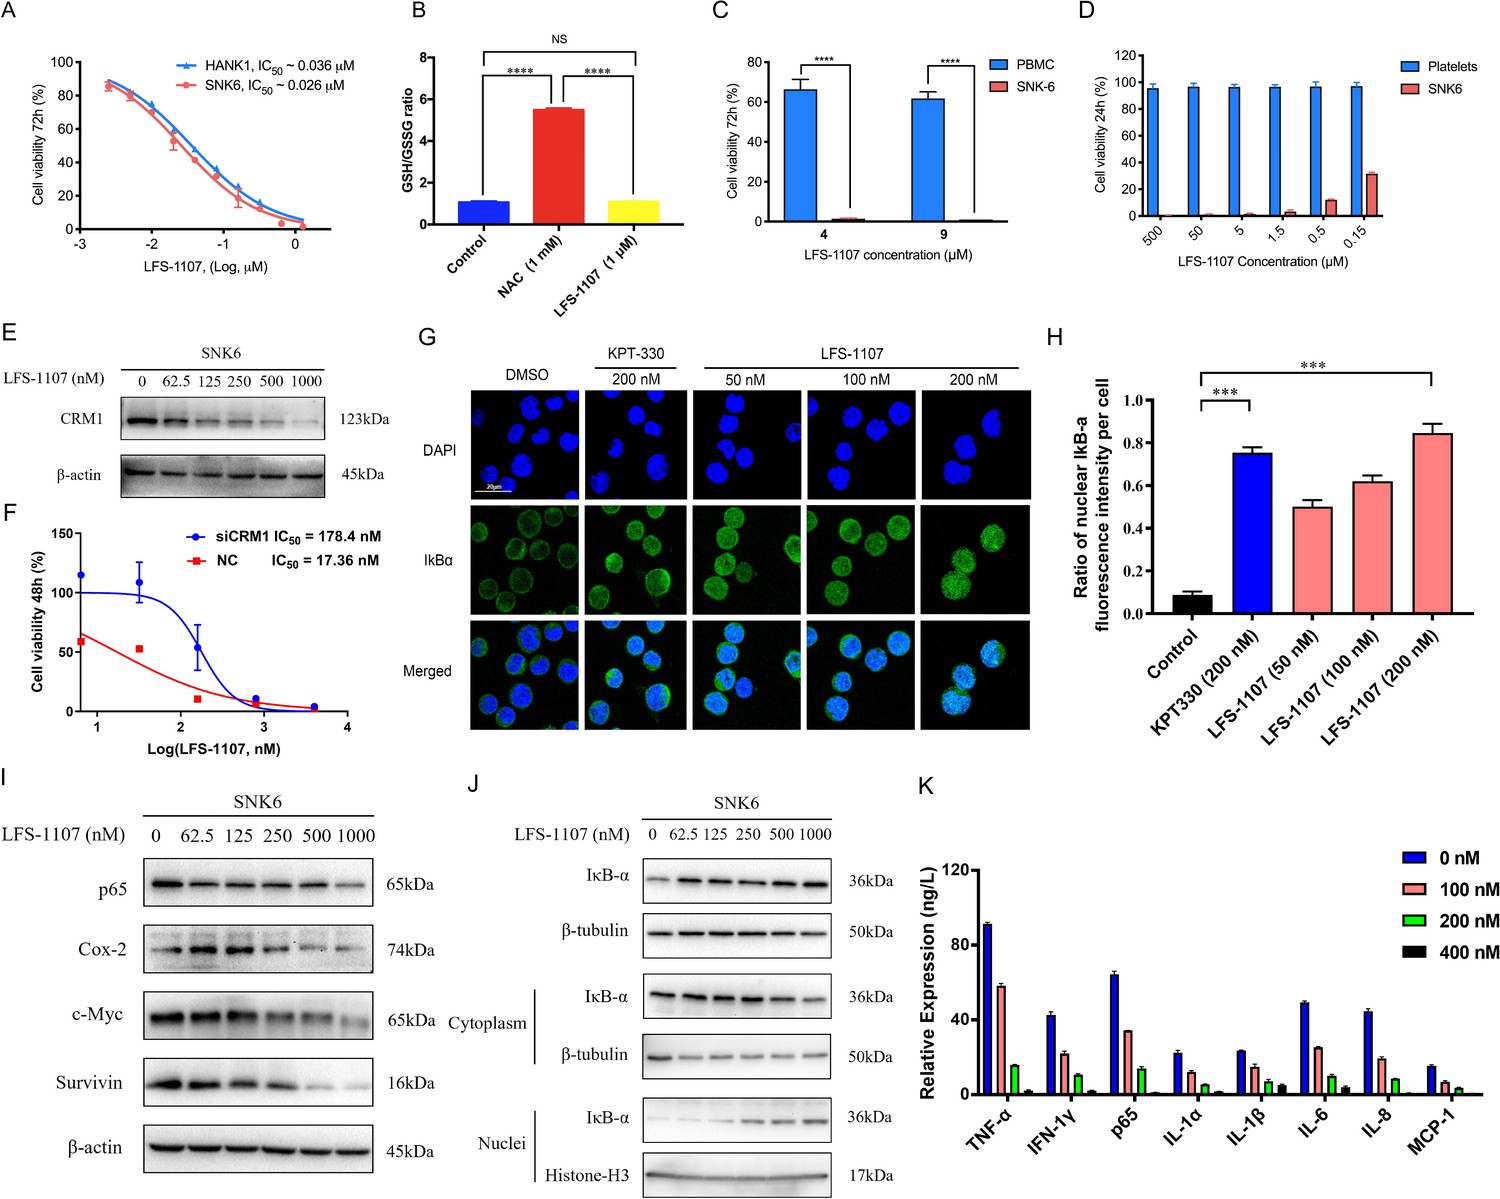
LFS-1107 strongly suppresses the growth of ENKTL cells acting through the nuclear retention of IkBα and subsequent attenuation of NF-κB signaling.
(A) Suppression of different human NK/T cell lymphoma cells; (B) GSH/GSSG ratio detection upon the treatment of LFS-1107; (C) The effect of LFS-1107 on normal PBMC cell lines; (D) The viability of platelets treated with LFS-1107; (E) Western blot result of the CRM1 with β-actin as loading control; (F) The cellular activities of LFS-1107 on siCRM1-293T and the wild-type 293T cell line with different concentrations of treatment for 48 h; (G) Nuclear retention of IκBα by confocal microscopy (Scale bar, 20 μM); (H) Quantification of the nuclear IΚB-α ratio by fluorescence intensity per cell (Data presented as mean ± SEM); (I) Representative western blots of p65, Cox-2, c-Myc, and Survivin; (J) Western blots showing the protein level of IκBα in nucleus and cytoplasm; (K) ELISA detection of cytokine production after treated with LFS-1107. Data were either presented as representative images or expressed as the mean ± SD of each group. Statistical analysis were performed via Student t-test, ***p<0.001, ****p<0.0001.
-
Figure 2—source data 1
Inhibition of the cell growth of SNK6 and Hank-1 cells by LFS-1107.
- https://cdn.elifesciences.org/articles/80625/elife-80625-fig2-data1-v2.zip
-
Figure 2—source data 2
GSH/GSSG ratio detection upon the treatment of LFS-1107.
- https://cdn.elifesciences.org/articles/80625/elife-80625-fig2-data2-v2.zip
-
Figure 2—source data 3
Suppression of the cell growth of PBMC cells by LFS-1107.
- https://cdn.elifesciences.org/articles/80625/elife-80625-fig2-data3-v2.zip
-
Figure 2—source data 4
Suppression of the cell growth of platelets by LFS-1107.
- https://cdn.elifesciences.org/articles/80625/elife-80625-fig2-data4-v2.zip
-
Figure 2—source data 5
Immunoblot of CRM1 expression after LFS-1107 treatment.
- https://cdn.elifesciences.org/articles/80625/elife-80625-fig2-data5-v2.zip
-
Figure 2—source data 6
The cellular activities of LFS-1107 on siCRM1-293T and the wild-type 293T cell line.
- https://cdn.elifesciences.org/articles/80625/elife-80625-fig2-data6-v2.zip
-
Figure 2—source data 7
Nuclear accumulation of IκBα induced by treatment with LFS-1107 for 3 hr.
- https://cdn.elifesciences.org/articles/80625/elife-80625-fig2-data7-v2.zip
-
Figure 2—source data 8
Quantification of the nuclear IκBα ratio by fluorescence intensity per cell.
- https://cdn.elifesciences.org/articles/80625/elife-80625-fig2-data8-v2.zip
-
Figure 2—source data 9
Immunoblot of expression p65, Cox-2, c-Myc, and Survivin after LFS-1107 treatment.
- https://cdn.elifesciences.org/articles/80625/elife-80625-fig2-data9-v2.zip
-
Figure 2—source data 10
Immunoblot of IκBα in nucleus and cytoplasm expression after LFS-1107.
- https://cdn.elifesciences.org/articles/80625/elife-80625-fig2-data10-v2.zip
-
Figure 2—source data 11
ELISA detection of TNF-α, IFN-1γ, p65, IL-1α, IL-1β, IL-6, IL-8, and MCP-1 after treated with LFS-1107.
- https://cdn.elifesciences.org/articles/80625/elife-80625-fig2-data11-v2.zip
Figure 2—figure supplement 1

Proteomics analysis of SNK6 cells (control vs. LFS-1107 treatment) indicates that CRM1 was downregulated upon LFS-1107 treatment (FC~1.3).
Moreover, the Gene Ontology (GO) analysis suggests that Biological Process (regulation of cellular component organization) and Molecular Function (protein binding) related to CRM1 were modulated upon the treatment of LFS-1107.
-
Figure 2—figure supplement 1—source data 1
Proteomics analysis of SNK6 cells.
- https://cdn.elifesciences.org/articles/80625/elife-80625-fig2-figsupp1-data1-v2.zip
Figure 2—figure supplement 2

Cellular activities of KPT-330 towards two ENKTL cell lines.
-
Figure 2—figure supplement 2—source data 1
Cellular activities of KPT-330 towards two ENKTL cell lines.
- https://cdn.elifesciences.org/articles/80625/elife-80625-fig2-figsupp2-data1-v2.zip
Figure 2—figure supplement 3
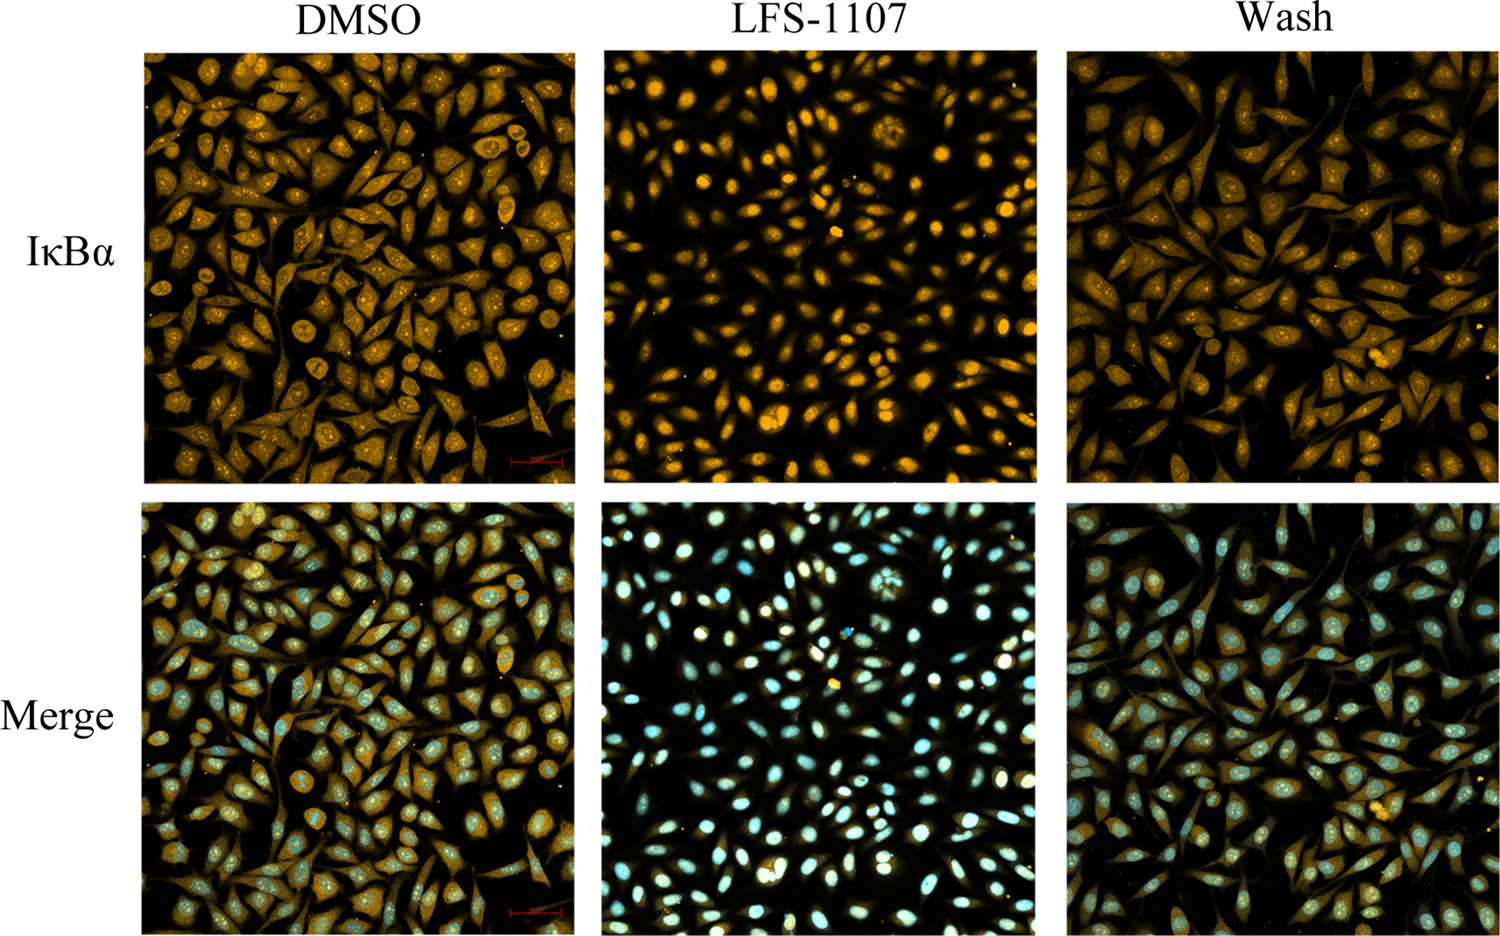
Representative immunofluorescence images of IκBα (stained with Cy3) localization in Hela cells.
Nuclear accumulation of IκBα induced by treatment with LFS-1107 (500nM) for 3 hours. The medium (containing LFS-1107) was removed and replaced with new medium in the Wash group. Nuclei was stained with DAPI. Scale bars, 50μM.
-
Figure 2—figure supplement 3—source data 1
Nuclear accumulation of IκBα induced by treatment with 500 nM LFS-1107 for 3 hr.
The medium (containing LFS-1107) was removed and replaced with new medium in the Wash group. Fixed cells were stained for IκBα (orange) and DAPI (blue).
- https://cdn.elifesciences.org/articles/80625/elife-80625-fig2-figsupp3-data1-v2.zip
Figure 3
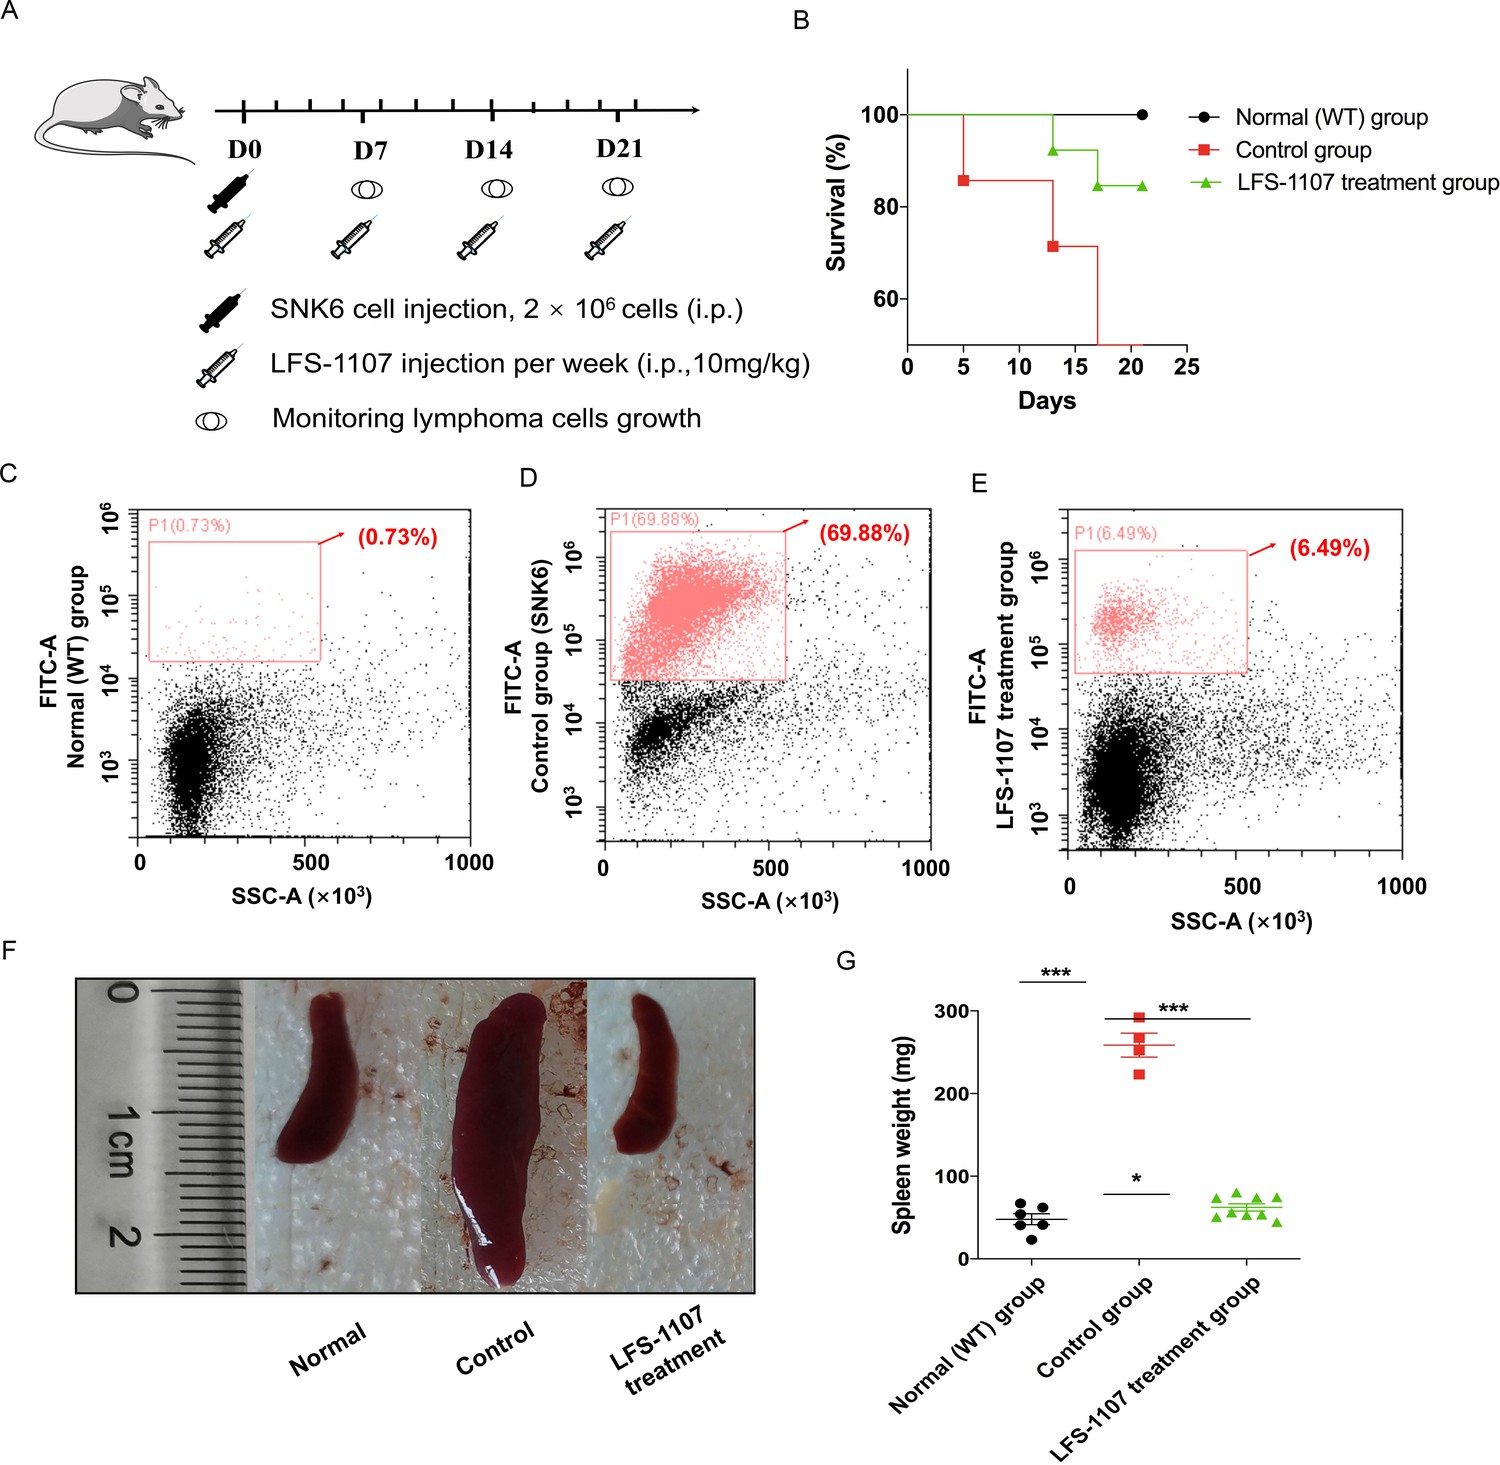
LFS-1107 can ameliorate the symptoms of ENKTL in xenograft mouse model.
(A) Scheme of the xenograft mouse model. The mice were randomly divided into three groups (n = 6-13 per group). SNK6 cells were injected i.v. in female NOD SCID mice, and mice were injected per week with LFS-1107; (B) Survival rate of different animal groups; (C–E) Flow cytometry of human ENKTL cell lines in mouse bone marrow with the use of FITC anti-human CD45 antibody (P1, red) or no primary antibody control (black); (F–G) The symptoms of splenomegaly in each group of euthanized mice. From left to right: normal group, control ENKTL xenograft model group(splenomegaly), LFS-1107 treatment group (10 mg/kg). Data were either presented as representative images or expressed as the mean ± SEM of each group. Statistical analysis were performed via Student t-test, *p<0.05, ***p<0.001.
-
Figure 3—source data 1
The process for the in the xenograft mouse model study.
- https://cdn.elifesciences.org/articles/80625/elife-80625-fig3-data1-v2.zip
-
Figure 3—source data 2
Survival rate of normal group, control group and LFS-1107 treatment group.
- https://cdn.elifesciences.org/articles/80625/elife-80625-fig3-data2-v2.zip
-
Figure 3—source data 3
Flow cytometry of human ENKTL cell lines in mouse bone marrow.
- https://cdn.elifesciences.org/articles/80625/elife-80625-fig3-data3-v2.zip
-
Figure 3—source data 4
The symptoms of splenomegaly in normal group, control group and LFS-1107 treatment group mice.
- https://cdn.elifesciences.org/articles/80625/elife-80625-fig3-data4-v2.zip
-
Figure 3—source data 5
The spleen weight of normal group, control group and LFS-1107 treatment group mice.
- https://cdn.elifesciences.org/articles/80625/elife-80625-fig3-data5-v2.zip
Additional files
-
MDAR checklist
- https://cdn.elifesciences.org/articles/80625/elife-80625-mdarchecklist1-v2.pdf
-
Source code 1
Deep reinforcement learning model for molecular de-novo design.
- https://cdn.elifesciences.org/articles/80625/elife-80625-code1-v2.zip
Download links
A two-part list of links to download the article, or parts of the article, in various formats.
Downloads (link to download the article as PDF)
Open citations (links to open the citations from this article in various online reference manager services)
Cite this article (links to download the citations from this article in formats compatible with various reference manager tools)
Discovery and biological evaluation of a potent small molecule CRM1 inhibitor for its selective ablation of extranodal NK/T cell lymphoma
eLife 12:e80625.
https://doi.org/10.7554/eLife.80625


