Environmental pH signals the release of monosaccharides from cell wall in coral symbiotic alga
- Department of Ecological Developmental Adaptability Life Sciences, Graduate School of Life Sciences, Tohoku University, Japan
- Department of Biology, Miyagi University of Education, Japan
- Department of Biological Sciences, Faculty of Science, Kanagawa University, Japan
- Department of Basic Biology, School of Life Science, SOKENDAI (The Graduate University for Advanced Studies), Japan
- Division of Environmental Photobiology, National Institute for Basic Biology, Japan
- Tropical Biosphere Research Center, University of the Ryukyus, Japan
- Graduate School of Humanities and Sciences, Ochanomizu University, Japan
Figures
Figure 1 with 2 supplements
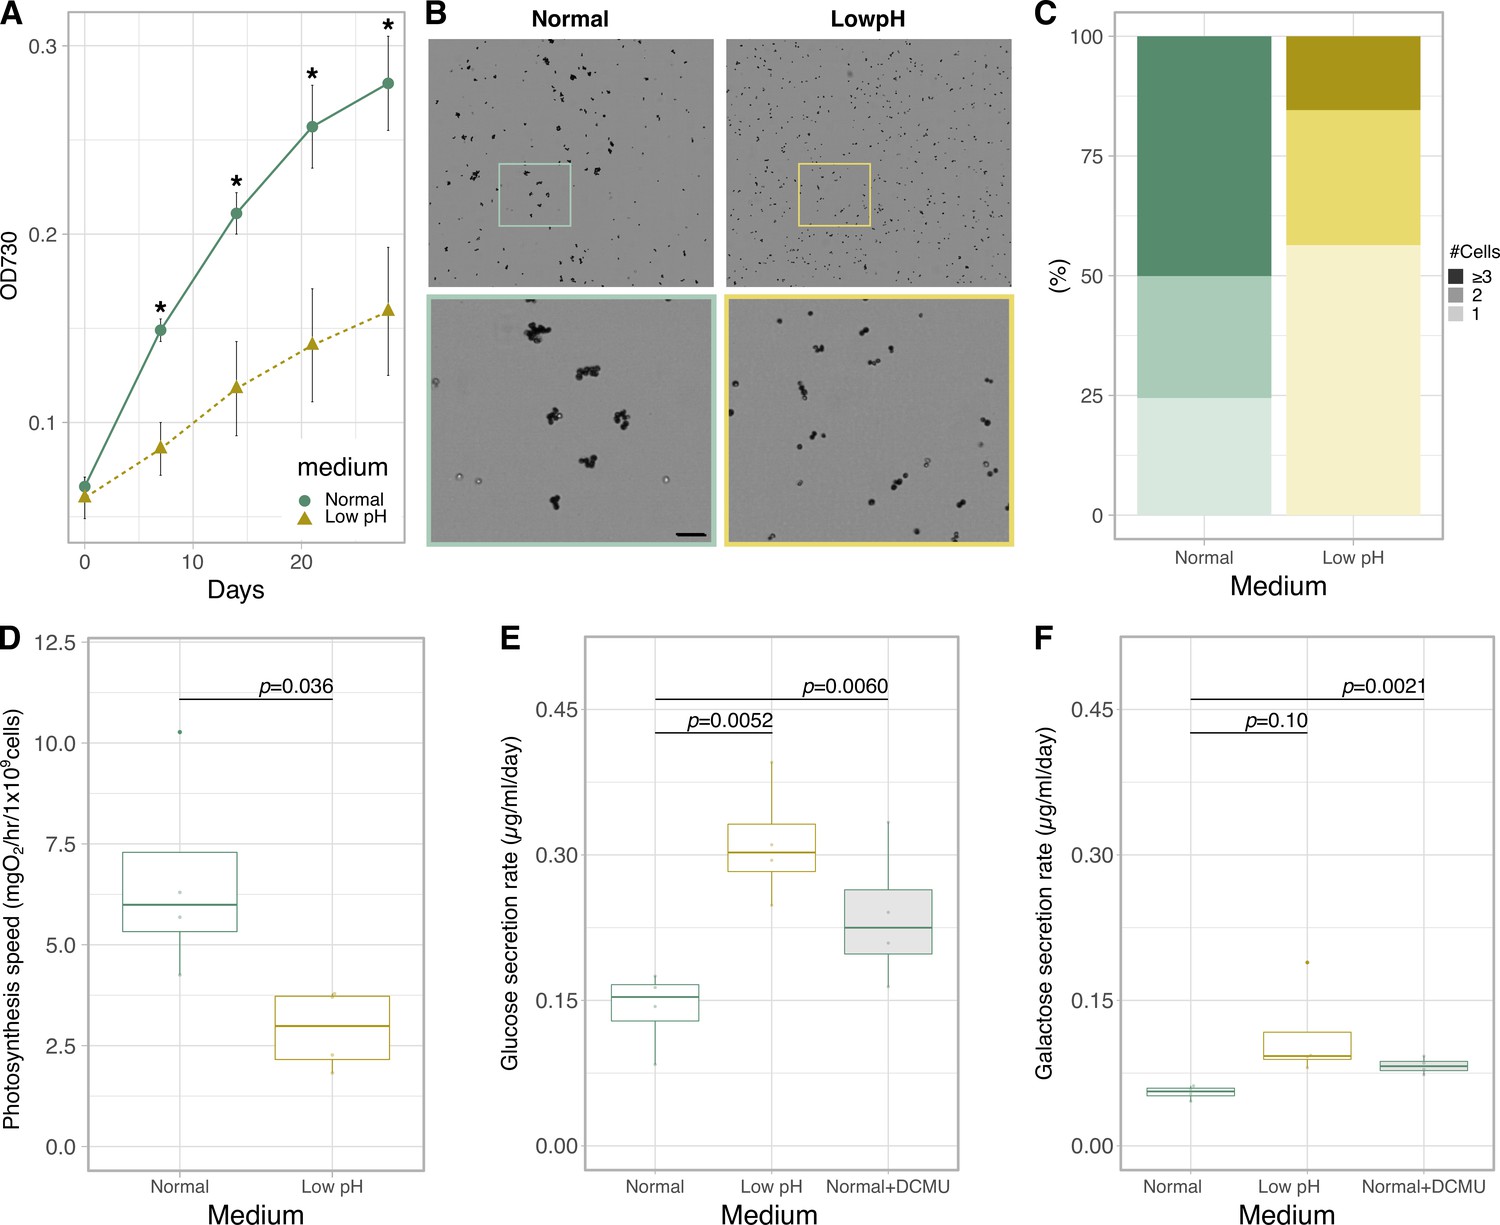
Physiological characterization and monosaccharide secretion of cultured Breviolum.
(A) Growth rate (n = 6 per treatment, t-test). Asterisks indicate statistically significant differences (t-test, p < 0.005). (B) Bright field images of the cells under different conditions. The lower panels show high-magnification views of boxed areas in the upper panels. Scale bar = 50 μm. (C) Quantification of the number of cells forming clusters (Fisher’s exact test for “1 or 2” vs “3 or more”, p = 1.727 × 10⁻⁷). (D) Photosynthesis activity (n = 4 per treatment, t-test) (E, F) Quantification of glucose (E) and galactose (F) secreted in normal, low pH and normal+DCMU media during incubation for 1 day using ion chromatography (n = 4 per treatment, t-test).
-
Figure 1—source data 1
Raw data of growth rates.
- https://cdn.elifesciences.org/articles/80628/elife-80628-fig1-data1-v1.txt
-
Figure 1—source data 2
Raw data of photosynthesis activities.
- https://cdn.elifesciences.org/articles/80628/elife-80628-fig1-data2-v1.txt
-
Figure 1—source data 3
Raw data of glucose and galactose concentrations.
- https://cdn.elifesciences.org/articles/80628/elife-80628-fig1-data3-v1.txt
Figure 1—figure supplement 1

Experimental design details.
Figure 1—figure supplement 2

Effect of photosynthesis inhibitor on glucose and galactose secretion.
The quantification of glucose (A) and galactose (B) in the media of the Breviolum cultures on 0- and 1-day incubation using ion chromatography (n = 4-11 per treatment, t-test).
Figure 2 with 2 supplements
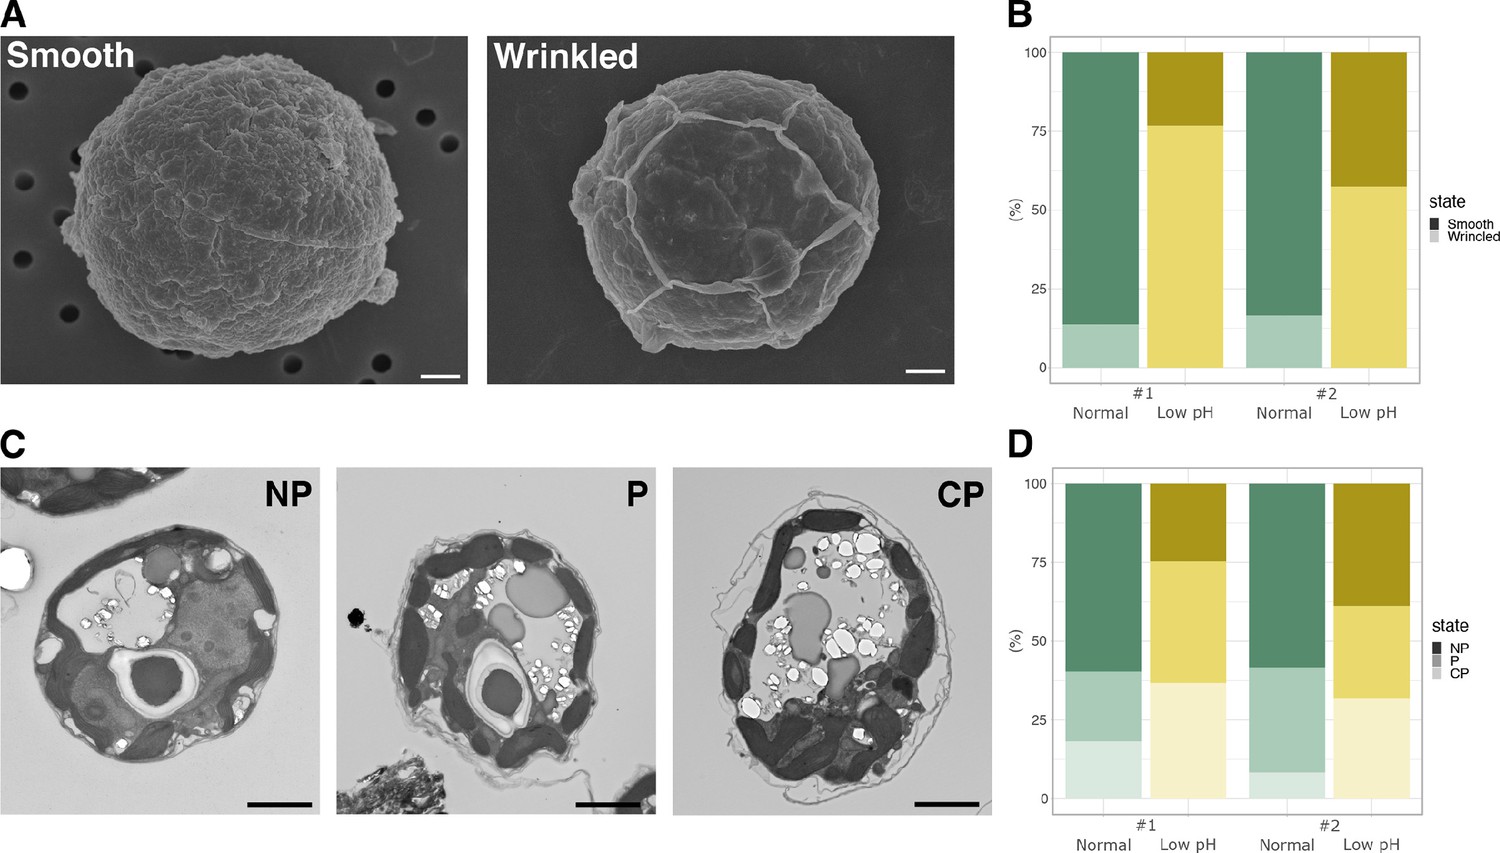
Cell structures under different pH condition.
(A) SEM images of the representative cells. Scale bar = 1 μm. (B) Quantification of the cell surface structures of the SEM images (Fisher’s exact test, #1; p < 2.2 × 10⁻¹⁶, #2; p < 2.2 × 10⁻¹⁶). (C) TEM images of the representative cells. NP, ‘non-peeled’ where the outer struc- ture of the cell wall is not shed from the cell surface; P, ‘peeled’ at some parts of the cell surface; CP, ‘completely peeled’. Scale bar = 2 μm. (D) Quantification of the cell surface structures of the TEM images (Fisher’s exact test for “P or CP” vs “NP”, #1; p = 4.621 × 10⁻¹¹, #2; p = 3.525 × 10⁻⁴).
-
Figure 2—source data 1
Raw data of bright field cell counts.
- https://cdn.elifesciences.org/articles/80628/elife-80628-fig2-data1-v1.txt
-
Figure 2—source data 2
Raw data of SEM cell counts.
- https://cdn.elifesciences.org/articles/80628/elife-80628-fig2-data2-v1.txt
-
Figure 2—source data 3
Raw data of TEM cell counts.
- https://cdn.elifesciences.org/articles/80628/elife-80628-fig2-data3-v1.txt
Figure 2—figure supplement 1

SEM images of cell surface structures.
Representative examples of Smooth and Wrinkled. Scale bar = 1 μm.
Figure 2—figure supplement 2
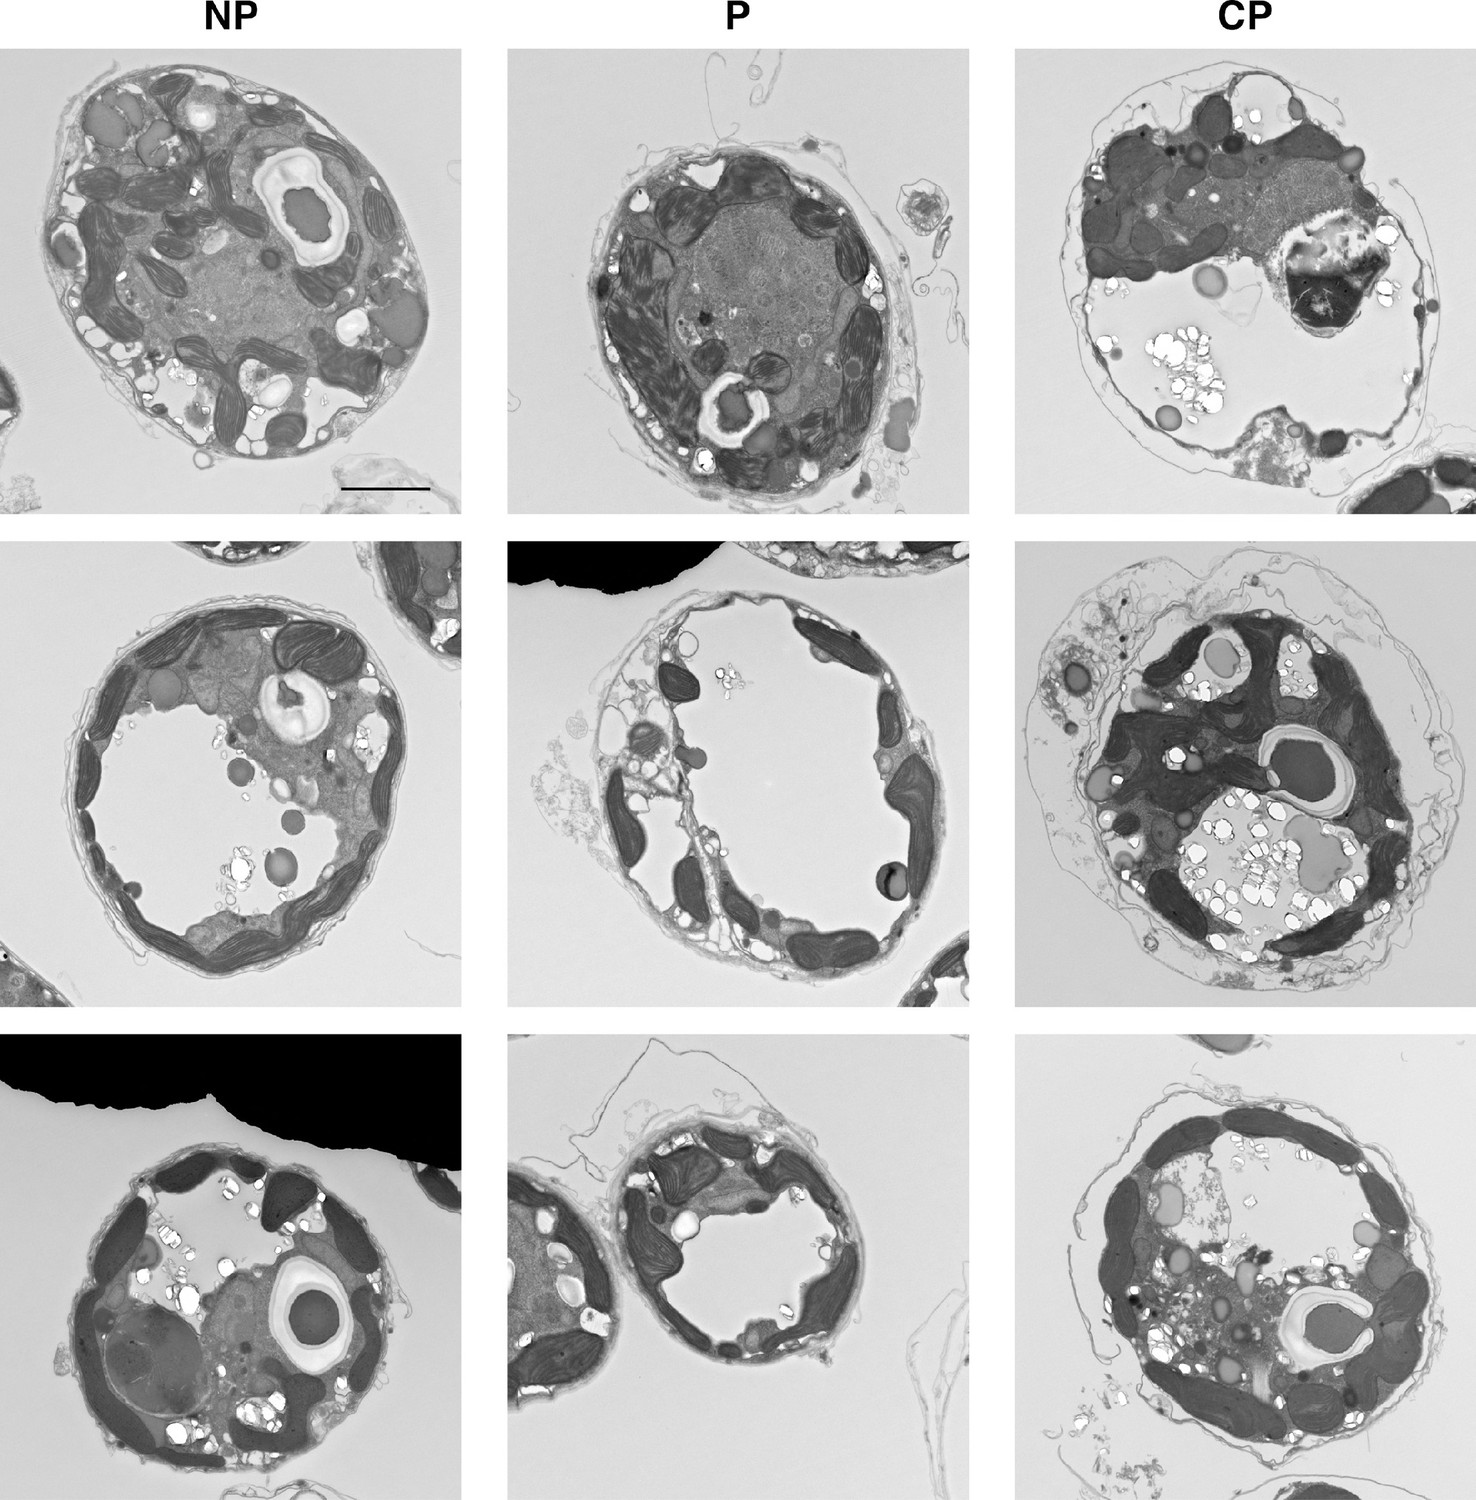
TEM images of cell surface structures.
Representative examples of NP (non-peeled), P (peeled) and CP (completely peeled). Scale bar = 2 μm.
Figure 3 with 2 supplements
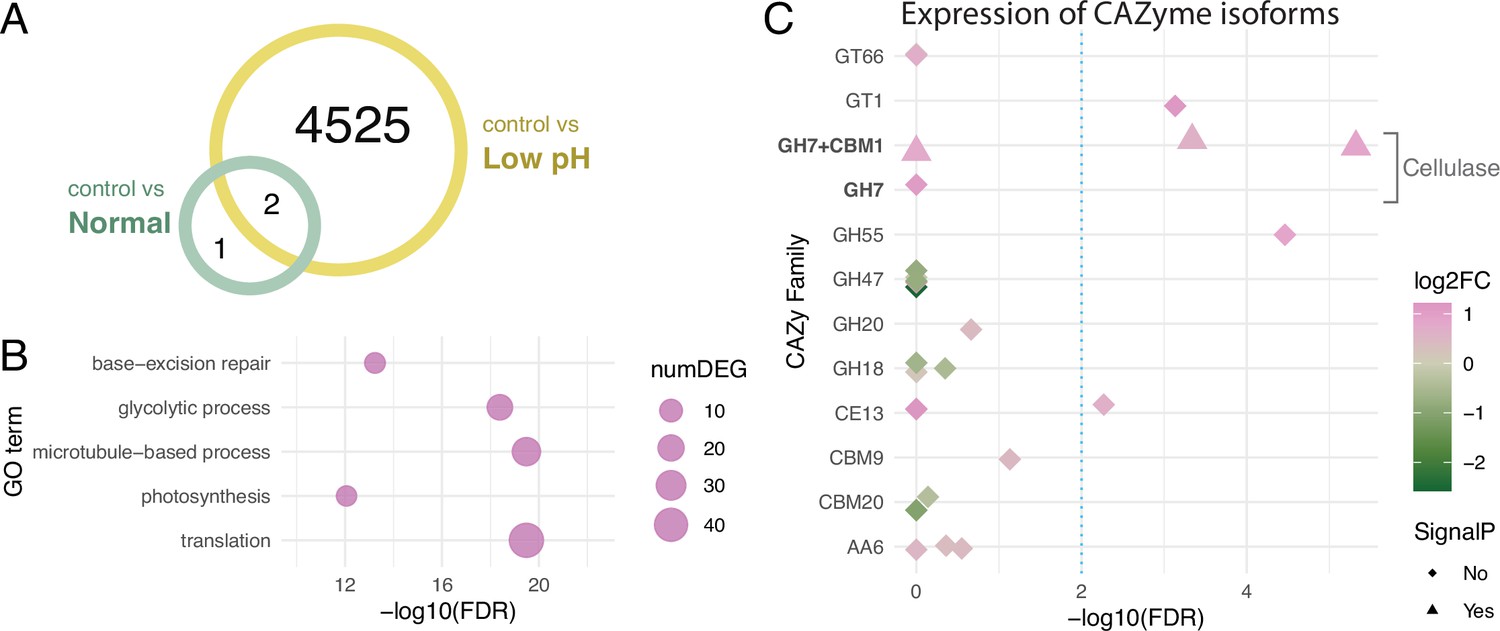
Differentially expressed genes under different pH conditions.
(A) Venn diagram showing the numbers of DEGs under different conditions. (B) GO term enrichment analysis. Circles indicate the statistical significance (FDR) of the enriched GO terms, with the numbers of DEGs (numDEG) associated with each GO term. (C) Isoform-level expression analysis of genes encoding Carbohydrate-Active enZymes (CAZymes). Symbols indicate isoforms associated with the DEGs, with the presence (triangle) or absence (rhombus) of signal peptide predicted in the amino acid sequence. Symbol colors represent the log2 fold-changes (log2FC) of the expression levels of each isoform (low pH/control). Dashed line indicates a threshold for differential expression (FDR = 0.01).
-
Figure 3—source data 1
Expression levels of the annotated low pH DEGs.
- https://cdn.elifesciences.org/articles/80628/elife-80628-fig3-data1-v1.txt
-
Figure 3—source data 2
GO enrichment analysis results.
- https://cdn.elifesciences.org/articles/80628/elife-80628-fig3-data2-v1.xlsx
-
Figure 3—source data 3
CAZome analysis results.
- https://cdn.elifesciences.org/articles/80628/elife-80628-fig3-data3-v1.xlsx
-
Figure 3—source data 4
Multiple alignment of the cellulase proteins.
- https://cdn.elifesciences.org/articles/80628/elife-80628-fig3-data4-v1.txt
-
Figure 3—source data 5
Newick format file for phylogenetic tree of the cellulase proteins.
- https://cdn.elifesciences.org/articles/80628/elife-80628-fig3-data5-v1.txt
Figure 3—figure supplement 1
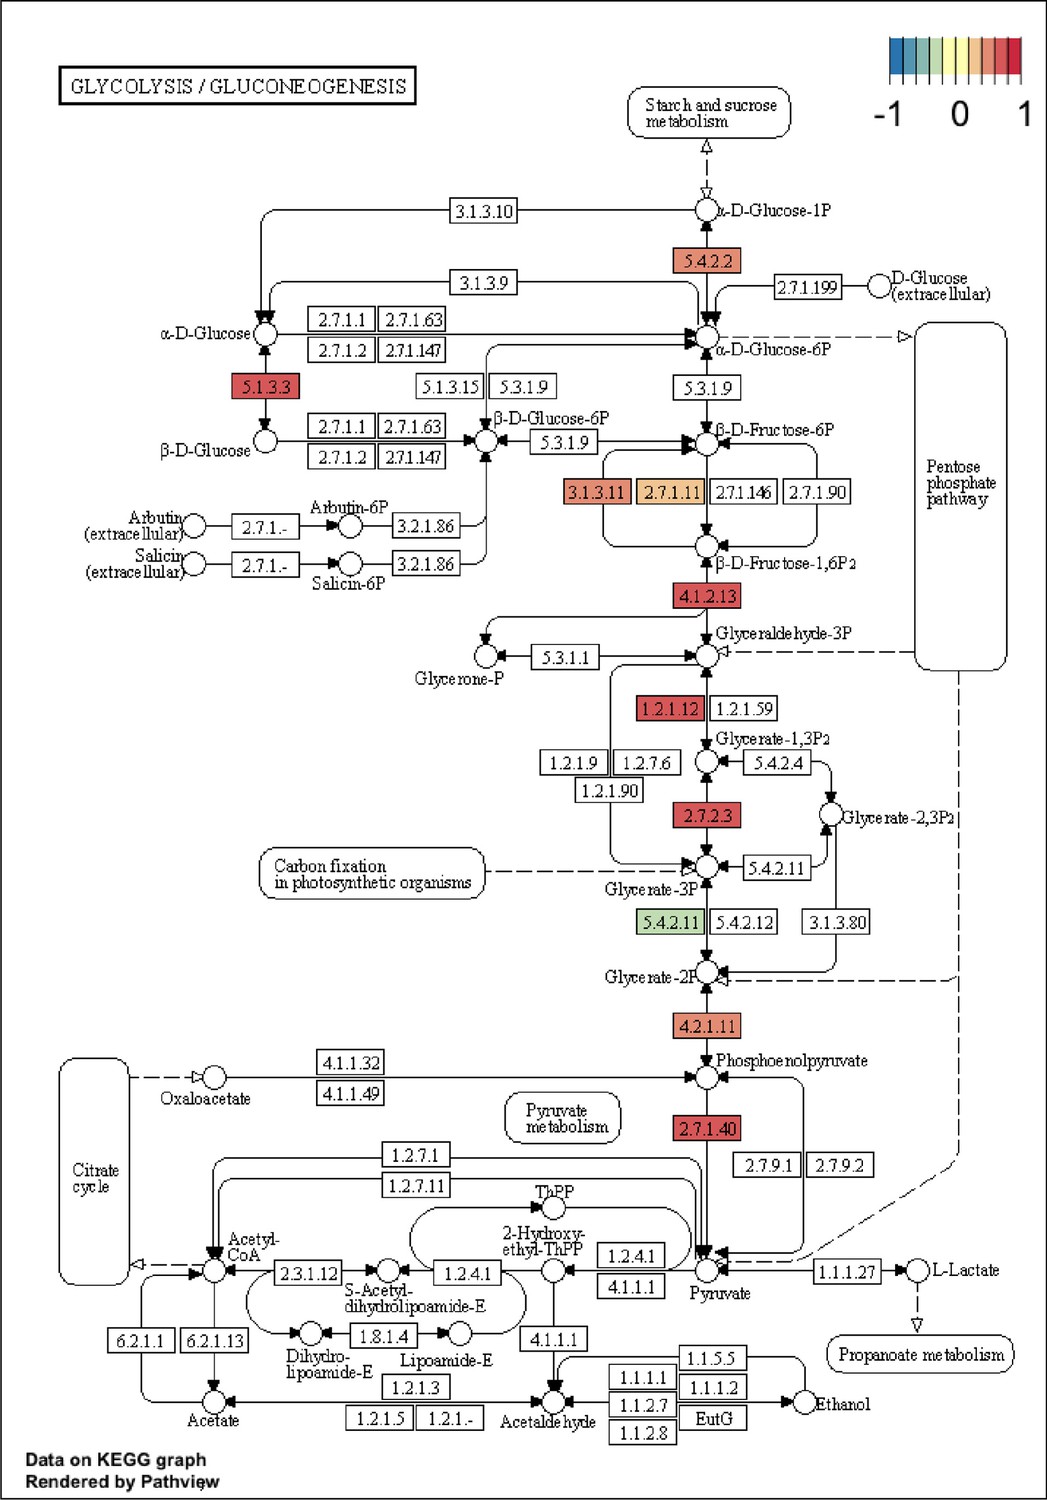
Mapping of DEGs between the low pH and control groups on KEGG pathways.
The KEGG pathways for glycolysis/gluconeogenesis are shown. The colours indicate gene expression levels.
Figure 3—figure supplement 2
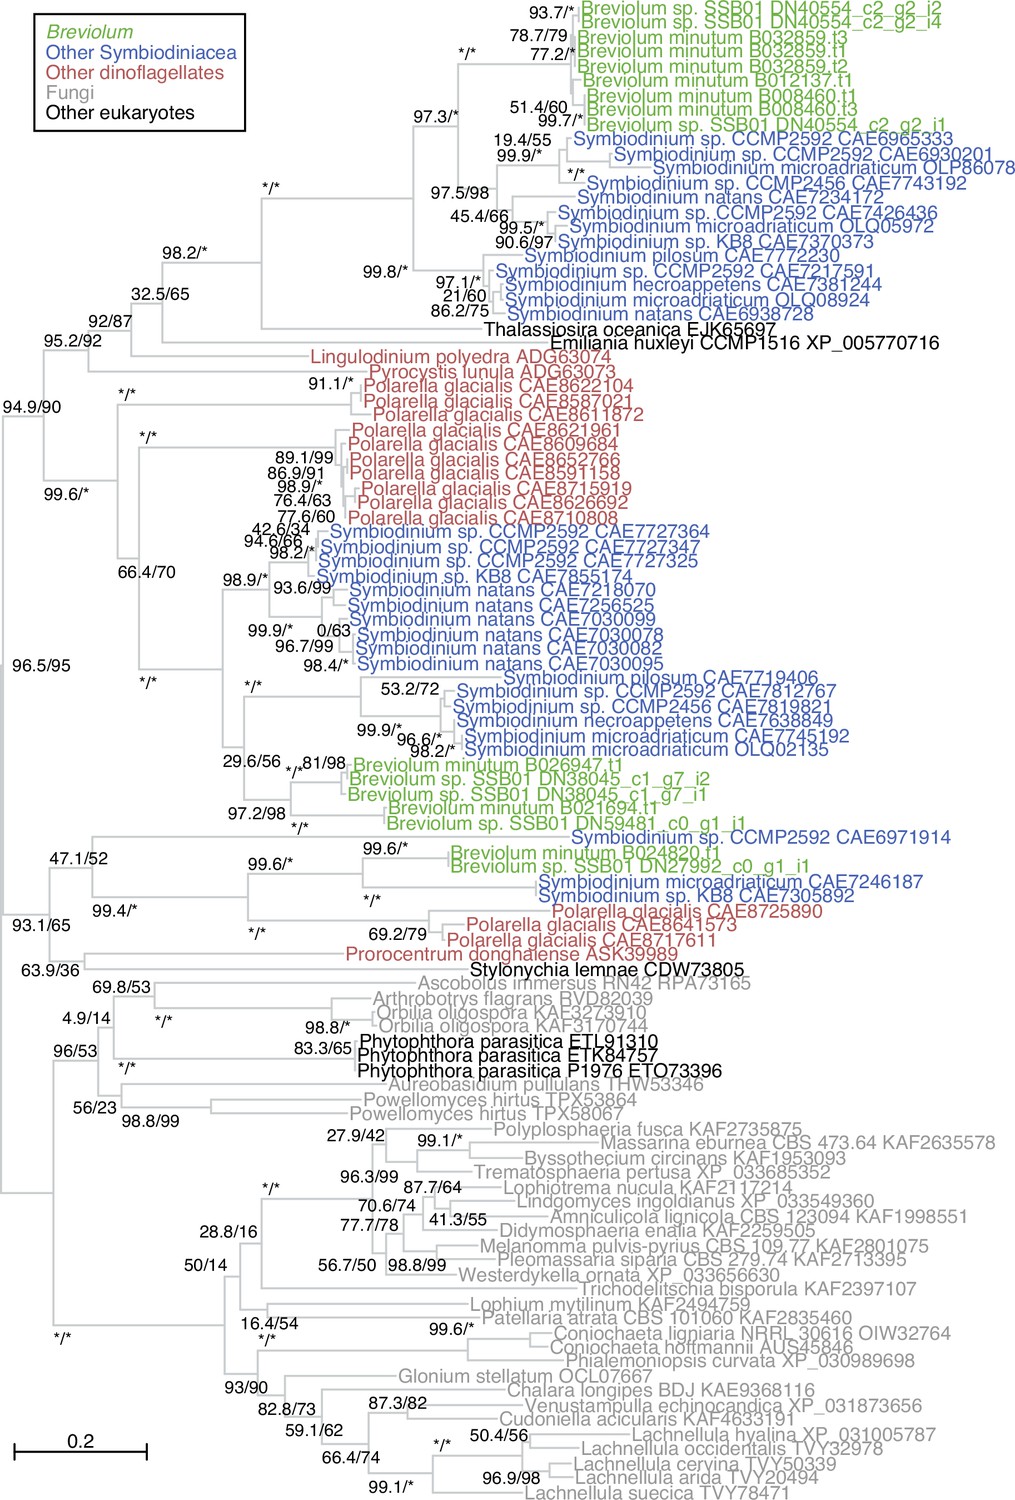
Phylogenetic tree of the cellulase proteins.
A maximum likelihood tree of cellulase proteins labeled with species names and GenBank IDs is shown. Support values using an SH-like approximate likelihood ratio test (left) and ultrafast boot strap approximation (right) are shown for each branch. For Breviolum sp. SSB01, the Trinity assembly contig IDs are shown.
Figure 4 with 1 supplement
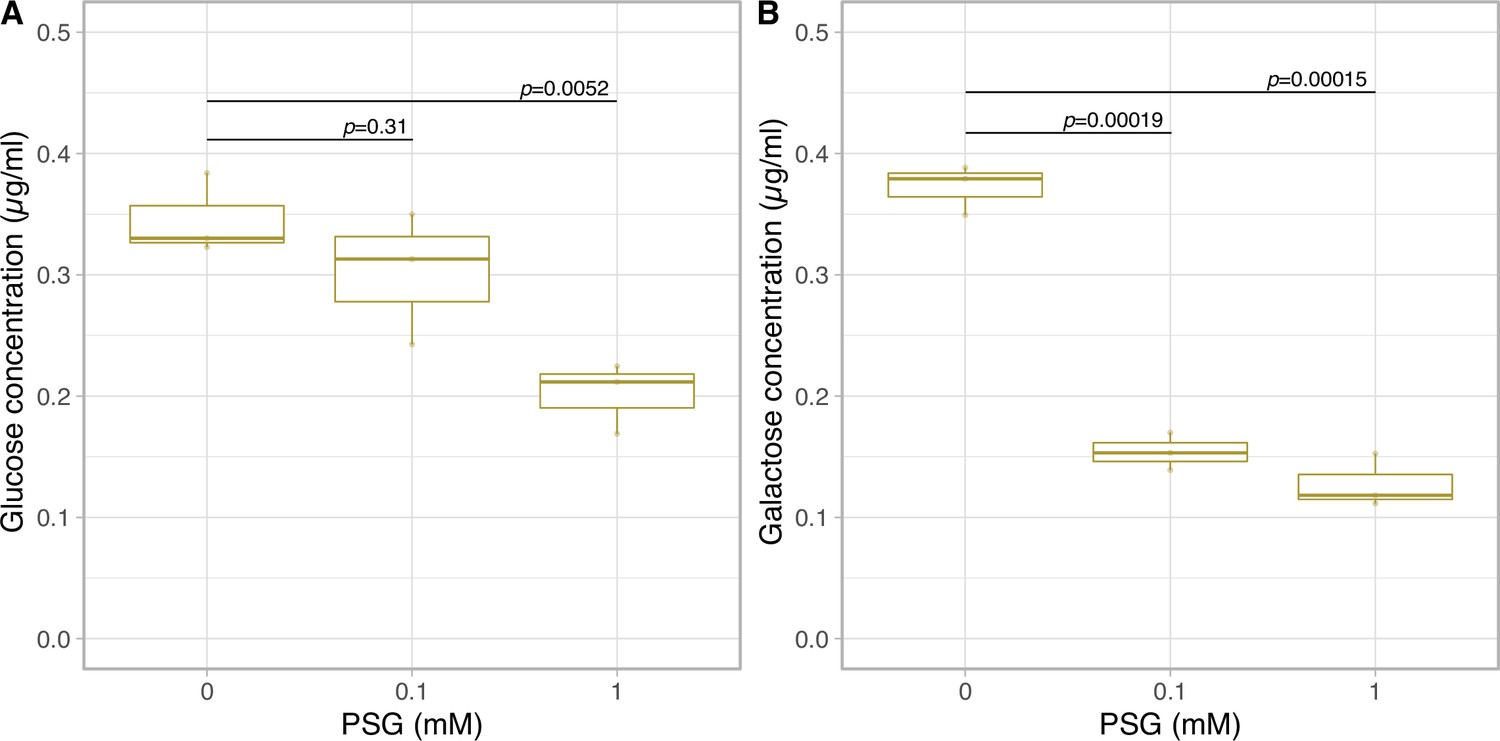
Glucose and galactose secretion in cellulase inhibitor treatment.
The quantification of glucose (A) and galactose (B) in the medium on 1 day incubation with PSG using LC-MS/MS (n = 3 per treatment, t-test).
-
Figure 4—source data 1
Raw data of glucose and galactose concentrations with PSG.
- https://cdn.elifesciences.org/articles/80628/elife-80628-fig4-data1-v1.txt
-
Figure 4—source data 2
Raw data of cellulase activity in vitro.
- https://cdn.elifesciences.org/articles/80628/elife-80628-fig4-data2-v1.txt
Figure 4—figure supplement 1

Effect of cellulase inhibitor on the Breviolum cellulase activity in vitro.
The cellulase activity of the Breviolum cell homogenate incubated with PSG are shown. Confidence interval = 95%.
Additional files
Download links
A two-part list of links to download the article, or parts of the article, in various formats.
Downloads (link to download the article as PDF)
Open citations (links to open the citations from this article in various online reference manager services)
Cite this article (links to download the citations from this article in formats compatible with various reference manager tools)
Environmental pH signals the release of monosaccharides from cell wall in coral symbiotic alga
eLife 12:e80628.
https://doi.org/10.7554/eLife.80628


