Environmental pH signals the release of monosaccharides from cell wall in coral symbiotic alga

  1. Yuu Ishii
  2. Hironori Ishii
  3. Takeshi Kuroha
  4. Ryusuke Yokoyama
  5. Ryusaku Deguchi
  6. Kazuhiko Nishitani
  7. Jun Minagawa
  8. Masakado Kawata
  9. Shunichi Takahashi
  10. Shinichiro Maruyama  Is a corresponding author
  1. Department of Ecological Developmental Adaptability Life Sciences, Graduate School of Life Sciences, Tohoku University, Japan
  2. Department of Biology, Miyagi University of Education, Japan
  3. Department of Biological Sciences, Faculty of Science, Kanagawa University, Japan
  4. Department of Basic Biology, School of Life Science, SOKENDAI (The Graduate University for Advanced Studies), Japan
  5. Division of Environmental Photobiology, National Institute for Basic Biology, Japan
  6. Tropical Biosphere Research Center, University of the Ryukyus, Japan
  7. Graduate School of Humanities and Sciences, Ochanomizu University, Japan

Abstract

Reef-building corals thrive in oligotrophic environments due to their possession of endosymbiotic algae. Confined to the low pH interior of the symbiosome within the cell, the algal symbiont provides the coral host with photosynthetically fixed carbon. However, it remains unknown how carbon is released from the algal symbiont for uptake by the host. Here we show, using cultured symbiotic dinoflagellate, Breviolum sp., that decreases in pH directly accelerates the release of monosaccharides, that is, glucose and galactose, into the ambient environment. Under low pH conditions, the cell surface structures were deformed and genes related to cellulase were significantly upregulated in Breviolum. Importantly, the release of monosaccharides was suppressed by the cellulase inhibitor, glucopyranoside, linking the release of carbon to degradation of the agal cell wall. Our results suggest that the low pH signals the cellulase-mediated release of monosaccharides from the algal cell wall as an environmental response in coral reef ecosystems.

Editor's evaluation

The manuscript makes a fundamental contribution to our understanding of sugar release by symbiotic dinoflagellates and is of broad interest to the fields of ecology, marine biology, and cell biology. The experiments, which combine algal culture with targeted metabolomics, transcriptomics, and the application of inhibitors, provide convincing evidence for an acidic environment mimicking conditions reported for the intracellular organelle that hosts the symbiotic algae, leading to upregulation of algal cellulases, which in turn degrade the algal cell wall and thereby releasing glucose and galactose that can be used as a source of food by the coral host. This is a new idea and could significantly contribute to our understanding of photosymbiosis.

https://doi.org/10.7554/eLife.80628.sa0

eLife digest

Coral reefs are known as ‘treasure troves of biodiversity’ because of the enormous variety of different fish, crustaceans and other marine life they support. Colonies of marine animals, known as corals, which are anchored to rocks on the sea bed, form the main structures of a coral reef. Many corals rely on partnerships with microscopic algae known as dinoflagellates for most of their energy needs. The dinoflagellates use sunlight to make sugars and other carbohydrates and they give some of these to the coral. In exchange, the coral provides a home for the dinoflagellates inside its body.

The algae live inside special compartments within coral cells known as symbiosomes. These compartments have a lower pH (that is, they are more acidic) than the rest of the coral cell. Previous studies have shown that the algae release sugars into the symbiosome but it remains unclear what triggers this release and whether it only occurs when the algae are in a partnership.

Ishii et al. studied a type of dinoflagellate known as Breviolum sp. that had been grown in sea water-like liquid in a laboratory. The experiments found that the alga released two sugar molecules known as glucose and galactose into its surroundings even in the absence of a host coral.

Increasing the acidity of the liquid caused the alga to release more sugars and resulted in changes to some of the structures on the surface of its cells. The alga also produced an enzyme, called cellulase, to degrade the wall that normally surrounds the cell of an alga. Treating the alga with a drug that inhibits the activity of cellulase also suppressed the release of sugars from the cells.

These findings suggest that when dinoflagellates enter acidic environments, like the guts of marine animals or symbiosomes inside coral cells, the decrease in pH can activate the algal cellulase enzyme, which in turn triggers the release of sugars for the coral. This research will provide a new viewpoint to those interested in how partnerships between animals and algae are sustained in marine environments. It also highlights the importance of the alga cell wall in establishing partnerships with corals. Further work will seek to clarify the precise biological mechanisms involved.

Introduction

Coral reef ecosystems are sustained by symbiosis between stony corals and marine dinoflagellates from the family Symbiodiniaceae, which are found in nature as free-living mixotrophs (Decelle et al., 2018; Jeong et al., 2012), as well as are primary producers in symbiotic relationships with various partners, including multicellular (e.g. Cnidaria, Mollusca, Porifera) and unicellular organisms (Foraminifera, ciliates; LaJeunesse et al., 2018). In oligotrophic oceans, transfer of atmospheric carbon photosynthetically fixed by the symbiotic algae to their hosts is a fundamental flux to sustain the growth and productivity of coral reef ecosystems.

Although it is generally accepted that Symbiodiniaceae algae provide photosynthates to their symbiotic partners, the molecular details are largely unknown (Falkowski et al., 1984; Ishii et al., 2019; Ishikura et al., 1999; Muscatine, 1990; Rahav et al., 1989; Stat et al., 2008; Whitehead and Douglas, 2003). Members of this family reside in the extracellular ‘symbiotic tube’ systems of giant clams or in an intracellular organelle called the ‘symbiosome’ within cnidarian host cells. These are thought to be special low pH environments that are acidified by V-type H+-ATPase proton pumps (Armstrong et al., 2018; Barott et al., 2015; Davy et al., 2012). While low pH environments are stressors to algae in general, they can be beneficial when CO2 uptake is encouraged by the hosts’ carbon-concentrating functions, enhancing photosynthesis (Armstrong et al., 2018; Barott et al., 2015). A previous study has demonstrated a photosynthesis-dependent glucose transfer from Symbiodiniaceae to sea anemone hosts (Burriesci et al., 2012), and some sugar transporters are proposed to be involved in glucose transfer (Lehnert et al., 2014; Sproles et al., 2018). Other studies suggest that the amount of transfer is regulated by the C-N balance (Rädecker et al., 2021; Xiang et al., 2020). Nevertheless, the mechanism of algal glucose secretion is not yet characterized.

As walled organisms, microalgae respond to the environments in a variety of ways through their cell walls. Although dinoflagellates including Symbiodiniaceae have cellulose-containing cell walls that are structurally distinct from those of land plants, molecular organization of the cell walls is poorly understood. Previous studies have shown that enzymes involved in the degradation and synthesis of cellulose (e.g. Cellulase, cellulose synthase) are critical in the regulations of the cell cycle and cell morphology, suggesting that the cell wall is a dynamic environmental interface (Chan et al., 2019; Kwok and Wong, 2010). In this study, we focus on the responses to low pH and the cell wall organization of the coral symbiont alga Breviolum sp., which provides insights into what roles the simple environmental responses can play in broader contexts, including symbiosis.

Results

To investigate the physiological effects of low pH, a characteristic environmental factor in symbioses, on algal intrinsic properties, a Symbiodiniaceae alga Breviolum sp. SSB01 (hereafter, Breviolum) was grown in a host-independent manner and cell proliferation and photosynthetic activities were measured (Figure 1—figure supplement 1). By comparing the growth rate of Breviolum in normal culture medium (pH 7.8) and acidic medium (pH 5.5, hereafter called ‘low pH’), we showed that the low pH medium considerably suppressed algal growth (Figure 1A) and the cells in low pH media were more spread out and less clustered than the cells in normal media (Figure 1B and C). In addition, culturing at low pH for 1 day resulted in significant declines in photosynthesis activity (Figure 1D).

Figure 1 with 2 supplements see all
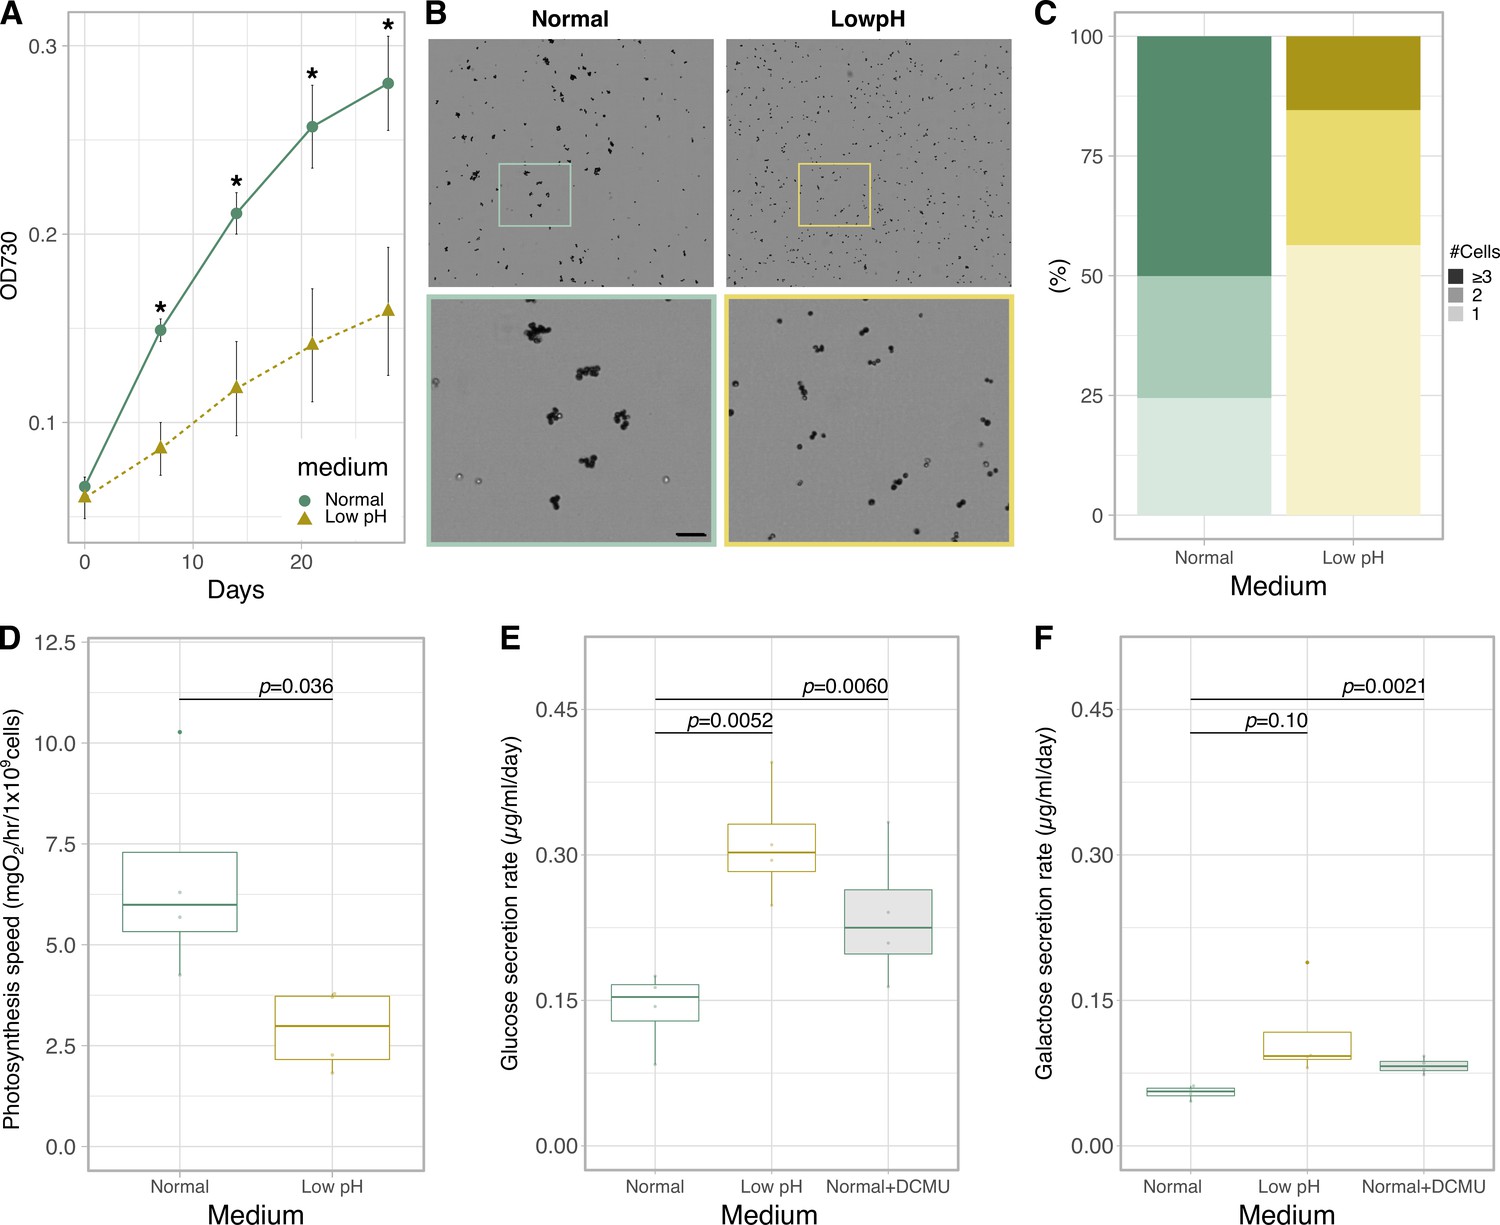
Physiological characterization and monosaccharide secretion of cultured Breviolum.

(A) Growth rate (n = 6 per treatment, t-test). Asterisks indicate statistically significant differences (t-test, p < 0.005). (B) Bright field images of the cells under different conditions. The lower panels show high-magnification views of boxed areas in the upper panels. Scale bar = 50 μm. (C) Quantification of the number of cells forming clusters (Fisher’s exact test for “1 or 2” vs “3 or more”, p = 1.727 × 10⁻⁷). (D) Photosynthesis activity (n = 4 per treatment, t-test) (E, F) Quantification of glucose (E) and galactose (F) secreted in normal, low pH and normal+DCMU media during incubation for 1 day using ion chromatography (n = 4 per treatment, t-test).

Contrary to our expectation, the amount of glucose secreted into the culture medium was higher at low pH (Figure 1E) and the secreted galactose similarly showed an increasing trend (Figure 1F). These trends suggest that Breviolum is capable of secreting monosaccharides autonomously without host signals, and that low pH enhanced the secretion. On the addition of the photosynthesis inhibitor 3-(3,4-dichlorophenyl)–1,1-dimethylurea (DCMU), the concentrations of glucose and galactose in the medium increased (Figure 1E and F, Figure 1—figure supplement 2), suggesting the presence of a pathway uncharacterized in previous studies, where the transport of newly fixed glucose, not glycerol, to the host sea anemone was blocked by DCMU addition (Burriesci et al., 2012).

To investigate the response of Breviolum to acidic environments at the morphological level, cells cultured in different media were examined by microscopy (Figure 1—figure supplement 1). Scanning electron microscope (SEM) observations revealed that many of the Breviolum cells cultured at low pH exhibited wrinkled structures on their cell surfaces (Figure 2A and B). Furthermore, transmission electron microscopy (TEM) revealed that the cell surface structures of the low pH media group were more ‘exfoliated’ (Figure 2C and D). These suggest that low pH affects the structures and properties of a cellulosic cell wall found in coccoid Symbiodiniaceae cells (Colley and Trench, 1983; Markell et al., 1992).

Figure 2 with 2 supplements see all
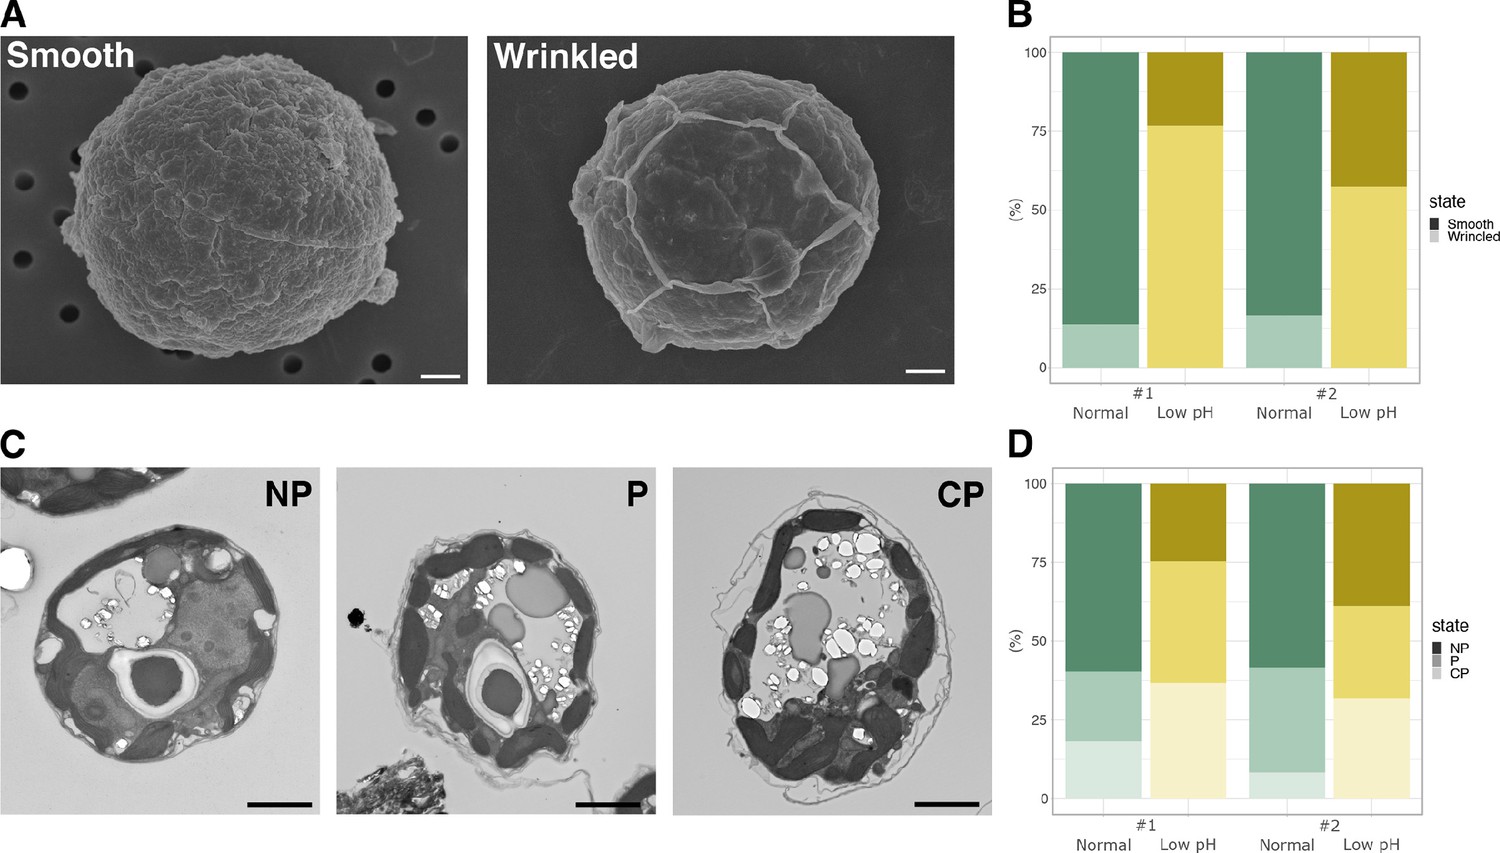
Cell structures under different pH condition.

(A) SEM images of the representative cells. Scale bar = 1 μm. (B) Quantification of the cell surface structures of the SEM images (Fisher’s exact test, #1; p < 2.2 × 10⁻¹⁶, #2; p < 2.2 × 10⁻¹⁶). (C) TEM images of the representative cells. NP, ‘non-peeled’ where the outer struc- ture of the cell wall is not shed from the cell surface; P, ‘peeled’ at some parts of the cell surface; CP, ‘completely peeled’. Scale bar = 2 μm. (D) Quantification of the cell surface structures of the TEM images (Fisher’s exact test for “P or CP” vs “NP”, #1; p = 4.621 × 10⁻¹¹, #2; p = 3.525 × 10⁻⁴).

To identify the mechanism involved in the monosaccharide secretion of Breviolum, we compared gene expression changes between the ‘control vs normal’ and ‘control vs low pH’ comparisons (Figure 1—figure supplement 1), and identified 3 and 4527 differentially expressed genes (DEGs), respectively (Figure 3A, Figure 3—source data 1). The gene ontology (GO) term enrichment and KEGG pathway analysis of these two gene sets resulted in the detection of 0 (control vs normal) and 16 (control vs low pH) terms (Figure 3—source data 2), which included categories related to carbon metabolism (Figure 3B, Figure 3—figure supplement 1). The CAZy database (Lombard et al., 2014) analysis showed that 12 DEGs (28 isoforms) were annotated with Carbohydrate-Active enZymes (CAZymes) activity (Figure 3—source data 3). One of the the gene models, TRINITY_DN40554_c2_g2, was shown to encode Glycoside Hydrolase Family 7 (GH7) endo-β–1,4-glucanase (exocrine cellulolytic enzyme) harbouring a signal peptide and a sequence motif called Carbohydrate-Binding Module Family 1 (CBM1) (Figure 3C) with high similarity to dinoflagellate cellulases (Kwok and Wong, 2010; Figure 3—figure supplement 2). Among four isoforms of this cellulase gene annotated as GH7, one lacked the N-terminal region including a signal peptide and CBM1 motif (labelled as ‘GH7 +CBM1' in Figure 3C), but the rest of the sequences were highly conserved at the amino acid level and only distinguished by small variations. Notably, this cellulase gene was detected as a DEG in the comparison between free-living and symbiotic algae using the published dataset (Figure 3—source data 1).

Figure 3 with 2 supplements see all
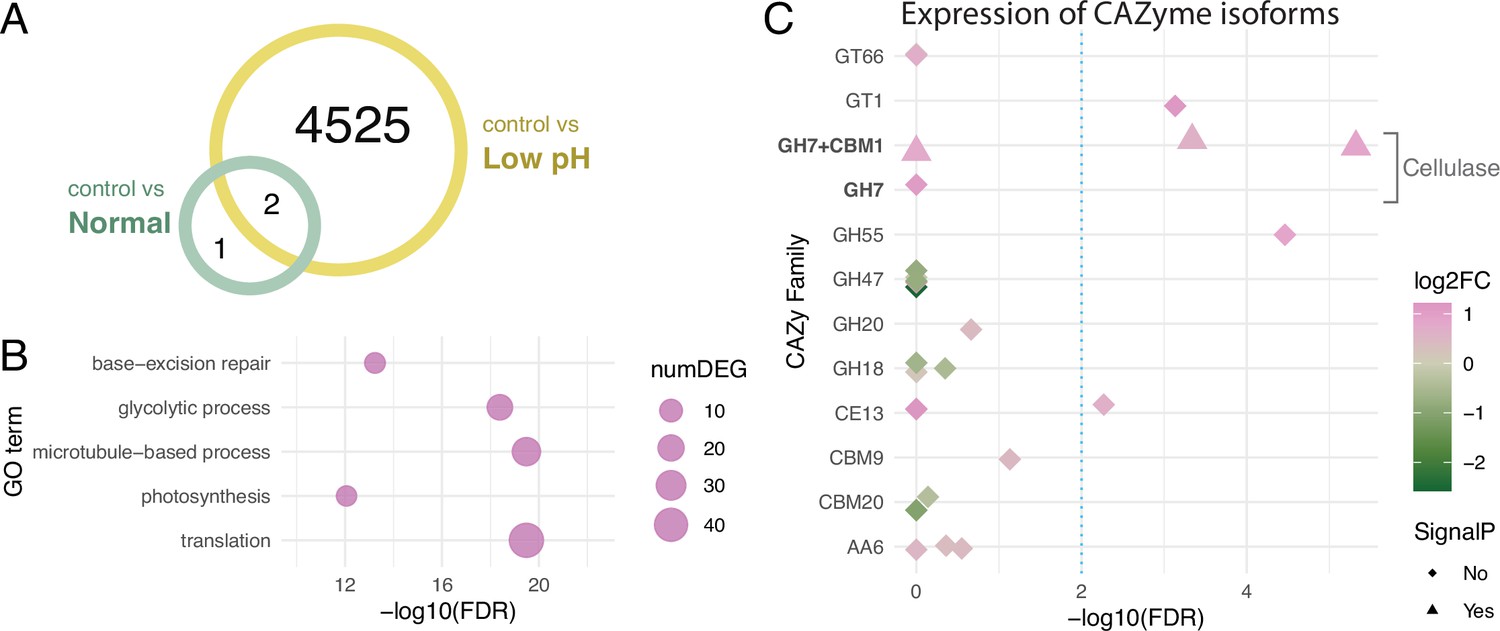
Differentially expressed genes under different pH conditions.

(A) Venn diagram showing the numbers of DEGs under different conditions. (B) GO term enrichment analysis. Circles indicate the statistical significance (FDR) of the enriched GO terms, with the numbers of DEGs (numDEG) associated with each GO term. (C) Isoform-level expression analysis of genes encoding Carbohydrate-Active enZymes (CAZymes). Symbols indicate isoforms associated with the DEGs, with the presence (triangle) or absence (rhombus) of signal peptide predicted in the amino acid sequence. Symbol colors represent the log2 fold-changes (log2FC) of the expression levels of each isoform (low pH/control). Dashed line indicates a threshold for differential expression (FDR = 0.01).

To confirm the effect of cellulase on monosaccharide secretion, we examined whether secretions were inhibited by the cellulase inhibitor Para-nitrophenyl 1-thio-beta-d-glucopyranosid (PSG) (Yoshida, 1995). Prior to examining this, we confirmed the inhibitory effect of PSG on cellulase activity in Breviolum cells in vitro. Although the cellulase activity in the cell supernatant was too low to be detected, PSG inhibited the cellulase activity in Breviolum cell homogenate in a concentration-dependent manner (Figure 4—figure supplement 1). Then, we examined the effect of PSG on the amount of glucose and galactose secreted in vivo using the cell cultures under low pH (Figure 1—figure supplement 1). PSG inhibited the secretion of both glucose and galactose in a dose-dependent manner (Figure 4), suggesting that degradation of the cell wall containing glucose and galactose by cellulase is involved in the secretion of monosaccharides from Breviolum cells.

Figure 4 with 1 supplement see all
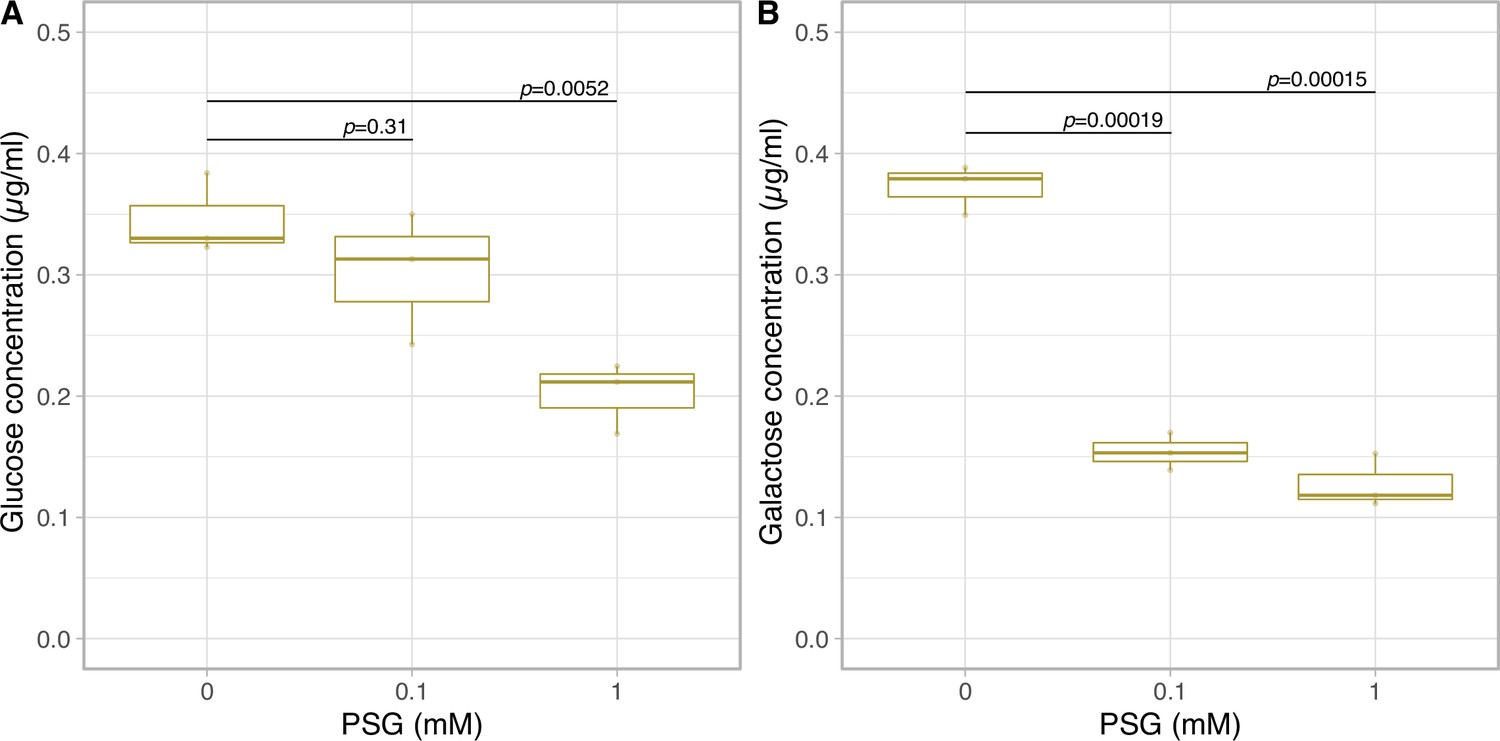
Glucose and galactose secretion in cellulase inhibitor treatment.

The quantification of glucose (A) and galactose (B) in the medium on 1 day incubation with PSG using LC-MS/MS (n = 3 per treatment, t-test).

Figure 4—source data 1

Raw data of glucose and galactose concentrations with PSG.

https://cdn.elifesciences.org/articles/80628/elife-80628-fig4-data1-v1.txt
Figure 4—source data 2

Raw data of cellulase activity in vitro.

https://cdn.elifesciences.org/articles/80628/elife-80628-fig4-data2-v1.txt

Discussion

The transfer of photosynthetically fixed carbon from symbiotic algae to host cnidarians, including corals, is a cornerstone of their mutual symbiotic relationship (Muscatine, 1990). Unlike the current accepted model of monosaccharide secretion that assumes photosynthetically fixed carbon is directly exported from the algal symbiont via unidentified glucose transporter(s) (Lehnert et al., 2014; Sproles et al., 2018), our results suggest that stored carbon can be released from the algal cell wall as an environmental response. In the present study, we showed that a decrease in ambient pH, consistent with the interior pH of the symbiosome, accelerates the monosaccharide secretion from Breviolum (Figure 1). Importantly, this low pH-associated secretion was suppressed by inhibition of cellulase (Figure 4), suggesting that algal symbionts release monosaccharides into the symbiosome within host cnidarian cells by cell wall degradation. Previous studies showed that cell wall degradation/rearrangement by cellulase is required for cell cycle progression (Kwok and Wong, 2010) and cellulose synthesis is involved in morphogenesis (Chan et al., 2019) in dinoflagellates. Indeed, wrinkle and exfoliation of the algal cell wall was observed under low pH conditions using SEM and TEM, respectively, suggesting that the cell walls are morphologically and qualitatively modified under low pH in Breviolum (Figure 2). We need to note that our results do not deny the current accepted model, but rather suggest a multi-pathway hypothesis supported by the following observations: (i) the secretion of monosaccharides was not completely inhibited by cellulase inhibition, (ii) this new pathway occurred in a day, compared to previous reports, where exported glucose was detectable in the host after only 30–60 mins (Burriesci et al., 2012), (iii) in contrast to previous studies (Burriesci et al., 2012), DCMU did not suppress, but rather increased the secretion of monosaccharides over a longer time span (Figure 1E and F). Importantly, low pH upregulated the expression of genes associated with not only cellulase (Figure 3) but glycolysis probably fuelled by degradation of storage compound like starch (Figure 3—figure supplement 1). This suggests the photosynthesis-limiting conditions trigger an environmental response in the algae to compensate for retarded cell cycle progression by upregulating multiple genes including the one encoding cellulase, accompanying cell wall degradation and monosaccharide secretion (or “leakage”).

Like Symbiodiniaceae, some freshwater green algae are known to be symbiotic with a range of hosts. A number of Chlorella strains, with and without symbiotic ability, autonomously secrete monosaccharides under low pH conditions via unknown mechanisms (Kessler et al., 1991; Mews and Smith, 1982). The monosaccharides include maltose and, to a lesser extent, glucose (Arriola et al., 2018). Some dinoflagellates are also known to secrete viscous substances, including monosaccharides, as an environmental response, likely for cell aggregation and biofilm formation (Kwok et al., 2023; Mandal et al., 2011). In this study, we show that Breviolum secrets galactose as well as glucose (Figure 1). Although the mechanism of action of galactose secretion is unknown, less substantial increase of galactose secretion under low pH (Figure 1) and the significant inhibitory effect of PSG (Figure 4) suggest that galactose secretion may be regulated by uncharacterized PSG-sensitive enzymes. Under low pH, multiple genes encoding CAZymes that break down glycosidic bonds (e.g. chitinase, hexosaminidase, mannosidase) were upregulated (Figure 3). The cell wall components of Symbiodiniaceae are unknown, but complex galactose-containing glycans that constitute the cell wall may be targets of these CAZymes. Overall, in microalgae, although the repertoire of molecular species secreted and the ecological consequences may vary, secretion of carbon as a form of saccharide appears to be a fairly conserved environmental response relevant to cell physiology and proliferation. Therefore, acidic symbiosomes may be of evolutionary advantage for cnidarian hosts to promote environmental responses of algal symbionts, which enables monosaccharides to be efficiently secreted within the organelle.

Generally, within ecosystems energy is transferred from photosynthetic primary producer to consumer by predation. Uniquely, in coral reef ecosystems energy is mainly transported from algae to corals after establishing a symbiotic relationship (Davy et al., 2012). Thus, understanding its mechanism has wider implications to understanding how energy is shared over the entire coral reef ecosystem. The multi-pathway hypothesis we propose here entails the direct transfer of photosynthates via glucose transporter(s) on their cell membrane (Lehnert et al., 2014; Sproles et al., 2018) as well as monosaccharide secretion following cell wall degradation. It remains to be determined how much each pathway contributes to the energy supply of host. However, since one pathway uses de novo photosynthates and the other uses stored photosynthates, combined they might allow for a stable supply of energy to the host, for example, over the entire light/dark day cycle, and under photosynthesis-limiting conditions like environmental stress or cloudy days where the cellulose-related pathway could be of substantial importance. Although genetic transformation and cell wall characterization of Symbiodiniaceae is still developing, the cellulase gene knock-out may bring a clue to test this (Chen et al., 2019; Gornik et al., 2022). Overall, our study provides a new insight into how carbon is provided by symbiotic algae to the coral reef ecosystem.

Materials and methods

Strains and culture conditions

Request a detailed protocol

We obtained the Breviolum (formerly Symbiodinium clade B) strain SSB01, an axenic uni-algal strain closely related to the genome-sequenced strain B. minutum Mf1.05b (clade B), as a generous gift from Profs. John R. Pringle and Arthur R. Grossman (Shoguchi et al., 2013; Xiang et al., 2013). The Breviolum was maintained according to previous study (Ishii et al., 2018). Stock cultures were incubated at 25°C in medium containing 33.5 g/L of Marine Broth (MB) (Difco Laboratories, New Jersey, USA), 250 mg/L of Daigo’s IMK Medium (Nihon Pharmaceutical, Japan), and PSN (Gibco, Thermo Fisher Scientific, Massachusetts, USA), with final concentrations of penicillin, streptomycin, and neomycin at 0.01, 0.01, and 0.02 mg/mL, respectively. Light was provided at an irradiance of approximately 100 µmol photons/m2s in a 12 hr light:12 h dark cycle. In experiments, IMK medium containing 33.5 g/L of sea salt (Sigma-Aldrich, Merck Millipore, Germany), 250 mg/L of Daigo’s IMK Medium, and PSN with final concentrations of penicillin, streptomycin, and neomycin at 0.01, 0.01, and 0.02 mg/mL, respectively, was used as normal medium (pH 7.8). For the low pH experiments, the pH was adjusted to 5.5 using HCl to make low pH medium (pH 5.5). Prior to measurements, Breviolum was pre-incubated in normal medium for one week unless otherwise specified (Figure 1—figure supplement 1). Breviolum was pre-incubated in normal medium for one week unless otherwise specified (Figure 1—figure supplement 1).

Growth rate, cell clumping and photosynthesis activity assay

Request a detailed protocol

Breviolum cultures were inoculated to fresh normal or low pH media for four weeks to measure growth rate (n=6 biological replicates). Growth rate comparisons between the normal and low pH media conditions were conducted using 100 µL of media (625 cells/µL) in a 96-well plate. Cell growth was monitored by measuring the optical density at 730 nm (OD730) of the liquid cultures using a Multiskan GO microplate spectrophotometer (Thermo Fisher Scientific, Massachusetts, USA) for once par week.

To compare the cell clumping conditions, Breviolum cultures were inoculated to fresh normal or low pH media for 3 weeks (12 hr light:12 hr dark). Breviolum cells were cultured starting at densities of 1.6×10⁷ cells/20 mL per T25 culture flask. Cell photos were taken using a TC20 automated cell counter (Bio-Rad Laboratories, Hercules, CA), and the numbers of cells adjacent to and isolated from other cells were randomly counted (853 and 664 cells pooled form n=3 biological replicates were scored in the normal and low pH conditions, respectively).

To measure photosynthesis activities, Breviolum cultures were inoculated to fresh normal or low pH media for 1 day (n=4 biological replicates). Photosynthesis and respiration rates were measured with a Clark-type oxygen electrode (Hansatech Instruments, Norfolk, UK) in a closed cuvette under light at 1,000 µmol/m2s photons at 25°C. The cultures were preincubated in the dark for 10 min and then exposed to saturating light for 20 min. Photosynthesis activities were determined using cultures at densities of 1×10⁶ cells/mL in fresh normal and low pH media, on days 0 and 1 after changing the medium. Respiration rates were calculated using the dark-phase oxygen consumption rates and photosynthesis rates were calculated by subtracting the respiration rates from the light-phase oxygen evolution rates. Mean estimates with standard errors were calculated from single measurements of four different cultures per medium condition.

Ion chromatography

Request a detailed protocol

Breviolum cultures were inoculated to fresh normal or low pH media for 1 day to measure the concentrations of monosaccharides. Breviolum cultures were incubated at densities of 8×10⁶ cells/20 mL in T25 culture flasks with a filter cap (TrueLine Cell Culture Flasks, TR6000) under a light-dark cycle. DCMU (Tokyo Chemical Industry, Japan) was dissolved in ethanol at the concentration of 20 mM and was added to cultures to a final concentration of 20 µM followed by 1 day incubation, while the control samples contained the same amount of ethanol. The cells cultured with and without DCMU for 1 day were removed by centrifugation at 2000×g for 5 min at room temperature. Samples (n=4 biological replicates) of the supernatant from the control (0 day), normal (1 day) and low pH (1 day) cultures were filtered using a 0.22 µm PVDF filter (Merck Millipore, Germany). These samples were loaded onto an OnGuard column (Dionex OnGuard II Ba/Ag/H 2.5 cc Cartridge) (Thermo Fisher Scientific) to remove the sulphate and halogen, according to the manufacturer’s instructions. The samples were quantified using high-performance anion-exchange chromatography with pulsed amperometric detection (HPAEC-PAD) using a Dionex ICS-5000 system equipped with a CarboPac PA1 column (Dionex) (Shinohara et al., 2017). The column was operated at a flow rate of 1.1 mL/min with the following phases: (1) a linear gradient of 0–100 mM NaOH from 0 to 31 min, (2) a linear gradient of 0–150 mM sodium acetate containing 100 mM NaOH from 31 to 34 min, and (3) an isocratic 150 mM sodium acetate/100 mM NaOH from 34 to 41 min. Myo-inositol (2 µg/mL) was added to each sample as an internal standard for quantification.

The concentrations of monosaccharides were calculated by comparing the peak ratios between the targets of interest and standards. The secretion rates were calculated by subtracting the concentrations on 0 day from those of 1 day.

Electron microscopy

Request a detailed protocol

Breviolum cultures were inoculated to fresh normal or low pH media for 1 day to examine morphological change. Breviolum cultures were incubated at densities of 8×10⁶ cells/20 mL in T25 culture flasks with a filter cap (TrueLine Cell Culture Flasks, TR6000) under a light-dark cycle. For SEM observation, cells were fixed in 2% glutaraldehyde and 2% osmium (VIII) oxide, dehydrated with ethanol, and dried using the critical point drying technique. The samples were coated with osmium plasma and observed under a JSM-7500F microscope at 5 kV (Hanaichi UltraStructure Research Institute, Japan). The surface patterns of the cells were manually scored and classified as ‘Smooth’ or ‘Wrinkled’ (73 and 129 cells pooled form n=4–5 technical replicates in each of biological replicates (n=2) were blindly scored under the normal and low pH conditions, respectively). For TEM observation, cells were fixed in 2% glutaraldehyde and 2% osmium (VIII) oxide, dehydrated with ethanol and embedded in EPON812 polymerized with epoxy resin. Sections 80–90 nm thick were cut, coated with evaporated carbon for stabilisation, and stained with uranyl acetate and lead citrate. The sections were then imaged at 100 kV using a HITACHI H-7600 transmission electron microscope (Hanaichi UltraStructure Research Institute, Japan). The cells were then categorized as NP (non-peeled), P (peeled) or CP (completely-peeled) (cells from two pairs of biological replicates under normal and low pH conditions, pooled form n=10 technical replicates for each, were blindly scored).

RNA extraction and sequencing

Request a detailed protocol

After pre-incubated in normal media for one week, Breviolum cultures were inoculated to fresh normal or low pH IMK media for 1 day to examine the transcriptional change. Breviolum cultures were incubated at densities of 8×10⁶ cells/20 mL in T25 culture flasks with a filter cap (TrueLine Cell Culture Flasks, TR6000) under a light-dark cycle. The cultured cells were collected by centrifugation at 2000×g for 5 min at room temperature. Four samples (n=4 biological replicates) from each of the control (day 0), normal (day 1), or low pH (day 1) cultures were added to 500 µL of TRIZOL reagent (Thermo Fisher Scientific, Massachusetts, USA) and stored at –80°C. The samples were ground with two sizes of glass beads (20 µL volume each of ‘≤106 µm’ and ‘425–600 µm’) (Sigma-Aldrich, Merck Millipore, Germany) using a vortex mixer and performing 5 cycles of freezing and thawing with a –80°C freezer. RNA extraction with TRIZOL reagent and a high salt solution for precipitation (plant) (Takara Bio, Japan) was conducted according to the manufacturer’s instructions. The quality and quantity of the RNA was verified using an Agilent RNA 6000 Nano Kit on an Agilent Bioanalyzer (Agilent Technologies, California, USA) and a Nanodrop spectrophotometer (Thermo Fisher Scientific, Massachusetts, USA), respectively. Total RNA samples were subjected to library preparation using an NEB Next Ultra RNA Library Prep Kit (New England Biolabs, Ipswich, MA, USA) according to the manufacturer’s protocol (NEB #E7530). These mRNA libraries were sequenced in an Illumina NovaSeq6000 (S2 flow cell) in dual flow cell mode with 150-mer paired-end sequences (Filgen Inc, Japan). The raw read data were submitted to DDBJ/EMBL-EBI/GenBank under the BioProject accession number PRJDB12295.

Transcriptome analysis

Request a detailed protocol

A total of 12 libraries were obtained, trimmed, and filtered using the trimmomatic option (ILLUMINACLIP:TruSeq3-PE.fa:2:30:10 LEADING:5 TRAILING:5 SLIDINGWINDOW:4:5 MINLEN:25) of the Trinity program. Paired output reads were used for analysis, and de novo assembly was performed using the Trinity program (Grabherr et al., 2011) to obtain the transcript sequences. The reads from each library were mapped onto the de novo assembly sequences and read count data, and the transcripts per million (TPM) were calculated using RSEM (Li and Dewey, 2011) with bowtie2 (Langmead and Salzberg, 2012).

In this study, RNA-seq produced 550,711,174 reads from the 12 samples (four independent culture flasks under three conditions), yielding 239,047 contigs by de novo assembly using Trinity. The total number of mapped reads of the quadruplicates in the de novo assembled transcriptome dataset were 77,160,394 reads for samples taken before medium change (labelled as ‘control’), 74,594,446 for the normal pH culture condition (labelled as ‘normal’), and 73,882,605 for the low pH culture condition (labelled as ‘lowpH’). Overall, we obtained the count values of the genes in the transcriptome dataset under the three conditions.

Differential gene expression analysis was conducted using the count data as inputs for the R package TCC (Sun et al., 2013) to compare the tag count data with robust normalization strategies, with an option using edgeR (Robinson et al., 2010) to detect differential expressions implemented in TCC. To identify the DEGs, a false discovery rate (FDR, or q-value) of 0.01, was used as the cutoff.

To annotate the de novo transcript sequences, BLASTp search was performed (E-value cutoff, 10–4) against the GenBank nr database using all the transcript sequences as queries, resulting in 51,833 orthologs. Gene ontology (GO) term annotation of the de novo transcript sequences was performed using InterProScan (Jones et al., 2014) ver 5.42–78.0, resulting in 7,336 genes with GO terms. GO term enrichment analysis was performed using the GOseq (Young et al., 2010) package in R. Overrepresented p-values produced by GOseq were adjusted using the Benjamini-Hochberg correction (Benjamini and Hochberg, 1995). An adjusted p-value (q-value) of 0.05, was used to define enriched GO terms. In the KEGG pathway analysis, the ortholog protein sequence obtained via BLASTp search of the DEGs was used as a query. Additionally, KOID was added by blastKOALA (Kanehisa et al., 2016) (https://www.kegg.jp/blastkoala/) and mapped to the KEGG pathway using KEGmappar (Kanehisa and Sato, 2020) (https://www.genome.jp/kegg/mapper.html). For ‘CAZymes in a genome’ (CAZome) analysis, all isoform sequences of the DEGs were analysed using CAZy (Lombard et al., 2014) (http://www.cazy.org/). For visualization purpose, two outliers TRINITY_DN38357_c4_g1_i9 and TRINITY_DN40801_c4_g1_i5 showing very low expression are not presented in Figure 3C.

To compare our results with a previous study using free-living and symbiotic algae (Xiang et al., 2020), data were downloaded from NCBI (https://trace.ncbi.nlm.nih.gov; accessions are SRR10578483 and SRR10578484) and analysed in the same way as described earlier. Briefly, expression levels were calculated by RSEM using the de novo assembled references generated in this study, and differential expressed genes were identified by TCC with FDR of 0.01 as the cutoff.

Cellulase inhibition experiment in vitro

Request a detailed protocol

After pre-incubated in normal IMK media for more than one week, Breviolum cells were incubated in fresh normal media for 1 day at densities of 4.3x10⁷ cells/20 ml per T25 culture flask with a filter cap (TrueLine Cell Culture Flasks, TR6000). The cells were collected by centrifuging 8 ml of culture medium and ground with two sizes of glass beads (5 and 30 µL volume of ‘≤106 µm’ and ‘425–600 µm’, respectively) (Sigma-Aldrich, Merck Millipore, Germany) in 200 µl Reaction buffer (Cellulase Activity Assay kit, Abcam, UK) using a vortex for 5 min. The homogenates were centrifuged (10,000 g at 4°C for 10 min) to collect the supernatants. The supernatants were diluted five times with Reaction buffer and used for measuring cellulase activity. PSG (Biosynth Ltd., United Kingdom) was added to reach a final concentration of 10 and 1 mM. Cellulase activity was conducted according to the manufacturer’s instruction (Cellulase Activity Assay kit, Abcam, the UK), using a microplate reader (SH-9000Lab, Hitachi High-Tech Co., Japan) for measurement.

Cellulase inhibition experiment in vivo

Request a detailed protocol

After pre-incubated in normal IMK media for more than one week, Breviolum cells were inoculated to fresh low pH media containing 0, 0.1, and 1 mM PSG (Biosynth Ltd., United Kingdom) for 1 day to examine the effect of cellulase inhibitor in monosaccharide secretion. The cells were incubated at densities of 4×10⁶ cells/ml in a 24well plates (n=4 biological replicates for each condition). The supernatant from each culture was collected following centrifugation at 2000×g for 2 min at room temperature and filtered using a 0.22 µm PVDF filter (Merck Millipore, Germany).

Glucose and galactose were quantified using a LC–MS/MS system in which a Shimadzu UPLC system (Shimadzu, Kyoto, Japan) was interfaced to an AB Sciex qTrap 5500 mass spectrometer equipped with an electrospray ionization source (AB SCIEX, Foster, CA, USA). A UK-Amino column (3 µm, 2.1 mm × 250 mm, Imtakt Corporation, Kyoto, Japan) was applied for analysis. Mobile phase A is 0.1% formic acid, and mobile phase B is acetonitrile. Samples (1 μl) were injected and analyzed over a gradient of: 0–0.5 min 95% buffer B (isocratic); 0.5–10 min 85% buffer B (linearly decreasing); 10–15 min 40% buffer B (linear decreasing). The column was equilibrated for 5 min before each sample injection. The flow rate was 0.3 ml/min. Under these analytical conditions, the retention times for glucose and galactose were 11.6 and 10.9 minutes, respectively. Mass spectrometric analysis employed electrospray ionization in the negative mode with multiple reaction monitoring (MRM) at the transitions of m/z 179→89 for glucose and galactose. The optimized MS parameters were as follows: ion spray voltage (–4500 V), declustering potential (–90 V), entrance potential (–10 V), collision energy (–12 V), collision exit potential (–11 V), collision gas (N2 gas) and nebulizer temperature (450°C). Raw data was analyzed using MultiQuant software (AB SCIEX, Foster, CA, USA). Concentrations of monosaccharides were calculated by comparing the peak ratios between the targets of interest and standards.

Data availability

The raw read data were submitted to DDBJ/EMBL-EBI/GenBank under the BioProject accession number PRJDB12295.To compare our results with a previous study using free-living and symbiotic algae (Xiang et al., 2020), data were downloaded from NCBI (https://trace.ncbi.nlm.nih.gov; accessions are SRR10578483 and SRR10578484) .

The following data sets were generated
    1. Ishii Y
    2. Maruyama S
    (2023) DDBJ Sequence Read Archive (DRA)
    ID PRJDB12295. Environmental pH signals the release of monosaccharides from cell wall in coral symbiotic alga.
The following previously published data sets were used
    1. Carnegie Institution for Science
    (2019) NCBI Sequence Read Archive
    ID SRR10578483. RNA-Seq of Breviolum minutum SSB01: free-living.
    1. Carnegie Institution for Science
    (2019) NCBI Sequence Read Archive
    ID SRR10578484. RNA-Seq of Breviolum minutum SSB01: symbiotic.

References

    1. Kessler E
    2. Kauer G
    3. Rahat M
    (1991) Excretion of sugars by chlorella species capable and incapable of symbiosis with Hydra viridis
    Botanica Acta: Berichte Der Deutschen Botanischen Gesellschaft = Journal of the German Botanical Society 104:58–63.
    https://doi.org/10.1111/j.1438-8677.1991.tb00194.x
    1. Markell D
    2. Trench RK
    3. Iglesias-Prieto R
    (1992)
    Macromolecules associated with the cell walls of symbiotic dinoflagellates
    Symbiosis 12:19–31.
    1. Muscatine L
    (1990)
    The role of symbiotic algae in carbon and energy flux in reef corals
    Coral Reefs 25:75–87.

Decision letter

  1. Kristin Tessmar-Raible
    Reviewing Editor; University of Vienna, Austria
  2. Meredith C Schuman
    Senior Editor; University of Zurich, Switzerland

Our editorial process produces two outputs: (i) public reviews designed to be posted alongside the preprint for the benefit of readers; (ii) feedback on the manuscript for the authors, including requests for revisions, shown below. We also include an acceptance summary that explains what the editors found interesting or important about the work.

Decision letter after peer review:

Thank you for submitting your article "Environmental pH signals the release of monosaccharides from cell wall in coral symbiotic alga" for consideration by eLife. Your article has been reviewed by 2 peer reviewers, and the evaluation has been overseen by a Reviewing Editor and Meredith Schuman as the Senior Editor. The reviewers have opted to remain anonymous.

The reviewers have discussed their reviews with one another, and the Reviewing Editor has drafted this to help you prepare a revised submission.

The reviewers and editors agree that your suggested mechanism of sugar secretion of coral symbionts, based on the upregulation and action of cellulases at low pH, is highly interesting and novel. However, we also agree that several important experiments are missing to sufficiently support this hypothesis. Below, we summarize three essential points which must be addressed in your revision. Furthermore, although not essential, please also consider the additional points raised by each of the two reviewers, as these are generally constructive and will likely help to improve your manuscript.

Essential revisions:

1. There is a substantial time difference between the measurements of glucose/galactose and transcriptomics (one day) versus cell wall morphology (three weeks). The prediction would be that the low pH results in increased carbohydrate release via changes in the cell wall morphology, and that the transcript regulation is connected to this. However, this connection is missing and should be better addressed. One possible approach could be to conduct a targeted analysis of gene expression with e.g. qPCR, and measurements of glucose/galactose over time, at steady-state conditions of the acidic environment for a time frame of two-three weeks.

This would also address the concern that any change in carbohydrate release and transcript changes is an acute "shock" response and not specifically connected to the low pH conditions.

2. Another critical experiment addresses the action of the cellulase at low pH. The data show that in algae cultures at low pH, more monosaccharides are present in the media; and that at normal pH plus PSG cellulase inhibitor, fewer monosaccharides are present in the medium. However, the final link is missing. One way to address this would be measuring monosaccharide production at low pH before and after the addition of the PSG inhibitor at varying concentrations.

3. Inhibitor specificity: Chemical interference with biological processes is always very useful and much acknowledged. However, it is also always connected with the concern of unwanted/undetected side effects.

Please address this concern more rigorously (either by additional arguments or experimental data) for the putative cellulase inhibitor PSG, considering questions such as:

What is the evidence that PSG inhibits cellulases, and more specifically, dinoflagellate cellulases (in particular GH7 cellulase)? Is the IC50 known? Is it known whether PSG can affect other enzymes at the concentrations tested (0.1 and 1 mM)? What can be said about the specific mode of action of PSG? Could it also affect other enzymes, like the CAZymes in Figure 3C? The latter question could be addressed by comparing the site and mode of action of the drug across the amino acid sequences of the potential cellulase/CAZyme targets.

Reviewer #1 (Recommendations for the authors):

Introduction

– The Introduction is very short and lacks information that is essential for interpreting the study. For example, what is the role of cellulases and their relation to the cell wall? What is known about cellulases in dinoflagellates? As far as know, cellulose is a polymer of β-glucose, so why was galactose predicted to be present in the culture medium, and affected by the PSG treatment?

– A few papers have reported the effect of pH on algal growth in vitro, and should be discussed (e.g. Smith and Muscatine (1999) Marine Biology 134:405-418).

Methods/Results

– More details are needed regarding drug additions and preparations. And some of the info is present throughout the text or figures, but they should be consolidated in the Methods for clarity. For example:

– DCMU was dissolved in ethanol, not DMSO. Potentially, ethanol could have toxic effects or be metabolized and incorporated into the TCA cycle. Was the control treatment also supplemented with ethanol at an equal concentration to that of the DCMU treatment?

– Figure 1-supp1 reports that glucose/galactose in the media was measured after 1 day after DCMU addition. This info should also be reported in Methods.

– Line 81: Burriesci 2012 saw that the transport of newly fixed glucose to the host was stopped with DCMU addition. Additionally, they found specific differences in the secretion of glucose vs. glycerol between free-living algae and those undergoing symbiosis. These are important differences that should be described in more detail in relation to the current study (which only used cultured free-living algae).

– Figure 2: define P, CP, NP

– Figure 2C: Since these are free-living dinoflagellates, they should have a flagellum; however, it is not visible in these images. This raises concerns about the effectiveness of the fixative, or whether these cells really reflect free-living algae.

– Figure 2E/F: these results should be discussed in more detail in the main text. In the figure, further annotation should be provided to illustrate the features of importance of the NP (non-peeled), P (peeled), or CP (completely peeled) morphologies. Is there any relationship between the SEM and TEM observations? (i.e. NP-P-CP vs smooth-wrinkled).

– The Methods state that "73 and 129 cells pooled form n = 4 technical replicates". This would mean that N=1, which would not be acceptable. Please clarify.

– Please show more images of the different morphologies, either in the main manuscript or as supplemental material.

– Figure 3: define "CAZymes" in legend.

– 12 carbohydrate-active enzymes are differentially expressed after 1 day in low pH media yet only cellulase is examined or elaborated upon. Discussion of the others is warranted. Is this pattern maintained after 3 weeks?

– Please provide a list of the other genes that are differentially regulated, and compare it to published transcriptomic analyses or other data from free-living and symbiotic algae.

Discussion

– The major assumption of this study is that the incubations at low pH mimic Breviolum inside the coral symbiosome during symbiosis. However, the majority of the Low pH incubations lasted for only 1 day, and only the morphology observations occurred after 3 weeks.

– For example, Line 128: claims that "this pathway occurred over days". However, most of the experiments involved a 1-day incubation in Low pH, whereas Burriesci et al. 2012 were done using isotopes in established Aiptasia symbiosis.

– Line 133-135: this statement is not supported by the growth data shown in Figure 1A which is slowed under low pH. Maybe the authors mean "inhibit cell proliferation"? In this case, this claim should be tested by inhibiting cellulase in Low pH media and measuring growth rate. It would also be interesting to see the effect of cellulase inhibitors on cell morphology.

– Line 144-146: in my opinion (which matches that of many experts) is that the symbiosome derives from lysosomes and/or phagosomes, which are acidic. It is true that their acidic nature seems to have important implications for symbiosis (e.g. Tang. Front. Microbiol. 6, 816 (2015), but this is very different from "acidifying symbiosomes" being an evolutionary response for algal symbiosis).

Other/General

– What are the dissolved inorganic carbon (DIC) levels in each condition? This is important because pH was adjusted with HCl, which would result in the formation of CO2 that would bubble off resulting in decreased DIC availability for photosynthesis.

– Check all figure legends and axes titles for typos, missing information, and undefined abbreviations.

– I presume the culture media contains vitamins, nitrate, and other compounds that promote algal growth but do not match the conditions found in seawater. This means that the Control cells do not truly reflect free-living algae, which has important consequences for the interpretation of the results and their significance.

Reviewer #2 (Recommendations for the authors):

(1) The data on CAZymes and their connection to the narrative of cellulose breakdown and monosaccharide release is very interesting, as the transcriptomics experiment shows the significant upregulation upon low pH of cellulase with a signal peptide (Figure 3). Also intriguing is that the various genes and isoforms display markedly different levels of gene expression changes, both in extent and direction. However, more information about the cellulases is needed for the reader to place these results in context to understand the biology of these molecules, particularly the action and specificity of these enzymes. First, no explicit connection is made between the Trinity ID in the main text and the cellulase gene and isoform labels shown in Figure 3C, although presumably based on context, GH7+CBM1 is the TRINITY_DN40554_c2_g2, so this can be improved by better labeling. Second, the interpretation would benefit from the brief inclusion of information about what distinguishes the various isoforms of these genes, including whether the active sites are conserved or divergent. Finally, related to the CAZymes but on another aspect: are these genes and cellulases found in any other studies of steady-state symbiosis? If this is a common pathway in coral-algal symbiosis, it would likely be present in at least some of the many publicly available datasets of symbiotic algae in hospite, even specifically Breviolum minutum. Therefore, it would be helpful to the reader and to the broader field to place these results in the broader context by outlining connections to the existing literature on these symbiotic systems.

(2) The Discussion mentions several times a connection to cell cycle progression (Line 122). The text states that "photosynthesis-limiting conditions trigger an environmental response in the algae to sustain cell proliferation, through cell cycle progression by cellulase, accompanying cell wall degradation and monosaccharide secretion" (Lines 133-135), as well as a mechanism of "secretion of monosaccharides … to compensate for retarded cell cycle progression" (Line 142-144). However, the 24 hr timepoint is substantially less than the doubling time of the algae, in particular in the low pH medium (Figure 1A), so it would seem there has been little cell division when these cellulases are mobilized at that time point. This claim should be better connected to and substantiated by the data presented.

(3) The cell aggregation results are an interesting phenotype observed, and lead the reader to ask: how does the decreased cell clumping seen in low pH (Figure 2A-B) fit with the concurrent higher monosaccharide secretion (Figure 1), when other bodies of research have suggested that increased monosaccharide secretion contributes to increased cell aggregation (Lines 141-142)?

(4) The data presented in Figure 1 show sugars "secreted", which is described in the Methods as being calculated from the differences in concentration in the media between 24hr vs. 0hr after exposure (Line 204-205). In contrast, the data presented in Figure 4 show the sugar "concentration" in the medium, without the calculation. These varying presentations of the same type of data can be initially confusing, especially when considering how different the baseline sugar concentrations are between the experiments (Figure 4 '0 mM PSG' condition vs. Figure 1 'normal' condition). This could be clarified by showing the raw data of monosaccharide concentrations in all cases, to allow for ease of interpretation, particularly across experiments. Further help to the reader would be to include in the legends that the data in Figure 1 is from ion chromatography and the data from Figure 4 is from LC-MS/MS, which may account for some differences in baseline sugar concentration across these experiments.

(5) While the experiments are excellently described in thorough detail to allow repetition, to fully understand the experimental design required flipping between the Results, Figure Legends, and various sections of the Methods to get a detailed overview of exactly how the experiments were conducted. Thus, the manuscript would greatly benefit from a schematic of the experimental design, perhaps as a small panel in Figure 1. It would be very helpful to show that the algae were grown in rich media, passaged to minimal media IMK for 1 week, then put in the two different pH media and collected after 24 hr (or 3 weeks).

(6) Line 81 and Figure 1: please move the Supp. Figure S1 to be a panel in the main figure. It shows an exciting and important main aspect of the work, and the baseline 'normal' data is the same between figures, as the authors point out.

(7) Lines 158-159: while a knockdown of cellulase would indeed be powerful, the PSG inhibitor here presumably accomplishes the same.

(8) Figure 2: include in the figure or legend the definitions of NP, P, and CP.

(9) Figure 3C:

– The use of asterisks to indicate isoforms is confusing, as this symbol is most commonly used to indicate statistical significance. Use bolding or boxing or some other clear way to highlight these two genes/isoforms as being of particular interest.

– Legend: state here clearly and succinctly the definitions of control, normal, and low pH, as well as the time point of collection.

– Add a title across the graph, e.g. "expression of CAZy isoforms in low pH".

– The expression is by logFC, not log2FC? The color scale, therefore, masks quite a large range of expression differences, especially the potential differences in upregulation of the key cellulase isoforms (all are orange, which according to the key is logFC from 0.0 to 2.5, a large range). Also, the colors of the data points don't match the scale in tone, requiring extra work to match these up. Readability would be greatly improved if the scale was changed to log2FC with a more fine-scale gradation of expression levels, to better highlight the interesting differences in gene expression.

– According to the Methods, the DEGs in the transcriptome analysis were chosen by FDR cutoff of 0.01, but several of these CAZymes fall above that threshold yet are still referred to as DEGs. Further clarification would help the reader.

https://doi.org/10.7554/eLife.80628.sa1

Author response

Essential revisions:

1. There is a substantial time difference between the measurements of glucose/galactose and transcriptomics (one day) versus cell wall morphology (three weeks). The prediction would be that the low pH results in increased carbohydrate release via changes in the cell wall morphology, and that the transcript regulation is connected to this. However, this connection is missing and should be better addressed. One possible approach could be to conduct a targeted analysis of gene expression with e.g. qPCR, and measurements of glucose/galactose over time, at steady-state conditions of the acidic environment for a time frame of two-three weeks.

This would also address the concern that any change in carbohydrate release and transcript changes is an acute "shock" response and not specifically connected to the low pH conditions.

We appreciate your critical comments. We apologize that the Materials and methods in our previous manuscript was not comprehensible enough and have revised the section to clarify the followings. First, cell wall morphology analyses by SEM and TEM were done at day 1, not three weeks, after the medium change. Only exceptionally, cell growth and cell clumping examinations took three weeks. Please see Figure 1—figure supplement 1 for schematic representation of the methods. Second, acute “shock” responses on the glucose and galactose secretion were observed at day 0 in the sample “Low pH” or “Normal +DCMU”, presumably due to the shock by medium change procedures or components in new media. However, the differences in the amounts of monosaccharides by these “acute” shocks were not substantial (Figure 1—figure supplement 2). Third, we added new data (Figure 4—figure supplement 1) to examine the effect of the cellulase inhibitor PSG on cellulase enzyme activity, which connects low pH signals, cellulase gene expression, enzyme activity, and monosaccharide secretion. Collectively, we believe that the revised version of the manuscript was better constructed and demonstrated more clearly the connections between carbohydrate release and transcript changes.

2. Another critical experiment addresses the action of the cellulase at low pH. The data show that in algae cultures at low pH, more monosaccharides are present in the media; and that at normal pH plus PSG cellulase inhibitor, fewer monosaccharides are present in the medium. However, the final link is missing. One way to address this would be measuring monosaccharide production at low pH before and after the addition of the PSG inhibitor at varying concentrations.

We sincerely apologize the confusion that our previous manuscript may have made. In the previous and current manuscripts, we measured monosaccharide release at low pH, not normal, with the addition of the inhibitor PSG at varying concentrations, as you suggested. To make it clearer, we revised the whole Materials and methods section, which now shows the link between pH effect, PSG action, and cellulase activity.

3. Inhibitor specificity: Chemical interference with biological processes is always very useful and much acknowledged. However, it is also always connected with the concern of unwanted/undetected side effects.

Please address this concern more rigorously (either by additional arguments or experimental data) for the putative cellulase inhibitor PSG, considering questions such as:

What is the evidence that PSG inhibits cellulases, and more specifically, dinoflagellate cellulases (in particular GH7 cellulase)? Is the IC50 known? Is it known whether PSG can affect other enzymes at the concentrations tested (0.1 and 1 mM)? What can be said about the specific mode of action of PSG? Could it also affect other enzymes, like the CAZymes in Figure 3C? The latter question could be addressed by comparing the site and mode of action of the drug across the amino acid sequences of the potential cellulase/CAZyme targets.

To our knowledge, there have been no specific molecular mechanisms of cellulase inhibitors reported so far. PSG is a sugar analog and was used as a potent inhibitor of β-glucosidase in a previous study (Yoshida 1995 Plant Cell Reports) and references therein. Yoshida (1995), now cited in the revised manuscript, showed that 10 mM PSG inhibited cellulases, β-glucosidases, and α-arabinosidases in rice, suggesting that other types of enzymes and cellulases in other species could be targets of PSG in similar concentration ranges. In general, CAZyme activities and targets are difficult to predict by sequence similarity due to high divergence in sequences and have been little biochemically studied so far, thus we believe that the effects of PSG on other enzymes can be very interesting subjects of future studies.

To gain insights into dinoflagellate cellulase activities, we conducted in vitro assays to show that PSG inhibits cellulase activity in the whole cells, not selectively secreted enzymes in Figure 4—figure supplement 1, in the revised manuscript. We used the whole cell partly because secreted cellulase activities were very low and under detection limits. Although this does not necessarily indicate that PSG specifically inhibits dinoflagellate GH7 cellulases which we featured in the manuscript, our data showed that dinoflagellate cellulase activities and the inhibitory effects by PSG could be quantitatively measured.

Reviewer #1 (Recommendations for the authors):

Introduction

– The Introduction is very short and lacks information that is essential for interpreting the study. For example, what is the role of cellulases and their relation to the cell wall? What is known about cellulases in dinoflagellates? As far as know, cellulose is a polymer of β-glucose, so why was galactose predicted to be present in the culture medium, and affected by the PSG treatment?

We appreciate the helpful comments from Reviewer 1. We revised the Introduction section to state that cellulases are critical to maintain cell cycle progression in dinoflagellates and cited relevant references. We also added information on cellulases in dinoflagellates in the Discussion section, as follows:

Line 148 in the revised manuscript:

“Previous studies showed that cell wall degradation/rearrangement by cellulase is required for cell cycle progression (Kwok and Wong, 2010) and cellulose synthesis is involved in morphogenesis (Chan et al., 2019) in dinoflagellates.”

Regarding galactose, detection of galactose secreted in the media was a big surprise to us. To our knowledge, while it is generally accepted that dinoflagellate cell walls contain cellulose, there have been no studies which clarified the molecular details and the whole diversity of glycan families compositing dinoflagellate cell walls. In addition, cellulose is a polymer of glucose as you suggested, but not the only target of cellulases. Now we directly confirmed that PSG inhibited cellulase enzyme activity in vitro, suggesting that galactose secretion and cellulase activity are at least correlated. Although it is unknown how galactose secretion is increased in low pH, one plausible explanation is that the cell wall contains complex galactose-containing glycans and that cellulase degrades main glucan chain to make galactose residues accessible to other CAZymes. Now we discussed this in the revised manuscript:

Line 170:

“In this study, we show that Breviolum secrets galactose as well as glucose (Figure 1). Although the mechanism of action of galactose secretion is unknown, less substantial increase of galactose secretion under low pH (Figure 1) and the significant inhibitory effect of PSG (Figure 4) suggest that galactose secretion may be regulated by uncharacterized PSG-sensitive enzymes. Under low pH, multiple upregulated genes encoding CAZymes that break down glycosidic bonds (e.g. chitinase, hexosaminidase, mannosidase) were detected (Figure 3). The cell wall components of Symbiodiniaceae are unknown, but complex galactose-containing glycans that constitute the cell wall may be targets of these CAZymes.”

– A few papers have reported the effect of pH on algal growth in vitro, and should be discussed (e.g. Smith and Muscatine (1999) Marine Biology 134:405-418).

We appreciate the comment. Unfortunately, we could not find previous papers specifically reporting the effect of pH, including Smith and Muscatine 1999, as basically they detected or discussed the effect of molecules which were supposed to affect the pH (e.g. nitrogen compounds, CO2, amino acids). Simple ingredients can affect not only pH but also physiology as a whole and the interpretation of the effects is very complex, so that these studies are beyond the scope of this study.

Methods/Results

– More details are needed regarding drug additions and preparations. And some of the info is present throughout the text or figures, but they should be consolidated in the Methods for clarity. For example:

– DCMU was dissolved in ethanol, not DMSO. Potentially, ethanol could have toxic effects or be metabolized and incorporated into the TCA cycle. Was the control treatment also supplemented with ethanol at an equal concentration to that of the DCMU treatment?

We understand your concerns and thoroughly revised the Methods section. Regarding DCMU, we added the same concentration of ethanol in the control samples, as you pointed out, and described this in the Methods, Line 245.

– Figure 1-supp1 reports that glucose/galactose in the media was measured after 1 day after DCMU addition. This info should also be reported in Methods.

We appended the information in the Methods, Line 248.

– Line 81: Burriesci 2012 saw that the transport of newly fixed glucose to the host was stopped with DCMU addition. Additionally, they found specific differences in the secretion of glucose vs. glycerol between free-living algae and those undergoing symbiosis. These are important differences that should be described in more detail in relation to the current study (which only used cultured free-living algae).

We appended this information, considering that Burriesci 2012 discussed mainly glycerol secretion using cultured free-living algae, as follows:

Line 95:

“On the addition of the photosynthesis inhibitor 3-(3,4-dichlorophenyl)-1,1-dimethylurea (DCMU), the concentrations of glucose and galactose in the medium increased (Figure 1E, F, Figure 1—figure supplement 2), suggesting the presence of a pathway uncharacterized in previous studies, where the transport of newly fixed glucose, not glycerol, to the host sea anemone was blocked by DCMU addition (Burriesci et al., 2012).”

– Figure 2: define P, CP, NP.

We appended this information in the Figure 2 legend.

– Figure 2C: Since these are free-living dinoflagellates, they should have a flagellum; however, it is not visible in these images. This raises concerns about the effectiveness of the fixative, or whether these cells really reflect free-living algae.

This is an important point in this experiment: As shown in a previous study in which the culture strain Breviolum sp. SSB01 was originally isolated, the stain used has been isolated through screenings on agar plates, and most of the cells are maintained as coccoids. This strain was used partly because most of other strains contain contaminated/co-cultured bacteria and were not usable for biochemical and physiological assays in this study. In SEM and TEM analyses, the ratios of flagellated cells were low and most of the micrographs were non-flagellated.

– Figure 2E/F: these results should be discussed in more detail in the main text. In the figure, further annotation should be provided to illustrate the features of importance of the NP (non-peeled), P (peeled), or CP (completely peeled) morphologies. Is there any relationship between the SEM and TEM observations? (i.e. NP-P-CP vs smooth-wrinkled).

We totally agree with your comment; we added annotations of NP, P, CP in Figure 2 legend and discussed the cell surface structures more in detail in the Discussion section, as follows.

Line 150:

“Indeed, wrinkle and exfoliation of the algal cell wall was observed under low pH conditions using SEM and TEM, respectively, suggesting that the cell walls are morphologically and qualitatively modified under low pH in Breviolum (Figure 2).”

In our view, relationships between SEM and TEM results were very important and interesting, but unfortunately, while they apparently show some similarity and correspondence (e.g. more NP and smooth cells in normal condition), it is difficult to conclude that there are some clear relationships, since exactly the same cell could not be observed using SEM and TEM. This should be examined in a future study.

– The Methods state that "73 and 129 cells pooled form n = 4 technical replicates". This would mean that N=1, which would not be acceptable. Please clarify.

We presented biological replicates (N=2) in the revised manuscript, in Figure 2.

– Please show more images of the different morphologies, either in the main manuscript or as supplemental material.

We added more images in Figure 2—figure supplement 1 and 2.

– Figure 3: define "CAZymes" in legend.

“Carbohydrate-Active enZymes” was appended in the legend.

– 12 carbohydrate-active enzymes are differentially expressed after 1 day in low pH media yet only cellulase is examined or elaborated upon. Discussion of the others is warranted. Is this pattern maintained after 3 weeks?

We totally agreed and appended further discussion of other enzymes, although molecular studies are very limited, in the Discussion section Line 171:

“Although the mechanism of action of galactose secretion is unknown, less substantial increase of galactose secretion under low pH (Figure 1) and the significant inhibitory effect of PSG (Figure 4) suggest that galactose secretion may be regulated by uncharacterized PSG-sensitive enzymes. Under low pH, multiple upregulated genes encoding CAZymes that break down glycosidic bonds (e.g. chitinase, hexosaminidase, mannosidase) were detected (Figure 3). The cell wall components of Symbiodiniaceae are unknown, but complex galactose-containing glycans that constitute the cell wall may be targets of these CAZymes.”

Again, we apologize the confusion made from the previous version of the manuscript, “3 weeks” is the duration of pre-culturing before measurements in most cases. In this study we focused on shorter-term responses (e.g. one day), which we believe are suitable for biochemical and physiological experiment settings we used. Longer-term responses are also important and will be subjects of future studies using more stable culturing systems, e.g. chemostat, bioreactor.

– Please provide a list of the other genes that are differentially regulated, and compare it to published transcriptomic analyses or other data from free-living and symbiotic algae.

We appended the results with re-analyzing the data by Xiang et al. (2020 Nature Comm 11: 108) as an additional column in Figure 3-source data 1 “Expression levels of the annotated low pH DEGs”.

Discussion

– The major assumption of this study is that the incubations at low pH mimic Breviolum inside the coral symbiosome during symbiosis. However, the majority of the Low pH incubations lasted for only 1 day, and only the morphology observations occurred after 3 weeks.

We apologize the confusion made from the previous version of the manuscript. First, in this study we did not assume that low pH mimics symbiosome, but rather our assumption is that low pH is a ubiquitous environmental signal in nature and different kinds of animal guts and that many unknown, more complex, host-derived signals may be present in symbiosomes. Second, most experiments including morphological observations are done in one day, not 3 weeks, which was a pre-culture duration in most cases, as explained earlier. We clarified this point in the Materials and methods in the revised manuscript.

– For example, Line 128: claims that "this pathway occurred over days". However, most of the experiments involved a 1-day incubation in Low pH, whereas Burriesci et al. 2012 were done using isotopes in established Aiptasia symbiosis.

Thank you for pointing this out. We changed "this pathway occurred over days" to "this pathway occurred in a day". Burriesci et al. 2012 used an established symbiosis system as you mentioned. However, they measured the metabolite transfer in a shorter time range (5 min to 1 hour) and did not report isotope relocations in a day or longer. This does not necessarily mean that the cellulase-mediated pathway does not work in an hour or that Burriesci et al. 2012 shows that photosynthates will not stay in symbiont cells for days. Rather, we just clarified the differences in the detection time ranges in this and previous studies.

Considering the differences of detection time ranges and the responses to DCMU treatments, our data and Burriesci et al. 2012 pointed towards different sites of action.

– Line 133-135: this statement is not supported by the growth data shown in Figure 1A which is slowed under low pH. Maybe the authors mean "inhibit cell proliferation"? In this case, this claim should be tested by inhibiting cellulase in Low pH media and measuring growth rate. It would also be interesting to see the effect of cellulase inhibitors on cell morphology.

We apologize the confusion. Kwok and Wong 2010 Plant Cell showed that addition of exogenous cellulase enzyme led to cell cycle advancement in the dinoflagellate Crypthecodinium cohnii. Based on this report, our original intention was to say that, when low pH inhibits cell cycle progression, the cells secrete cellulases which can potentially play a role in complementing the retarded cell cycle. Notably, in Kwok and Wong 2010, the relationship between cellulase activity and cell cycle progression was clearly demonstrated but how these are relevant to the cell growth rate (both in terms of cell ‘size’ and ‘number’ growth rates) remains unclear. Considering this, we changed this part to the following:

Line 161:

“This suggests the photosynthesis-limiting conditions trigger an environmental response in the algae to compensate for retarded cell cycle progression by upregulating multiple genes including the one encoding cellulase, accompanying cell wall degradation and monosaccharide secretion (or “leakage”).

– Line 144-146: in my opinion (which matches that of many experts) is that the symbiosome derives from lysosomes and/or phagosomes, which are acidic. It is true that their acidic nature seems to have important implications for symbiosis (e.g. Tang. Front. Microbiol. 6, 816 (2015), but this is very different from "acidifying symbiosomes" being an evolutionary response for algal symbiosis).

We apologize the confusion and agree with you. We changed this to the following:

Line 180:

“Therefore, acidic symbiosomes may be of evolutionary advantage for cnidarian hosts to promote environmental responses of algal symbionts, which enables monosaccharides to be efficiently secreted within the organelle.”

Other/General

– What are the dissolved inorganic carbon (DIC) levels in each condition? This is important because pH was adjusted with HCl, which would result in the formation of CO2 that would bubble off resulting in decreased DIC availability for photosynthesis.

Although we have not measured it in this study due to technical difficulties, lowered photosynthesis speed in low pH (Figure 1) suggests that DIC may be decreased and affect the rate of conversion from DIC to CO2 and photosynthetic carbon fixation. This will be a subject of future studies.

– Check all figure legends and axes titles for typos, missing information, and undefined abbreviations.

Thank you for your suggestions. We have carefully revised the manuscript.

– I presume the culture media contains vitamins, nitrate, and other compounds that promote algal growth but do not match the conditions found in seawater. This means that the Control cells do not truly reflect free-living algae, which has important consequences for the interpretation of the results and their significance.

We agree that culture conditions we used do not truly reflect free living conditions in nature, and believe that this is also true in most of algal cultures used in previous studies. Our aim of this study is not to simulate natural condition in laboratory, but to examine the effect of pH by comparing the cultures in media with different pH values.

Reviewer #2 (Recommendations for the authors):

(1) The data on CAZymes and their connection to the narrative of cellulose breakdown and monosaccharide release is very interesting, as the transcriptomics experiment shows the significant upregulation upon low pH of cellulase with a signal peptide (Figure 3). Also intriguing is that the various genes and isoforms display markedly different levels of gene expression changes, both in extent and direction. However, more information about the cellulases is needed for the reader to place these results in context to understand the biology of these molecules, particularly the action and specificity of these enzymes. First, no explicit connection is made between the Trinity ID in the main text and the cellulase gene and isoform labels shown in Figure 3C, although presumably based on context, GH7+CBM1 is the TRINITY_DN40554_c2_g2, so this can be improved by better labeling. Second, the interpretation would benefit from the brief inclusion of information about what distinguishes the various isoforms of these genes, including whether the active sites are conserved or divergent. Finally, related to the CAZymes but on another aspect: are these genes and cellulases found in any other studies of steady-state symbiosis? If this is a common pathway in coral-algal symbiosis, it would likely be present in at least some of the many publicly available datasets of symbiotic algae in hospite, even specifically Breviolum minutum. Therefore, it would be helpful to the reader and to the broader field to place these results in the broader context by outlining connections to the existing literature on these symbiotic systems.

We appreciate your helpful comments and revised the text as follows:

i. Lines 116-123 in the revised manuscript, we improved the labeling and explanations; cellulase as an enzyme, GH7+CBM1 as a sequence motif, and TRINITY_DN40554_c2_g2 as a gene model based on the transcriptome assembly.

ii. We re-analyzed the transcriptome of Xiang et al. (2020 Nature Communications) and found that the cellulase gene was differentially expressed in steady-state symbiosis (Figure 3- source data 1).

We believe that, although cellulases are not well annotated with simple similarity search results and not well discussed through published data, the CAZyme profiling in this study enabled to shed light on a connection between cell walls and environmental responses, and symbiosis.

(2) The Discussion mentions several times a connection to cell cycle progression (Line 122). The text states that "photosynthesis-limiting conditions trigger an environmental response in the algae to sustain cell proliferation, through cell cycle progression by cellulase, accompanying cell wall degradation and monosaccharide secretion" (Lines 133-135), as well as a mechanism of "secretion of monosaccharides … to compensate for retarded cell cycle progression" (Line 142-144). However, the 24 hr timepoint is substantially less than the doubling time of the algae, in particular in the low pH medium (Figure 1A), so it would seem there has been little cell division when these cellulases are mobilized at that time point. This claim should be better connected to and substantiated by the data presented.

This is a great point. Kwok and Wong 2010 Plant Cell showed that addition of exogenous cellulase enzyme led to cell cycle advancement in the dinoflagellate Crypthecodinium cohnii. Notably, in Kwok and Wong 2010, the relationship between cellulase activity and cell cycle progression was clearly demonstrated but how these are relevant to the cell growth rate (both in terms of cell ‘size’ and ‘number’) remains unclear. Thus, it is fair to say that cell wall and cell cycle most likely have some connections but the effect of cell wall degradation to cell division (as a result of cell cycle progression) is not fully understood. To make this clear and tone down the direct effects of cell wall to cell division, we revised the Discussion as follows:

Line 161:

“This suggests the photosynthesis-limiting conditions trigger an environmental response in the algae to compensate for retarded cell cycle progression by upregulating multiple genes including the one encoding cellulase, accompanying cell wall degradation and monosaccharide secretion (or “leakage”)”.

(3) The cell aggregation results are an interesting phenotype observed, and lead the reader to ask: how does the decreased cell clumping seen in low pH (Figure 2A-B) fit with the concurrent higher monosaccharide secretion (Figure 1), when other bodies of research have suggested that increased monosaccharide secretion contributes to increased cell aggregation (Lines 141-142)?

Although there have been literally no studies clarifying molecular details of the relationship between secreted saccharides and cell aggregation in dinoflagellates, we think that molecular species and structures of secreted saccharides may vary depending on multiple factors, e.g. lineage, species, kind and strength of environmental stimuli. In Breviolum, low pH signals increased monosaccharide secretion and decreased cell clumping, while other stressors may bring different phenotypes. To clarify this, we cited Kwok et al. 2023 and revised the Discussion section:

Line 168:

“Some dinoflagellates are also known to secrete viscous substances, including monosaccharides, as an environmental response, likely for cell aggregation and biofilm formation (Kwok et al., 2023; Mandal et al., 2011). In this study, we show that Breviolum secrets galactose as well as glucose (Figure 1). … The cell wall components of Symbiodiniaceae are unknown, but complex galactose-containing glycans that constitute the cell wall may be targets of these CAZymes.”

(4) The data presented in Figure 1 show sugars "secreted", which is described in the Methods as being calculated from the differences in concentration in the media between 24hr vs. 0hr after exposure (Line 204-205). In contrast, the data presented in Figure 4 show the sugar "concentration" in the medium, without the calculation. These varying presentations of the same type of data can be initially confusing, especially when considering how different the baseline sugar concentrations are between the experiments (Figure 4 '0 mM PSG' condition vs. Figure 1 'normal' condition). This could be clarified by showing the raw data of monosaccharide concentrations in all cases, to allow for ease of interpretation, particularly across experiments. Further help to the reader would be to include in the legends that the data in Figure 1 is from ion chromatography and the data from Figure 4 is from LC-MS/MS, which may account for some differences in baseline sugar concentration across these experiments.

As suggested, we used “secretion rate (μg/ml/day)” or “concentration (μg/ml)” throughout the manuscript and included the measuring methods (ion chromatography or LC-MS/MS) in the legends of Figures 1 and 4.

(5) While the experiments are excellently described in thorough detail to allow repetition, to fully understand the experimental design required flipping between the Results, Figure Legends, and various sections of the Methods to get a detailed overview of exactly how the experiments were conducted. Thus the manuscript would greatly benefit from a schematic of the experimental design, perhaps as a small panel in Figure 1. It would be very helpful to show that the algae were grown in rich media, passaged to minimal media IMK for 1 week, then put in the two different pH media and collected after 24 hr (or 3 weeks).

We revised the Materials and methods to make it more straightforward and added a panel showing a schematic of the experimental design in Figure 1-S1.

(6) Line 81 and Figure 1: please move the Supp. Figure S1 to be a panel in the main figure. It shows an exciting and important main aspect of the work, and the baseline 'normal' data is the same between figures, as the authors point out.

As suggested, we move Supp Figure S1 in the previous manuscript to the main Figure 1 in the revised version.

(7) Lines 158-159: while a knockdown of cellulase would indeed be powerful, the PSG inhibitor here presumably accomplishes the same.

We agree that our inhibitor experiments presumably work in a similar way as a knockdown. Considering the recently published paper (Gornik et al., 2022) and advances of genetic engineering techniques, we changed “knockdown” to “knockout” (Line 195), which should bring the research one step further.

(8) Figure 2: include in the figure or legend the definitions of NP, P, and CP.

The definitions of NP (non-peeled), P (peeled) and CP (completely-peeled) were included in the legend as suggested.

(9) Figure 3C:

– The use of asterisks to indicate isoforms is confusing, as this symbol is most commonly used to indicate statistical significance. Use bolding or boxing or some other clear way to highlight these two genes/isoforms as being of particular interest.

We removed the asterisks and modified the figure to highlight cellulase isoforms, as suggested.

– Legend: state here clearly and succinctly the definitions of control, normal, and low pH, as well as the time point of collection.

As suggested, we explained the definitions of the sample labels and time point in Figure 3A legend as follows, not 3C, as we see that the 3A used the same labeling and better to be explained earlier.

“A. Venn diagram showing the numbers of DEGs between the cells incubated under normal condition for 1 day vs control (before incubation) and between the ones incubated at low pH vs control.”

– Add a title across the graph, e.g. "expression of CAZy isoforms in low pH".

The title “Expression of CAZyme isoforms” was added in Figure 3c.

– The expression is by logFC, not log2FC? The color scale, therefore, masks quite a large range of expression differences, especially the potential differences in upregulation of the key cellulase isoforms (all are orange, which according to the key is logFC from 0.0 to 2.5, a large range). Also the colors of the data points don't match the scale in tone, requiring extra work to match these up. Readability would be greatly improved if the scale was changed to log2FC with a more fine-scale gradation of expression levels, to better highlight the interesting differences in gene expression.

We agreed with the suggestion and revised the Figure 3c for improving readability. In doing this, A few outliers (showing very low expression, low FC and high FDR) were removed, as described in the Methods section, Line 332.

“For visualization purpose, two outliers TRINITY_DN38357_c4_g1_i9 and TRINITY_DN40801_c4_g1_i5 showing very low expression are not presented in Figure 3C.”

– According to the Methods, the DEGs in the transcriptome analysis were chosen by FDR cutoff of 0.01, but several of these CAZymes fall above that threshold yet are still referred to as DEGs. Further clarification would help the reader.

We thank the reviewer for pointing this out. For clarification we revised the Figure 3c legend, considering the followings: Our transcriptome assembly generated by the Trinity software contains two levels of assembles, ‘gene’ and ‘isoform’, and the gene is basically a cluster of the isoforms, each of which can be translated into distinct polypeptides. Using these assembles, we could obtain differentially expressed genes (DEGs) and isoforms (DEIs), but mainly used the former to discuss the expression regulations. However, we found that some isoforms possessed specific protein domains or signal peptides, but others did not, which is critical in discussing potential intracellular localization of the gene products, i.e. cellulases and other CAZymes. Thus, we identified DEGs which were included in the CAZymes, and took out isoform information for these DEGs including the FDR scores from the expression analysis. This results in that some isoforms are fall below the threshold (DEIs) and others are not.

https://doi.org/10.7554/eLife.80628.sa2

Article and author information

Author details

  1. Yuu Ishii

    1. Department of Ecological Developmental Adaptability Life Sciences, Graduate School of Life Sciences, Tohoku University, Sendai, Japan
    2. Department of Biology, Miyagi University of Education, Sendai, Japan
    Present address
    Graduate School of Agriculture, Kyoto University, Sakyo-ku, Japan
    Contribution
    Data curation, Formal analysis, Funding acquisition, Validation, Investigation, Visualization, Methodology, Writing – original draft, Project administration, Writing – review and editing
    Competing interests
    No competing interests declared
    ORCID icon "This ORCID iD identifies the author of this article:" 0000-0003-1735-9557
  2. Hironori Ishii

    Department of Ecological Developmental Adaptability Life Sciences, Graduate School of Life Sciences, Tohoku University, Sendai, Japan
    Contribution
    Data curation, Formal analysis, Investigation, Methodology
    Competing interests
    No competing interests declared
  3. Takeshi Kuroha

    Department of Ecological Developmental Adaptability Life Sciences, Graduate School of Life Sciences, Tohoku University, Sendai, Japan
    Present address
    Division of Crop Genome Editing, Institute of Agrobiological Sciences, National Agriculture and Food Research Organization (NARO), Tsukuba, Japan
    Contribution
    Data curation, Formal analysis, Investigation, Methodology
    Competing interests
    No competing interests declared
    ORCID icon "This ORCID iD identifies the author of this article:" 0000-0002-8327-962X
  4. Ryusuke Yokoyama

    Department of Ecological Developmental Adaptability Life Sciences, Graduate School of Life Sciences, Tohoku University, Sendai, Japan
    Contribution
    Supervision, Validation, Methodology
    Competing interests
    No competing interests declared
    ORCID icon "This ORCID iD identifies the author of this article:" 0000-0003-0326-0433
  5. Ryusaku Deguchi

    Department of Biology, Miyagi University of Education, Sendai, Japan
    Contribution
    Supervision, Validation, Methodology
    Competing interests
    No competing interests declared
    ORCID icon "This ORCID iD identifies the author of this article:" 0000-0003-4571-9329
  6. Kazuhiko Nishitani

    Department of Biological Sciences, Faculty of Science, Kanagawa University, Yokohama, Japan
    Contribution
    Supervision, Validation, Methodology
    Competing interests
    No competing interests declared
    ORCID icon "This ORCID iD identifies the author of this article:" 0000-0002-0073-9564
  7. Jun Minagawa

    1. Department of Basic Biology, School of Life Science, SOKENDAI (The Graduate University for Advanced Studies), Okazaki, Japan
    2. Division of Environmental Photobiology, National Institute for Basic Biology, Okazaki, Japan
    Contribution
    Supervision, Funding acquisition, Validation, Methodology
    Competing interests
    No competing interests declared
    ORCID icon "This ORCID iD identifies the author of this article:" 0000-0002-3028-3203
  8. Masakado Kawata

    Department of Ecological Developmental Adaptability Life Sciences, Graduate School of Life Sciences, Tohoku University, Sendai, Japan
    Contribution
    Supervision, Validation, Methodology
    Competing interests
    No competing interests declared
    ORCID icon "This ORCID iD identifies the author of this article:" 0000-0001-8716-5438
  9. Shunichi Takahashi

    Tropical Biosphere Research Center, University of the Ryukyus, Okinawa, Japan
    Contribution
    Data curation, Investigation, Methodology, Writing – original draft, Writing – review and editing
    Competing interests
    No competing interests declared
  10. Shinichiro Maruyama

    1. Department of Ecological Developmental Adaptability Life Sciences, Graduate School of Life Sciences, Tohoku University, Sendai, Japan
    2. Graduate School of Humanities and Sciences, Ochanomizu University, Tokyo, Japan
    Present address
    Department of Integrated Biosciences, Graduate School of Frontier Sciences, The University of Tokyo, Kashiwa, Japan
    Contribution
    Conceptualization, Resources, Data curation, Software, Formal analysis, Supervision, Funding acquisition, Validation, Investigation, Visualization, Methodology, Writing – original draft, Project administration, Writing – review and editing
    For correspondence
    shinichiro.maruyama@k.u-tokyo.ac.jp
    Competing interests
    No competing interests declared
    ORCID icon "This ORCID iD identifies the author of this article:" 0000-0002-1128-5916

Funding

Japan Society for the Promotion of Science (JP20J01658)

  • Yuu Ishii

Japan Society for the Promotion of Science (JP21H05040)

  • Jun Minagawa

Japan Society for the Promotion of Science (JP17K15163)

  • Shinichiro Maruyama

Japan Society for the Promotion of Science (JP19H04713)

  • Shinichiro Maruyama

Japan Society for the Promotion of Science (JP19K06786)

  • Shinichiro Maruyama

Japan Society for the Promotion of Science (JP22H05668)

  • Shinichiro Maruyama

Japan Society for the Promotion of Science (JP22H02697)

  • Shinichiro Maruyama

National Institute for Basic Biology (Collaborative Research Program 18-321)

  • Shinichiro Maruyama

National Institute for Basic Biology (Collaborative Research Program 19-332)

  • Shinichiro Maruyama

Institute for Fermentation, Osaka (General Research Grant)

  • Shinichiro Maruyama

Frontier Research Institute for Interdisciplinary Sciences, Tohoku University (Program for Creation of Interdisciplinary Research)

  • Shinichiro Maruyama

Gordon and Betty Moore Foundation (Marine Microbiology Initiative #4985)

  • Jun Minagawa

The funders had no role in study design, data collection and interpretation, or the decision to submit the work for publication.

Acknowledgements

We thank Dr. Naoki Shinohara and Prof. Fukumatsu Iwahashi for their support in ion chromatography and mass spectrometry, Ms. Yuna Uchida for her assistance in maintaining the algal cultures, Dr. Sara E Milward for her critical reading of the manuscript, Prof. Hiromu Tanimoto and Dr. Vladimiros Thoma for their help in preparing the manuscript, Drs. Kota Kera and Seiji Kojima for their contributions in the initial phase of the project, as well as Profs. John R Pringle and Arthur R Grossman for their generous gift of algal cultures. This work was supported by JSPS KAKENHI (Grant Numbers JP20J01658 [to YI], JP21H05040 [to JM], JP17K15163, JP19H04713, JP19K06786, JP22H05668 and JP22H02697 [to SM]), NIBB Collaborative Research Program 18-321 and 19-332 (to SM), Institute for Fermentation, Osaka (to SM), Program for Creation of Interdisciplinary Research, Frontier Research Institute for Interdisciplinary Sciences, Tohoku University (to SM), and the Gordon & Betty Moore Foundation’s Marine Microbiology Initiative #4985 (to JM). Computational resources were provided by the Data Integration and Analysis Facility at the National Institute for Basic Biology and the NIG supercomputer at the ROIS National Institute of Genetics.

Senior Editor

  1. Meredith C Schuman, University of Zurich, Switzerland

Reviewing Editor

  1. Kristin Tessmar-Raible, University of Vienna, Austria

Version history

  1. Received: May 27, 2022
  2. Preprint posted: July 3, 2022 (view preprint)
  3. Accepted: June 20, 2023
  4. Version of Record published: August 18, 2023 (version 1)

Copyright

© 2023, Ishii et al.

This article is distributed under the terms of the Creative Commons Attribution License, which permits unrestricted use and redistribution provided that the original author and source are credited.

Metrics

  • 258
    Page views
  • 33
    Downloads
  • 1
    Citations

Article citation count generated by polling the highest count across the following sources: Crossref, PubMed Central, Scopus.

Download links

A two-part list of links to download the article, or parts of the article, in various formats.

Downloads (link to download the article as PDF)

Open citations (links to open the citations from this article in various online reference manager services)

Cite this article (links to download the citations from this article in formats compatible with various reference manager tools)

  1. Yuu Ishii
  2. Hironori Ishii
  3. Takeshi Kuroha
  4. Ryusuke Yokoyama
  5. Ryusaku Deguchi
  6. Kazuhiko Nishitani
  7. Jun Minagawa
  8. Masakado Kawata
  9. Shunichi Takahashi
  10. Shinichiro Maruyama
(2023)
Environmental pH signals the release of monosaccharides from cell wall in coral symbiotic alga
eLife 12:e80628.
https://doi.org/10.7554/eLife.80628

Further reading

    1. Microbiology and Infectious Disease
    Rita M Meganck, Deanna Zhu ... Longping V Tse
    Short Report

    A hallmark of dengue virus (DENV) pathogenesis is the potential for antibody-dependent enhancement, which is associated with deadly DENV secondary infection, complicates the identification of correlates of protection, and negatively impacts the safety and efficacy of DENV vaccines. Antibody-dependent enhancement is linked to antibodies targeting the fusion loop (FL) motif of the envelope protein, which is completely conserved in mosquito-borne flaviviruses and required for viral entry and fusion. In the current study, we utilized saturation mutagenesis and directed evolution to engineer a functional variant with a mutated FL (D2-FL), which is not neutralized by FL-targeting monoclonal antibodies. The FL mutations were combined with our previously evolved prM cleavage site to create a mature version of D2-FL (D2-FLM), which evades both prM- and FL-Abs but retains sensitivity to other type-specific and quaternary cross-reactive (CR) Abs. CR serum from heterotypic (DENV4)-infected non-human primates (NHP) showed lower neutralization titers against D2-FL and D2-FLM than isogenic wildtype DENV2 while similar neutralization titers were observed in serum from homotypic (DENV2)-infected NHP. We propose D2-FL and D2-FLM as valuable tools to delineate CR Ab subtypes in serum as well as an exciting platform for safer live-attenuated DENV vaccines suitable for naïve individuals and children.

    1. Microbiology and Infectious Disease
    Somnath Shee, Reshma T Veetil ... Amit Singh
    Research Article Updated

    Mycobacterium tuberculosis (Mtb) is evolutionarily equipped to resist exogenous reactive oxygen species (ROS) but shows vulnerability to an increase in endogenous ROS (eROS). Since eROS is an unavoidable consequence of aerobic metabolism, understanding how Mtb manages eROS levels is essential yet needs to be characterized. By combining the Mrx1-roGFP2 redox biosensor with transposon mutagenesis, we identified 368 genes (redoxosome) responsible for maintaining homeostatic levels of eROS in Mtb. Integrating redoxosome with a global network of transcriptional regulators revealed a hypothetical protein (Rv0158) as a critical node managing eROS in Mtb. Disruption of rv0158 (rv0158 KO) impaired growth, redox balance, respiration, and metabolism of Mtb on glucose but not on fatty acids. Importantly, rv0158 KO exhibited enhanced growth on propionate, and the Rv0158 protein directly binds to methylmalonyl-CoA, a key intermediate in propionate catabolism. Metabolite profiling, ChIP-Seq, and gene-expression analyses indicate that Rv0158 manages metabolic neutralization of propionate toxicity by regulating the methylcitrate cycle. Disruption of rv0158 enhanced the sensitivity of Mtb to oxidative stress, nitric oxide, and anti-TB drugs. Lastly, rv0158 KO showed poor survival in macrophages and persistence defect in mice. Our results suggest that Rv0158 is a metabolic integrator for carbon metabolism and redox balance in Mtb.