Association of lithocholic acid with skeletal muscle hypertrophy through TGR5-IGF-1 and skeletal muscle mass in cultured mouse myotubes, chronic liver disease rats and humans
- Department of Gastroenterology and Hepatology, Graduate school of medicine, Mie University, Japan
- Department of Veterinary Medicine, School of Veterinary Medicine, Rakuno Gakuen University, Japan
- Center for Physical and mental health, Mie University Graduate School of Medicine, Japan
Figures
Figure 1
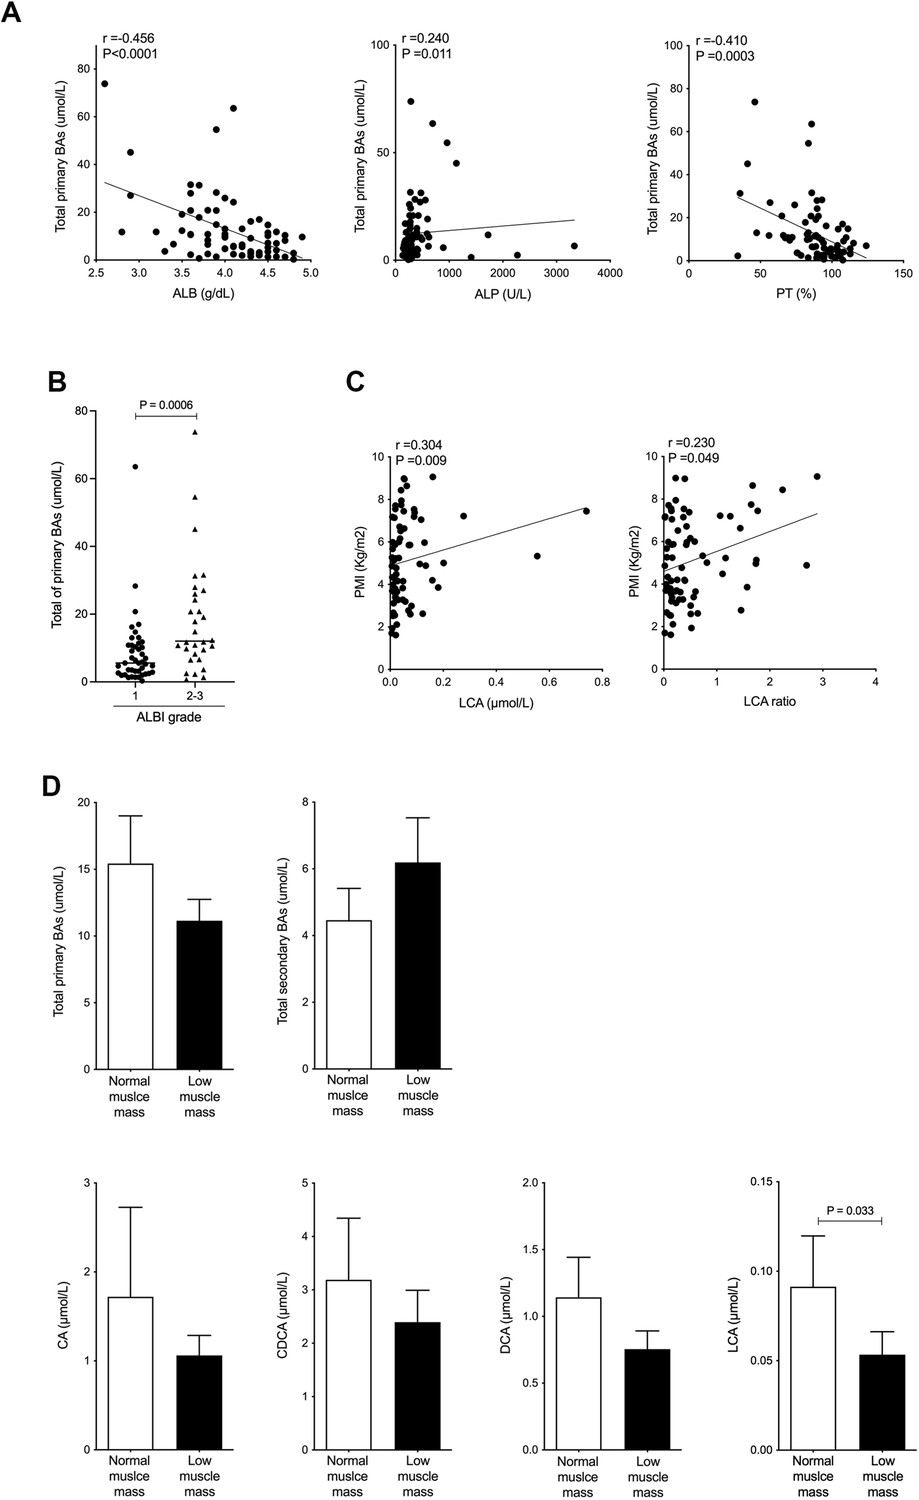
Serum LCA level is significantly and positively correlated with PMI in CLD patients and is significantly decreased in CLD patients with low muscle mass.
(A) Correlation between total primary BAs and ALB, ALP, or PT (%) in CLD patients. (B) Changes in total primary BAs in CLD patients with ALBI grade 1 or grades 2–3. (C) Correlation of PMI with serum LCA and LCA ratio in CLD patients. (D) Changes in total serum primary BAs, total secondary BAs, CA, CDCA, DCA, and LCA in CLD patients with normal muscle mass and low muscle mass. Spearman’s rank correlation coefficient or Mann-Whitney U test. Values are mean ± SEM. CLD, chronic liver disease; BAs, bile acids; ALBI, albumin-bilirubin; CA, cholic acid; CDCA, chenodeoxycholic acid; DCA, deoxycholic acid; LCA, lithocholic acid; PMI, psoas muscle mass index.
-
Figure 1—source data 1
Serum total primary bile acids (BAs), albumin (ALB), alkaline phosphatase (ALP), prothrombin time (PT, %), psoas muscle mass index (PMI), lithocholic acid (LCA), and LCA ratio in chronic liver disease (CLD) patients.
Serum total serum primary BAs, total secondary BAs, cholic acid (CA), chenodeoxycholic acid (CDCA), deoxycholic acid (DCA), and LCA in CLD patients with normal muscle mass and low muscle mass.
- https://cdn.elifesciences.org/articles/80638/elife-80638-fig1-data1-v1.xlsx
Figure 2
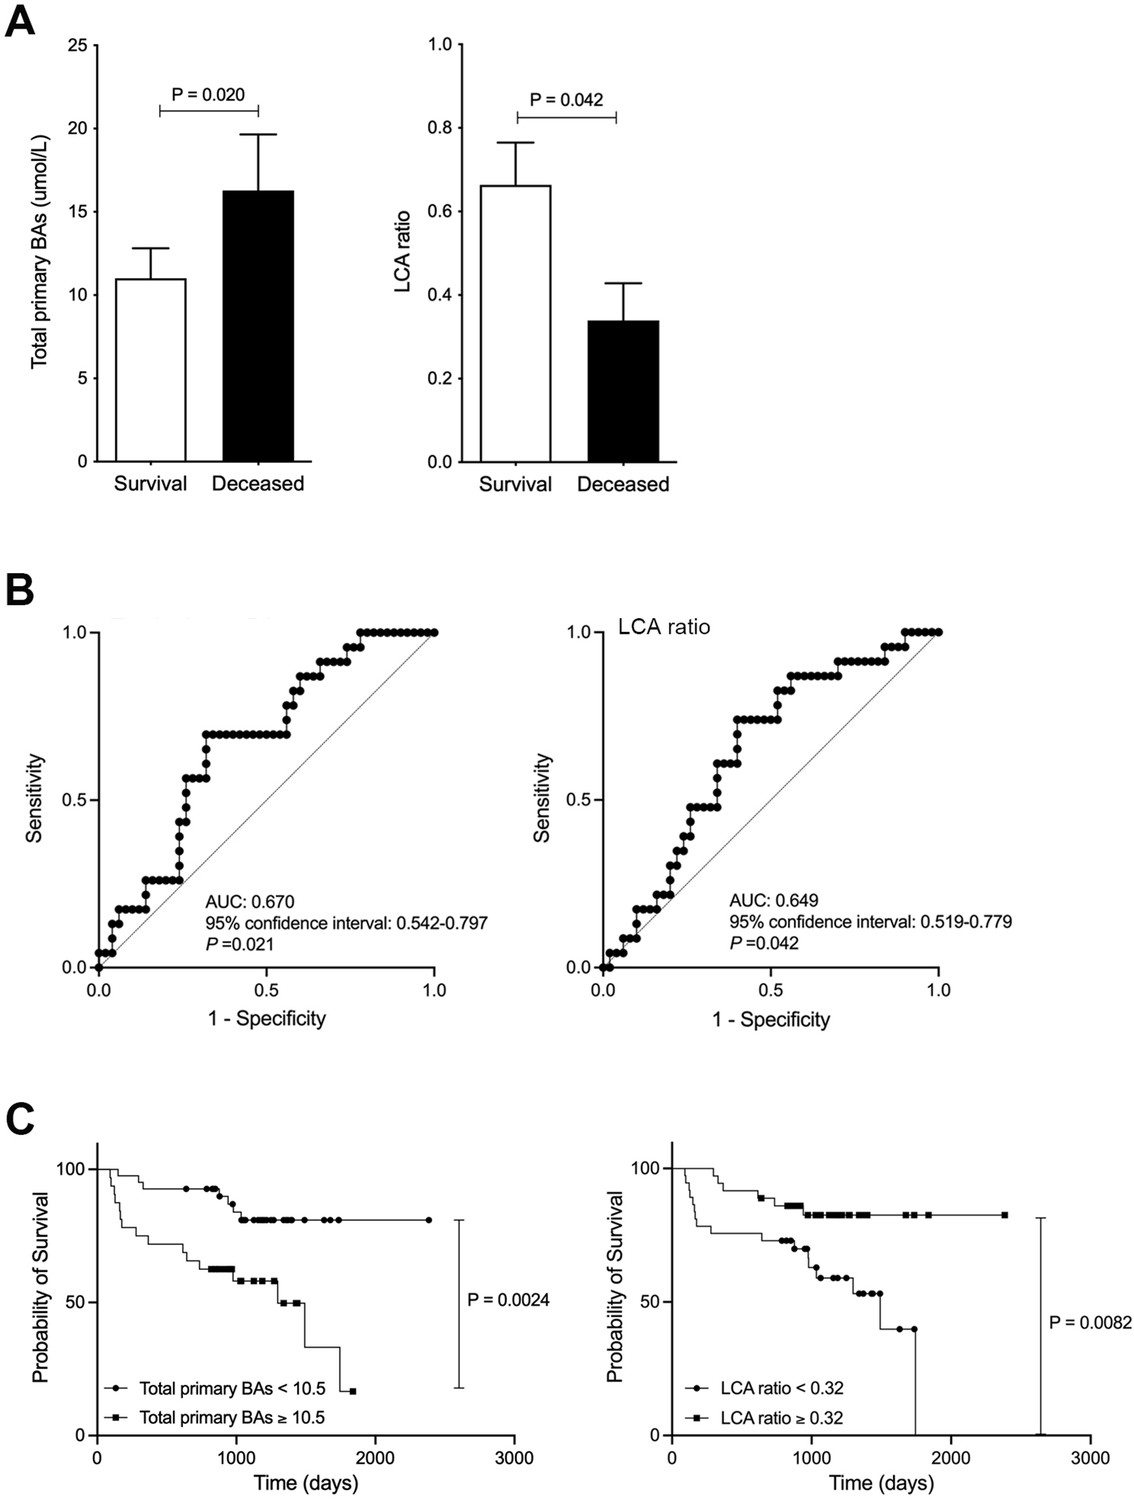
Improved survival in chronic liver disease (CLD) patients with high levels of serum lithocholic acid (LCA).
(A) Serum total of primary bile acids (BAs) and LCA ratio in survival and deceased CLD patients. (B) ROC curve of serum total or primary BAs and LCA. (C) CLD patient survival curve with total primary BAs and LCA. Correlation of psoas muscle mass index with serum LCA and LCA ratio in CLD patients. Mann-Whitney U test. ROC curves and the corresponding AUC were used to obtain cut-offs for the outcomes. The Youden index was applied to calculate the optimal cut-off point. OS was measured using the Kaplan-Meier method and compared using the log-rank test. Values are mean ± SEM.
-
Figure 2—source data 1
Serum total of primary bile acids (BAs) and lithocholic acid (LCA) ratio in survival and deceased chronic liver disease (CLD) patients.
CLD patient survival curve with total primary BAs and LCA.
- https://cdn.elifesciences.org/articles/80638/elife-80638-fig2-data1-v1.xlsx
Figure 3
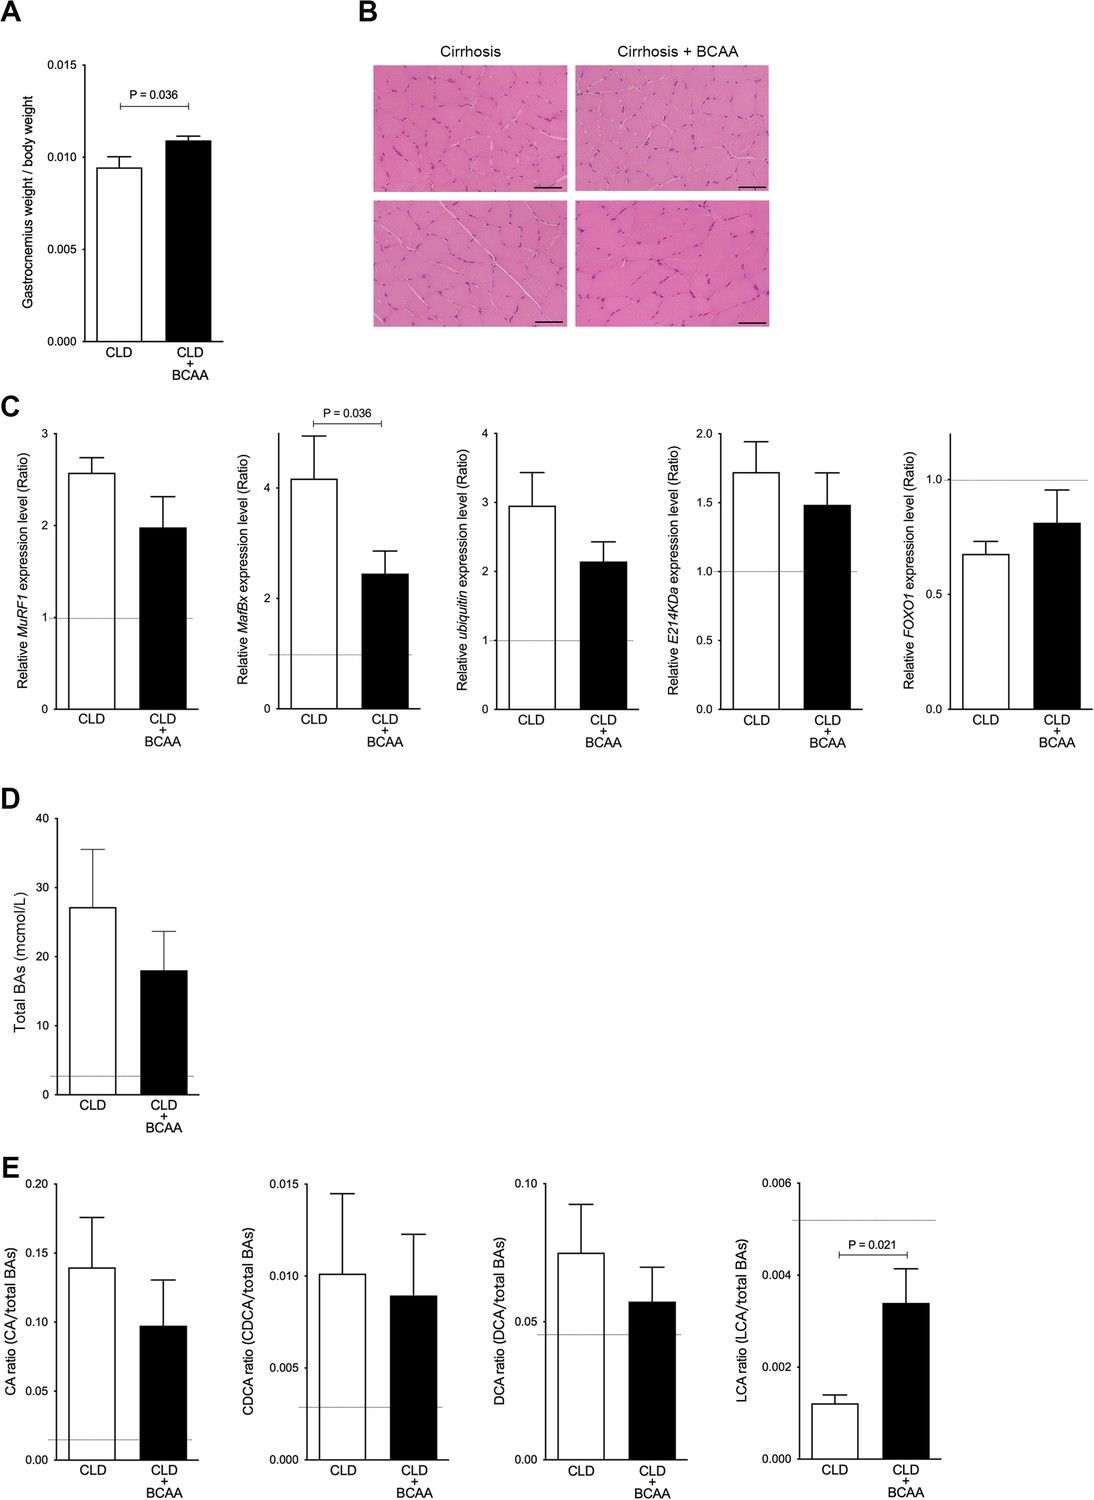
Gastrocnemius muscle mass and serum LCA ratio are significantly increased in CLD rats treated with BCAA.
(A) Changes in gastrocnemius muscle/body weight in CLD rats (n=9) and CLD rats treated with BCAA (CLD+BCAA) (n=8). (B) Hematoxylin and eosin staining in gastrocnemius muscle sections from CLD and CLD+BCAA rats. Scale bar, 50 μm. (C) Gene expression of MuRF1, MafBx, ubiquitin, E214KDa, and FOXO1 in gastrocnemius muscle from CLD and CLD+BCAA rats as measured by quantitative PCR. All gene expression levels were normalized to housekeeping control, β2 microglobulin, and shown relative to the expression levels of control (normal rats). Broken line indicates the expression levels of gastrocnemius muscle from normal rats. (D and E) Changes in (C) serum total BAs, (D) CA/total BAs, CDCA/total BAs, DCA/total BAs, and LCA/total BAs in CLD and CLD+BCAA rats. Broken line indicates the serum BA levels from normal rats. Mann-Whitney U test. Values are mean ± SEM. CLD, chronic liver disease; MuRF1, muscle RING finger 1; MafBx, muscle atrophy F-box protein; FOXO1, forkhead box O1; BAs, bile acids; CA, cholic acid; CDCA, chenodeoxycholic acid; DCA, deoxycholic acid; LCA, lithocholic acid; BCAA, branched-chain amino acid.
-
Figure 3—source data 1
Ratio of gastrocnemius weight/body weight in chronic liver disease (CLD) rats and CLD rats treated with branched-chain amino acid (BCAA) (CLD+BCAA).
Serum total bile acids (BAs), cholic acid (CA)/total BAs, chenodeoxycholic acid (CDCA)/total BAs, deoxycholic acid (DCA)/total BAs and lithocholic acid (LCA)/total BAs in CLD and CLD+BCAA rats.
- https://cdn.elifesciences.org/articles/80638/elife-80638-fig3-data1-v1.xlsx
Figure 4
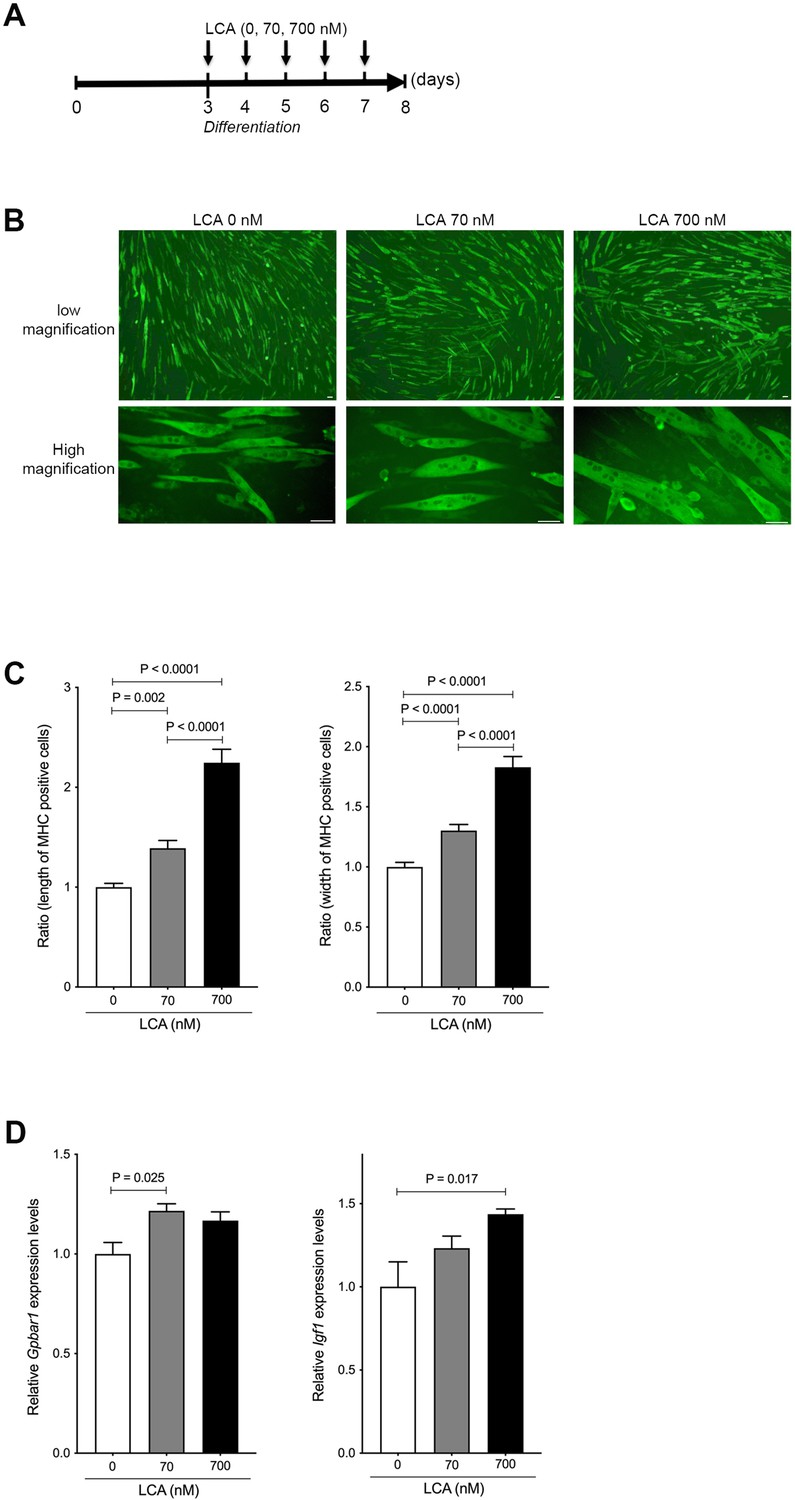
LCA induces hypertrophy of skeletal muscle cells.
(A) Scheme of experimental design in C2C12 myoblast to myotubes treated with LCA. (B) Myosin heavy chain (MHC) staining in C2C12 myotubes treated with 0, 70, and 700 nM of LCA. Scale bar, 50 μm. (C) Changes in length and width of MHC positive cells quantified from Figure 2B. (D) Gene expression of Gpbar1 and Igf1 in C2C12 myotubes treated with 0, 70, and 700 nM of LCA. Kruskal-Wallis test. Values are mean ± SEM from three biological replicates. LCA, lithocholic acid; Gpbar1, G-protein-coupled bile acid receptor 1; IGF, insulin growth factor.
-
Figure 4—source data 1
Ratio of length and width of myosin heavy chain (MHC) positive cells quantified from MHC staining in C2C12 myotubes treated with 0, 70, and 700 nM of lithocholic acid (LCA).
- https://cdn.elifesciences.org/articles/80638/elife-80638-fig4-data1-v1.xlsx
Figure 5
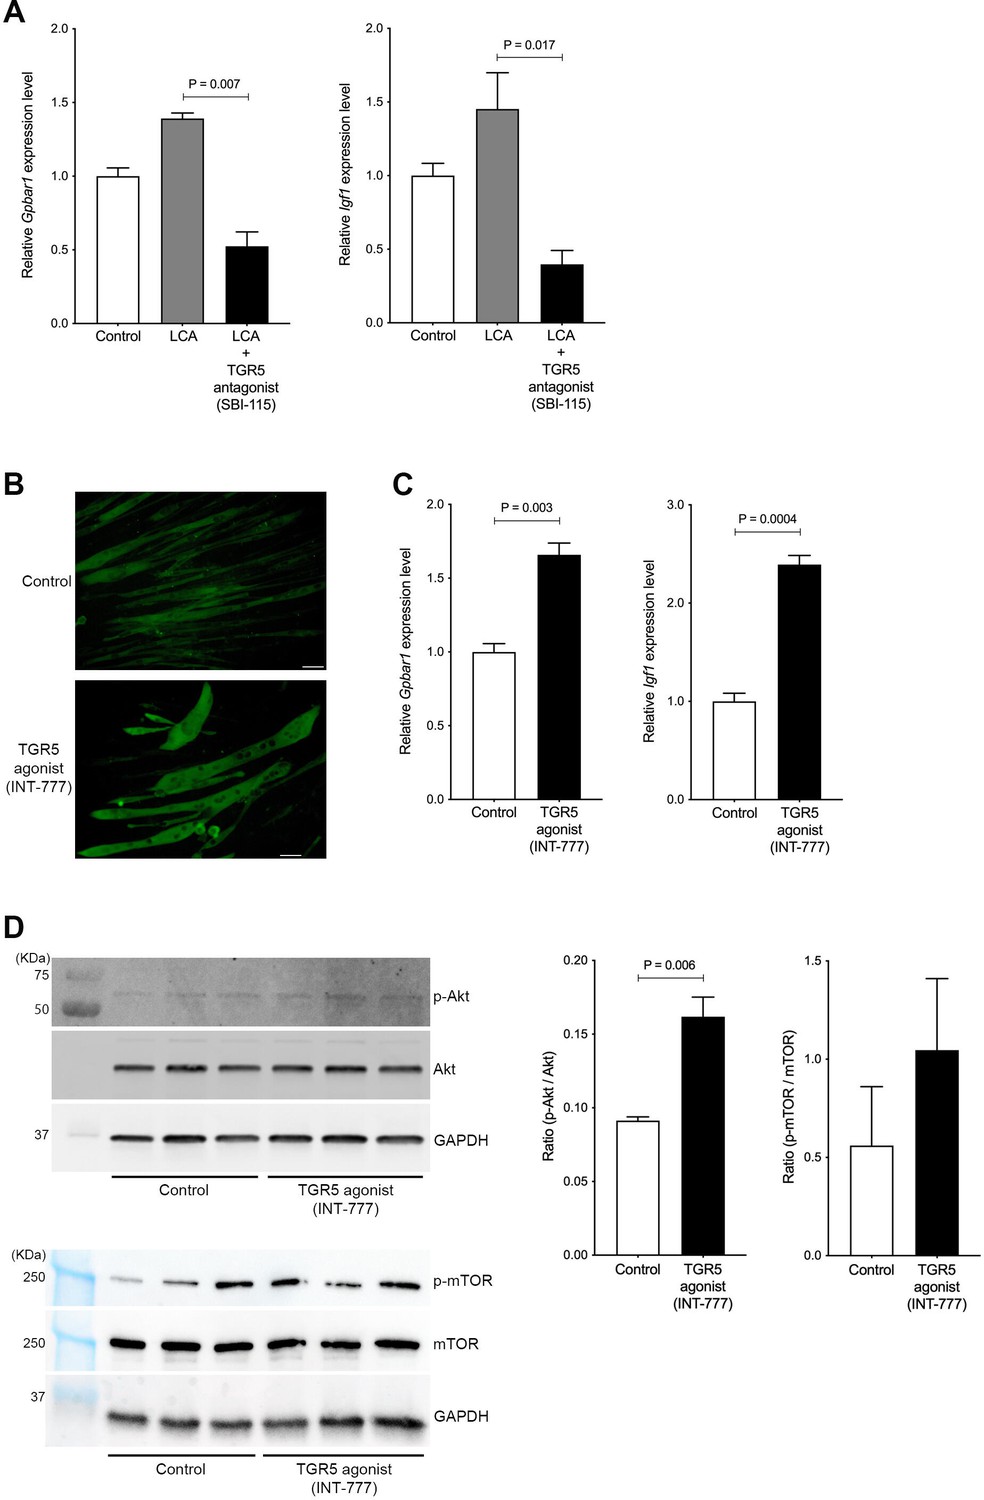
Hypertrophy of skeletal muscle cells is induced by TGR5-IGF-1-Akt3 activation.
(A) Gene expression of Gpbar1 and Igf1 in C2C12 myotubes treated with 70 nM LCA and 70 nM LCA plus 100 μM of TGR5 antagonist, SBI-115. (B) Myosin heavy chain staining in C2C12 myotubes treated with 1 μM of TGR5 agonist, INT-777. Scale bar, 50 μm. (C) Gene expression of Gpbar1 and Igf1 in C2C12 myotubes treated with 1 μM of INT-777. (D) Protein expression of phosphorylated Akt (p-Akt), Akt, phosphorylated mTOR (p-mTOR), mammalian target of rapamycin (mTOR), and GAPDH measured by western blotting in C2C12 myotubes treated with 1 μM of INT-777. Quantification of p-Akt/Akt or p-mTOR/mTOR from western blotting membrane. Kruskal-Wallis test or unpaired t test. Values are mean ± SEM from three biological replicates. LCA, lithocholic acid; Gpbar1, G-protein-coupled bile acid receptor 1; IGF, insulin growth factor; Akt, AKT serine/threonine kinase; GAPDH, glyceraldehyde-3-phosphate dehydrogenase.
-
Figure 5—source data 1
The uncropped blots with the relevant bands.
- https://cdn.elifesciences.org/articles/80638/elife-80638-fig5-data1-v1.xlsx
-
Figure 5—source data 2
The original blots for Akt.
- https://cdn.elifesciences.org/articles/80638/elife-80638-fig5-data2-v1.pdf
-
Figure 5—source data 3
The original blots for phosphorylated Akt (p-Akt).
- https://cdn.elifesciences.org/articles/80638/elife-80638-fig5-data3-v1.pdf
-
Figure 5—source data 4
The original blots for glyceraldehyde-3-phosphate dehydrogenase (GAPDH) (for Akt).
- https://cdn.elifesciences.org/articles/80638/elife-80638-fig5-data4-v1.pdf
-
Figure 5—source data 5
The original blots for mammalian target of rapamycin (mTOR).
- https://cdn.elifesciences.org/articles/80638/elife-80638-fig5-data5-v1.pdf
-
Figure 5—source data 6
The original blots for phosphorylated mammalian target of rapamycin (p-mTOR).
- https://cdn.elifesciences.org/articles/80638/elife-80638-fig5-data6-v1.pdf
-
Figure 5—source data 7
The original blots for glyceraldehyde-3-phosphate dehydrogenase (GAPDH) (for mammalian target of rapamycin [mTOR]).
- https://cdn.elifesciences.org/articles/80638/elife-80638-fig5-data7-v1.pdf
Tables
Table 1
CLD patient baseline clinical and biochemical profiles of CLD patients.
| n=73 | |
|---|---|
| Age, years | 71.0±11.0 |
| Gender, male/female | 58/15 |
| Etiology, HBV/HCV/nonalcoholic steatohepatitis/alcohol/others | 13/21/21/16/2 |
| Barcelona Clinic Liver Cancer (0 /A/B/C/D) | 11/29/13/19/1 |
| Albumin, g/dL | 4.04±0.49 |
| Total bilirubin, mg/dL | 1.00±0.53 |
| Albumin-bilirubin | –2.65±0.48 |
| Prothrombin time, % | 87.6±18.7 |
| Psoas muscle mass index, cm2/m2 | 5.13±1.99 |
-
Data are presented as number of patients, mean ± SD.
-
CLD, chronic liver disease.
-
Table 1—source data 1
Serum albumin, total bilirubin, albumin-bilirubin (ALBI), prothrombin time, and psoas muscle mass index (PMI) in chronic liver disease (CLD) patients.
- https://cdn.elifesciences.org/articles/80638/elife-80638-table1-data1-v1.xlsx
Table 2
Baseline bile acids composition.
| n=73 (mmol/L) | |
|---|---|
| Total bile acids | 18.3±17.0 |
| Total of primary bile acids | 12.7±14.0 |
| Cholic acid | 1.30±3.28 |
| Glycocholic acid | 1.71±2.86 |
| Taurocholic acid | 0.35±0.78 |
| Chenodeoxycholic acid | 2.68±4.78 |
| Glycochenodeoxycholic acid | 4.69±5.64 |
| Taurochenodeoxycholic acid | 1.95±4.03 |
| Total of secondary bile acids | 5.58±7.91 |
| Deoxycholic acid | 0.89±1.19 |
| Glycodeoxycholic acid | 0.99±1.88 |
| Taurodeoxycholic acid | 0.19±0.46 |
| Lithocholic acid | 0.067±0.112 |
| Glycolithocholic acid | 0.020±0.048 |
| Taurolithocholic acid | 0.003±0.013 |
| Ursodeoxycholic acid | 1.13±2.38 |
| Glycoursodeoxycholic acid | 2.21±5.56 |
| Tauroursodeoxycholic acid | 0.07±0.24 |
-
Data are presented as number of patients, mean ± SD.
-
Table 2—source data 1
Serum total bile acids (BAs), total primary BAs, total secondary BAs, and BAs composition in chronic liver disease (CLD) patients.
- https://cdn.elifesciences.org/articles/80638/elife-80638-table2-data1-v1.xlsx
Additional files
-
MDAR checklist
- https://cdn.elifesciences.org/articles/80638/elife-80638-mdarchecklist1-v1.docx
-
Supplementary file 1
Primer list for quantative PCR.
- https://cdn.elifesciences.org/articles/80638/elife-80638-supp1-v1.docx
Download links
A two-part list of links to download the article, or parts of the article, in various formats.
Downloads (link to download the article as PDF)
Open citations (links to open the citations from this article in various online reference manager services)
Cite this article (links to download the citations from this article in formats compatible with various reference manager tools)
Association of lithocholic acid with skeletal muscle hypertrophy through TGR5-IGF-1 and skeletal muscle mass in cultured mouse myotubes, chronic liver disease rats and humans
eLife 11:e80638.
https://doi.org/10.7554/eLife.80638


