Activity-based CRISPR scanning uncovers allostery in DNA methylation maintenance machinery
- Department of Chemistry and Chemical Biology, Harvard University, United States
- Broad Institute of MIT and Harvard, United States
Figures
Figure 1 with 1 supplement
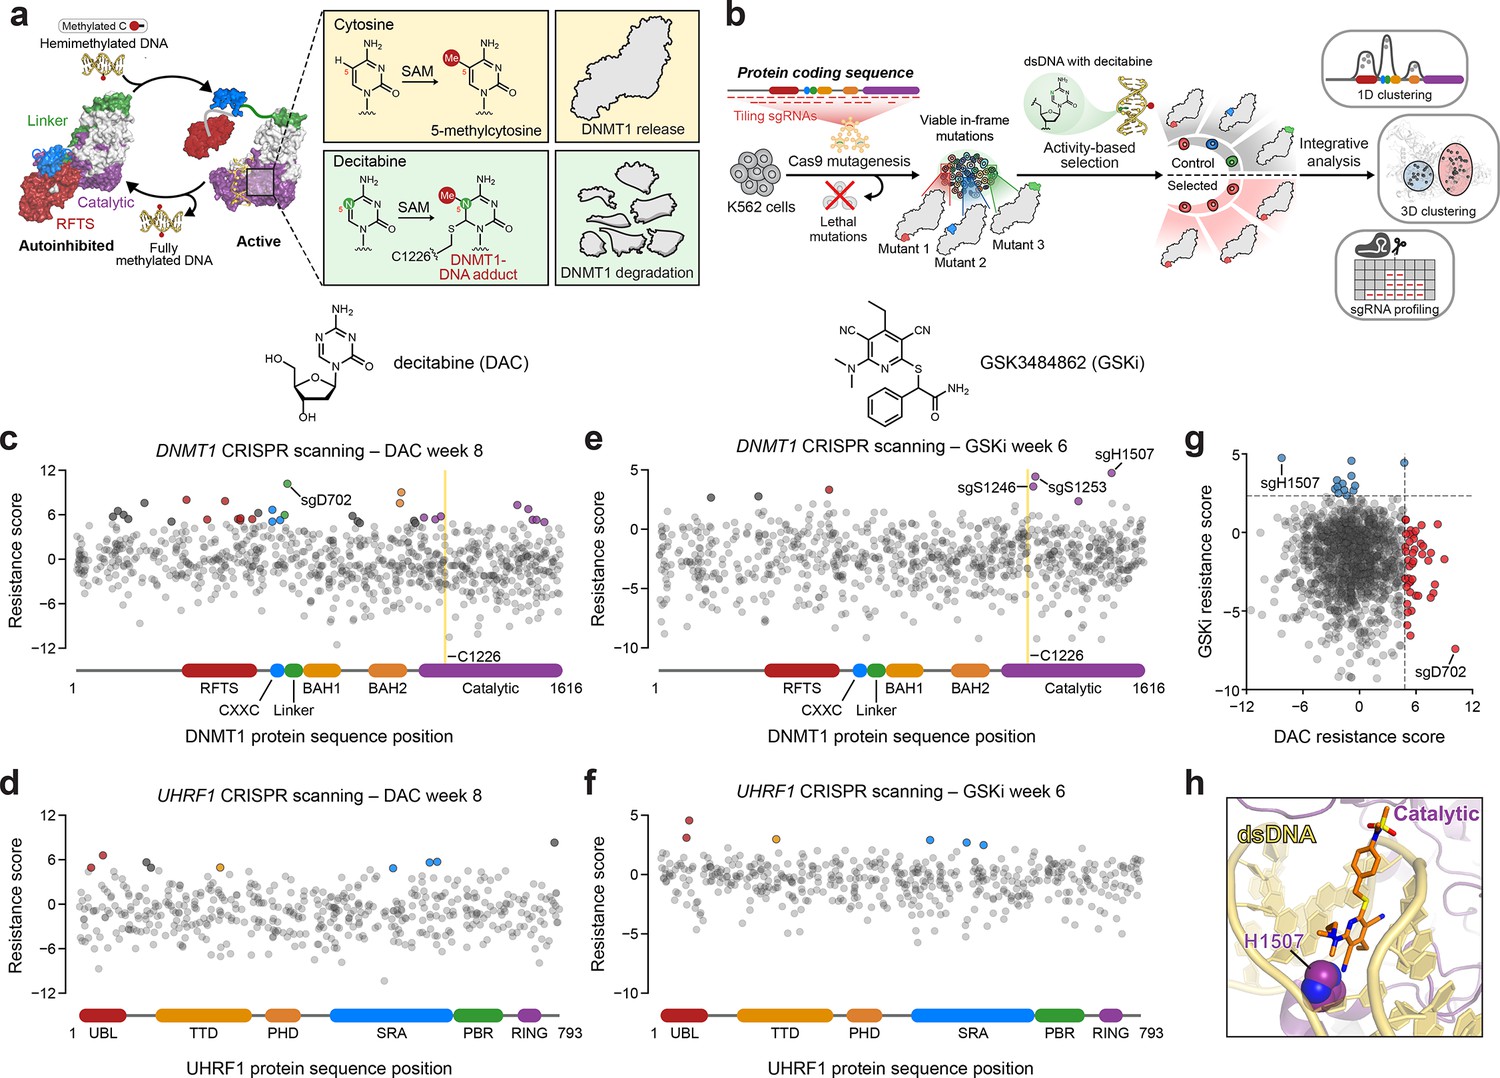
Activity-based CRISPR scanning of DNMT1 and UHRF1.
(a) Schematic showing surface representations of the autoinhibited (PDB: 4WXX) and active (PDB: 4DA4) conformations of DNMT1 and DNMT1-mediated methylation of cytosine and decitabine (DAC). Methylation of DAC leads to the formation of a covalent DNMT1–DNA adduct and subsequent proteasomal degradation. SAM, S-adenosyl-l-methionine. (b) Schematic of the activity-based CRISPR scanning workflow. K562 cells were transduced with a pooled single-guide RNA (sgRNA) library targeting both DNMT1 and UHRF1 and treated with vehicle or DAC for 8 weeks. DAC treatment was performed at 100 nM for 5 weeks, followed by 1 μM for 3 weeks. For CRISPR-suppressor scanning experiments using GSK3484862 (GSKi), cells were treated with vehicle or GSKi for 6 weeks. GSKi treatment was performed at 1 μM for 3 weeks, followed by 5 μM for 3 weeks. Genomic DNA was isolated from vehicle- and drug-treated cells and sequenced to determine sgRNA abundance. Scatter plots showing resistance scores (y-axis) for sgRNAs targeting DNMT1 (c, e, n = 830) and UHRF1 (d, f, n = 475) in K562 cells after 8 weeks of DAC treatment (c, d) or 6 weeks of GSK3484862 (GSKi) treatment (e, f). Resistance scores were calculated as the log2(fold-change) of sgRNA frequencies in drug versus vehicle treatment, followed by normalization to the mean of the negative control sgRNAs (n = 77). The sgRNAs are arrayed by amino acid position in the DNMT1 and UHRF1 coding sequences (x-axis) corresponding to the positions of their predicted cut sites. Protein domains are demarcated by the colored bars along the x-axis. The yellow bands in (c) and (e) demarcate the position of the catalytic cysteine (C1226) in the DNMT1 active site. Data points represent the mean resistance score across three replicate treatments. Enriched sgRNAs with resistance scores greater than 2 standard deviations (SDs) above the mean of the negative control sgRNAs are colored by their corresponding domain. (g) Scatter plot showing resistance scores of DNMT1- and UHRF1-targeting sgRNAs after 8 weeks of DAC treatment (x-axis) or 6 weeks of GSKi treatment (y-axis). Dotted lines represent two SDs above the mean of the negative control sgRNAs. sgRNAs that are enriched in DAC or GSKi treatment are colored in red and blue, respectively. (h) Structural view of DNMT1 complexed to DNA (yellow) with GSK3830052 (orange), a structural analog of GSK3484862, highlighting the location of H1507 (spheres) in the catalytic domain (purple), which is targeted by the top enriched sgRNA in the GSKi screen (PDB: 6X9J).
Figure 1—figure supplement 1
Activity-based CRISPR scanning of DNMT1 and UHRF1.
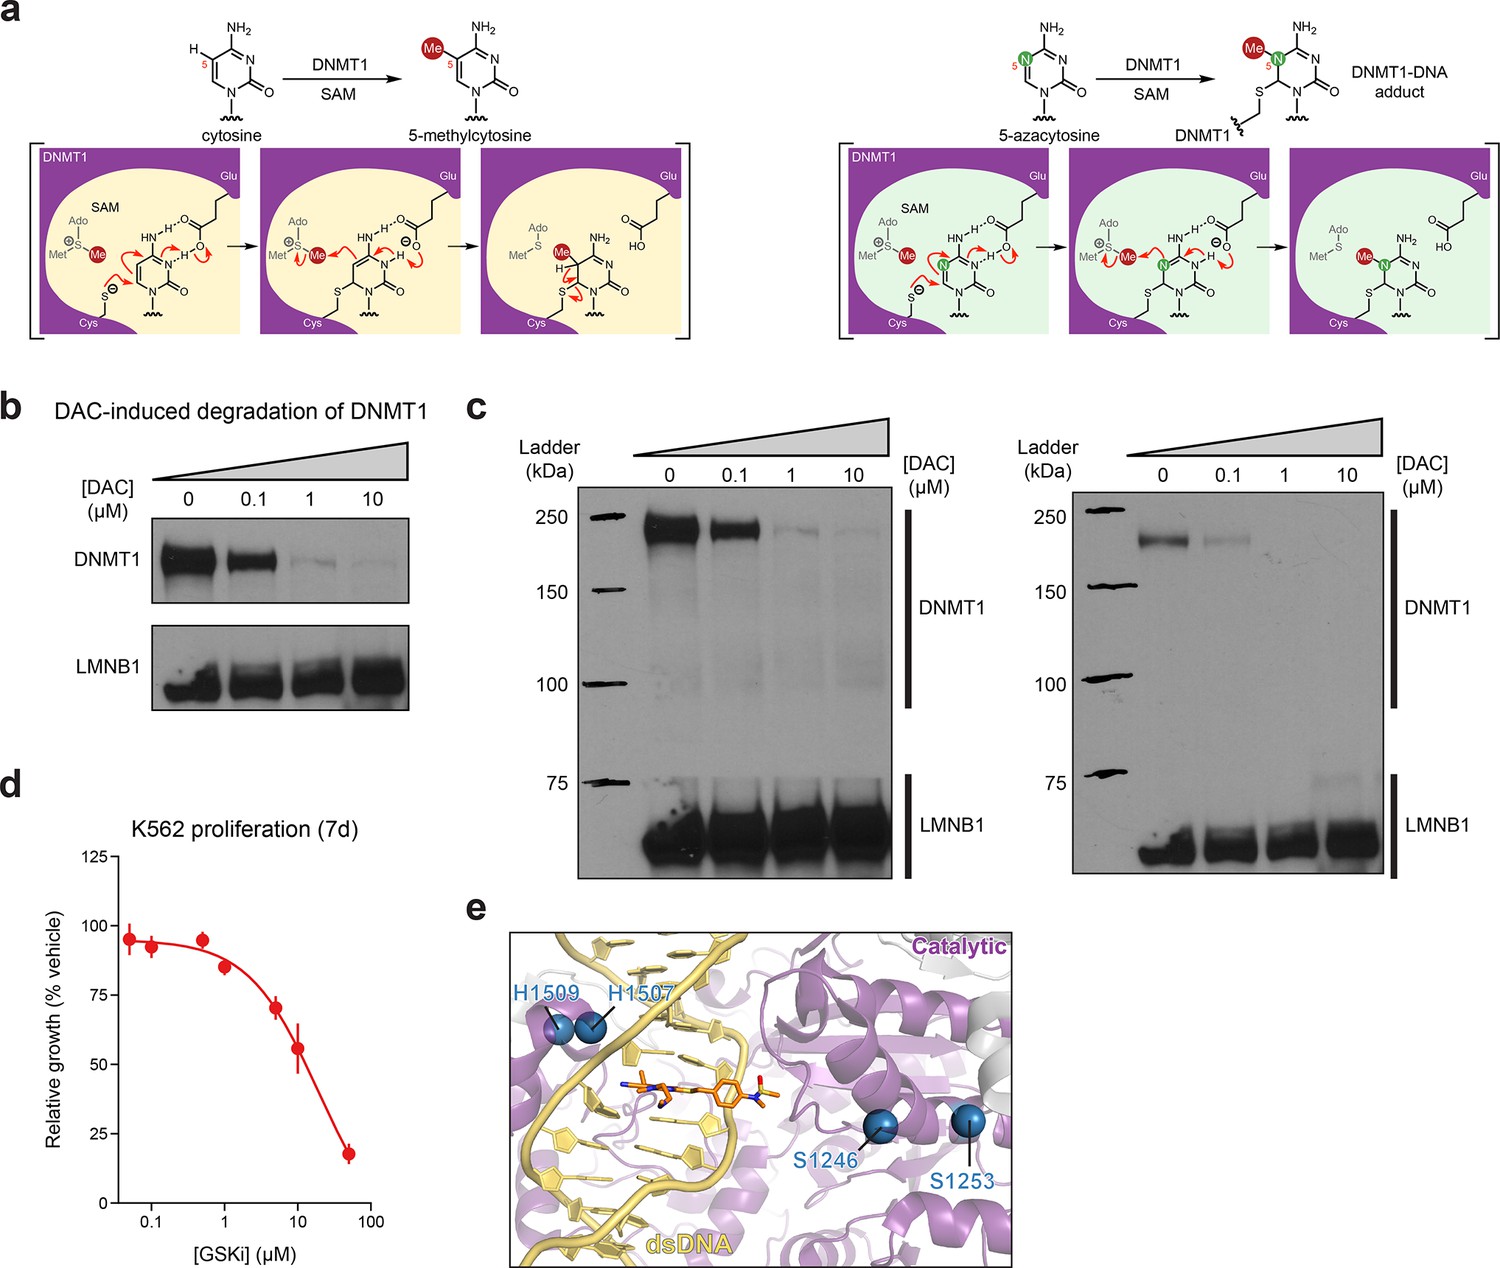
(a) Schematic showing key intermediate steps in the mechanism of DNMT1-catalyzed methylation of cytosine (left) and 5-azacytosine (right), the cytosine analog found in decitabine (DAC). Nucleophilic attack on cytosine C6 by the catalytic cysteine (Cys1226 in human DNMT1) leads to the formation of a DNMT1–DNA covalent intermediate. Deprotonation of N3 by a conserved glutamic acid residue (Glu1266 in human DNMT1) facilitates the transfer of the methyl group from S-adenosyl-l-methionine (SAM) to the cytosine C5 position. Finally, deprotonation at the C5 position leads to β-elimination of the thiolate, releasing DNMT1 from the DNA. Conversely, the replacement of C5 with a nitrogen in the 5-azacytosine moiety of DAC prevents this final β-elimination step and dissociation of DNMT1, thus leading to the formation of a covalent DNMT1–DNA adduct. (b) Immunoblot showing DAC-induced degradation of DNMT1 in K562 cells after 48 hr of treatment at the indicated concentrations of DAC. One of two independent experiments is shown. The loading control (LMNB1) shown is taken from a separate exposure of the same blot. Uncropped images of the two exposures are shown in (c). Full unedited blot images are provided in Figure 1—figure supplement 1—source data 1 and annotated full blot images are provided in Figure 1—figure supplement 1—source data 2. (c) Uncropped images of the immunoblots shown in (b). Bands for DNMT1 were taken from the exposure on the left. The loading control (LMNB1) bands were taken from the exposure on the right. (d) Dose–response curve showing cellular proliferation (y-axis) of wild-type K562 cells after treatment with GSK3484862 (GSKi, x-axis) for 7 days. Relative cellular proliferation was calculated as the percent growth relative to vehicle treatment. The line represents a 4-parameter logistic regression fitted to the data. Data represent the mean ± standard error of the mean (SEM) across three replicates. One of two independent experiments is shown. (e) Structural view of DNMT1 complexed to DNA (yellow) in the presence of GSK3830052 (orange). Drug-proximal residues within the DNMT1 catalytic domain (purple) targeted by enriched single-guide RNAs (sgRNAs) are highlighted as blue spheres (PDB: 6X9J).
-
Figure 1—figure supplement 1—source data 1
Raw unedited blot image for the blot shown in Figure 1—figure supplement 1B.
- https://cdn.elifesciences.org/articles/80640/elife-80640-fig1-figsupp1-data1-v3.zip
-
Figure 1—figure supplement 1—source data 2
Annotated unedited blot image for the blot shown in Figure 1—figure supplement 1B.
- https://cdn.elifesciences.org/articles/80640/elife-80640-fig1-figsupp1-data2-v3.zip
Figure 2 with 1 supplement
Linear and spatial clustering of CRISPR scanning data identifies putative hotspots in DNMT1 that modulate enzyme activity.
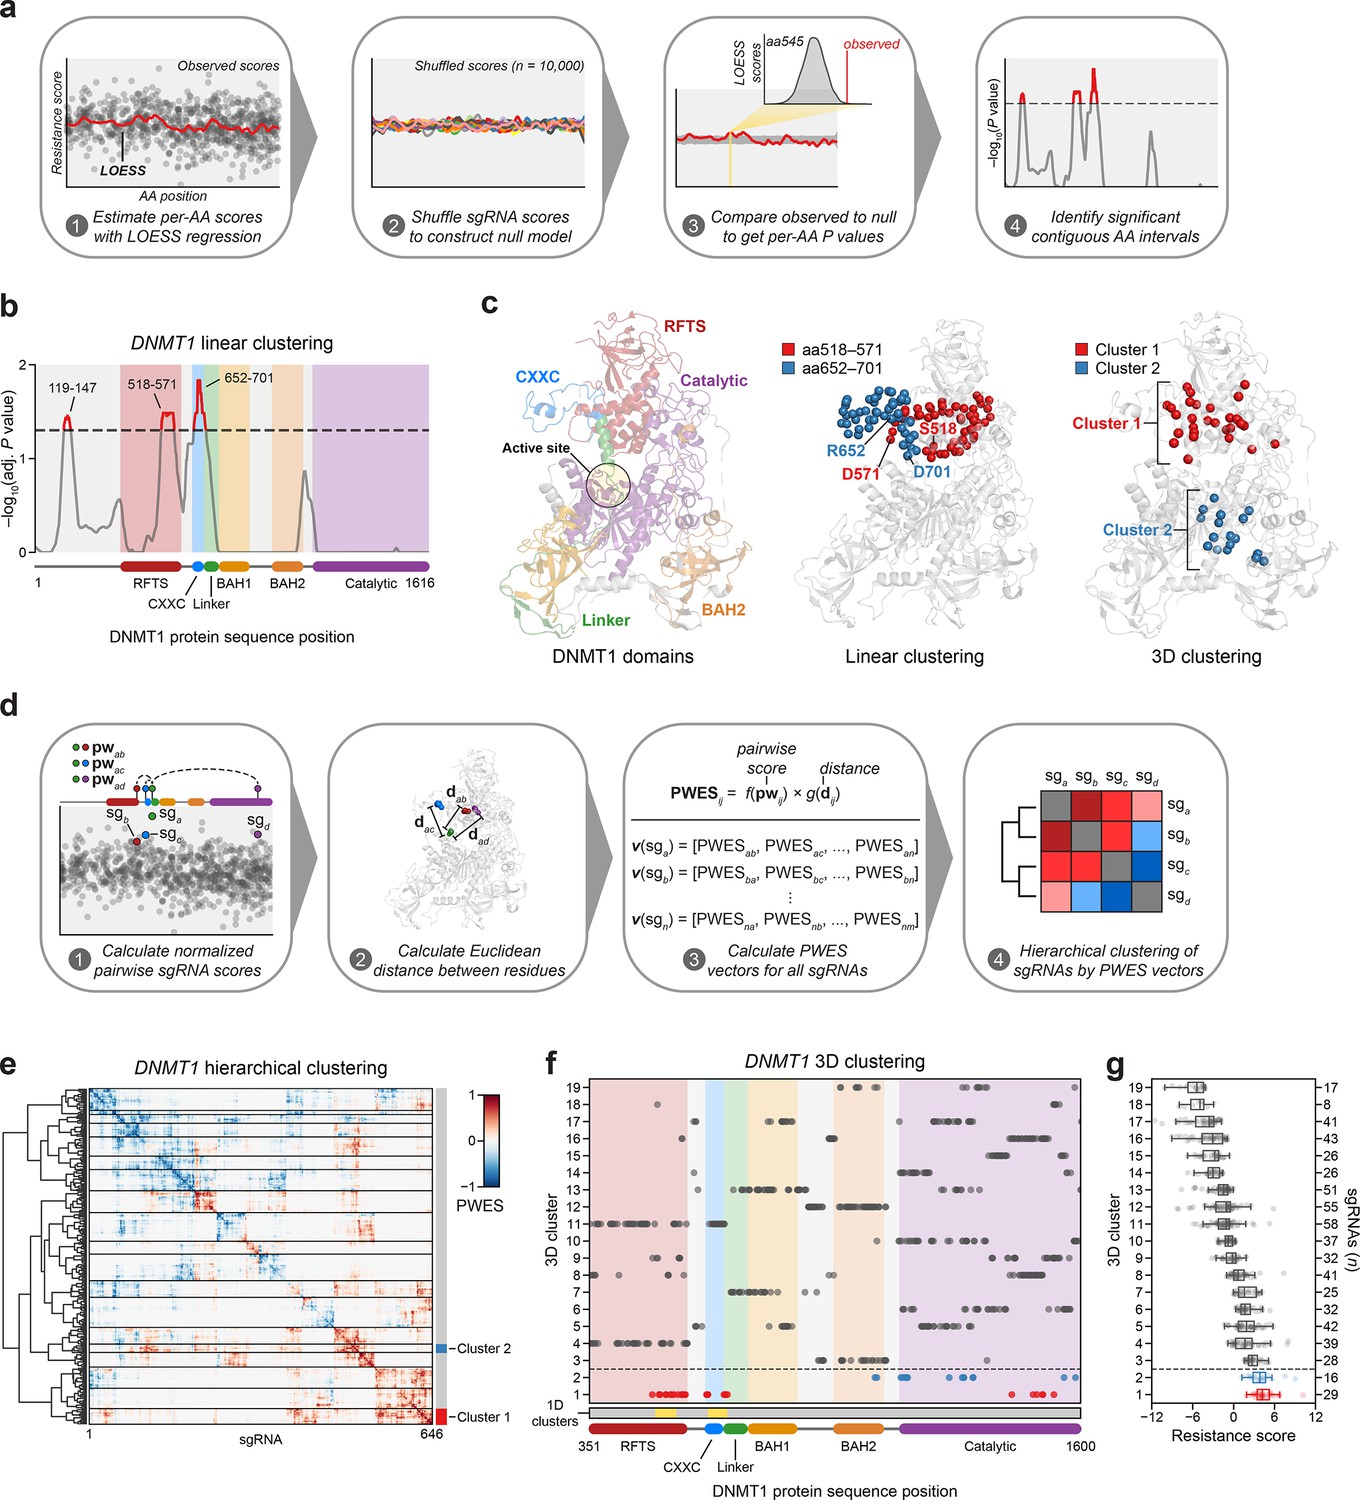
(a) Overview of the linear clustering workflow. LOESS regression and interpolation are applied to the single-guide RNA (sgRNA) resistance scores to estimate per-residue resistance scores for the entire protein coding sequence. sgRNA scores are then shuffled (n = 10,000 iterations) and per-residue resistance scores are recalculated to simulate a null model of random enrichment. Empirical P values for each amino acid are determined by comparing the observed score to the simulated distribution and adjusted with the Benjamini–Hochberg procedure. Linear clusters are defined as contiguous intervals of amino acids with adjusted P values ≤0.05. (b) Line plot showing −log10-transformed adjusted P values for the observed per-residue resistance scores (y-axis) plotted against the DNMT1 CDS (x-axis). DNMT1 domains are demarcated by the colored background and bars along the x-axis. The dotted line corresponds to P = 0.05 and residues with P ≤ 0.05 are highlighted in red with linear clusters annotated. (c) Structural views of autoinhibited DNMT1 (PDB: 4WXX) highlighting its domains (left panel), the linear clusters (middle panel) spanning aa518–571 (red spheres) and aa652–701 (blue spheres), and the 3D clusters (right panel) 1 (red spheres) and 2 (blue spheres). The linear cluster spanning aa119–147 is not resolved in the structure. The DNMT1 active site is denoted (yellow circle) in the left panel. (d) Overview of the 3D clustering workflow. Normalized pairwise resistance scores for sgRNAs are calculated and then scaled relative to the Euclidean distance between their targeted residues in the structural data to generate the final proximity-weighted enrichment score (PWES) for all possible pairwise sgRNA combinations. Each row or column in the resultant PWES matrix thus represents a vector of PWES values for a single sgRNA against all other sgRNAs targeting resolved residues. Hierarchical clustering is applied to the PWES matrix to group sgRNAs by similarities in their overall PWES profiles. (e) Heatmap depicting the PWES matrix of all pairwise combinations of sgRNAs (n = 646) targeting resolved residues in the structure of autoinhibited DNMT1 (PDB: 4WXX). sgRNAs are grouped by cluster, with black lines demarcating each cluster on the heatmap. Cluster 1 sgRNAs (n = 29) and cluster 2 sgRNAs (n = 16) are highlighted in red and blue, respectively. (f) Scatter plot showing the targeted amino acid positions of the DNMT1-targeting sgRNAs used in the 3D clustering analysis. sgRNAs are grouped by 3D cluster (y-axis) derived from (e) and plotted against the DNMT1 CDS (x-axis). Clusters are numbered by the mean resistance score of their component sgRNAs, with cluster 1 representing the greatest mean resistance score. Clusters 1 and 2 are highlighted in red and blue, respectively. Amino acid intervals corresponding to the linear clusters in (b) are highlighted in yellow. (g) Box plot showing the sgRNA resistance scores (x-axis) for each of the 3D clusters (y-axis, left) derived from (e, f). The number of sgRNAs per cluster is shown on the y-axis (right) and individual sgRNAs within each cluster are shown as points. Clusters 1 and 2 are highlighted in red and blue, respectively. The central band, box boundaries, and whiskers represent the median, interquartile range (IQR), and 1.5 × IQR, respectively.
Figure 2—figure supplement 1
Linear and spatial clustering of CRISPR scanning data identifies putative hotspots in DNMT1 that modulate enzyme activity.
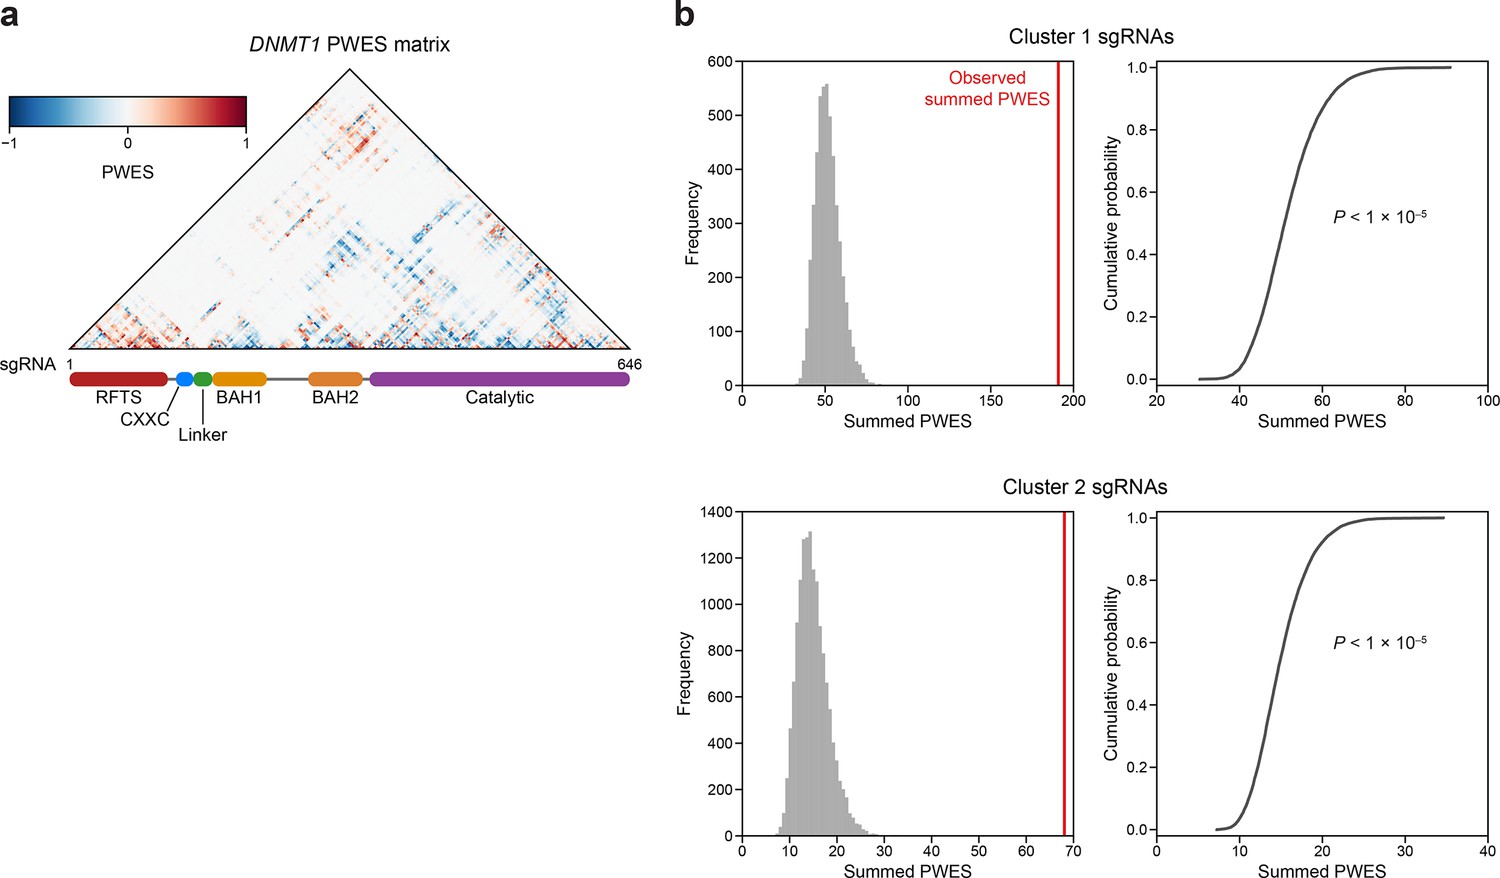
(a) Heatmap depicting the proximity-weighted enrichment score (PWES) matrix of all pairwise combinations of single-guide RNAs (sgRNAs) (n = 646) targeting resolved residues in the structure of autoinhibited DNMT1 (PDB: 4WXX). sgRNAs are ordered by their targeted amino acid position on the DNMT1 coding sequence. (b) Histograms (left) and corresponding empirical cumulative distribution functions (ECDF, right) showing the simulated distribution of summed PWES values for cluster 1 (top) and cluster 2 (right) and the observed summed PWES value (red line). Summed PWES values were calculated as the sum of the absolute values of all intra-cluster PWES values. The simulated distribution was generated by shuffling the targeted amino acid positions of the sgRNAs and recalculating the summed PWES for n = 10,000 iterations. Empirical P values were calculated for clusters 1 and 2 as 1 − ECDF(observed summed PWES value) and shown on the ECDF plots (right).
Figure 3 with 1 supplement
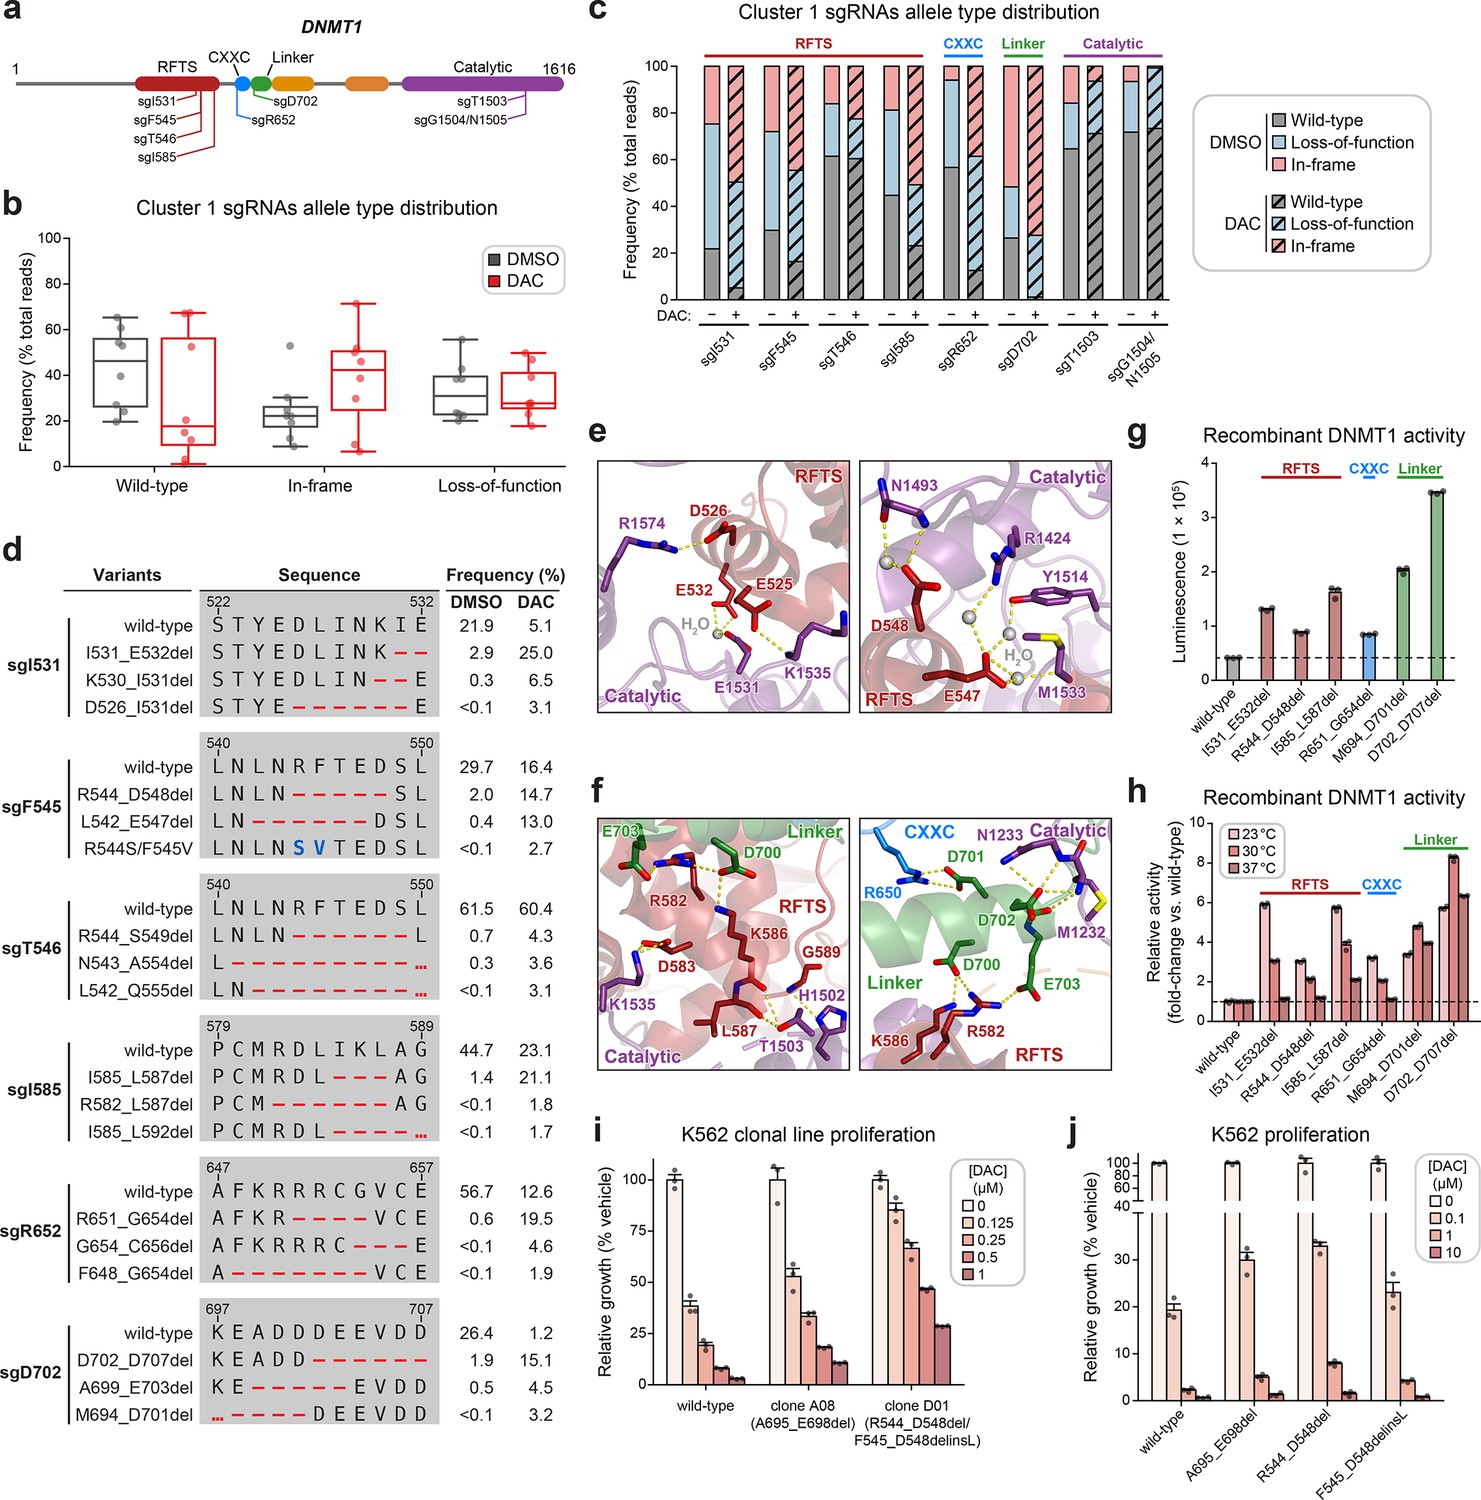
Cluster 1 single-guide RNAs (sgRNAs) generate hypermorphic DNMT1 mutations in the RFTS, CXXC, and linker regions that abrogate autoinhibition.
(a) Schematic showing the amino acid positions on the DNMT1 CDS targeted by selected cluster 1 sgRNAs (n = 8). (b) Box plots showing the observed frequencies (percentage of total reads, y-axis) of wild-type, in-frame, and loss-of-function alleles (x-axis) after 8 weeks of treatment with vehicle (gray) or 100 nM decitabine (DAC, red) for the cluster 1 sgRNAs shown in (a). Individual sgRNAs are shown as points. The central band, box boundaries, and whiskers represent the median, interquartile range (IQR), and 1.5 × IQR, respectively. (c) Stacked bar plot showing the observed frequencies (percentage of total reads, y-axis) of wild-type, in-frame, and loss-of-function alleles for selected cluster 1 sgRNAs (x-axis) after 8 weeks of treatment with vehicle or 100 nM DAC. (d) Table showing the amino acid sequence alignment and observed frequencies (percentage of total reads) of the wild-type and top enriched in-frame variants across cluster 1 sgRNAs after 8 weeks of treatment with vehicle or 100 nM DAC. In-frame variants were considered enriched if the observed frequency in DAC treatment was ≥1% and the log2(fold-change) of the observed frequency in DAC versus vehicle treatment was ≥2. Enriched in-frame variants meeting these criteria were sorted by their observed frequency in DAC treatment and the top 3 most abundant are shown. sgT1503 and sgG1504/N1505 were excluded due to the lack of enriched in-frame variants. Amino acid deletions are represented as red dashes and substitutions are highlighted in blue. Red ellipses are used to denote amino acid deletions that exceed the length of the shown sequence alignment. (e, f) Structural views of various regions of the DNMT1 autoinhibitory interface (PDB: 4WXX) perturbed by enriched in-frame variants (from d) generated by cluster 1 sgRNAs. The panels highlight key inter-domain interactions disrupted by sgI531 (e, left), sgF545/sgT546 (e, right), and sgI585/sgR652/sgD702 (f). Key residues in the RFTS (red), CXXC (blue), linker (green), and catalytic (purple) domains that mediate polar contacts are shown as sticks. Hydrogen bonds are represented by dotted yellow lines and water molecules are depicted as gray spheres. (g) Bar plot showing recombinant DNMT1 enzyme activity (luminescence, y-axis) for wild-type DNMT1 and selected cluster 1 variants (from d, x-axis) in the luminescence-based MTase-Glo assay. Wild-type is depicted in gray and variants are colored according to the domain in which the mutation is located. The dotted line represents the mean luminescence of the wild-type DNMT1 construct. (h) Bar plot showing the relative enzyme activity (y-axis) of recombinant DNMT1 constructs (x-axis) in the MTase-Glo assay at the indicated temperatures. Relative enzyme activity was calculated as the fold-change in luminescence for the given construct relative to the wild-type construct at the specified temperature. The dotted line represents the mean activity of the wild-type construct. (i) Bar plot showing the relative cellular proliferation (y-axis) of wild-type and clonal DNMT1-mutated K562 cells (x-axis) treated with vehicle or DAC for 7 days. Relative cellular proliferation was calculated as the percent growth relative to vehicle treatment. (j) Bar plot showing the relative cellular proliferation (y-axis) of K562 cells treated with vehicle or DAC for 7 days following lentiviral transduction with vectors expressing a short hairpin RNA targeting endogenous DNMT1 transcripts and the specified DNMT1 construct (x-axis). Relative cellular proliferation was calculated as the percent growth relative to vehicle treatment. For bar plots in (g–j), bars represent the mean ± standard error of the mean (SEM) across three replicates and one of two independent experiments is shown.
Figure 3—figure supplement 1
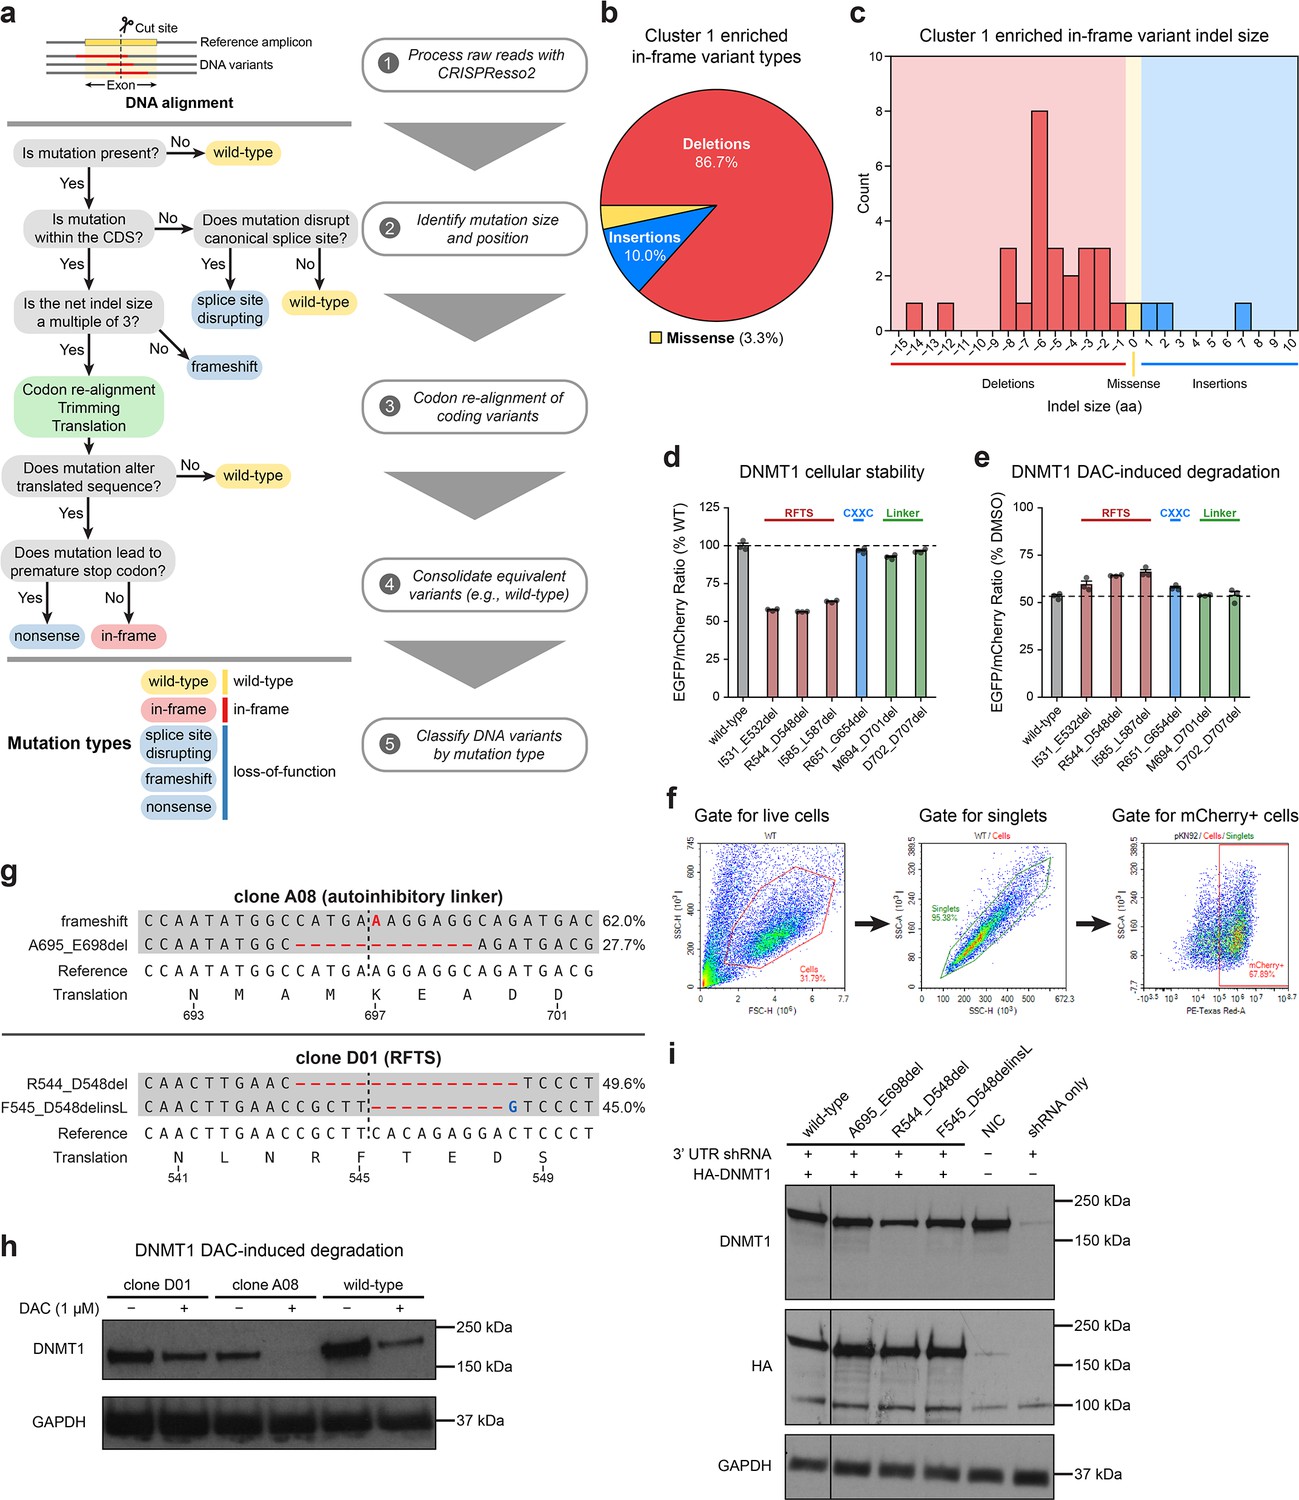
Cluster 1 single-guide RNAs (sgRNAs) generate hypermorphic DNMT1 mutations in the RFTS, CXXC, and linker regions that abrogate autoinhibition.
(a) Overview of the individual sgRNA mutational profiling and variant identification workflow. Raw sequencing data were first processed with CRISPResso2 (Clement et al., 2019) to align and quantify DNA variants. These DNA variants were then processed by a custom pipeline and classified by mutation type (represented as a decision tree in steps 2–4). In-frame variants were re-aligned, trimmed, and translated to generate the protein variant alignment tables shown in Figure 3 and Figure 5. Splice site disrupting, frameshift, and nonsense mutations were combined into a single ‘loss-of-function’ mutation type for downstream analysis. (b) Pie chart depicting the mutation type breakdown (e.g., insertion, deletion, missense) of enriched in-frame variants (n = 30) found in the selected cluster 1 sgRNAs (see Figure 3a, d). In-frame variants were considered enriched if the observed frequency in decitabine (DAC) treatment was ≥1% and the log2(fold-change) of the observed frequency in DAC versus vehicle treatment was ≥2. sgT1503 and sgG1504/N1505 were excluded due to the lack of enriched in-frame variants. (c) Bar chart showing the observed frequency (counts, y-axis) distribution of insertion (right, blue) and deletion (left, red) sizes (x-axis) for the enriched in-frame variants found in cluster 1 sgRNAs (from b). Missense mutations are highlighted in yellow. (d) Bar plot showing the cellular stability of wild-type DNMT1 and selected cluster 1 variants (x-axis) in K562 cells as measured by the EGFP–IRES–mCherry fluorescence reporter system. Stability was calculated as the EGFP/mCherry ratio of the construct normalized to the EGFP/mCherry ratio of wild-type DNMT1 after 3 days of vehicle treatment (percentage of wild-type EGFP/mCherry ratio, y-axis). The dotted line represents the mean stability of the wild-type DNMT1 construct. Bars represent the mean ± standard error of the mean (SEM) across three replicates. One of two independent experiments is shown. (e) Bar plot showing DAC-mediated degradation of wild-type DNMT1 and selected cluster 1 variants (x-axis) in K562 cells as measured by the EGFP–IRES–mCherry fluorescence reporter system. Degradation was calculated for each construct as the EGFP/mCherry ratio of the construct in DAC treatment normalized to vehicle treatment (percentage of DMSO EGFP/mCherry ratio, y-axis). Cells were treated with vehicle or 100 nM DAC for 3 days. The dotted line represents the mean degradation of the wild-type DNMT1 construct. Bars represent the mean ± SEM across three replicates. One of two independent experiments is shown. (f) Flow cytometry pseudocolor density plots demonstrating the representative gating strategy used in the cellular fluorescent protein reporter assays to select mCherry-positive cells for analysis. The plots shown are taken from K562 cells expressing WT DNMT1–EGFP–IRES–mCherry after 3 days of vehicle treatment. Plots are representative of two independent experiments. (g) Schematic depicting the genotypes and coding variants identified in the DNMT1-mutated clonal K562 cell lines. Red dashes represent deletions. Bases highlighted in red and blue represent insertions and substitutions, respectively. (h) Immunoblot showing DAC-induced degradation of DNMT1 in wild-type and DNMT1-mutated clonal K562 cells after treatment with vehicle or 1 μM DAC for 3 days. One of two independent experiments is shown. Full unedited blot images are provided in Figure 3—figure supplement 1—source data 1 and annotated full blot images are provided in Figure 3—figure supplement 1—source data 2. (i) Immunoblot showing DNMT1 expression levels in K562 cells following lentiviral transduction with plasmids expressing a short hairpin RNA (shRNA) targeting the 3′ untranslated region (UTR) of DNMT1 and wild-type or mutant HA–DNMT1 constructs. Immunoblots of DNMT1 were first performed with anti-DNMT1 antibody, then stripped and re-probed with anti-HA antibody. One of two independent experiments is shown. NIC, no infection control. Full unedited blot images are provided in Figure 3—figure supplement 1—source data 3 and annotated full blot images are provided in Figure 3—figure supplement 1—source data 4.
-
Figure 3—figure supplement 1—source data 1
Raw unedited blot image for the blot shown in Figure 3—figure supplement 1H.
- https://cdn.elifesciences.org/articles/80640/elife-80640-fig3-figsupp1-data1-v3.zip
-
Figure 3—figure supplement 1—source data 2
Annotated unedited blot image for the blot shown in Figure 3—figure supplement 1H.
- https://cdn.elifesciences.org/articles/80640/elife-80640-fig3-figsupp1-data2-v3.zip
-
Figure 3—figure supplement 1—source data 3
Raw unedited blot image for the blot shown in Figure 3—figure supplement 1I.
- https://cdn.elifesciences.org/articles/80640/elife-80640-fig3-figsupp1-data3-v3.zip
-
Figure 3—figure supplement 1—source data 4
Annotated unedited blot image for the blot shown in Figure 3—figure supplement 1I.
- https://cdn.elifesciences.org/articles/80640/elife-80640-fig3-figsupp1-data4-v3.zip
Figure 4 with 1 supplement
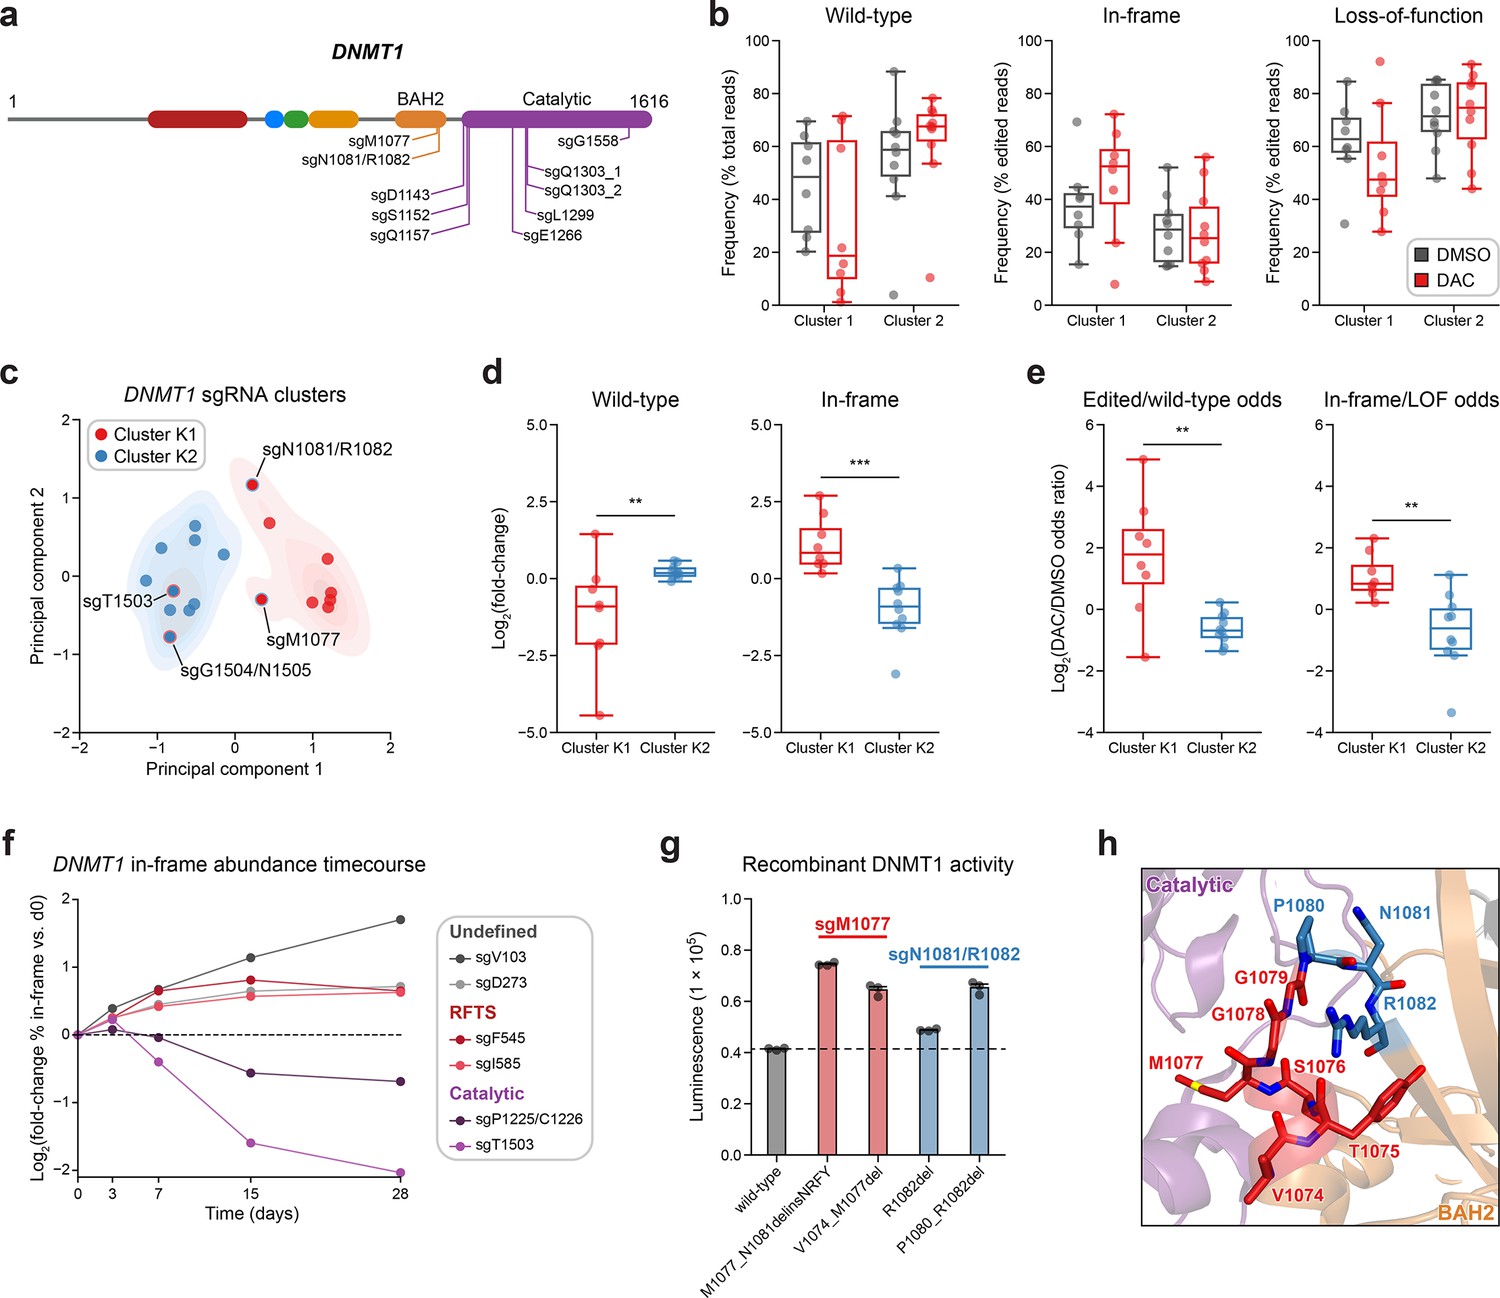
Integrative analysis reveals distinct mutational profiles between cluster 1 and 2 single-guide RNAs (sgRNAs).
(a) Schematic showing the amino acid positions on the DNMT1 CDS targeted by selected cluster 2 sgRNAs (n = 10). (b) Box plots showing the observed frequencies (y-axis) of wild-type, in-frame, and loss-of-function (LOF) alleles (x-axis) after 8 weeks of treatment with vehicle (gray) or 100 nM decitabine (DAC, red) for cluster 1 (n = 8, from Figure 3a) and cluster 2 sgRNAs (n = 10, from a). Wild-type allele frequencies are plotted as the percentage of total reads. In-frame and loss-of-function allele frequencies are plotted as the percentage of edited (i.e., non-wild-type) reads. (c) Scatter plot showing DNMT1-targeting sgRNAs from clusters 1 and 2 (n = 18) projected onto principal component space after principal component analysis on features of their mutational profiles. The sgRNAs were partitioned using k-means clustering (k = 2) to identify clusters K1 (red) and K2 (blue), corresponding primarily to the original 3D clusters 1 and 2. sgRNAs reassigned from cluster 1 to K2 or cluster 2 to K1 are annotated and denoted with red and blue borders, respectively. Contours depict a bivariate kernel density estimation for clusters K1 (red) and K2 (blue). (d) Box plots showing the log2(fold-change) enrichment (y-axis) of wild-type (left) and in-frame variants (right) in DAC versus vehicle treatment for cluster K1 (n = 8, red) and K2 (n = 10, blue) sgRNAs. Log2(fold-change) was calculated based on the observed frequency (percentage of total reads) in DAC versus vehicle treatment. (e) Box plots showing the log2(odds ratio) in DAC versus vehicle treatment (y-axis) for edited versus wild-type odds (left) and in-frame versus LOF odds (right) for cluster K1 (red) and K2 (blue) sgRNAs. Edited/wild-type odds were calculated using absolute frequencies (percentage of total reads) and in-frame/LOF odds were calculated using relative frequencies (percentage of edited reads). (f) Line plot showing the relative abundance of in-frame mutations (y-axis) over time (x-axis) for individual sgRNAs (n = 6) targeting the DNMT1 N-terminus (‘Undefined’, gray), RFTS (red), and catalytic domains (purple). Relative in-frame abundance was calculated as the log2(fold-change) of the absolute frequency (percentage of total reads) of in-frame variants at the indicated time point versus day 0 and is represented by the colored points. Mutations were considered in-frame if they preserved the coding frame and did not disrupt a splice site or result in a premature stop codon. The dotted line corresponds to the relative abundance of in-frame mutations at day 0. (g) Bar plot showing recombinant DNMT1 enzyme activity (luminescence, y-axis) for wild-type DNMT1 and selected BAH2 variants (x-axis) enriched in sgM1077 (red) and sgN1081/R1082 (blue) in the luminescence-based MTase-Glo assay. The dotted line represents the mean luminescence of the wild-type DNMT1 construct. Bars represent the mean ± standard error of the mean (SEM) across three replicates. One of two independent experiments is shown. (h) Structural view of the DNMT1 BAH2 (yellow) region highlighting residues targeted by sgM1077 (red) and sgN1081/1082 (blue). The catalytic domain is shown in purple. Perturbed residues are shown as sticks and annotated (PDB: 4WXX). For box plots in (b, d, e) the individual sgRNAs are plotted as points and the central band, box boundaries, and whiskers represent the median, interquartile range (IQR), and 1.5 × IQR, respectively. P values (**P ≤ 0.01; ***P ≤ 0.001) were calculated with two-sided Mann–Whitney tests.
Figure 4—figure supplement 1
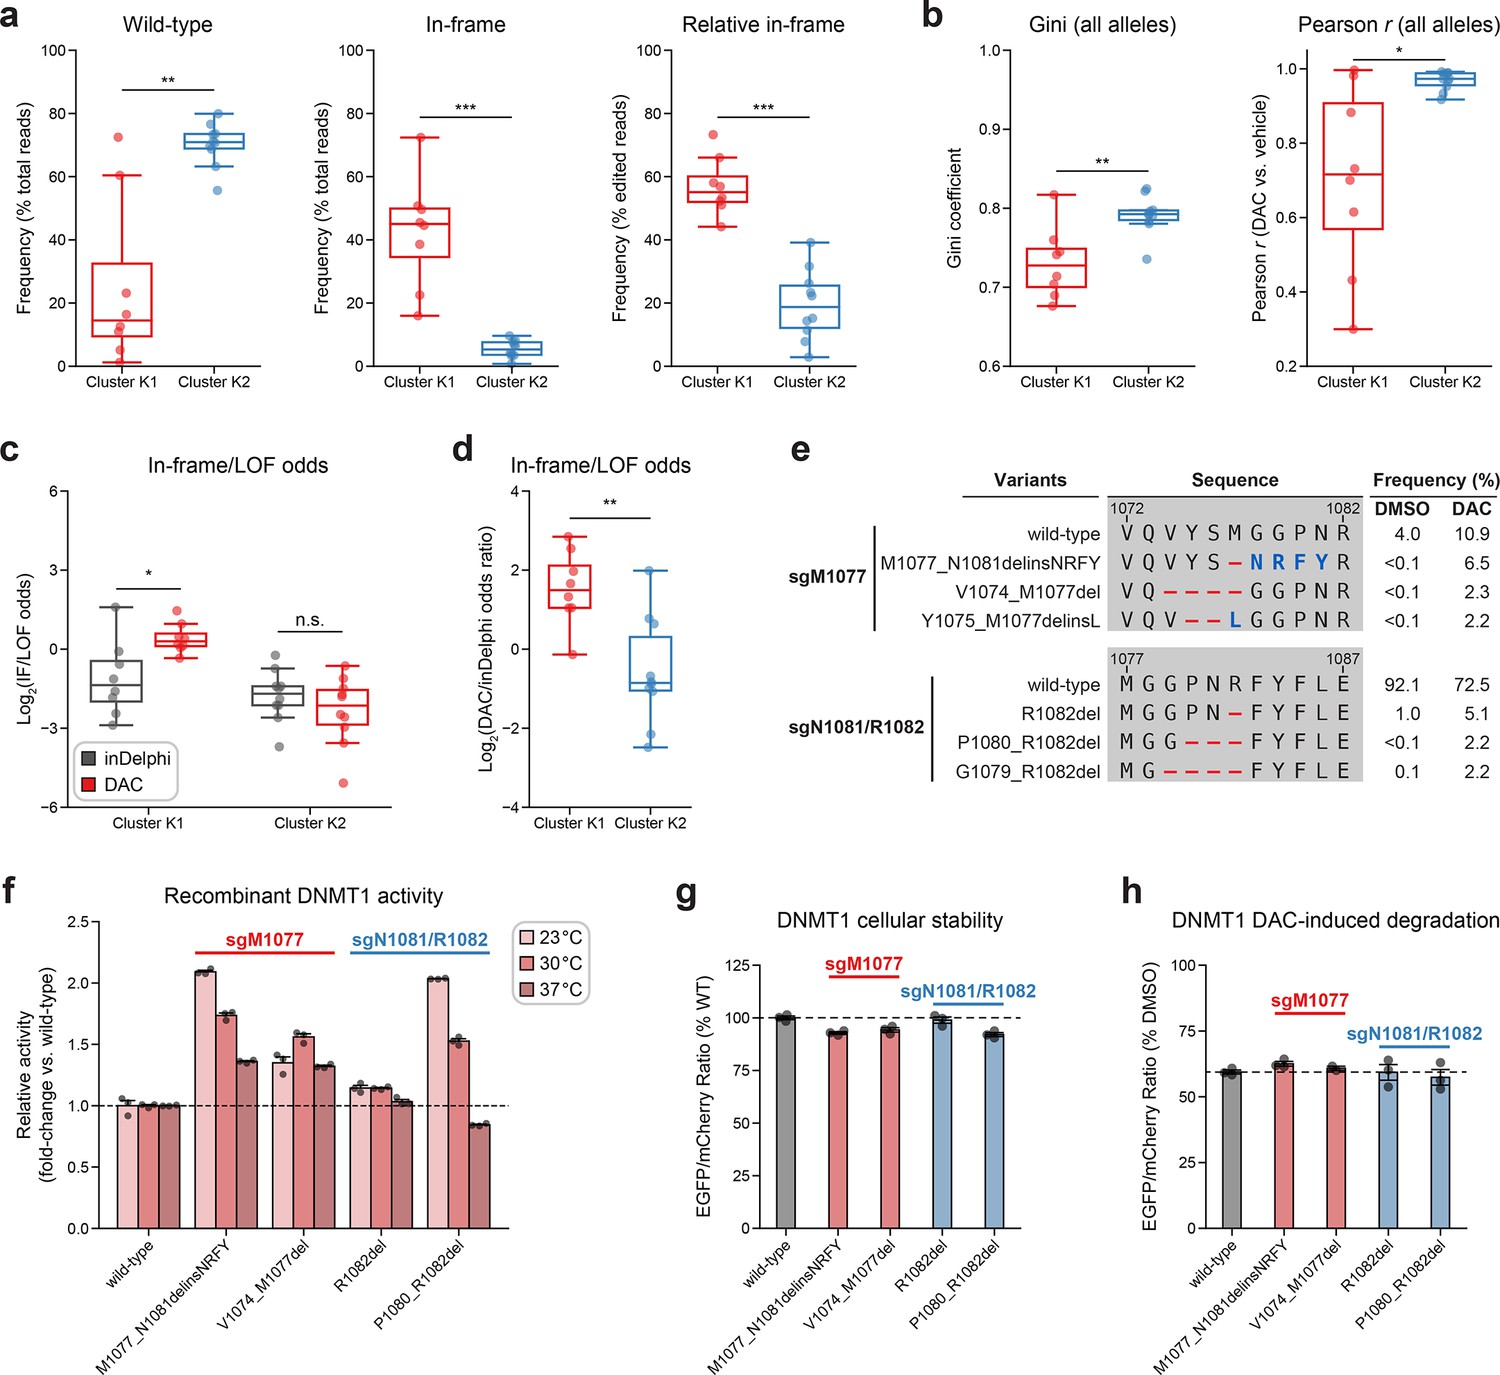
Integrative analysis reveals distinct mutational profiles between cluster 1 and 2 single-guide RNAs (sgRNAs).
(a, b) Box plots comparing various mutational profile metrics (y-axes) between cluster K1 (n = 8, red) and K2 (n = 10, blue) sgRNAs (x-axes). (a) The observed frequencies of wild-type (left) and in-frame (middle, right) variants in decitabine (DAC) treatment. Wild-type frequencies were calculated as the percentage of total reads. In-frame variant frequencies were calculated as a percentage of total reads (middle) and relative to the number of edited reads (right). (b) The Gini coefficient of the observed allele frequency distribution in DAC treatment (left) and Pearson correlations of variant frequencies in DAC versus vehicle treatment (right). Gini coefficients and Pearson correlations were calculated using the observed frequencies (percentage of total reads) of all alleles. (c) Box plots showing the log2(in-frame/LOF odds) for cluster K1 and K2 sgRNAs as predicted by inDelphi (gray) and as observed in DAC treatment (red). (d) Box plots showing the log2(odds ratio) for in-frame/LOF odds in DAC treatment versus inDelphi predictions (y-axis) for cluster K1 (red) and K2 (blue) sgRNAs. (e) Table showing the amino acid sequence alignment and observed frequencies (percentage of total reads) of the wild-type and top enriched in-frame variants in the BAH2-targeting sgRNAs sgM1077 (top) and sgN1081/R1082 (bottom) after 8 weeks of treatment with vehicle or 100 nM DAC. In-frame variants were considered enriched if the observed frequency in DAC treatment was ≥1% and the log2(fold-change) of the observed frequency in DAC versus vehicle treatment was ≥2. Enriched in-frame variants meeting these criteria were sorted by their observed frequency in DAC treatment and the top 3 most abundant are shown. Amino acid deletions are represented as red dashes and substitutions are highlighted in blue. (f) Bar plot showing the relative enzyme activity (y-axis) of recombinant DNMT1 constructs (x-axis) in the MTase-Glo assay at the indicated temperatures. Relative enzyme activity was calculated as the fold-change in luminescence for the given construct relative to the wild-type construct at the specified temperature. The dotted line represents the mean activity of the wild-type DNMT1 construct. (g) Bar plot showing the cellular stability of wild-type DNMT1 and selected BAH2 variants (x-axis) enriched in sgM1077 (red) and sgN1081/R1082 (blue) in K562 cells as measured by the EGFP–mCherry fluorescence reporter system. Stability was calculated as the EGFP/mCherry ratio of the construct normalized to the EGFP/mCherry ratio of wild-type DNMT1 after 3 days of vehicle treatment (percentage of wild-type EGFP/mCherry ratio, y-axis). The dotted line represents the mean stability of the wild-type DNMT1 construct. (h) Bar plot showing the degradation of wild-type DNMT1 and selected BAH2 variants (x-axis) enriched in sgM1077 (red) and sgN1081/R1082 (blue) in K562 cells as measured by the EGFP–mCherry fluorescence reporter system. Degradation was calculated for each construct as the EGFP/mCherry ratio of the construct in DAC treatment normalized to vehicle treatment (percentage of DMSO EGFP/mCherry ratio, y-axis). Cells were treated with vehicle or 100 nM DAC for 3 days. The dotted line represents the mean degradation of the wild-type DNMT1 construct. For box plots in (a–d), the individual sgRNAs are plotted as points and the central band, box boundaries, and whiskers represent the median, interquartile range (IQR), and 1.5 × IQR, respectively. P values (*P ≤ 0.05; **P ≤ 0.01; ***P ≤ 0.001; n.s., not significant) were calculated with two-sided Mann–Whitney tests, except for (c), where they were calculated with two-sided Wilcoxon signed-rank tests. For bar plots in (f–h), bars represent the mean ± standard error of the mean (SEM) across three replicates and one of two independent experiments is shown.
Figure 5 with 1 supplement
Mutational profiling analysis of individual single-guide RNAs (sgRNAs) nominates UHRF1-targeting sgRNAs with predicted gain-of-function outcomes.
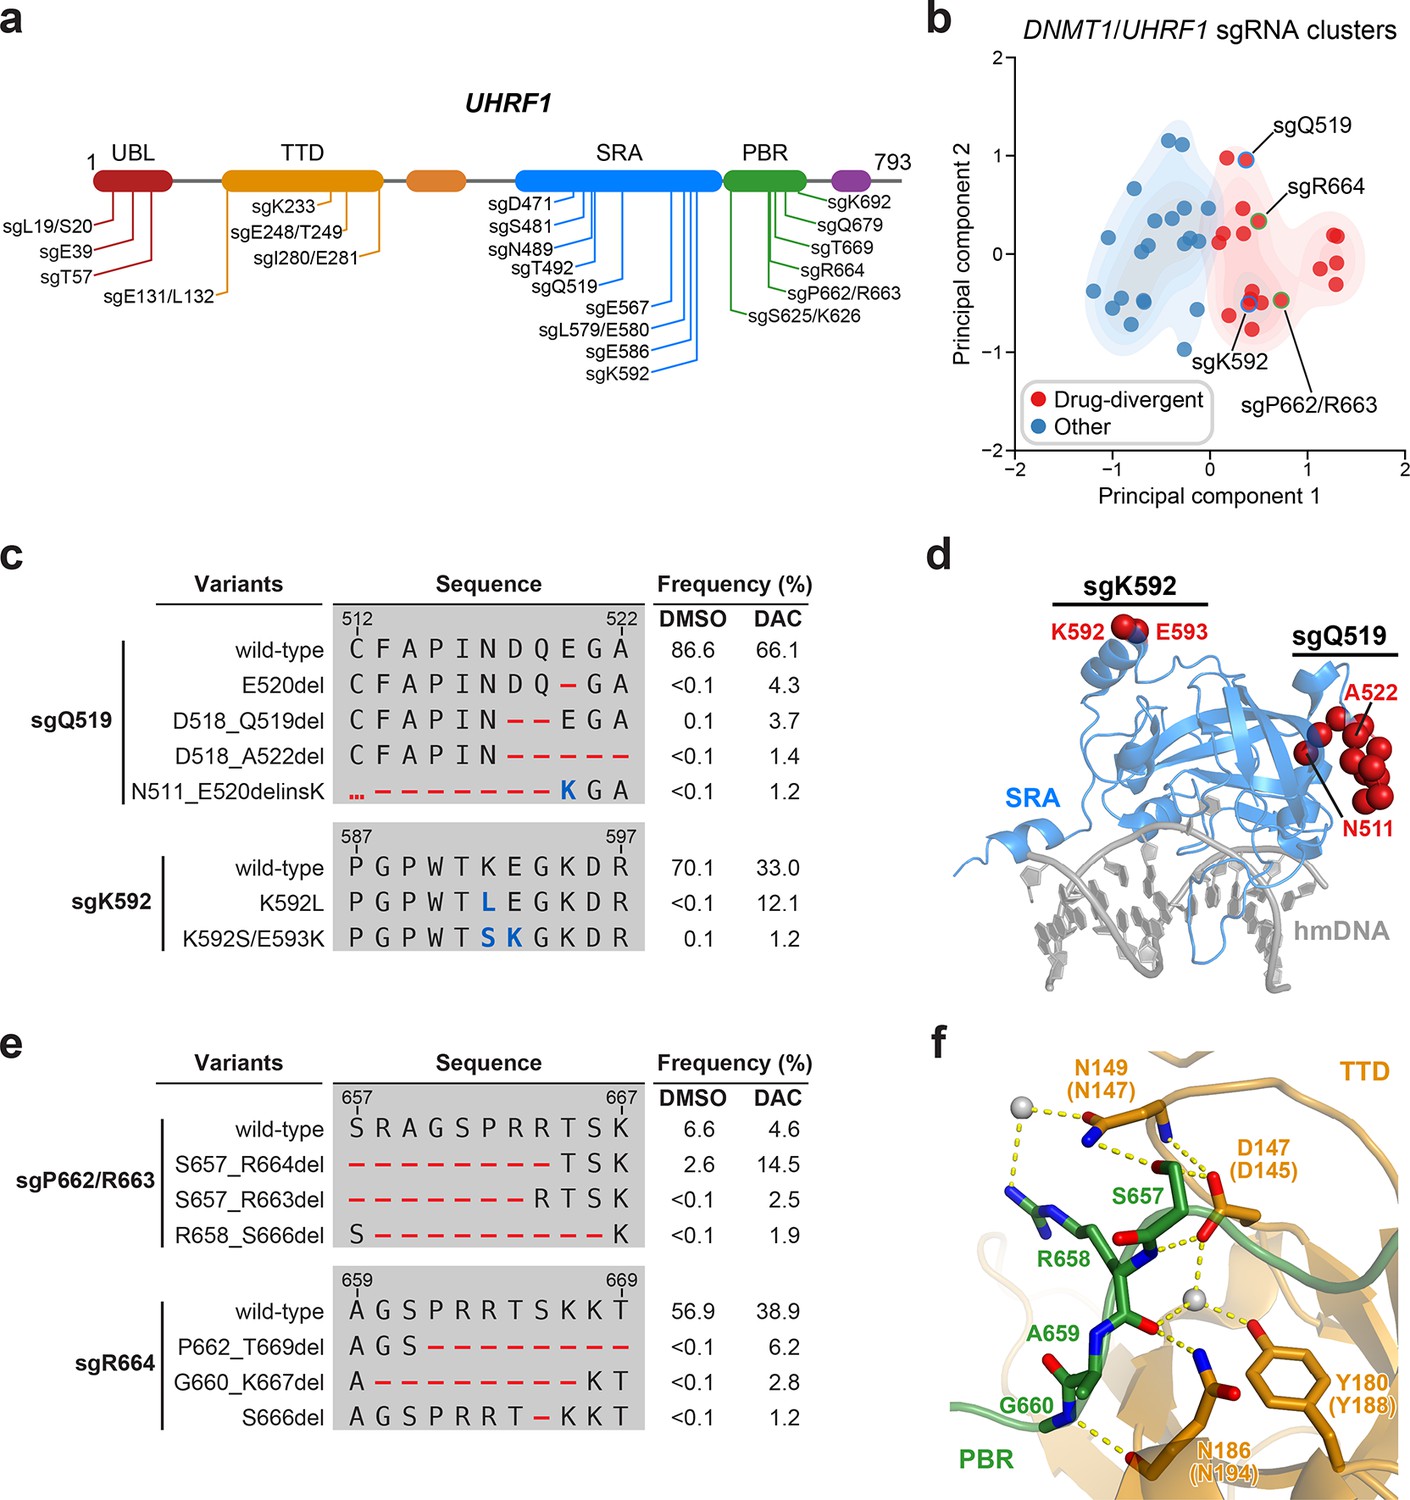
(a) Schematic showing the amino acid positions on the UHRF1 CDS targeted by selected UHRF1-targeting sgRNAs (n = 22). (b) Scatter plot showing DNMT1- and UHRF1-targeting sgRNAs (n = 40; 18 and 22 for DNMT1 and UHRF1, respectively) projected onto principal component space after principal component analysis on their mutational profile features. The sgRNAs were partitioned using k-means clustering (k = 2) into two categories: ‘drug-divergent’ (n = 19, red) or ‘other’ (n = 21, blue). Contours depict a bivariate kernel density estimation for drug-divergent (red) and other (blue) sgRNAs. sgRNAs highlighted in (c) and (e) targeting the SRA (blue border) and PBR (green border) regions of UHRF1 are annotated.(c) Table showing the amino acid sequence alignment and observed frequencies (percentage of total reads) of the wild-type and top enriched in-frame variants observed in the SRA-targeting sgRNAs sgQ519 (top) and sgK592 (bottom) after 8 weeks of treatment with vehicle or 100 nM decitabine (DAC). In-frame variants were considered enriched if the observed frequency in DAC was ≥1% and the log2(fold-change) of the observed frequency in DAC versus vehicle treatment was ≥2. All enriched in-frame variants meeting these criteria are shown and ordered by their observed frequency in DAC treatment. Amino acid deletions are represented as red dashes and substitutions are highlighted in blue. Red ellipses are used to denote amino acid deletions that exceed the length of the shown sequence alignment. (d) Structural view of the human UHRF1 SRA domain (blue) bound to hemimethylated DNA (hmDNA, gray). Residues perturbed by enriched in-frame variants (from c) found in sgQ519 and sgK592 are highlighted as red spheres (PDB: 3CLZ). (e) Table showing the amino acid sequence alignment and observed frequencies (percentage of total reads) of the wild-type and top enriched in-frame variants observed in the PBR-targeting sgRNAs sgP662/R663 (top) and sgR664 (bottom) after 8 weeks of treatment with vehicle or 100 nM DAC. In-frame variants were considered enriched if the observed frequency in DAC was ≥1% and the log2(fold-change) of the observed frequency in DAC versus vehicle treatment was ≥2. All enriched in-frame variants meeting these criteria are shown and ordered by their observed frequency in DAC treatment. Amino acid deletions are represented as red dashes and substitutions are highlighted in blue. Red ellipses are used to denote amino acid deletions that exceed the length of the shown sequence alignment. (f) Structural view of the zebrafish UHRF1 TTD domain (gold) complexed to a human UHRF1 PBR peptide (green) showing the region (S657–G660) targeted by sgP662/R663 and sgR664 (from e). Key residues forming polar contacts (yellow) are highlighted as sticks and annotated. For TTD residue annotations, the upper and lower (in parentheses) text indicate the residue identity and position in zebrafish and human UHRF1, respectively. Water molecules are shown as gray spheres (PDB: 6B9M).
Figure 5—figure supplement 1
Mutational profiling analysis of individual single-guide RNAs (sgRNAs) nominates UHRF1-targeting sgRNAs with predicted gain-of-function outcomes.
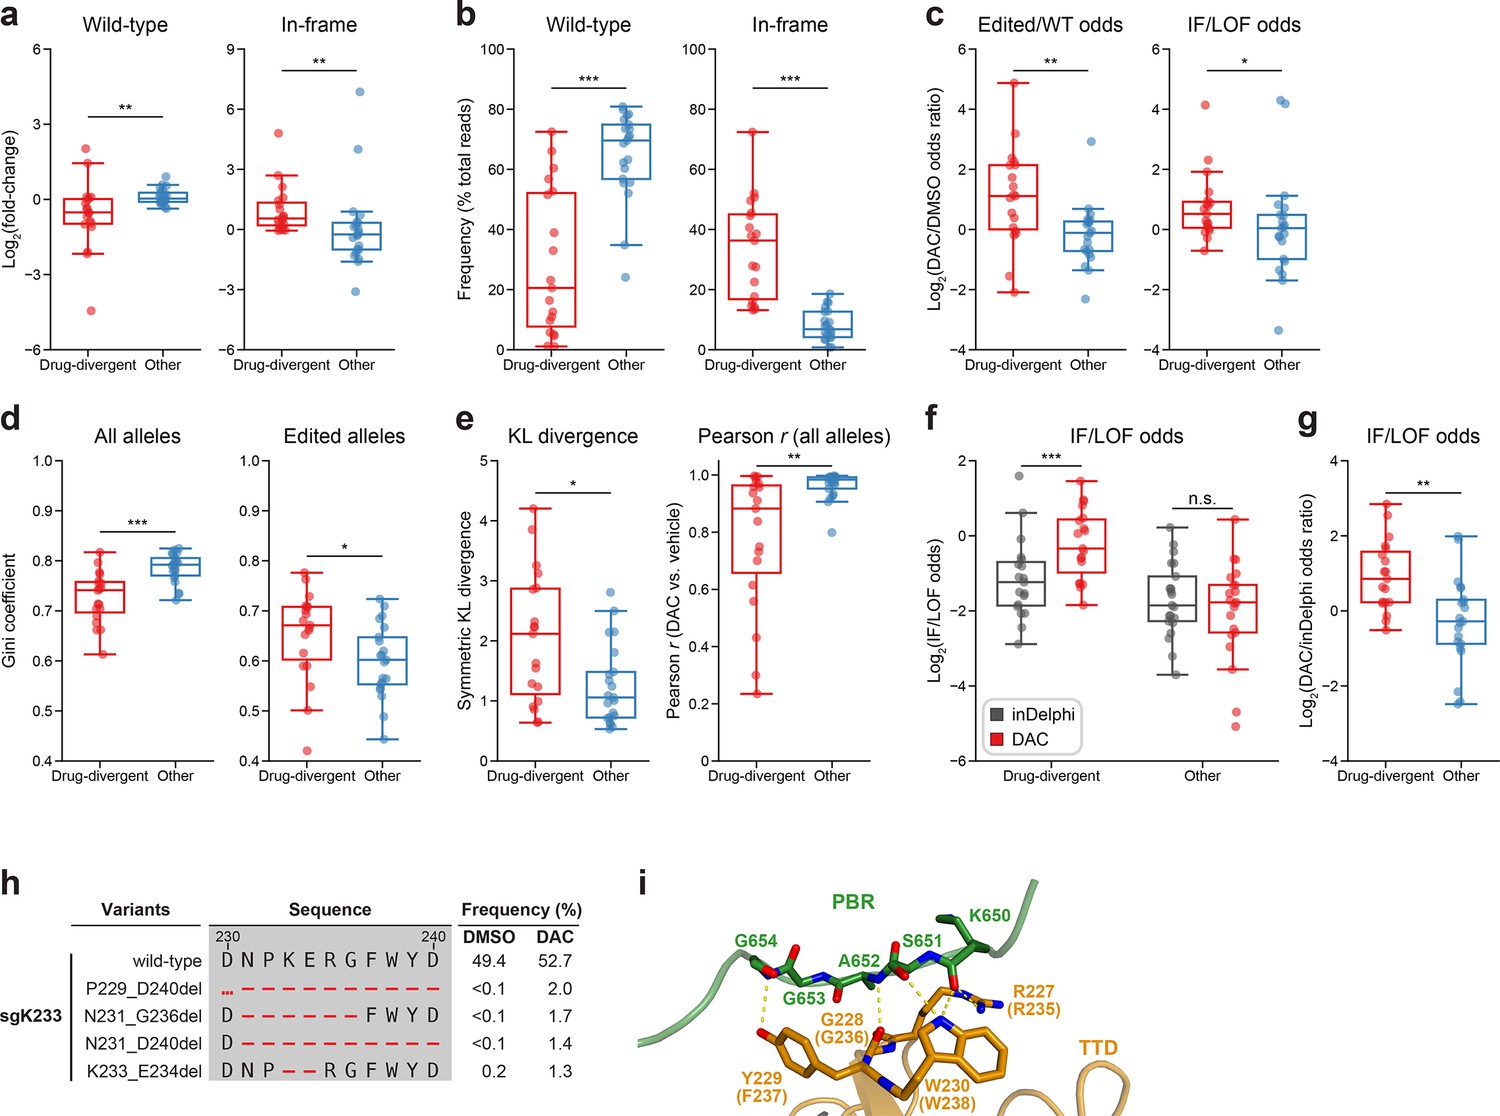
(a–e) Box plots comparing various mutational profile metrics (y-axes) between ‘drug-divergent’ (n = 19, red) or ‘other’ (n = 21, blue) sgRNAs (x-axes). (a) The log2(fold-change) enrichment of wild-type (left) and in-frame variants (right) in decitabine (DAC) versus vehicle treatment. Log2(fold-change) was calculated based on the observed frequency (percentage of total reads) in DAC versus vehicle treatment. (b) The observed frequencies (percentage of total reads) of wild-type (left) and in-frame (right) variants in DAC treatment. (c) The log2(odds ratio) in DAC versus vehicle treatment for edited versus wild-type odds (left) and in-frame versus loss-of-function (LOF) odds (right). Edited/wild-type odds were calculated using absolute frequencies (percentage of total reads) and in-frame/LOF odds were calculated using relative frequencies (percentage of edited reads). (d) The Gini coefficients of the observed allele frequency distribution in DAC treatment calculated using the observed frequencies of all alleles (percentage of total reads, left) or edited alleles (percentage of edited reads, right). (e) The symmetric Kullback–Leibler (KL) divergence (left) and Pearson correlations (right) of observed allele frequencies in DAC versus vehicle treatment. The symmetric KL divergence and Pearson correlations were calculated with the observed frequencies (percentage of total reads) of all alleles. (f) Box plots showing the log2(in-frame/LOF odds) (y-axis) for drug-divergent (red) and other (blue) sgRNAs (x-axis) as predicted by inDelphi (gray) and as observed in DAC treatment (red). (g) Box plots showing the log2(odds ratio) for in-frame/LOF odds in DAC treatment versus inDelphi predictions (y-axis) for drug-divergent (red) and other (blue) sgRNAs (x-axis). (h) Table showing the amino acid sequence alignment and observed frequencies (percentage of total reads) of the wild-type and top enriched in-frame variants observed in sgK233 targeting the TTD domain of UHRF1 after 8 weeks of treatment with vehicle (DMSO) or 100 nM DAC. In-frame variants were considered enriched if the observed frequency in DAC was ≥1% and the log2(fold-change) of the observed frequency in DAC versus vehicle treatment was ≥2. All enriched in-frame variants meeting these criteria are shown and ordered by their observed frequency in DAC treatment. Amino acid deletions are represented as red dashes. Red ellipses are used to denote amino acid deletions that exceed the length of the shown sequence alignment. (i) Structural view of the zebrafish UHRF1 TTD domain (gold) complexed to a human UHRF1 PBR peptide (green) showing key residues in the TTD (human UHRF1 residues R227–W230) that form inter-domain contacts with the PBR and are targeted by enriched in-frame variants found in sgK233 (from h). Key residues forming polar contacts (yellow) are highlighted as sticks and annotated. For TTD residue annotations, the upper and lower (in parentheses) text indicate the residue identity and position in zebrafish and human UHRF1, respectively (PDB: 6B9M). For box plots in (a–g), individual sgRNAs are plotted as points. The central band, box boundaries, and whiskers represent the median, interquartile range (IQR), and 1.5 × IQR, respectively. P values (*P ≤ 0.05; **P ≤ 0.01; ***P ≤ 0.001; n.s., not significant) were calculated with two-sided Mann–Whitney tests except for (f), where they were calculated with two-sided Wilcoxon signed-rank tests.
Additional files
-
Supplementary file 1
DNMT1 and UHRF1 sgRNA sequences and CRISPR scanning data.
- https://cdn.elifesciences.org/articles/80640/elife-80640-supp1-v3.zip
-
Supplementary file 2
Variant frequencies for DNMT1-targeting sgRNAs.
- https://cdn.elifesciences.org/articles/80640/elife-80640-supp2-v3.zip
-
Supplementary file 3
Variant frequencies for UHRF1-targeting sgRNAs.
- https://cdn.elifesciences.org/articles/80640/elife-80640-supp3-v3.zip
-
Supplementary file 4
Oligonucleotide and PCR primer sequences.
- https://cdn.elifesciences.org/articles/80640/elife-80640-supp4-v3.zip
-
MDAR checklist
- https://cdn.elifesciences.org/articles/80640/elife-80640-mdarchecklist1-v3.docx
Download links
A two-part list of links to download the article, or parts of the article, in various formats.
Downloads (link to download the article as PDF)
Open citations (links to open the citations from this article in various online reference manager services)
Cite this article (links to download the citations from this article in formats compatible with various reference manager tools)
Activity-based CRISPR scanning uncovers allostery in DNA methylation maintenance machinery
eLife 12:e80640.
https://doi.org/10.7554/eLife.80640


