PLK4 drives centriole amplification and apical surface area expansion in multiciliated cells
- Department of Molecular Biology and Genetics, Johns Hopkins University School of Medicine, United States
Figures
Figure 1 with 1 supplement

Ependymal cells lacking PLK4 differentiate but fail to recruit STIL to deuterosomes.
(A) Schematic overview of the experiment to recombine the Plk4F/F allele in ependymal cells in vitro. Ependymal cells were harvested from Plk4F/F mice or Plk4F/+ controls and seeded onto coverslips. On differentiation day 0, the ependymal cells were transduced with AAV-Cre in serum-free media. (B) Quantification of the percent of FOXJ1-expressing ependymal cells transduced with AAV-Cre-GFP. N=3–4 brains, n>300 cells. Two-tailed Welch’s t-test. (C) Quantification of the percent of AAV-Cre-GFP transduced ependymal cells with deuterosomes, using DEUP1 as a maker. Day 0 N=3, day 7 N=5, day 9 N=2, day 15 N=3; n>300 cells. Two-tailed Welch’s t-test. (D) Quantification of the intensity of PLK4 on deuterosomes in ependymal cells on differentiation day 7. Cells in all stages of centriole amplification were measured and pooled. N=4, n≥20. Two-tailed Welch’s t-test. (E) Confocal images of Plk4F/F or Plk4F/+ ependymal cells transduced with AAV-Cre-GFP. Cells were stained with DEUP1 to mark deuterosomes (red) and PLK4 (white). Scale bar=5 μm. (F) Quantification of the intensity of STIL on deuterosomes in ependymal cells on differentiation day 7. Cells in all stages of centriole amplification were measured and pooled. N=3, n≥30. Two-tailed Welch’s t-test. (G) Confocal images of Plk4F/F or Plk4F/+ ependymal cells transduced with AAV-Cre-GFP. Cells were stained with DEUP1 (red) and STIL (white). Scale bar=5 μm. Data information: All data represent the means ± SEM. *p<0.05; ***<0.001.
-
Figure 1—source data 1
Values for biological and technical replicates for graphs in Figure 1.
- https://cdn.elifesciences.org/articles/80643/elife-80643-fig1-data1-v2.xlsx
Figure 1—figure supplement 1
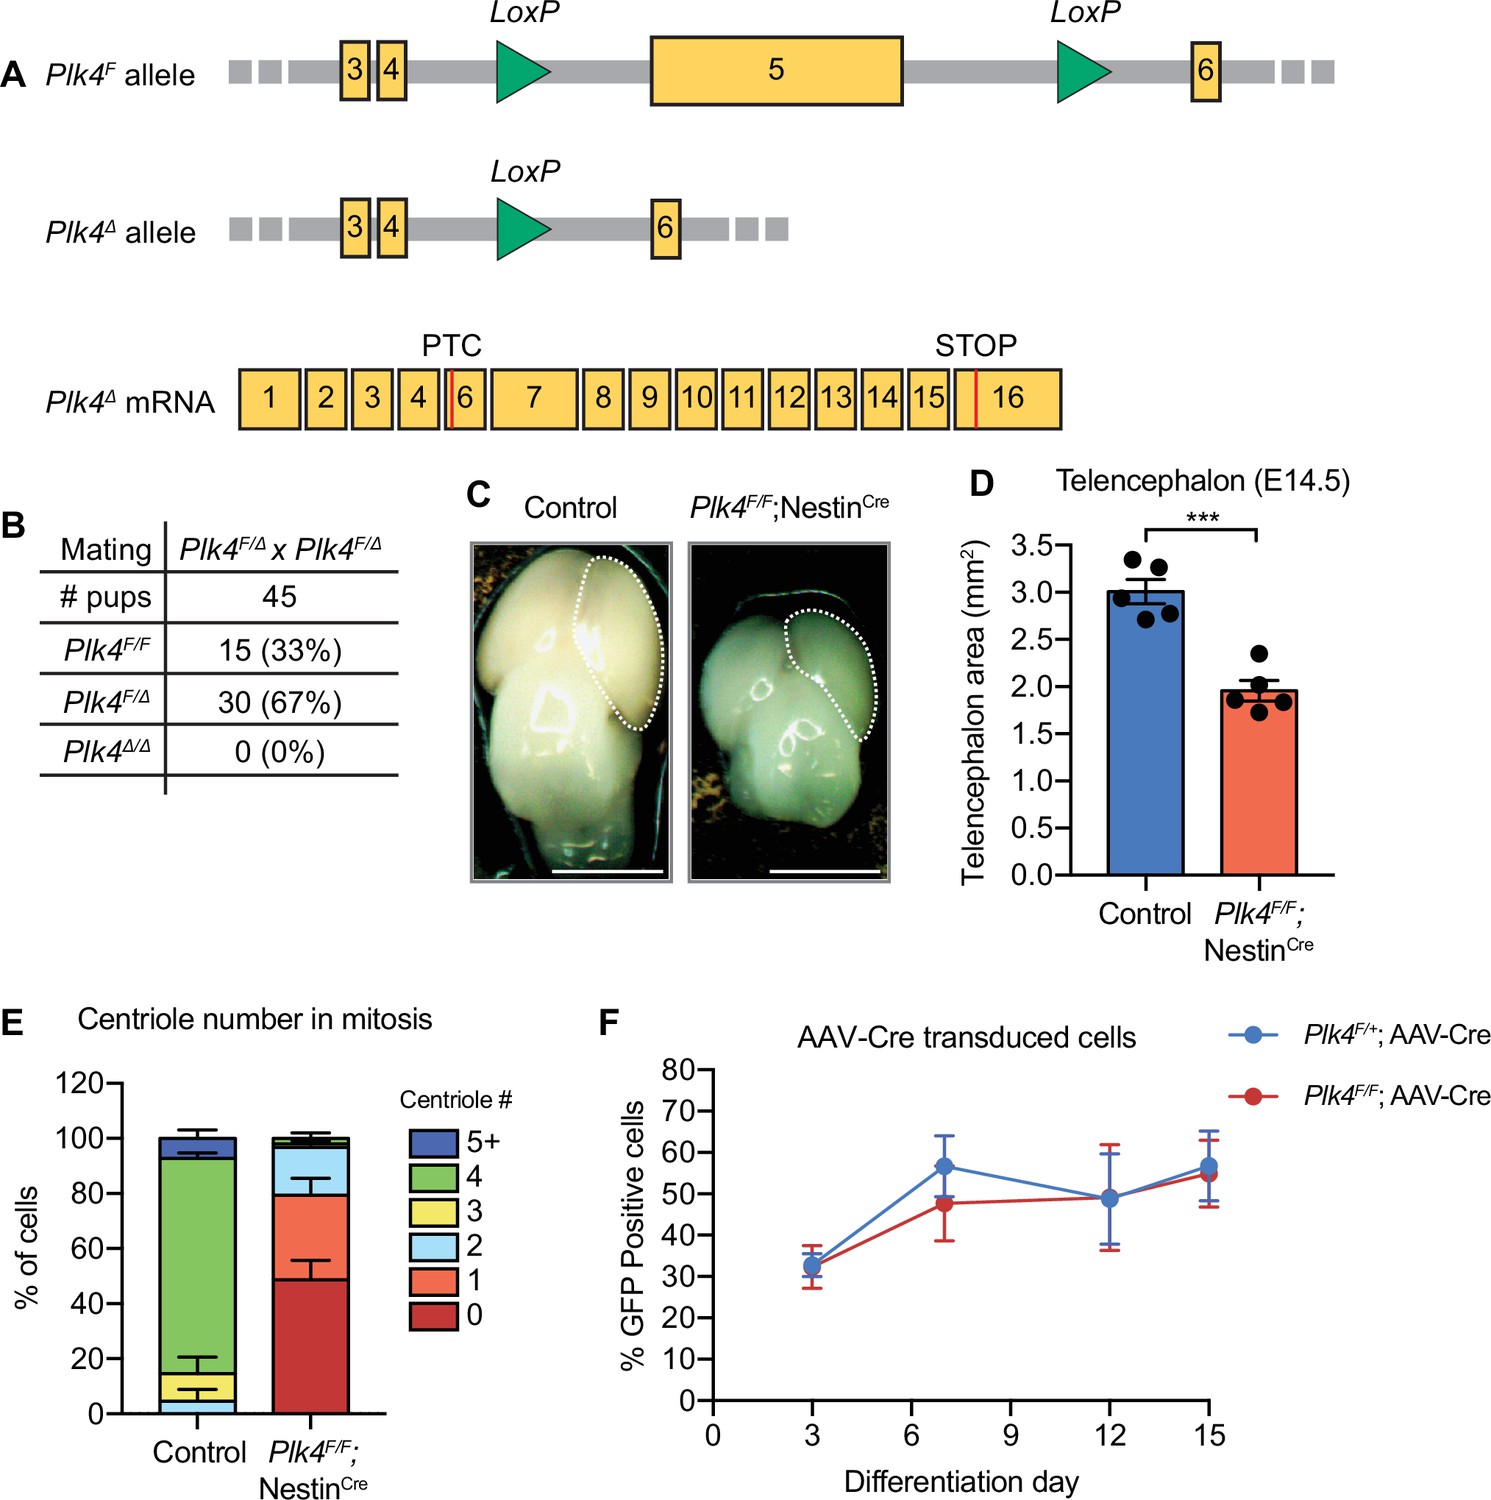
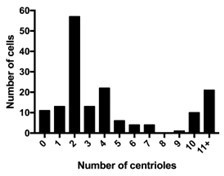
Knockout of PLK4 leads to centriole loss in neural progenitor cells (NPCs).
(A) Diagram of the Plk4F allele showing LoxP sites surrounding exon 5 (top). Diagram of the Plk4Δ allele following Cre-mediated recombination (middle). Diagram of the mRNA product created from the Plk4Δ allele showing the premature termination codon (PTC) in exon 6 (bottom). (B) Frequency of progeny generated from intercrosses of Plk4F/Δ mice. N=45. (C) Representative whole-mount images of control and Plk4F/F;NestinCre brains at E14.5. Scale bar=0.2 cm. (D) Telencephalon area of control and Plk4F/F;NestinCre brains at E14.5. N=5; Two-tailed Welch’s t-test. (E) Graph showing centriole number per cell in mitotic NPCs from control and Plk4F/F;NestinCre brains at E14.5. N=3. Two-tailed Welch’s t-test. (F) Quantification of the percent of ependymal cells expressing GFP following transduction with AAV-Cre-GFP. N≥3, n>300. Two-tailed Welch’s t-test. Data information: All data represent the means ± SEM. ***p<0.001.
-
Figure 1—figure supplement 1—source data 1
Values for biological and technical replicates for graphs in Figure 1—figure supplement 1, and pedigree information for Figure 1—figure supplement 1B.
- https://cdn.elifesciences.org/articles/80643/elife-80643-fig1-figsupp1-data1-v2.xlsx
Figure 2 with 1 supplement
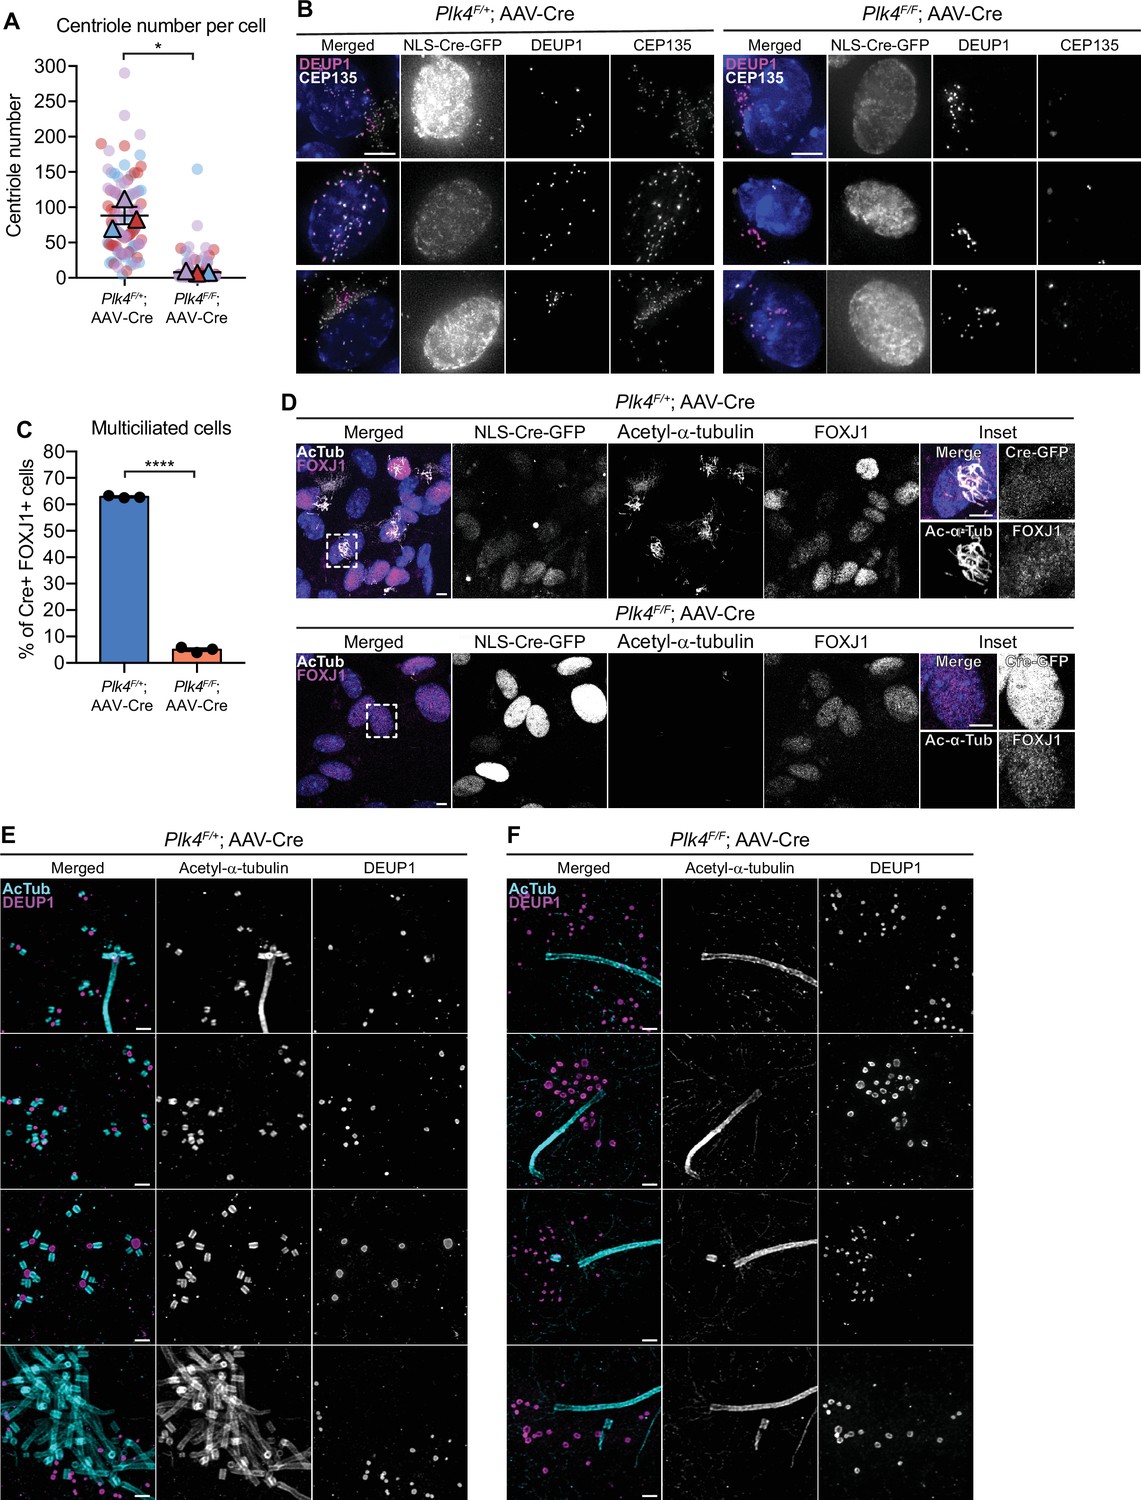
Loss of PLK4 blocks centriole assembly in ependymal cells.
(A) Quantification of the number of centrioles per cell in disengagement (D) phase. Plk4F/F or Plk4F/+ ependymal cells transduced with AAV-Cre-GFP were analyzed at differentiation days 7 and 8. N=3, n≥20. Two-tailed Welch’s t-test. (B) Images of Plk4F/F or Plk4F/+ ependymal cells transduced with AAV-Cre-GFP. Cells were stained with DEUP1 (magenta) and CEP135 to mark centrioles (white). Scale bar=5 μm. (C) Quantification of the percent of FOXJ1+Plk4F/F or Plk4F/+ ependymal cells transduced with AAV-Cre-GFP that have multiple cilia at differentiation day 12. Acetylated tubulin staining was used to identify multiciliated cells. N=3, n>300. Two-tailed Welch’s t-test. (D) Confocal images of Plk4F/F or Plk4F/+ ependymal cells transduced with AAV-Cre-GFP. Cells were stained with antibodies against FOXJ1 (magenta) and acetylated-α-tubulin (white). Scale bar=5 μm. (E, F) Expansion microscopy of Plk4F/F or Plk4F/+ ependymal cells at differentiation day 5 transduced with AAV-Cre-GFP. Cells were stained with acetylated-α-tubulin (cyan) and DEUP1 (magenta). Scale bar=0.5 μM. Data information: All data represent the means ± SEM. **p<0.01; ****<0.0001.
-
Figure 2—source data 1
Values for biological and technical replicates for graphs in Figure 2.
- https://cdn.elifesciences.org/articles/80643/elife-80643-fig2-data1-v2.xlsx
Figure 2—figure supplement 1
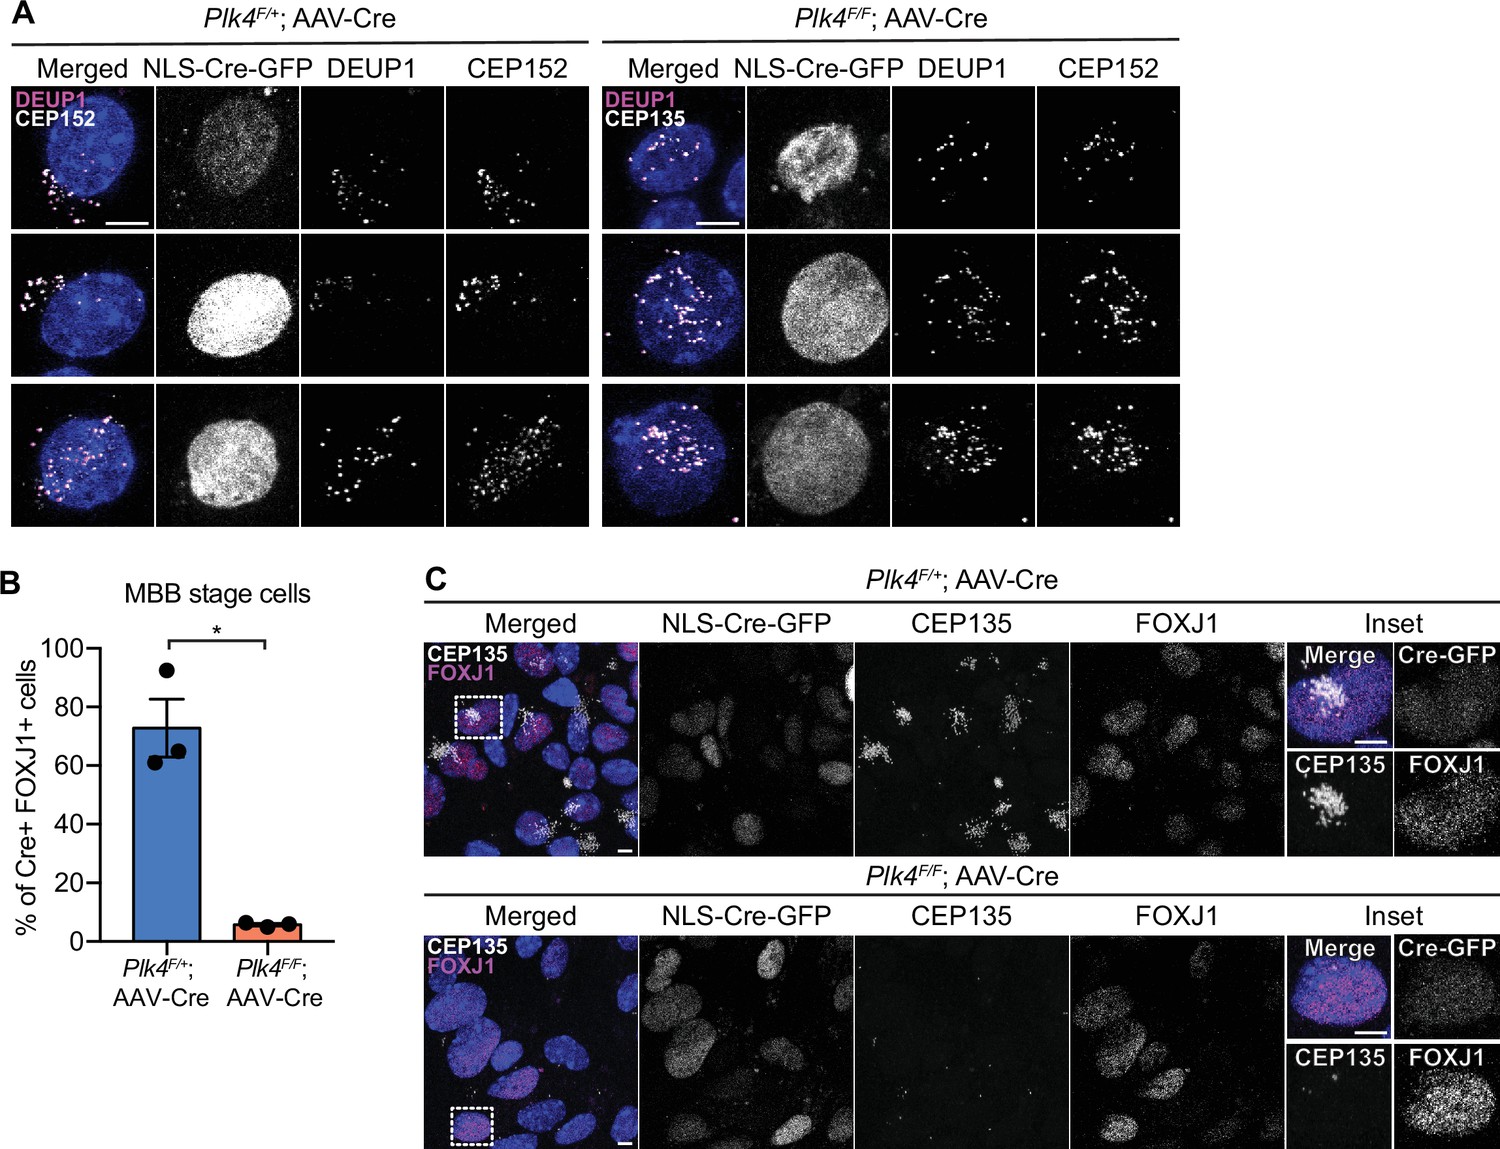
Ependymal cells lacking PLK4 recruit CEP152 but fail centriole amplification.
(A) Representative images of Plk4F/F or Plk4F/+ ependymal cells transduced with AAV-Cre-GFP. Cells were stained with antibodies against DEUP1 (white) and CEP152 (magenta). Scale bar=5 μm. (B) Quantification of the percent of AAV-Cre-GFP transduced FOXJ1+Plk4F/F or Plk4F/+ ependymal cells with amplified centrioles (MBB stage) at differentiation day 11. N=3, n>100. Two-tailed Welch’s t-test. (C) Representative images of Plk4F/F or Plk4F/+ ependymal cells transduced with AAV-Cre-GFP. Cells were stained with antibodies against CEP135 (white) and FOXJ1 (magenta). Scale bar=5 μm. Data information: All data represent the means ± SEM. *p<0.05.
-
Figure 2—figure supplement 1—source data 1
Values for biological and technical replicates for graphs in Figure 2—figure supplement 1.
- https://cdn.elifesciences.org/articles/80643/elife-80643-fig2-figsupp1-data1-v2.xlsx
Figure 3
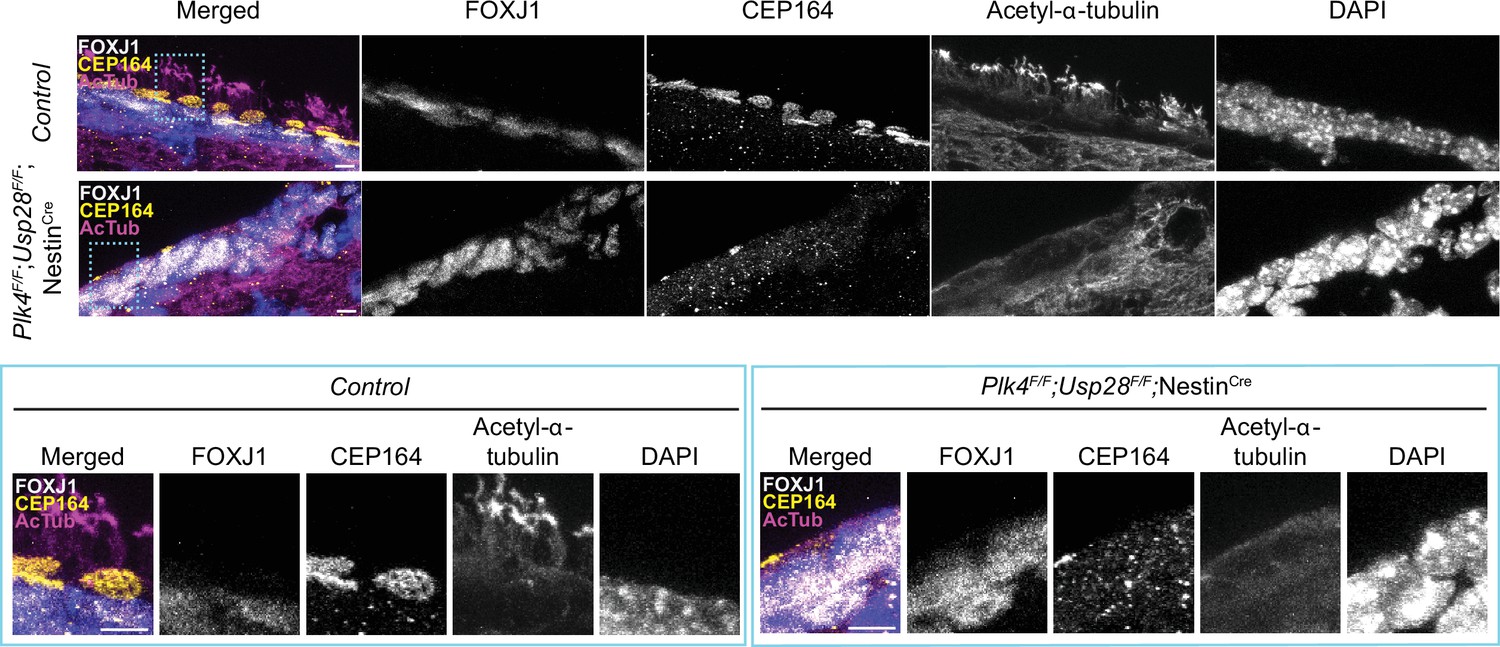
PLK4 is required for multicliogenesis in vivo.
Confocal images of the lateral ventricle from control or Plk4F/F;Usp28F/F;NestinCre mouse brains at P21. Sections were stained with antibodies against FOXJ1 (white), CEP164 (yellow), and acetylated-α-tubulin (magenta). Scale bar=5 μm.
Figure 4 with 1 supplement
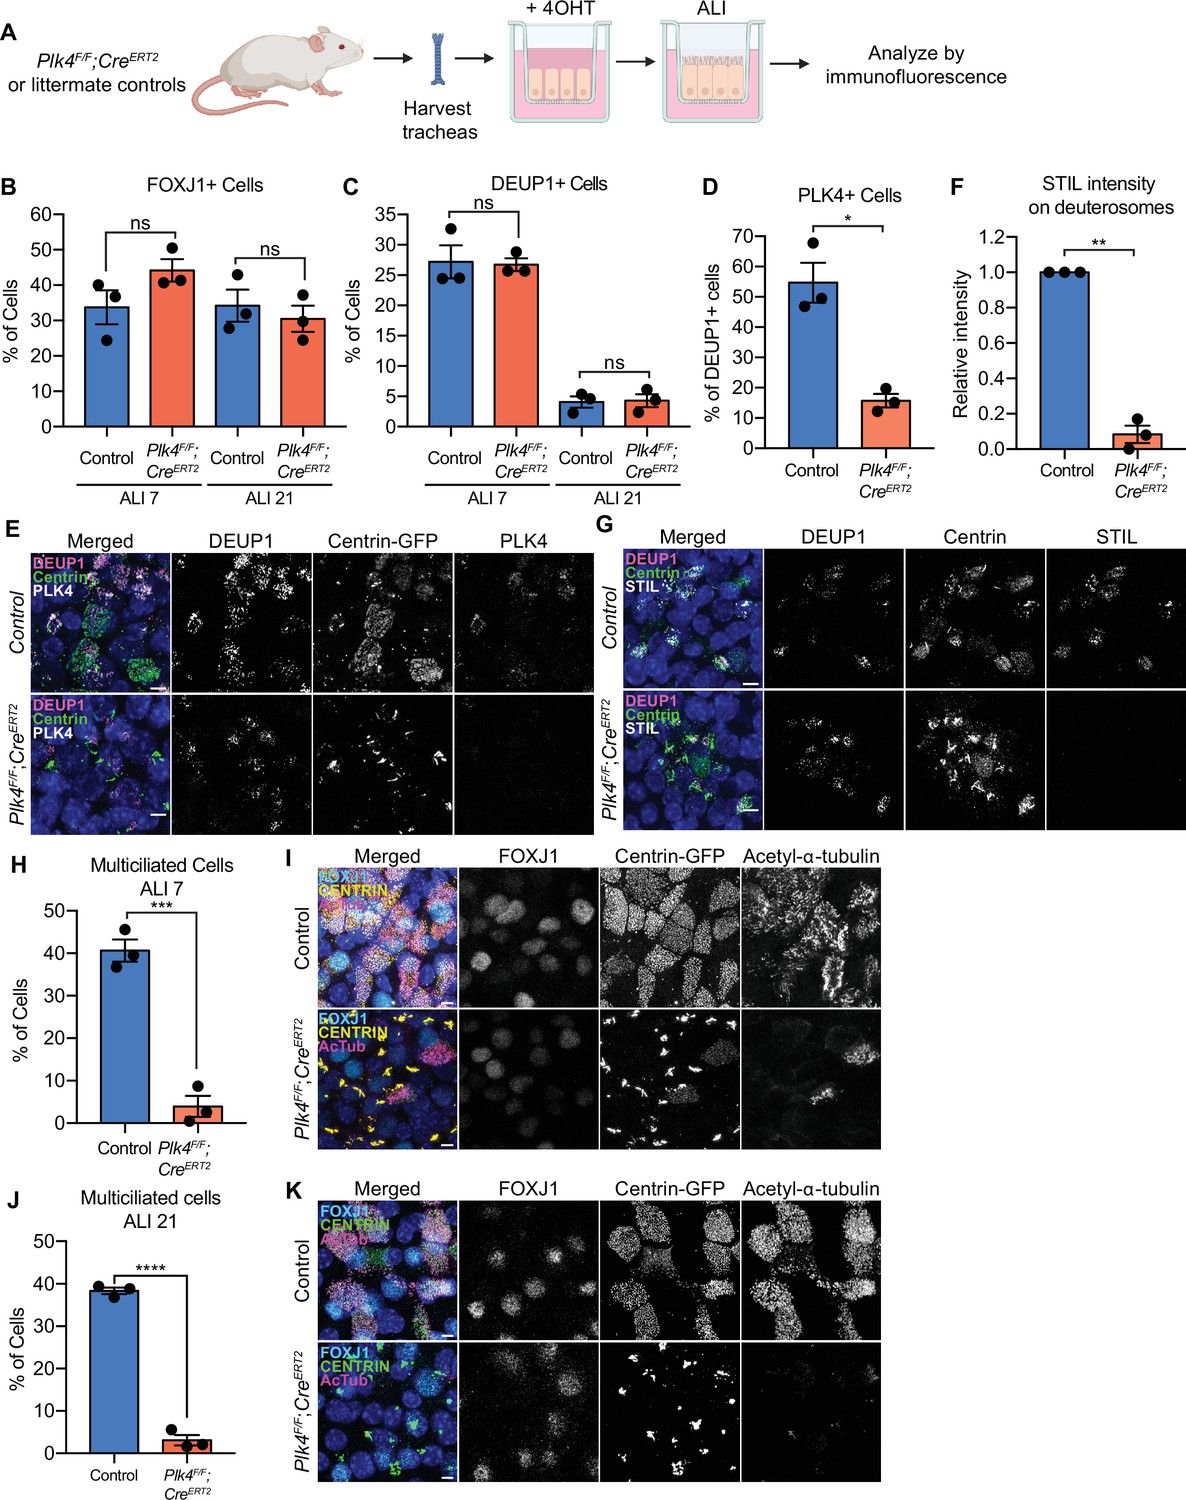
PLK4 promotes centriole assembly in mTECs.
(A) Schematic of the experimental design to genetically deplete PLK4 in mTECs. Plk4F/F;R26Cre tracheal epithelial cells were seeded onto collagen-coated transwell filters and allowed to proliferate until confluence (day 3). At this point, Cre-mediated recombination of the Plk4F/F allele was induced by the addition of 4OHT to the media. After 2 days, mTECs were exposed to ALI to initiate differentiation. (B) Quantification of the percent of control or Plk4F/F;R26Cre mTECs expressing FOXJ1 at ALI 7 and ALI 21. N=3, n>500. Two-tailed Welch’s t-test. (C) Quantification of the percent of control or Plk4F/F;R26Cre mTECs with deuterosomes at ALI 7 and ALI 21. N=3, n>500. Two-tailed Welch’s t-test. (D) Quantification of the percent of control or Plk4F/F;R26Cre mTECs that express PLK4 at ALI 3. N=3, n>500. Two-tailed Welch’s t-test. (E) Confocal images of control and Plk4F/F;R26Cre mTECs at ALI 3. Cells were expressing Centrin-GFP and stained with DEUP1 (magenta) and PLK4 (white). Scale bar=5 μm. (F) Quantification of the intensity of STIL on deuterosomes in control or Plk4F/F;R26Cre mTECs at ALI 3. Cells in all stages of centriole amplification were measured and pooled. N=3, n>500. Two-tailed Welch’s t-test. (G) Confocal images of control and Plk4F/F;R26Cre mTECs at ALI 3. Cells were expressing Centrin-GFP and stained with DEUP1 (magenta) and STIL (white). Scale bar=5 μm. (H) Quantification of multiciliated mTECs at ALI 7. N=3, n>500. Two-tailed Welch’s t-test. (I) Confocal images of control and Plk4F/F;R26Cre mTECs at ALI 7. Cells were expressing Centrin-GFP (yellow) and stained with FOXJ1 (cyan) and acetylated-α-tubulin (magenta). Scale bar=5 μm. (J) Quantification of multiciliated mTECs at ALI 21. N=3, n>500. Two-tailed Welch’s t-test. (K) Confocal images of control and Plk4F/F;R26Cre mTECs at ALI 21. Cells were expressing Centrin-GFP (green) and stained with FOXJ1 (cyan) and acetylated-α-tubulin (magenta). Scale bar=5 μm. Data information: All data represent the means ± SEM. *p<0.05; **<0.01; ***<0.001; ****<0.0001 and not significant indicates p>0.05. ALI, air-liquid interface; mTEC, mouse trachea epithelial cell.
-
Figure 4—source data 1
Values for biological and technical replicates for graphs in Figure 4.
- https://cdn.elifesciences.org/articles/80643/elife-80643-fig4-data1-v2.xlsx
Figure 4—figure supplement 1
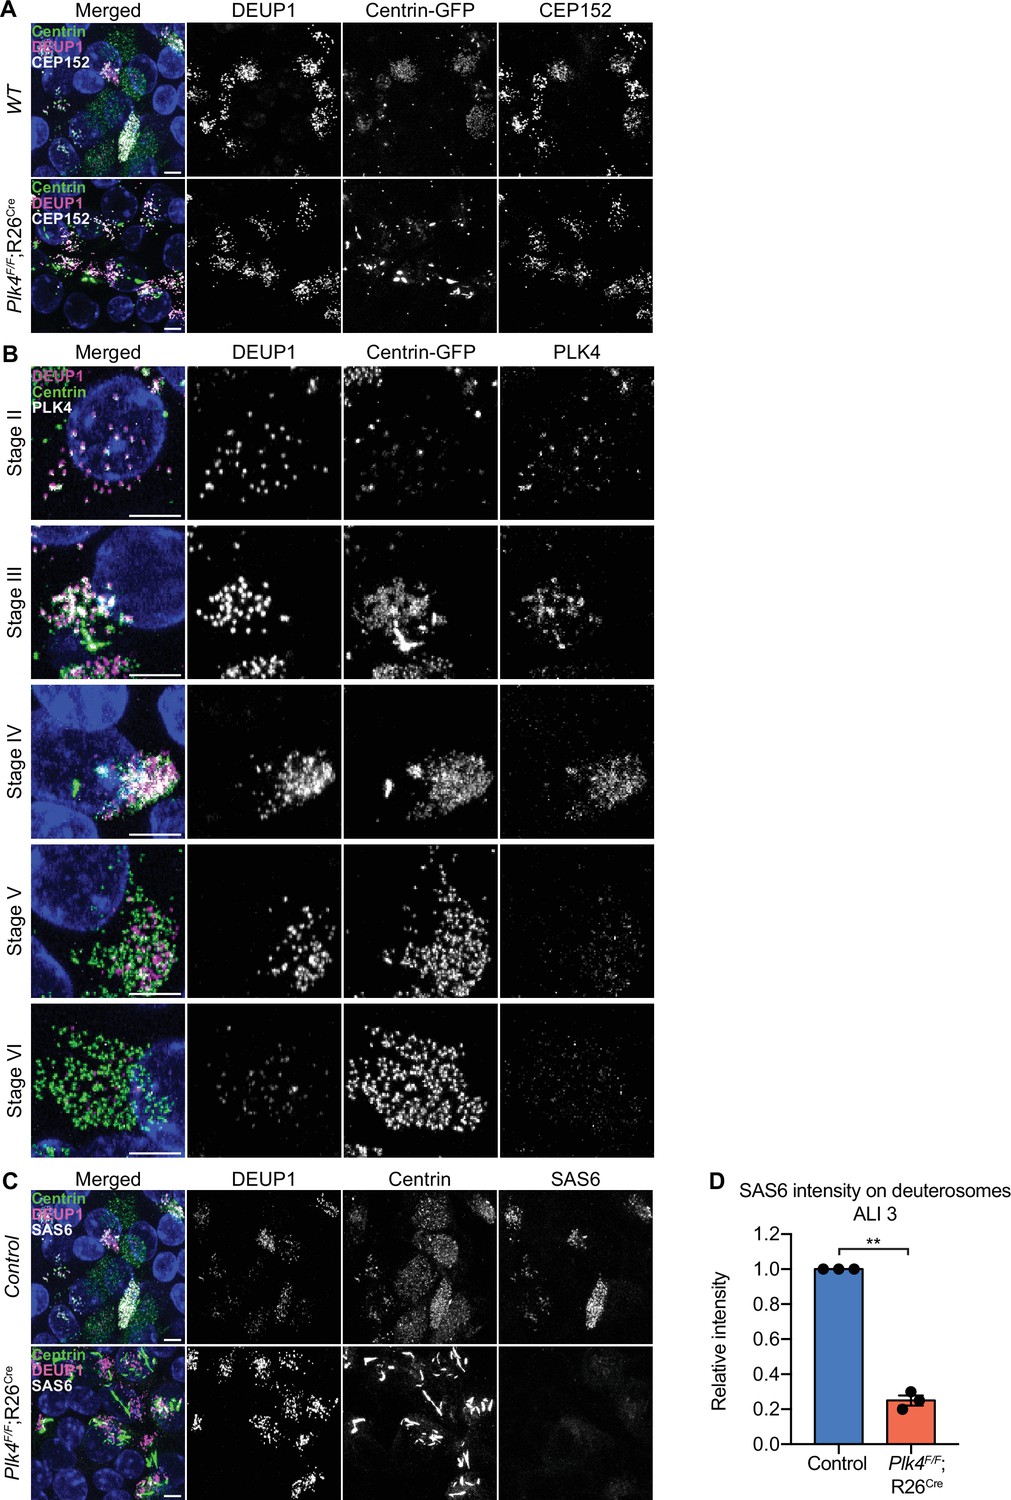
mTECs lacking PLK4 recruit CEP152 but fail centriole amplification.
(A) Representative confocal images of control and Plk4F/F;R26Cre mTECs at ALI 3. Cells were expressing Centrin-GFP and stained with antibodies against DEUP1 (magenta) and CEP152 (white). Scale bar=5 μm. (B) Representative images of control mTECs in stages II–VI of centriole amplification demonstrating PLK4 localization during differentiation. Cells are expressing Centrin-GFP and stained with antibodies against DEUP1 (magenta) and PLK4 (white). Scale bar=5 μm. (C) Representative images of control and Plk4F/F;R26Cre mTECs at ALI 3 stained with antibodies against DEUP1 (magenta), Centrin (green), and SAS6 (white). Scale bar=5 μm. (D) Quantification of the average total intensity of SAS6 on deuterosomes per cell in control or Plk4F/F;R26Cre mTECs at ALI 3. Cells in all stages of centriole amplification were measured and pooled. N=3, n>50. Two-tailed Welch’s t-test. Data information: All data represent the means ± SEM. **p<0.01.
-
Figure 4—figure supplement 1—source data 1
Values for biological and technical replicates for graphs in Figure 4—figure supplement 1.
- https://cdn.elifesciences.org/articles/80643/elife-80643-fig4-figsupp1-data1-v2.xlsx
Figure 5 with 1 supplement
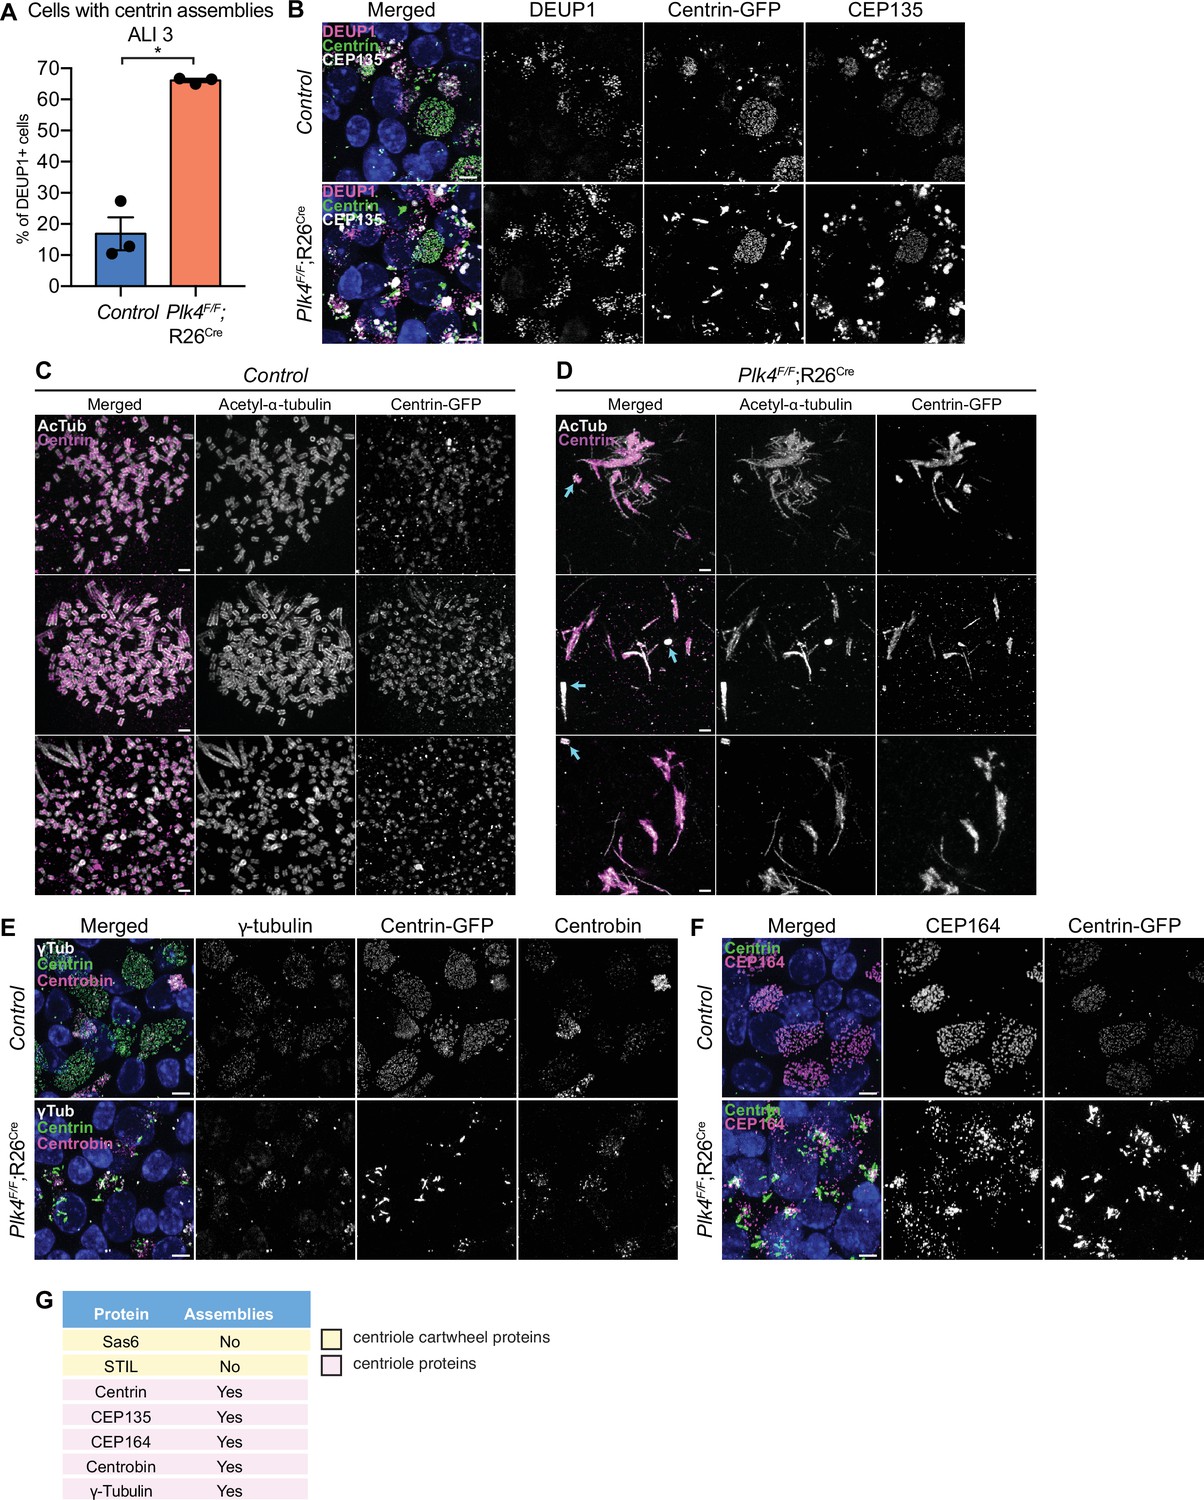
mTECs that fail centriole amplification form aberrant assemblies of centriole proteins.
(A) Quantification of the percent of control and Plk4F/F;R26Cre mTECs with Centrin aggregates at ALI 3. N=3, n>150. Two-tailed Welch’s t-test. (B) Confocal images of control and Plk4F/F;R26Cre mTECs at ALI 3. Cells were expressing Centrin-GFP and stained with DEUP1 (magenta) and CEP135 (white). Scale bar=5 μm. (C, D) Confocal images of control and Plk4F/F;R26Cre mTECs expanded by ultrastructure expansion microscopy (UExM). Cells were stained with antibodies against acetylated-α-tubulin (white) and GFP (magenta). Blue arrows indicate parent centrioles. Scale bar=0.5 μM. (E) Confocal images of control and Plk4F/F;R26Cre mTECs. Cells were expressing Centrin-GFP and stained with antibodies against γ-tubulin (white) and Centrobin (magenta). Scale bar=5 μm. (F) Confocal images of control and Plk4F/F;R26Cre mTECs. Cells were expressing Centrin-GFP and stained with an antibody against CEP164 (magenta). Scale bar=5 μm. (G) Table showing which of the centriole proteins form assemblies in Plk4F/F;R26Cre mTECs. Data information: All data represent the means ± SEM. *p<0.05. ALI, air-liquid interface; mTEC, mouse trachea epithelial cell.
-
Figure 5—source data 1
Values for biological replicates and n for the graph in Figure 5.
- https://cdn.elifesciences.org/articles/80643/elife-80643-fig5-data1-v2.xlsx
Figure 5—figure supplement 1
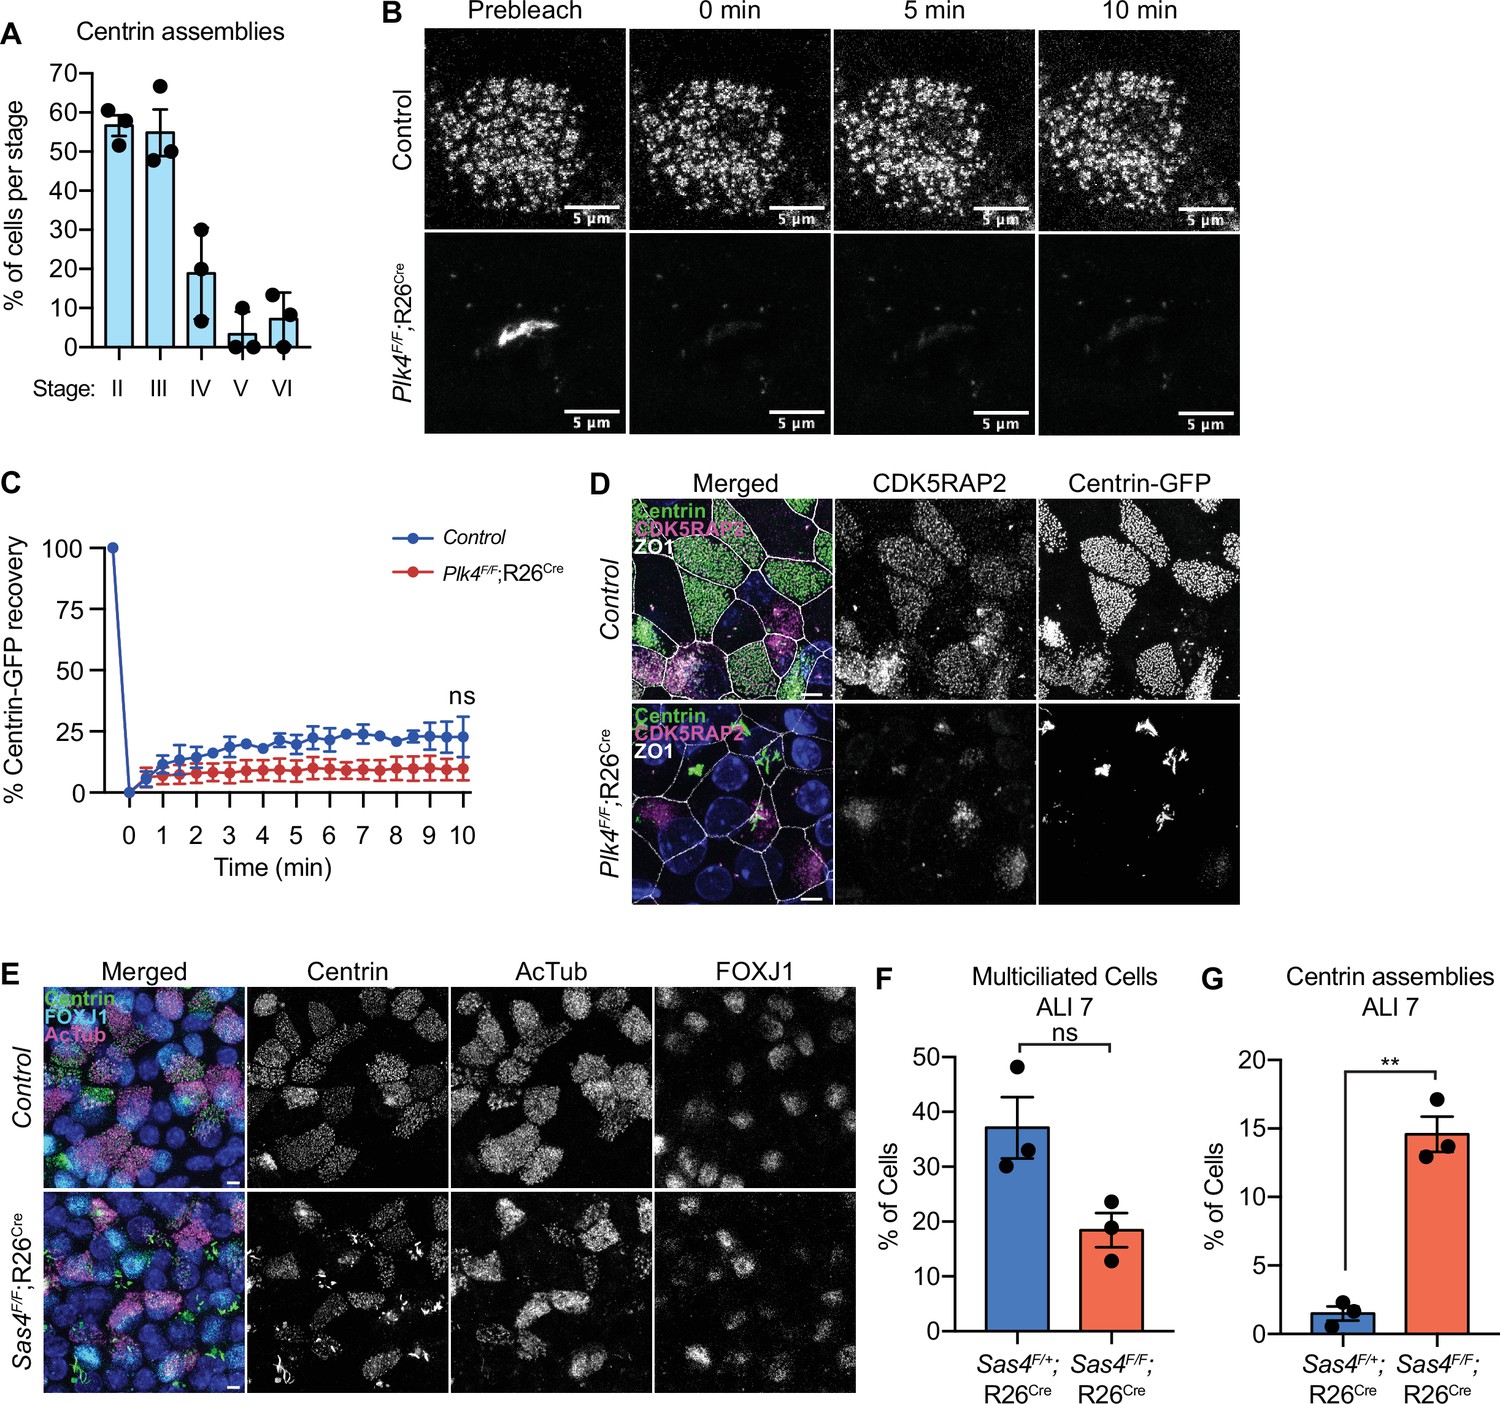
Blocking centriole amplification in mTECs results in assemblies of some centriole proteins.
(A) Graph showing the percent of cells with Centrin aggregates in stages II-VI of centriole amplification in control mTECs at ALI 3. N=3, n>50. (B) Representative images of control and Plk4F/F;R26Cre mTECs expressing Centrin-GFP before and at various time points after photobleaching. (C) Quantification of the percent of Centrin-GFP fluorescence recovery after photobleaching in control and Plk4F/F;R26Cre mTECs. (D) Confocal images of control and Plk4F/F;R26Cre mTECs at ALI 7 expressing. Cells expressed Centrin-GFP and were stained with antibodies against CDK5RAP2 (magenta) and ZO1 (white). Scale bar=5 μm. (E) Representative images of control and Sas4F/F;R26Cre mTECs at ALI 7. Cells were stained with antibodies against DEUP1 (white), Centrin (green), and CEP135 (magenta). Scale bar=5 μm. (F) Quantification of the percent of control and Plk4F/F;R26Cre mTECs that have multiple cilia at ALI 7. N=3, n>300. Two-tailed Welch’s t-test. (G) Quantification of the percent of control and Plk4F/F;R26Cre mTECs that have Centrin assemblies at ALI 7. N=3, n>300. Two-tailed Welch’s t-test. Data information: All data represent the means ± SEM. **p<0.01 and not significant indicates p>0.05.
-
Figure 5—figure supplement 1—source data 1
Values for biological and technical replicates for graphs in Figure 5—figure supplement 1.
- https://cdn.elifesciences.org/articles/80643/elife-80643-fig5-figsupp1-data1-v2.xlsx
Figure 6 with 4 supplements
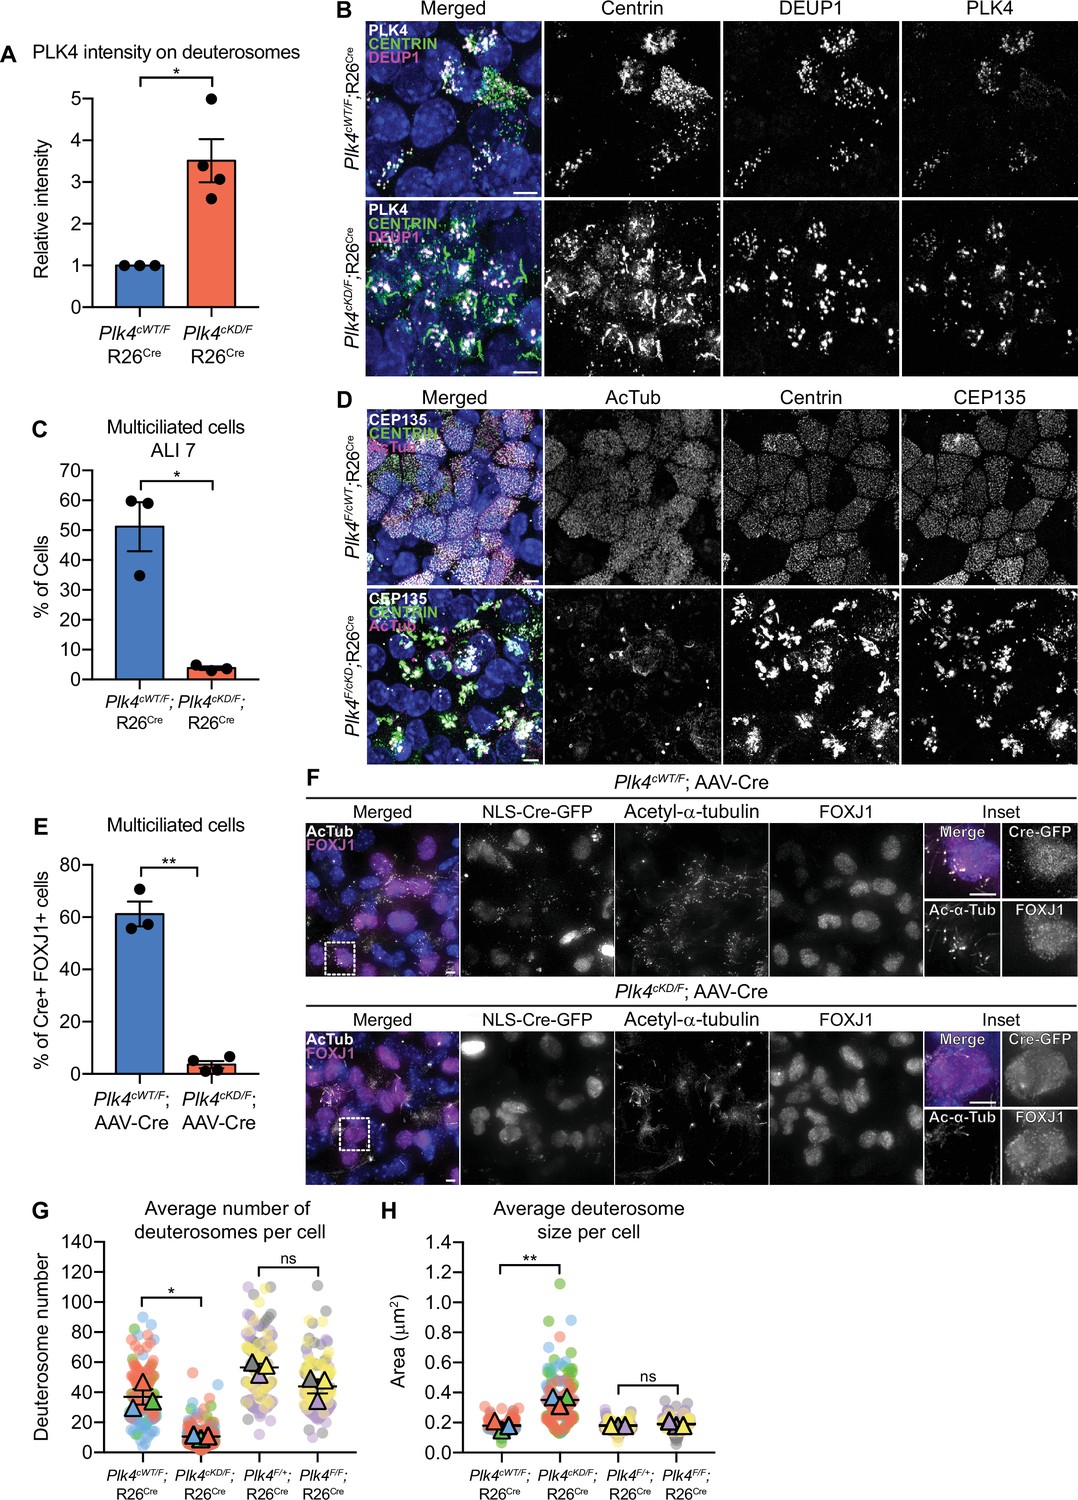
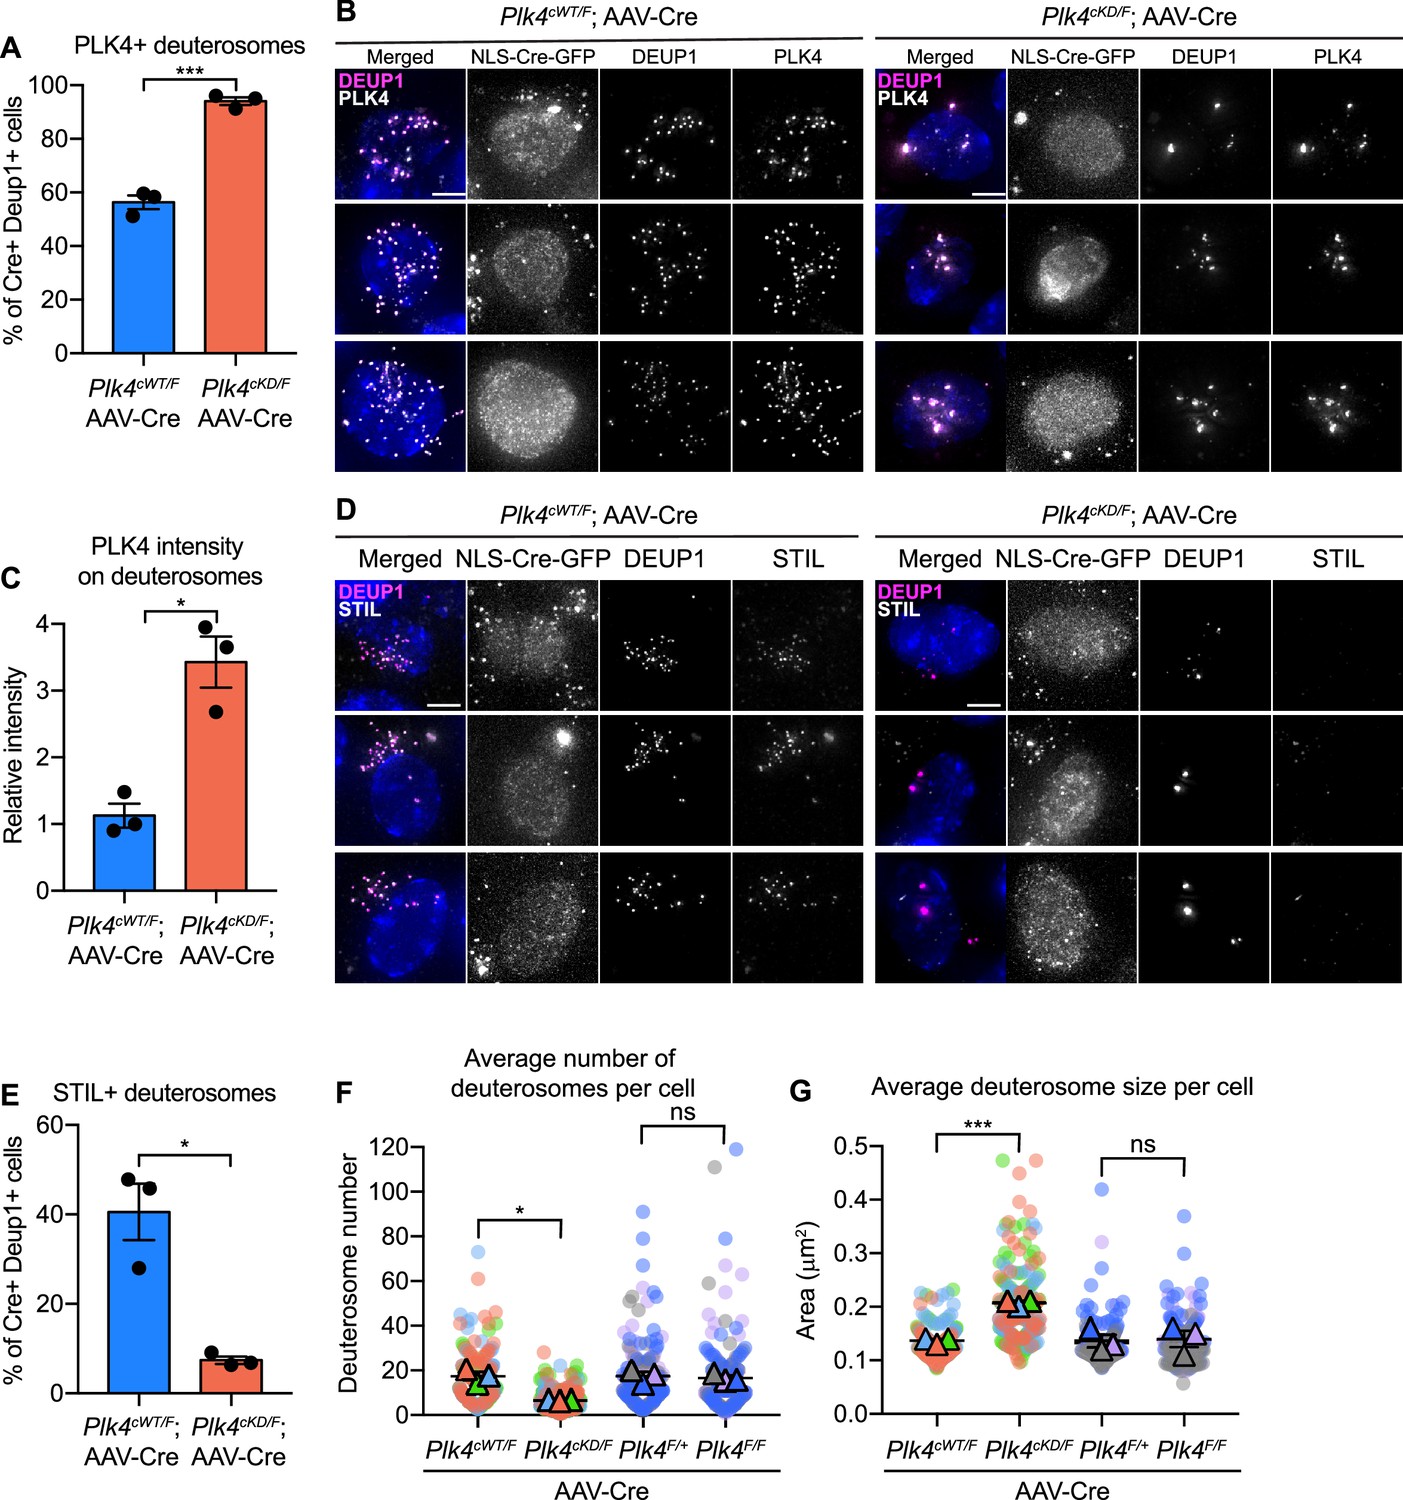
Plk4 kinase activity is critical for centriole amplification in MCCs.
(A) Quantification of the intensity of PLK4 on deuterosomes in mTECs at ALI 2. N=3 (Plk4cWT/F;R26Cre) or 4 (Plk4cKD/F;R26Cre), n=158 (Plk4cWT/F;R26Cre) or 187 (Plk4cKD/F;R26Cre). Two-tailed Welch’s t-test. (B) Representative confocal images of Plk4cWT/F;R26Cre or Plk4cKD/F;R26Cre mTECs at ALI 2 stained with antibodies against PLK4 (white), Centrin (green), and DEUP1 (magenta). Scale bar=5 μm. (C) Quantification of the percent of multiciliated Plk4cWT/F;R26Cre or Plk4cKD/F;R26Cre mTECs at ALI 7. N=3, n>200. Two-tailed Welch’s t-test. (D) Representative confocal images of Plk4cWT/F;R26Cre or Plk4cKD/F;R26Cre mTECs at ALI 7 stained with antibodies against CEP135 (white), Centrin (green), and acetylated-α-tubulin. Scale bar=5 μm. (E) Quantification of the percent of FOXJ1+Plk4cWT/F or Plk4cKD/F ependymal cells transduced with AAV-Cre-GFP that have multiple cilia at differentiation day 12. N=3, n≥100. Two-tailed Welch’s t-test. (F) Confocal images of Plk4cWT/F or Plk4cKD/F ependymal cells transduced with AAV-Cre-GFP at differentiation day 12. Cells were stained with antibodies against FOXJ1 (magenta) and acetylated-α-tubulin (white). Scale bar=5μm. (G) Quantification of the average number of deuterosomes per cell in Plk4cWT/F;R26Cre, Plk4cKD/F;R26Cre, Plk4F/+;R26Cre, or Plk4F/F;R26Cre mTECs. N=3, n≥50. Two-tailed Welch’s t-test. (H) Quantification of the average deuterosome size per cell Plk4cWT/F;R26Cre, Plk4cKD/F;R26Cre, Plk4F/+;R26Cre, or Plk4F/F;R26Cre mTECs. N=3, n≥50. Two-tailed Welch’s t-test. Data information: All data represent the means ± SEM. *p<0.05; **<0.01; and not significant indicates p>0.05. MCC, multiciliated cell.
-
Figure 6—source data 1
Values for biological and technical replicates for graphs in Figure 6.
- https://cdn.elifesciences.org/articles/80643/elife-80643-fig6-data1-v2.xlsx
Figure 6—figure supplement 1
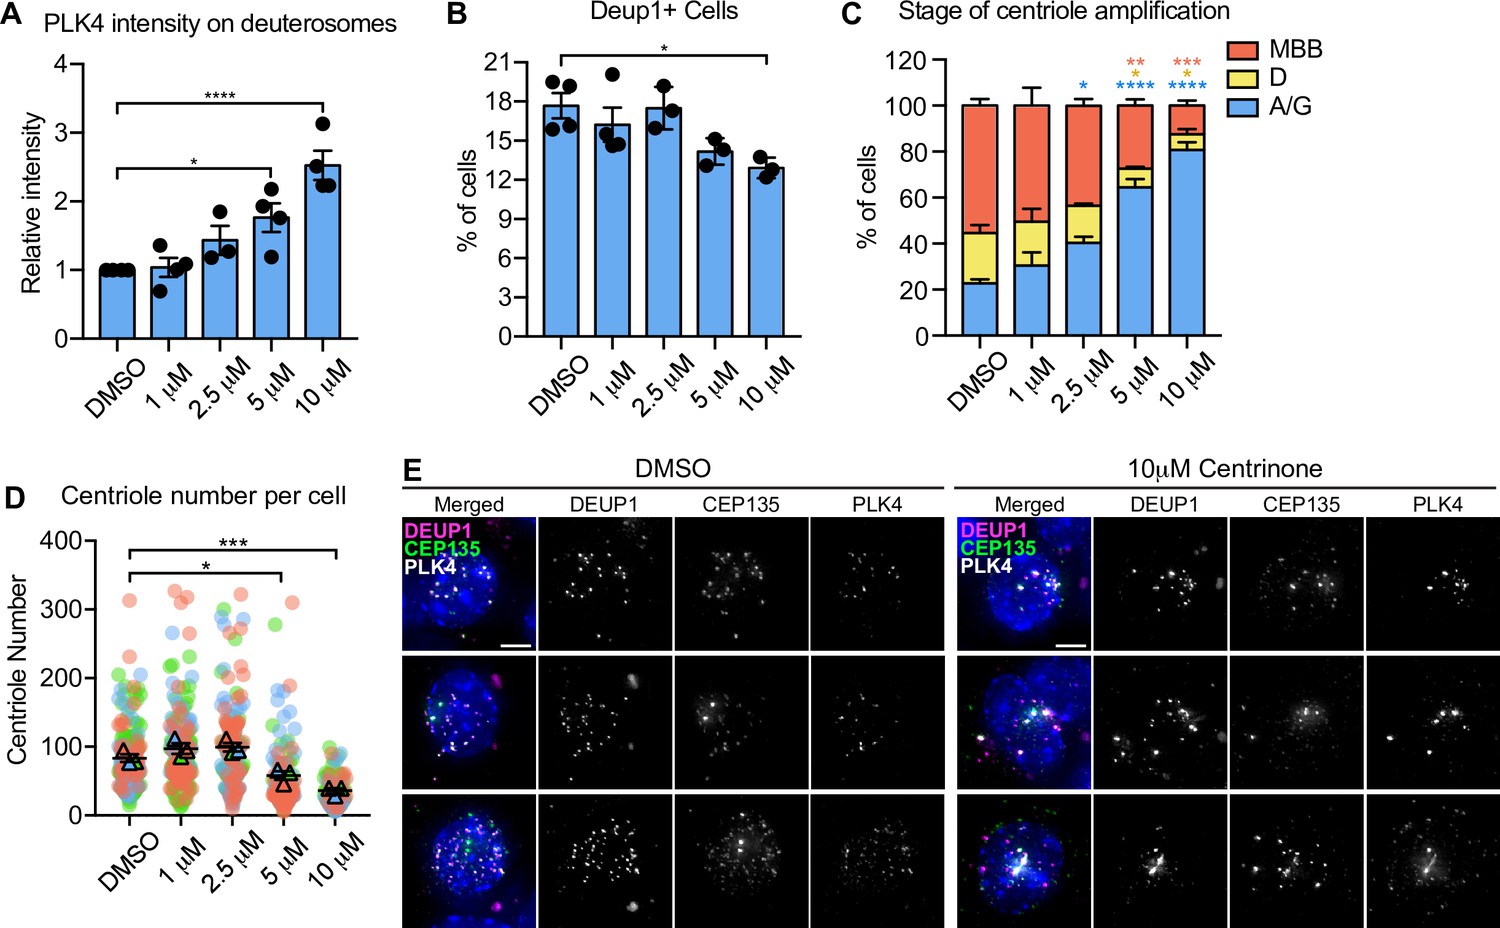
Inhibition of PLK4 kinase activity with centrinone delays centriole amplification in ependymal cells.
(A) Quantification of the intensity of PLK4 on deuterosomes in ependymal cells treated with DMSO or increasing concentrations of centrinone on differentiation day 5. Cells in all stages of centriole amplification were measured and pooled. N≥3, n>20. One-way ANOVA with post hoc analysis. (B) Quantification of the percent of ependymal cells with deuterosomes (marked by DEUP1). Cells were treated with DMSO or increasing concentrations of centrinone and analyzed at differentiation day 7. N≥3, n>100. One-way ANOVA with post hoc analysis. (C) Quantification of the percent of DEUP1+ ependymal cells in A or G stage, D stage, or MBB stage of centriole amplification. Cells were treated with DMSO or centrinone at the indicated concentrations. N=3, n≥67. One-way ANOVA with post hoc analysis. (D) Quantification of the number of centrioles per cell in disengagement (D) phase. Ependymal cells were treated with DMSO or centrinone and analyzed at differentiation day 7. N=3, n≥17. One-way ANOVA with post hoc analysis. (E) Representative images of ependymal cells treated with DMSO or 10 μM of centrinone. Cells were stained with antibodies against CEP135 (green), DEUP1 (magenta), and PLK4 (white). Scale bar=5μm.
-
Figure 6—figure supplement 1—source data 1
Values for biological and technical replicates for graphs in Figure 6—figure supplement 1.
- https://cdn.elifesciences.org/articles/80643/elife-80643-fig6-figsupp1-data1-v2.xlsx
Figure 6—figure supplement 2
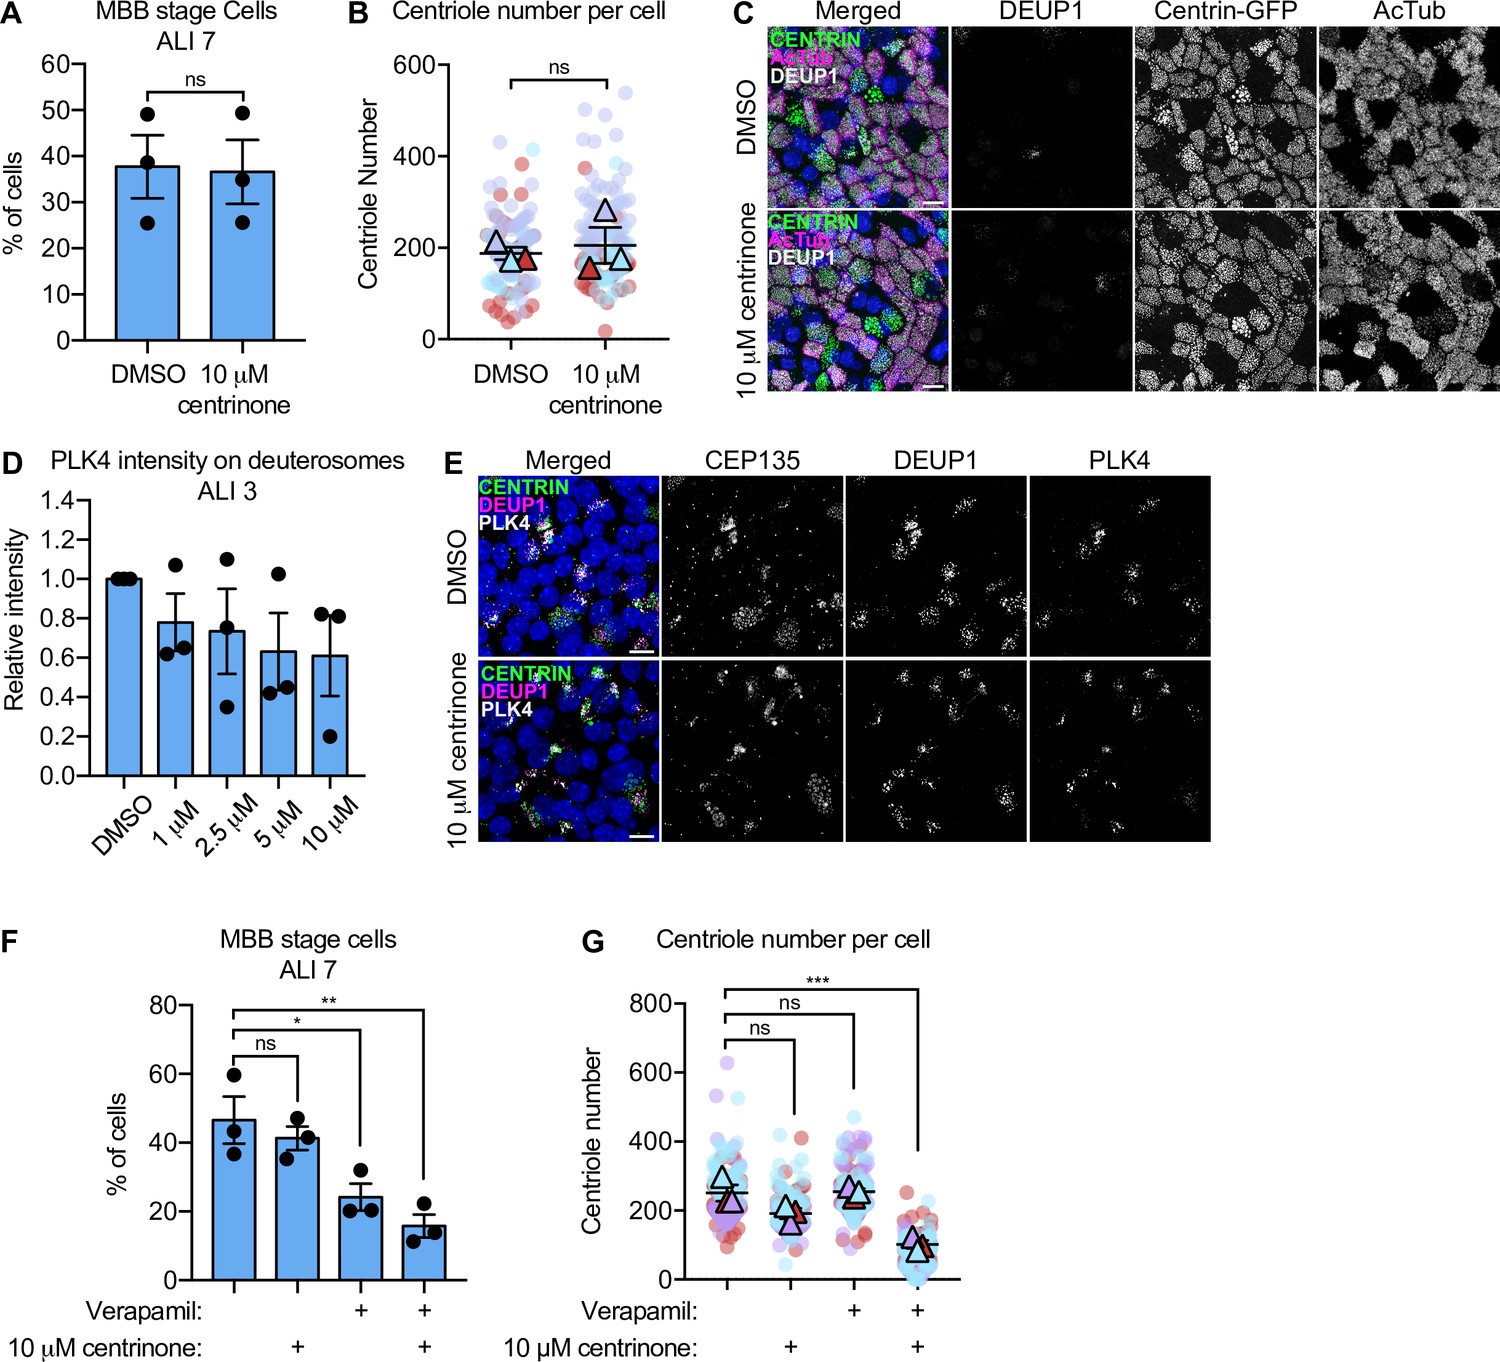
Inhibition of PLK4 kinase activity with centrinone does not perturb centriole amplification in mTECs.
(A) Quantification of the percent of MBB stage mTECs at ALI 7 treated with either DMSO or 10 μM of centrinone. N=3, n>300. Two-tailed Welch’s t-test. (B) Quantification of the number of centrioles per cell in MBB stage mTECs treated with DMSO or 10 μM of centrinone at ALI 7. N=3, n>50. Two-tailed Welch’s t-test. (C) Representative confocal images of mTECs treated with DMSO or 10 μM of centrinone. Cells were analyzed at ALI 7 and stained with antibodies against Centrin (green), DEUP1 (white), and acetylated-α-tubulin (magenta). Scale bar=10μm. (D) Quantification of the intensity of PLK4 on deuterosomes in mTECs treated with DMSO or increasing concentrations of centrinone at ALI 7. Cells in all stages of centriole amplification were measured and pooled. N≥3, n>50. One-way ANOVA with post hoc analysis. (E) Representative confocal images of mTECs treated with DMSO or 10 μM centrinone at ALI 7. Cells were stained with antibodies against centrin (green), DEUP1 (magenta), and PLK4 (white). Scale bar=10μm. (F G) Quantification of the percent of multiciliated mTECs (F) or centriole number per MBB stage cell (G) at ALI 7 treated with either DMSO, 10 μM of centrinone, 10 μM of the broad-spectrum efflux pump inhibitor verapamil, or both 10 μM of centrinone and 10 μM of verapamil. Data information: All data represent the means ± SEM. *p<0.05; **<0.01; ***<0.001; ****<0.0001 and not significant indicates p>0.05. ALI, air-liquid interface; MBB, multiple basal body; mTEC, mouse trachea epithelial cell.
-
Figure 6—figure supplement 2—source data 1
Values for biological and technical replicates for graphs in Figure 6—figure supplement 2.
- https://cdn.elifesciences.org/articles/80643/elife-80643-fig6-figsupp2-data1-v2.xlsx
Figure 6—figure supplement 3
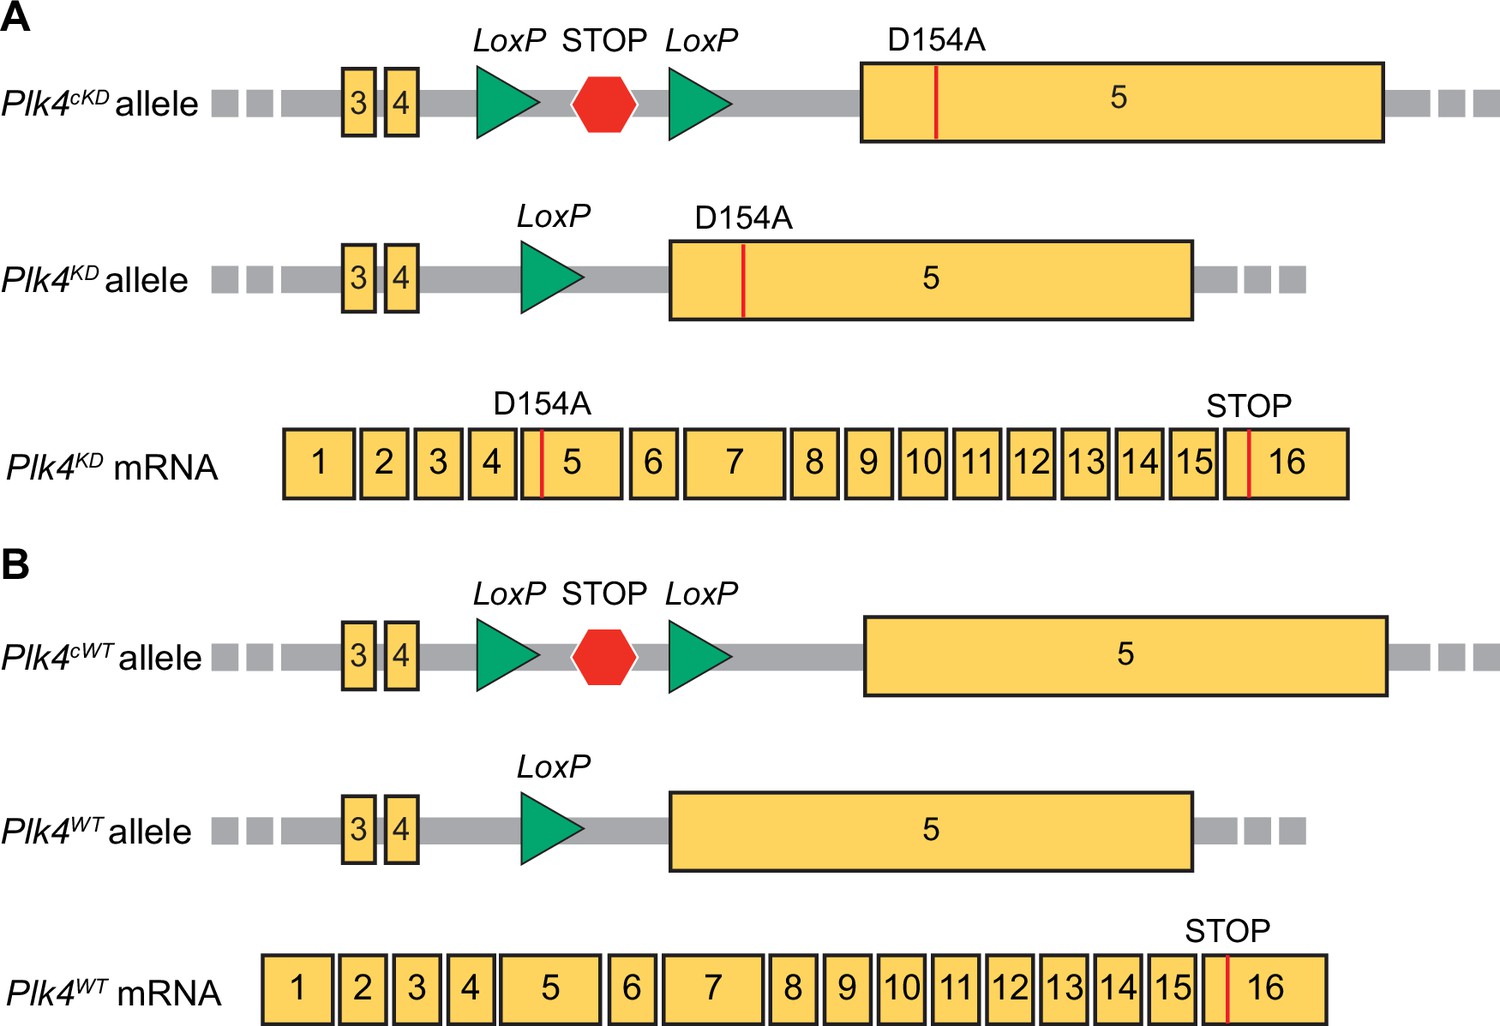
A mouse model for the conditional expression of kinase-dead PLK4.
(A, B) Diagram of the Plk4cKD (A) and Plk4cWT (B) alleles showing LoxP sites surrounding a stop cassette between exons 4 and 5 (top). The stop cassette prevents transcription of either the wild-type or kinase-dead gene. Diagram of the Plk4KD (A) and Plk4WT (B) alleles following Cre-mediated recombination (middle). Excision of the LoxP-STOP-LoxP cassette allows for transcription. Diagram of the mRNA product created from Plk4KD (A) and Plk4WT (B) alleles (bottom).
Figure 6—figure supplement 4
PLK4 kinase activity is required for centriole amplification in ependymal cells.
(A) Percent of AAV-Cre transduced ependymal cells with PLK4 on deuterosomes. N=3, n>70. Two-tailed Welch’s t-test. (B) Representative images of AAV-Cre transduced Plk4cWT/F and Plk4cKD/F ependymal cells stained with DEUP1 (magenta) and PLK4 (white). Scale bar=5 μm. (C) Quantification of the intensity of PLK4 on deuterosomes in ependymal cells on differentiation day 5. Cells in all stages of centriole amplification were measured and pooled. N=3, n≥50. Two-tailed Welch’s t-test. (D) Representative images of AAV-Cre transduced ependymal cells stained with antibodies against DEUP1 (magenta) and STIL (white). Scale bar=5 μm. (E) Quantification of the percent of AAV-Cre transduced Plk4cWT/F and Plk4cKD/F ependymal cells with STIL + deuterosomes. N>3, n≥50. Two-tailed Welch’s t-test. (F) Quantification of the average number of deuterosomes per cell in AAV-Cre transduced Plk4cWT/F, Plk4cKD/F, Plk4F/+, or Plk4F/F ependymal cells. N=3, n≥50. Two-tailed Welch’s t-test. (G) Quantification of the average deuterosome size per cell in AAV-Cre transduced Plk4cWT/F, Plk4cKD/F, Plk4F/+, or Plk4F/F ependymal cells. N=3, n≥50. Two-tailed Welch’s t-test. Data information: All data represent the means ± SEM. *p<0.05; ***<0.001; and not significant indicates p>0.05.
-
Figure 6—figure supplement 4—source data 1
Values for biological and technical replicates for graphs in Figure 6—figure supplement 4.
- https://cdn.elifesciences.org/articles/80643/elife-80643-fig6-figsupp4-data1-v2.xlsx
Figure 7
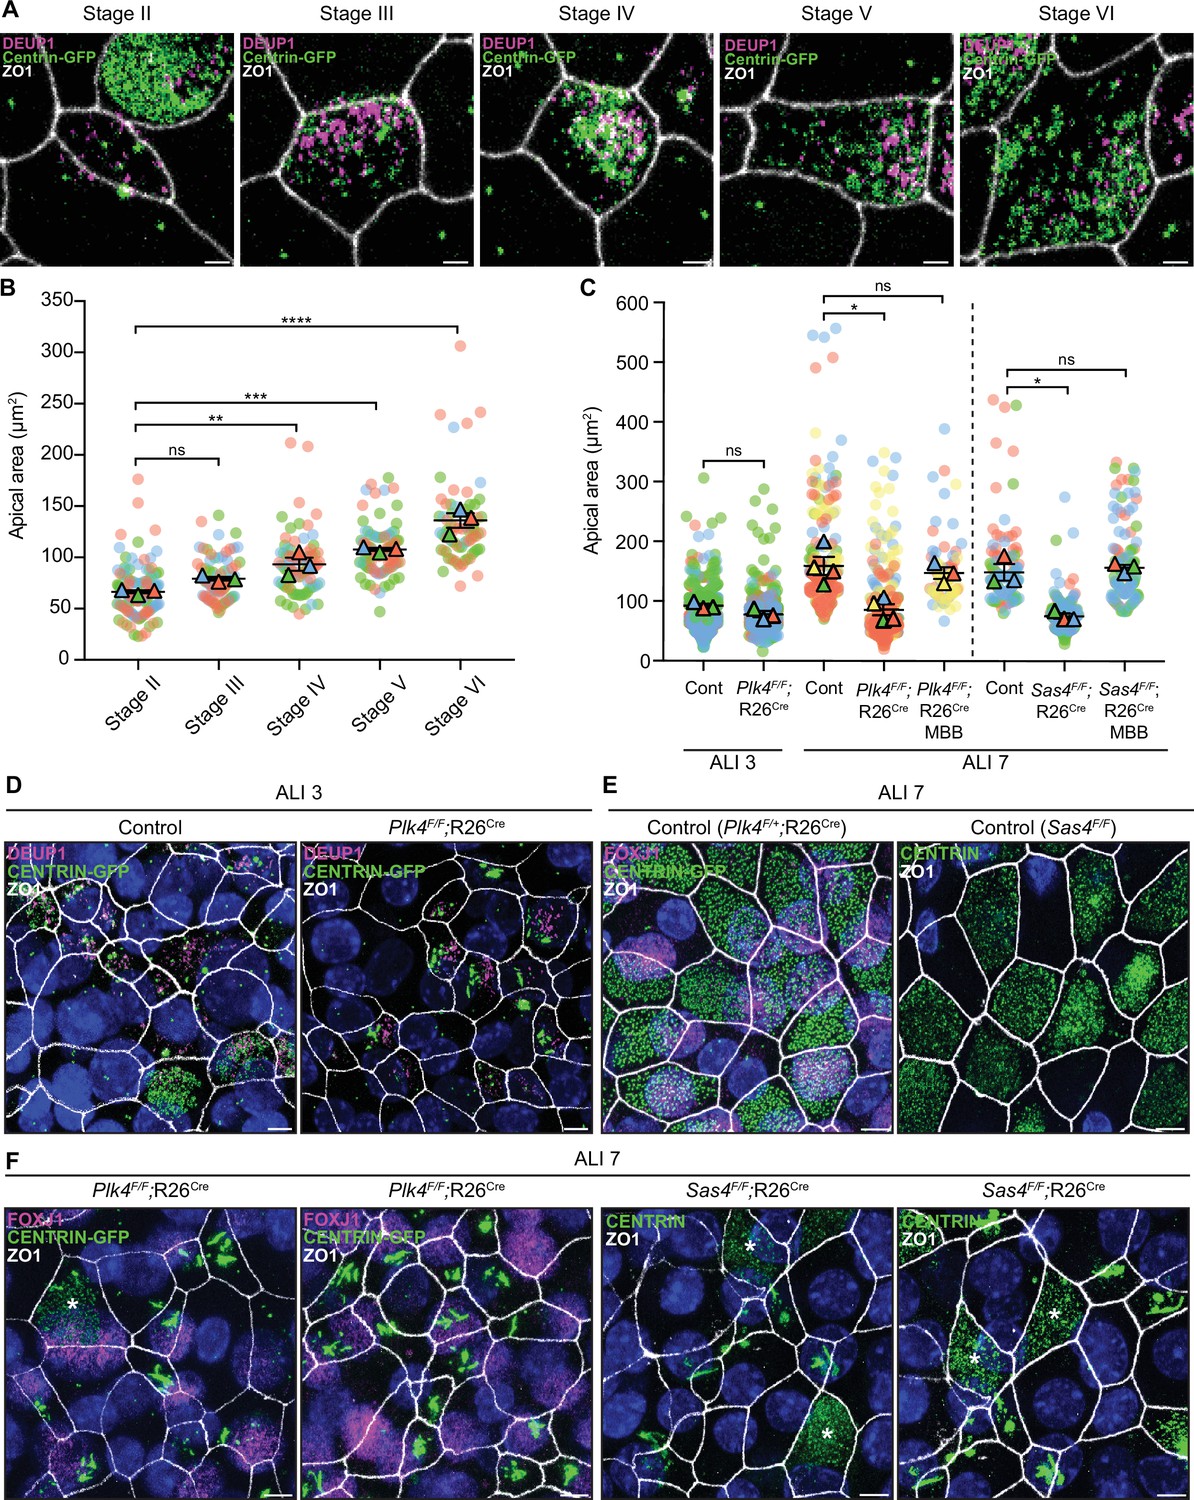
Centriole amplification promotes apical surface area expansion in mTECs.
(A) Representative confocal images of control mTECs in stages II-VI of centriole amplification. Cells were expressing Centrin-GFP and stained with antibodies against DEUP1 (magenta) and ZO1 (white). Scale bar = 2 μm. (B) Graph of the apical area of control mTECs (marked with ZO1) at ALI 3 at different stages of centriole amplification. Circles represent individual cells and triangles represent the average per biological replicate. N=3, n≥20. One-way ANOVA with post hoc analysis. (C) Graph of the apical area of control, Plk4F/F;R26Cre and Sas4F/F;R26Cre mTECs at ALI 3 and ALI 7. The area across all stages of centriole amplification was pooled per condition. MBB phase cells that presumably escaped Cre-mediated recombination serve as an internal control. Circles represent individual cells and triangles represent the average per biological replicate. N≥3, n≥50. Two-tailed Welch’s t-test (ALI 3). One-way ANOVA with post hoc analysis (ALI 7). (D) Representative confocal images of control and Plk4F/F;R26Cre mTECs at ALI 3. Cells were expressing Centrin-GFP and stained with antibodies against DEUP1 (magenta) and ZO1 (white). Scale bar = 5 μm. (E) Representative confocal images of control mTECs at ALI 7. Plk4F/+;R26Cre cells were expressing Centrin-GFP and stained with antibodies against FOXJ1 (magenta) and ZO1 (white). Sas4F/F cells were stained with antibodies against Centrin (green) and ZO1 (white). Scale bar = 5 μm. (F) Representative confocal images of Plk4F/F;R26Cre and Sas4F/F;R26Cre mTECs at ALI 7. Plk4F/F;R26Cre cells were expressing Centrin-GFP and stained with antibodies against FOXJ1 (magenta) and ZO1 (white). Sas4F/F;R26Cre cells were stained with antibodies against Centrin (green) and ZO1 (white). MBB phase cells that presumably escaped Cre-mediated recombination are marked with an *. Scale bar = 5 μm. Data information: All data represent the means ± SEM. *P < 0.05; **< 0.01; ***< 0.001; ****< 0.0001 and not significant indicates P > 0.05.
-
Figure 7—source data 1
Values for biological and technical replicates for graphs in Figure 7.
- https://cdn.elifesciences.org/articles/80643/elife-80643-fig7-data1-v2.xlsx
Author response image 1
Tables
Key resources table
| Reagent type (species) or resource | Designation | Source or reference | Identifiers | Additional information |
|---|---|---|---|---|
| Antibody | Rabbit polyclonal CEP164 | EMD Millipore | ABE2621 | (IF) use 1:1000 |
| Antibody | Mouse monoclonal acetylated-α-tubulin | Cell Signaling Technology | 12152 | (IF) use 1:1000, (IHC) use 1:500 |
| Antibody | Rat polyclonal ZO-1 | Thermo Fisher Scientific | 14-9776-82 | (IF) use 1:1000 |
| Antibody | Rabbit polyclonal DEUP1 | Mercey et al., 2019. https://doi.org/10.1038/s41556-019-0427-x | (IF) use 1:1000 | |
| Antibody | Mouse monoclonal SAS6 | Santa Cruz Biotechnology | sc-81431 | (IF) use 1:1000 |
| Antibody | Rabbit polyclonal PCNT | Abcam | ab4448 | (IF) use 1:1000 |
| Antibody | Mouse monoclonal FOXJ1 | Thermo Fisher Scientific | 14-9965-82 | (IF) use 1:1000 |
| Antibody | Rabbit polyclonal PLK4 | Moyer et al., 2015. https://doi.org/10.1083/jcb.201502088 | (IF) use 1:1000 | |
| Antibody | Rabbit polyclonal STIL | Moyer et al., 2015.https://doi.org/10.1083/jcb.201502088 | (IF) use 1:1000 | |
| Antibody | Rabbit polyclonal CEP135 | This study | Homemade, raised against a.a. 649–1140. (IF) use 1:1000 | |
| Antibody | Rabbit polyclonal acetylated-α-Tubulin | Cell Signaling Technology | 5335 | (IF) use 1:1000, (IHC) use 1:500 |
| Antibody | Rabbit polyclonal CNTROB | Atlas Antibodies | HPA023321 | (IF) use 1:1000 |
| Antibody | Rabbit polyclonal CEP152 | This study | Homemade, raised against a.a. 491–810. (IF) use 1:1000 | |
| Antibody | Rabbit polyclonal CDK5RAP2 | Bethyl | BETIHC-00063 | (IF) use 1:1000 |
| Antibody | Goat polyclonal CEP192 | Moyer and Holland, 2019. https://doi.org/10.7554/eLife.46054 | (IF) use 1:1000 | |
| Antibody | Goat polyclonal g-Tubulin | Levine et al., 2017. https://doi.org//10.1016/j.devcel.2016.12.022 | (IF) use 1:1000 | |
| Chemical compound, drug | Centrinone | Tocris Bioscience | Cat. no. 5687 | Varying concentrations |
| Chemical compound, drug | Verapamil | Cytoskeleton, Inc | Cat. #CY-SC002 | Use at 10 µM |
| Other | DAPI Stain | MilliporeSigma | Cat. no. 10236276001 | (IF) use 1:1000 |
Additional files
Download links
A two-part list of links to download the article, or parts of the article, in various formats.
Downloads (link to download the article as PDF)
Open citations (links to open the citations from this article in various online reference manager services)
Cite this article (links to download the citations from this article in formats compatible with various reference manager tools)
PLK4 drives centriole amplification and apical surface area expansion in multiciliated cells
eLife 11:e80643.
https://doi.org/10.7554/eLife.80643


