Sex and prior exposure jointly shape innate immune responses to a live herpesvirus vaccine
- Center for Human Immunology, National Institutes of Health, United States
- Medical Virology Section, Laboratory of Infectious Diseases, National Institutes of Health, United States
- Multiscale Systems Biology Section, Laboratory of Immune System Biology, National Institutes of Health, United States
Figures
Figure 1 with 1 supplement
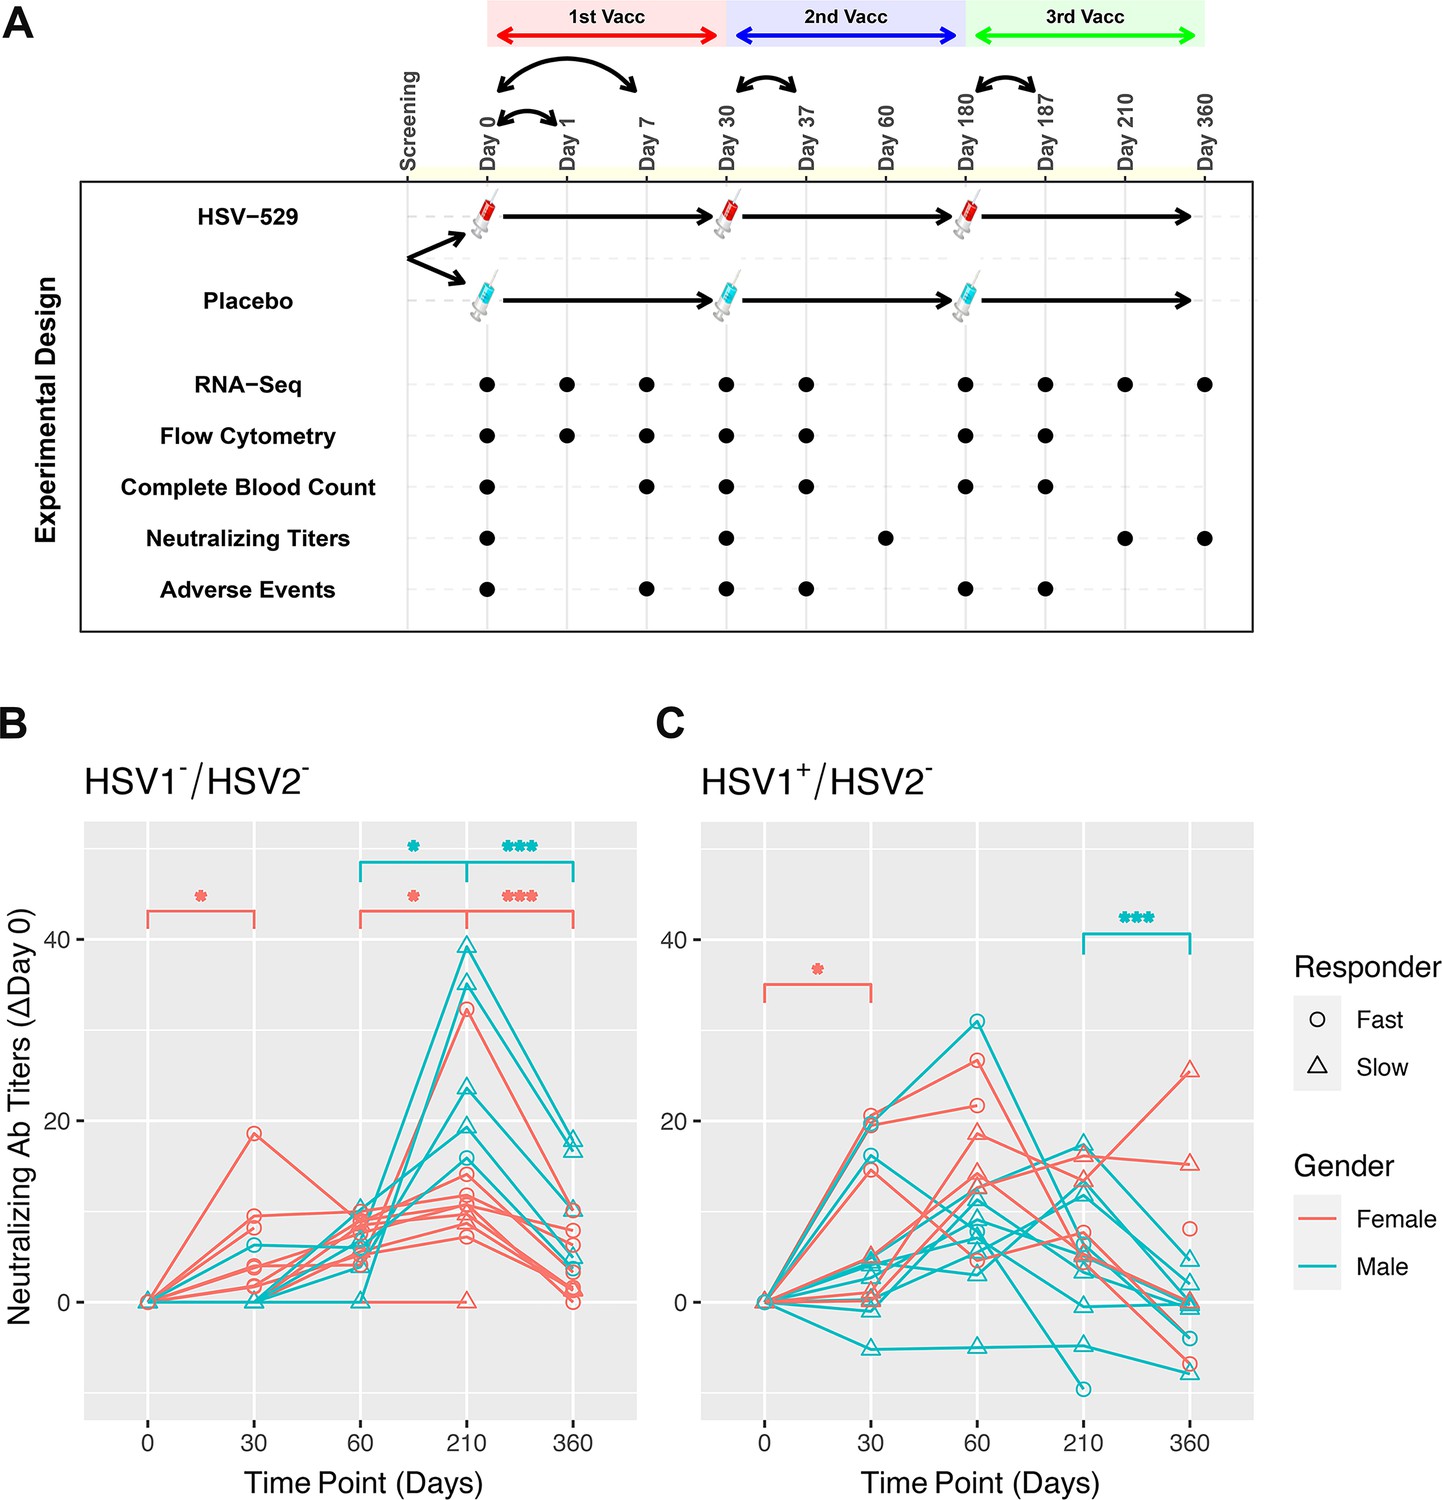
Prior exposure and sex affect neutralizing antibody responses after HSV529 vaccination.
(A) Schematic outline of the vaccination strategy and study design. Each subject was randomized to receive three vaccinations with HSV529 or saline placebo on days 0, 30, and 180. Timepoints are marked at which blood was obtained for immune phenotyping assays, or when adverse events were scored. (B, C) Changes in HSV2 neutralizing antibody titer over time are shown for HSV529 vaccine recipients, plotted separately for subjects with no prior exposure to herpes simplex virus (HSV) (HSV1−/HSV2−) or for HSV1 seropositive subjects (HSV1+/HSV2−). Subjects are shown classified by sex and as slow or fast responders to vaccination based on the increase in HSV2 neutralizing titer by day 30. Rapid responders were defined by an increase in neutralizing antibody responses at day 30 for subjects who were HSV1−/HSV2− before vaccination. In subjects HSV1+/HSV2− prior to vaccination, in whom an increase in neutralizing antibody responses was observed by day 30 for most individuals, rapid responders were a distinct group marked by higher titer responses compared to slow responders at day 30. Significant changes are indicated for men and women separately (*p < 0.05, ***p < 0.001).
Figure 1—figure supplement 1
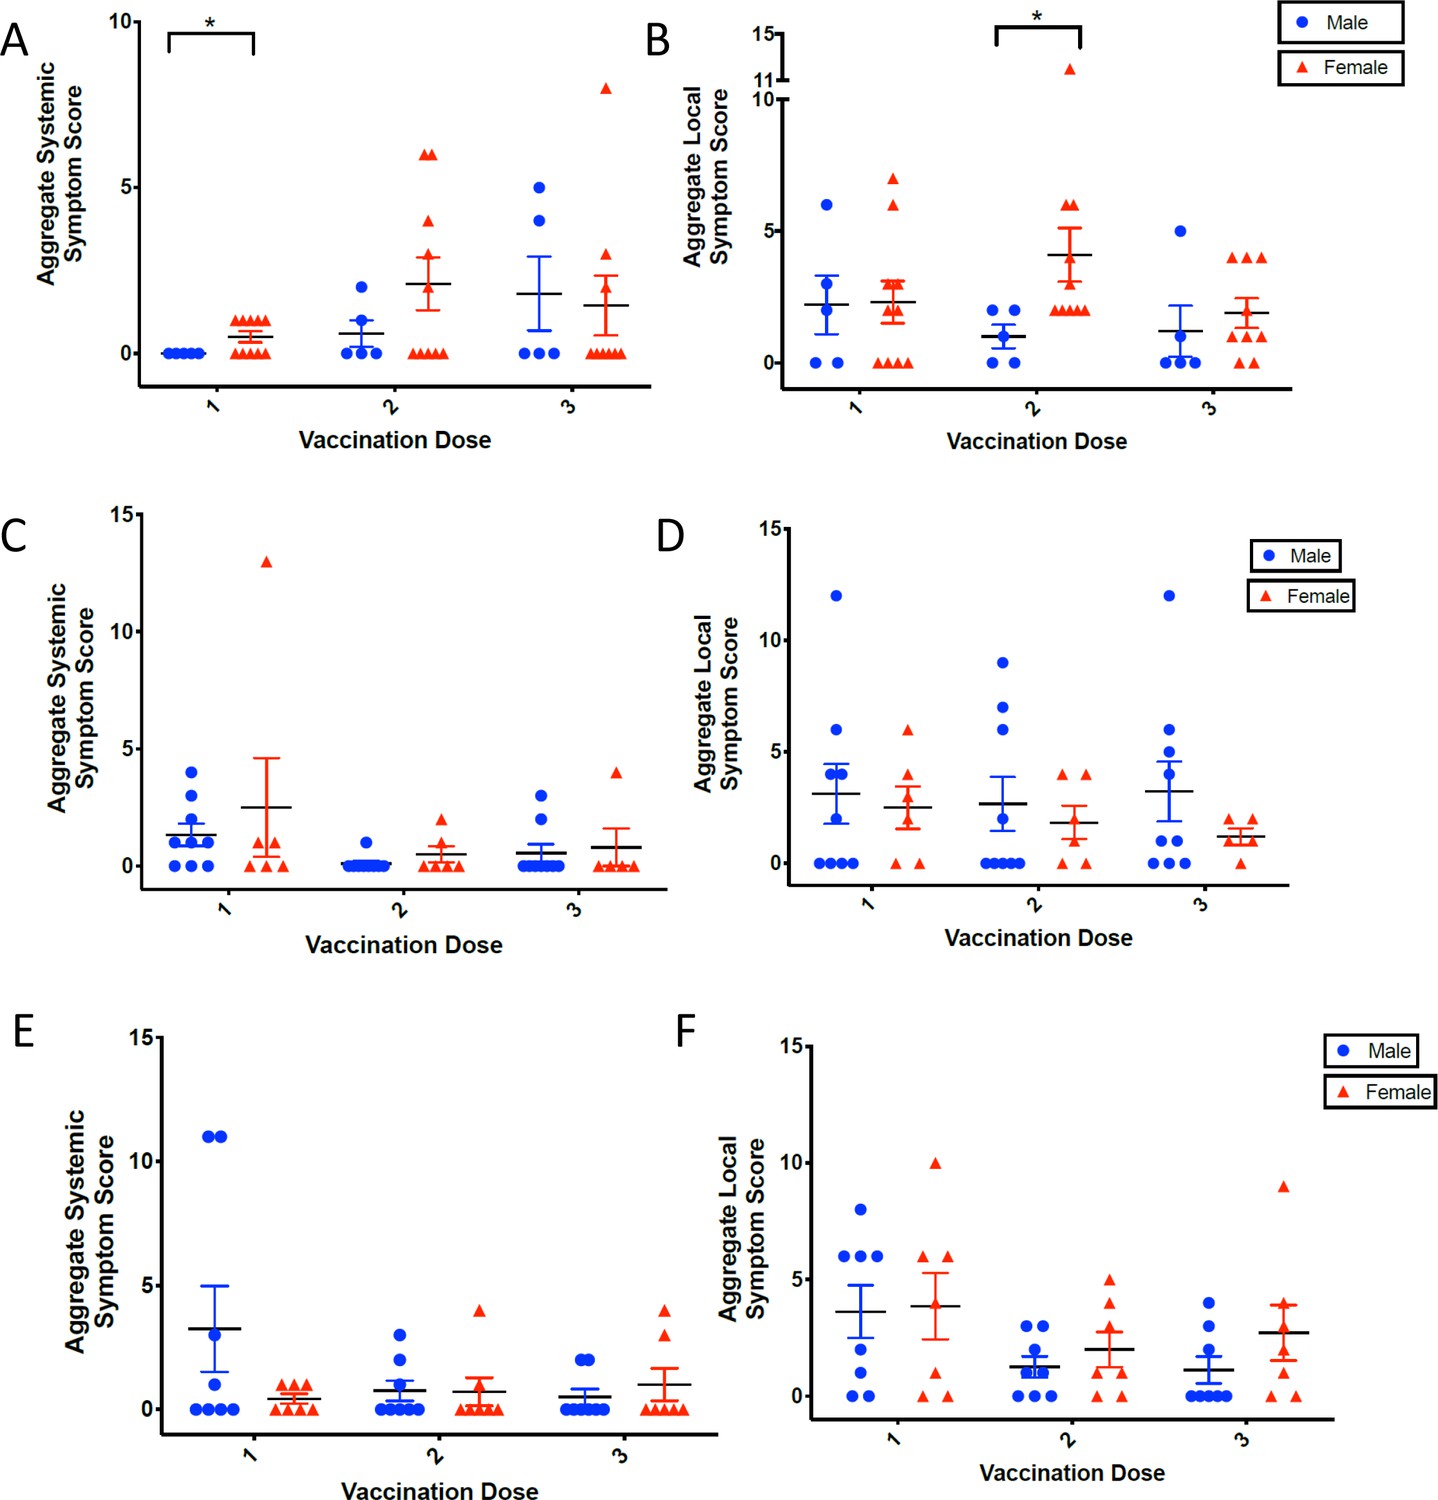
Quantification of adverse events in HSV529 recipients.
Aggregate systemic (A, C, E) and local (B, D, F) symptom scores for the first 7 days after each dose are shown for HSV529 in recipients which were HSV1−/HSV2− (A, B), HSV1+/HSV2− (C, D), or HSV1±/HSV2+ (E, F). Long black horizontal lines indicate means and short red or blue horizontal lines are standard errors, each data point is a different vaccine recipient, and *p < 0.05. Aggregate symptom scores were determined by multiplying the severity of each symptom by the number of days it persisted and adding the values for each of the first 7 days after each dose of vaccine.
Figure 2 with 1 supplement
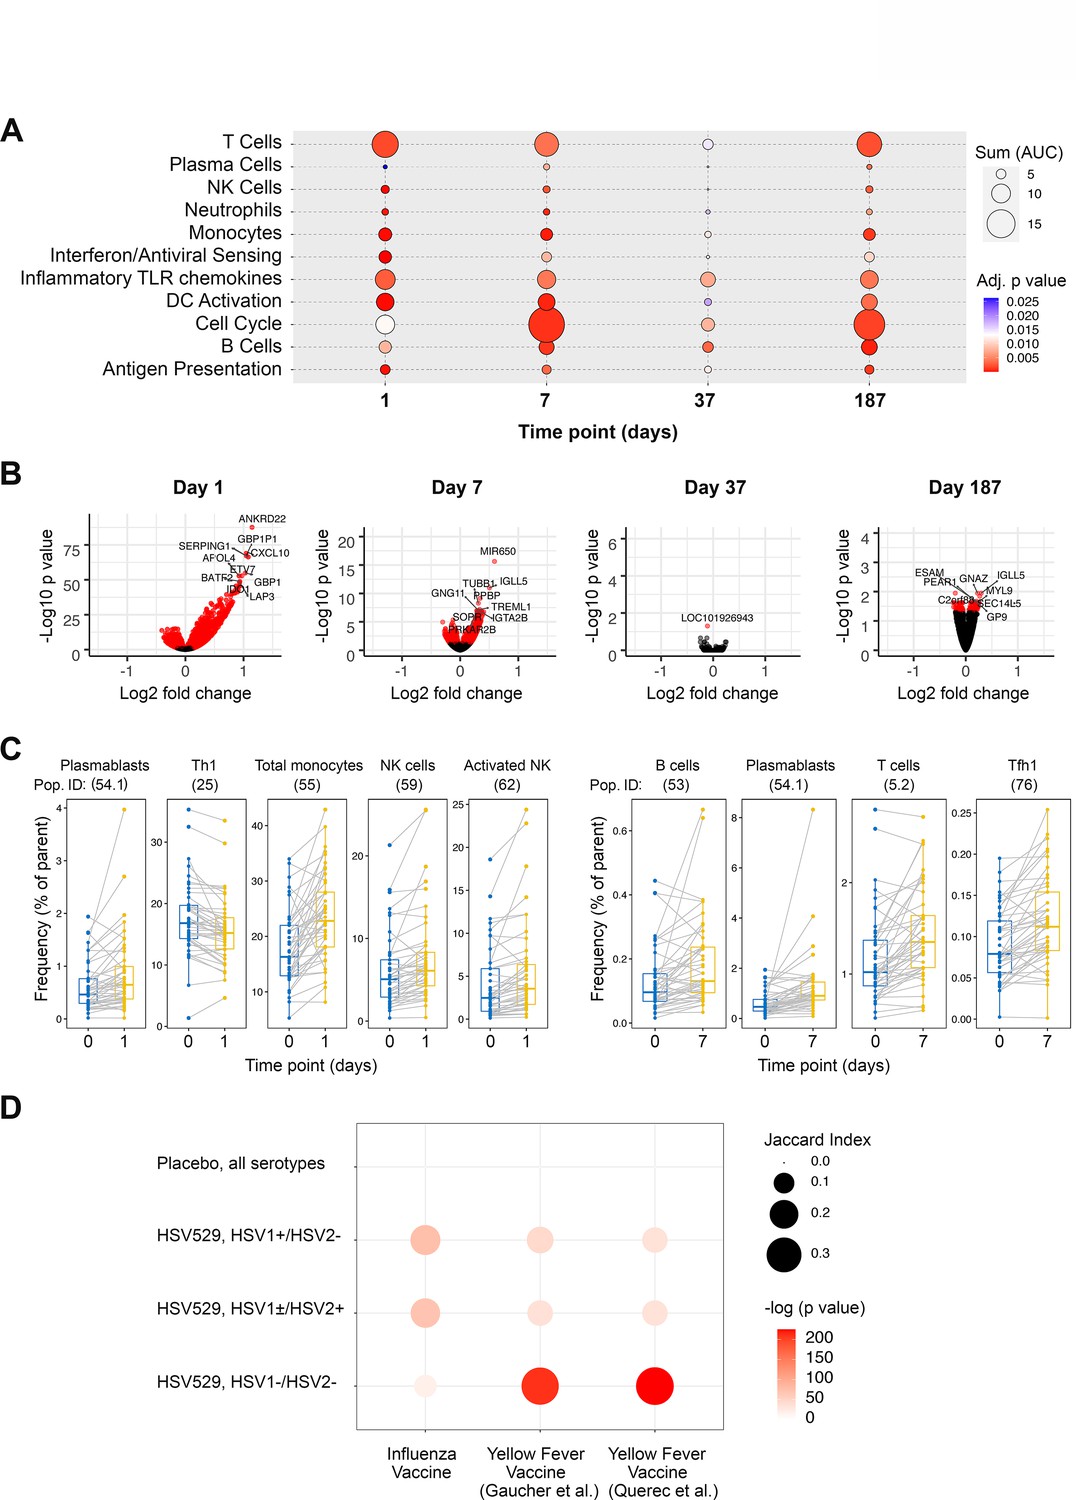
Peripheral blood phenotypic responses are greatest on day 1 after vaccination with HSV529 and differ based on prior exposure to herpes simplex virus (HSV).
(A) Transcriptomic phenotypes of PBMCs were characterized by RNA-seq and responses for all HSV529 recipients were defined by comparing observations at day 1 or 7 to day 0 (day of the first vaccination dose), and for subsequent doses by comparing between the day of the second or third vaccination dose and timepoints 7 days later (days 37 and 187). Functions represented by the genes differentially expressed were assessed by enrichment of blood transcription modules (BTMs), and all significantly enriched modules are shown (FDR adjusted p < 0.05) with plotted size and color indicating the normalized effect size and significance, respectively, for enrichments. (B) Volcano plots show the changes in individual genes for all HSV529 recipients, with significantly differentially expressed genes colored red (FDR adjusted p < 0.05), and the most significantly differentially expressed genes labeled. Note that the scale of the y axes differ between the days that were analyzed. (C) Flow cytometry was used to quantify the frequencies of 70 PBMC populations for all HSV529 recipients. Examples of populations that showed significant changes at either day 1 or 7 after the first vaccine dose compared to day 0 are shown (FDR adjusted p < 0.05). (D) Changes in gene expression between days 0 and 1 were next determined separately for subjects that received HSV529 and differed in their status in terms of prior exposure to HSV, or that received placebo and in which all groups of prior exposure were combined (y-axis). Jaccard index values and statistical significance, indicated by plotted size and color, respectively, are shown for overlap of these expression changes with the differentially expressed genes reported in previous studies of vaccine responses at day 1 to influenza (Tsang et al., 2014) and in two studies of yellow fever (x-axis) (Gaucher et al., 2008; Querec et al., 2009).
Figure 2—figure supplement 1
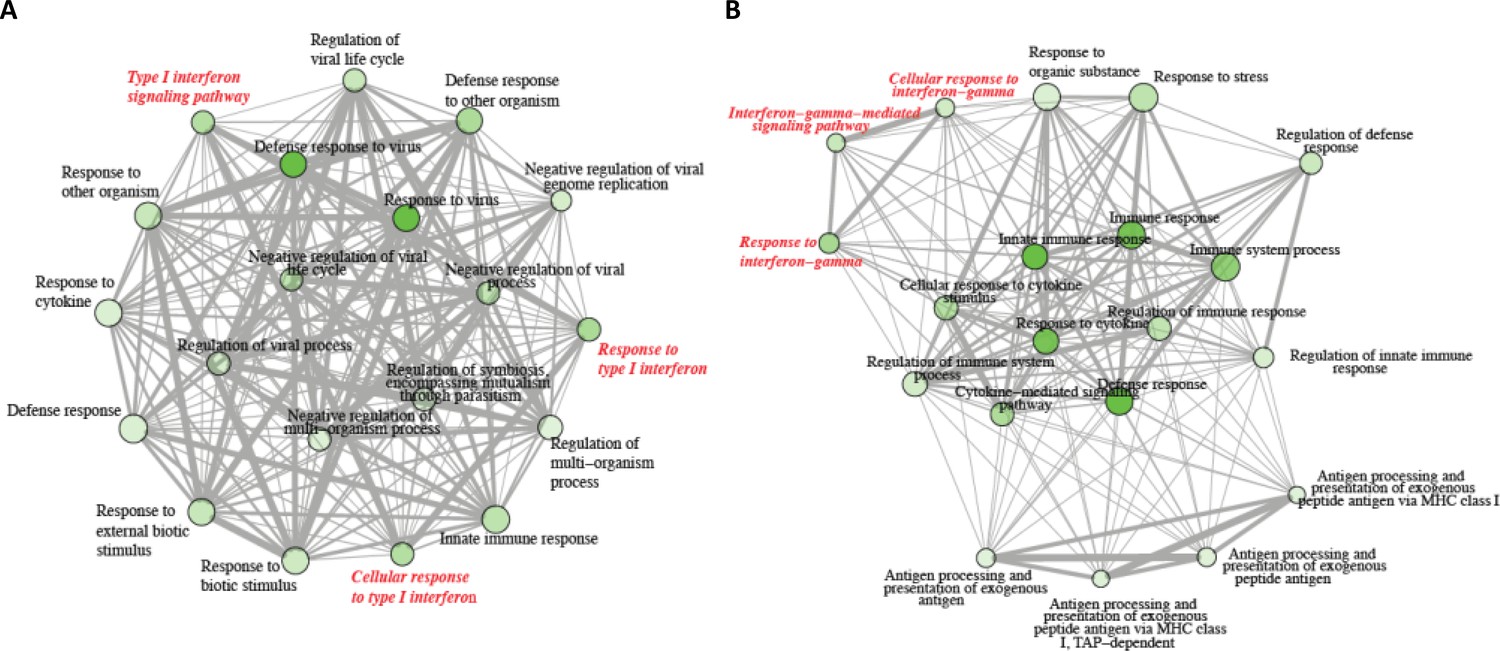
Characterization of pathways enriched for overlap between responses to HSV529 and to vaccines for other pathogens.
(A) Network analysis of the pathways enriched in overlap between herpes simplex virus (HSV) seronegative HSV529 recipients and yellow fever vaccine recipients (Gaucher et al., 2008; Querec et al., 2009). The color intensity and size of nodes increase with the significance and size of enriched gene sets, respectively. Edge intensity increases with the number of overlapping genes, and type I interferon (IFN)-related gene sets are highlighted in red. (B) A similar network analysis for pathways enriched in overlap between HSV2 seropositive HSV529 recipients and influenza vaccine recipients, with IFN-γ-related gene sets highlighted in red.
Figure 3 with 2 supplements
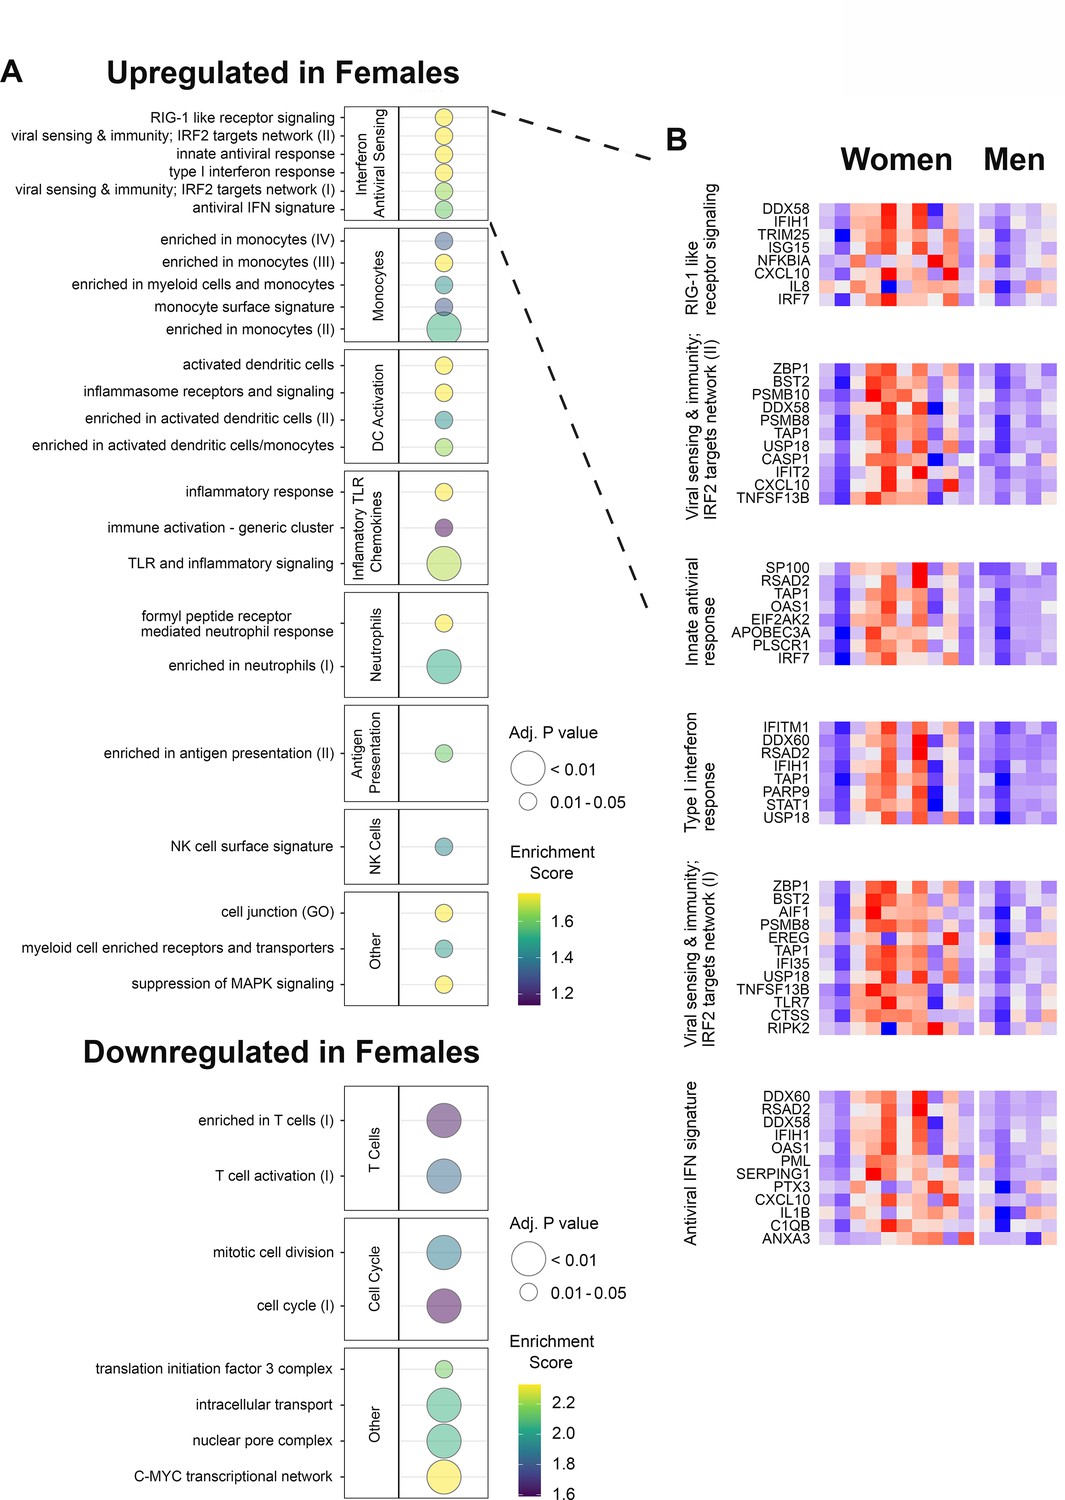
Gene expression responses to HSV529 show associations with sex in herpes simplex virus (HSV) seronegative vaccine recipients.
(A) Changes in expression of all genes between days 0 and 1 were compared between men and women for HSV1−/HSV2− subjects, and used to rank genes by fold change for hypergeometric enrichment analysis of blood transcription modules (BTMs). All pathways with significant enrichment in either sex are shown (FDR adjusted p < 0.05), with enrichment score and significance indicated by plotted color and size, respectively. (B) For the interferon and antiviral sensing module, responses of the 40 different leading-edge genes in 6 represented gene sets are shown in rows for the 15 HSV naive subjects in columns. The change in expression at day 1 compared to day 0 is shown with z-scores normalized separately for each of the six gene sets, where red indicates above and blue indicates below mean values.
Figure 3—figure supplement 1
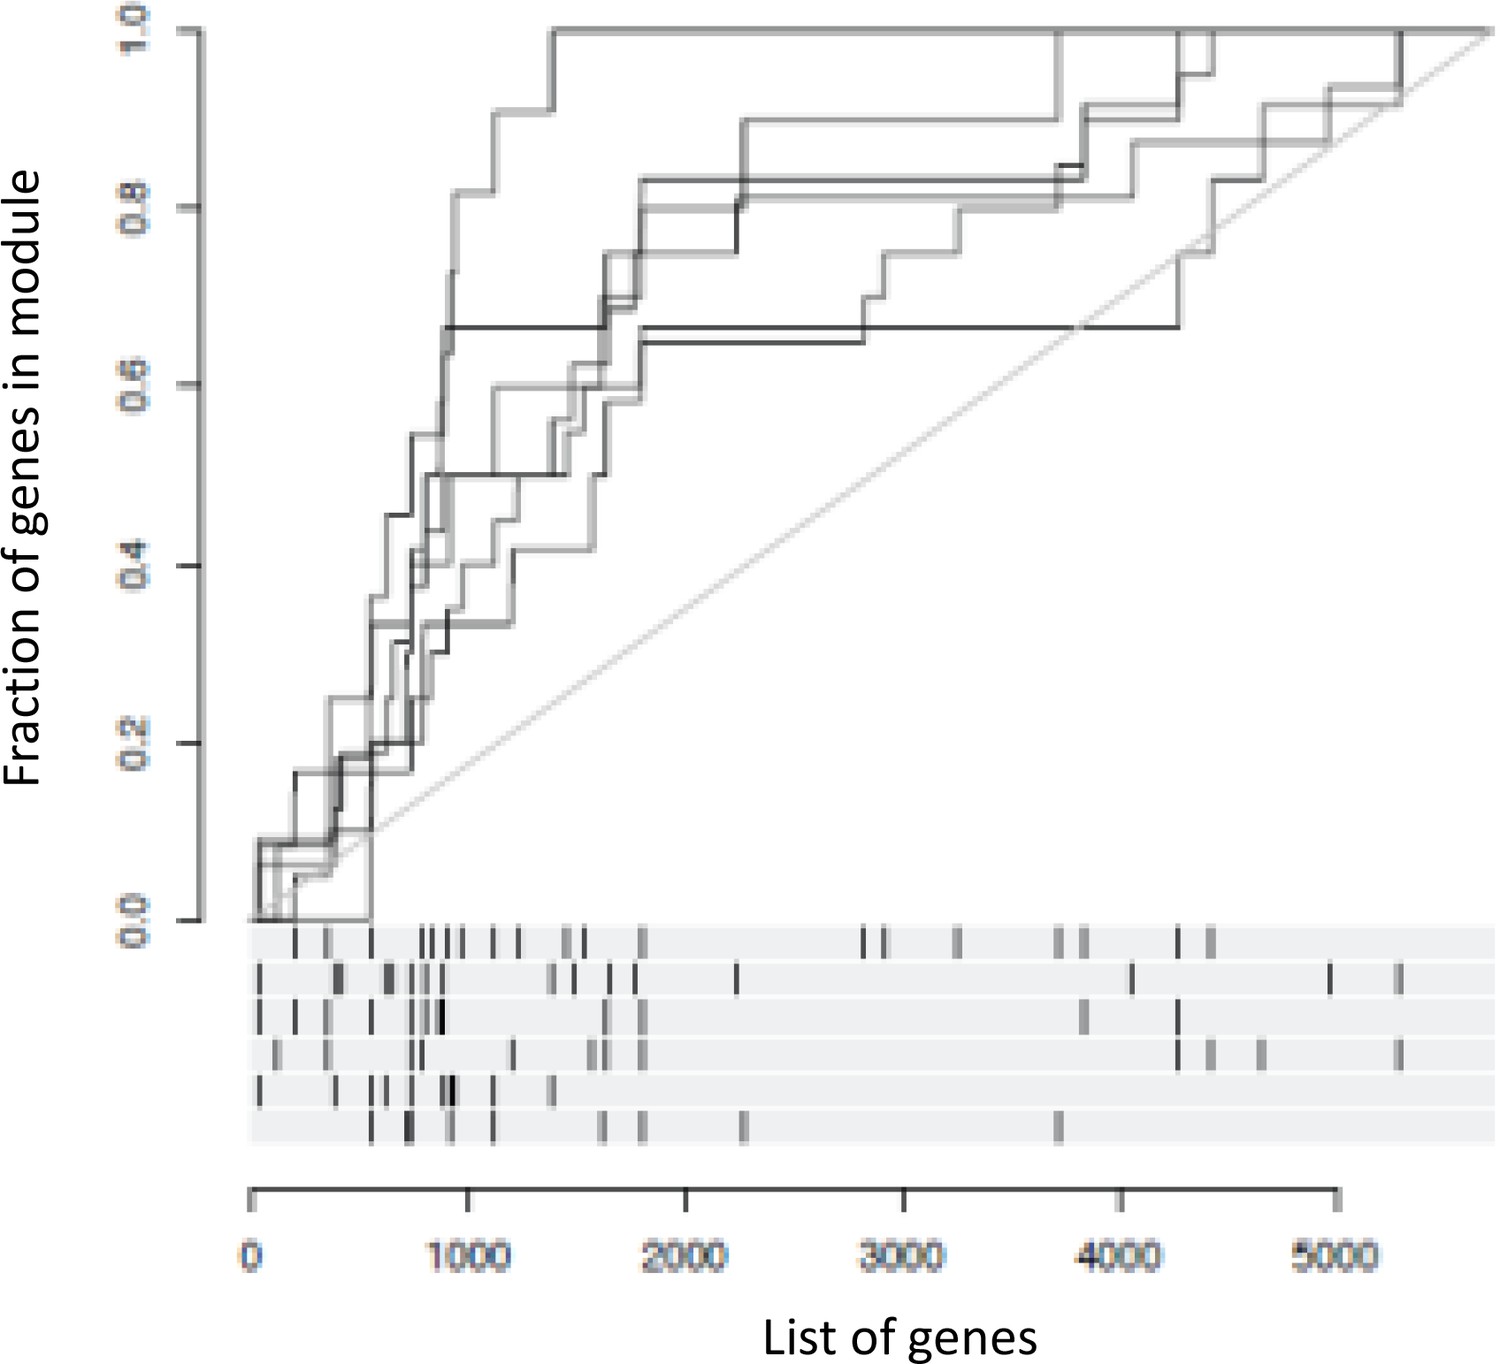
Enrichment of interferon (IFN) module gene sets in association with sex and prior exposure in day 1 transcriptional responses to HSV529.
Six gene sets from the IFN and antiviral sensing module were enriched when comparing sex differences within herpes simplex virus (HSV) naive subjects in day 1 transcriptional responses (Figure 3A). For these enrichments, plots show the fraction of genes included from each set (y-axis) when all genes tested are ranked by decreasing difference when comparing expression in women to men (x-axis), with bars on the x-axis showing the distribution of members of these gene sets as black marks.
Figure 3—figure supplement 2
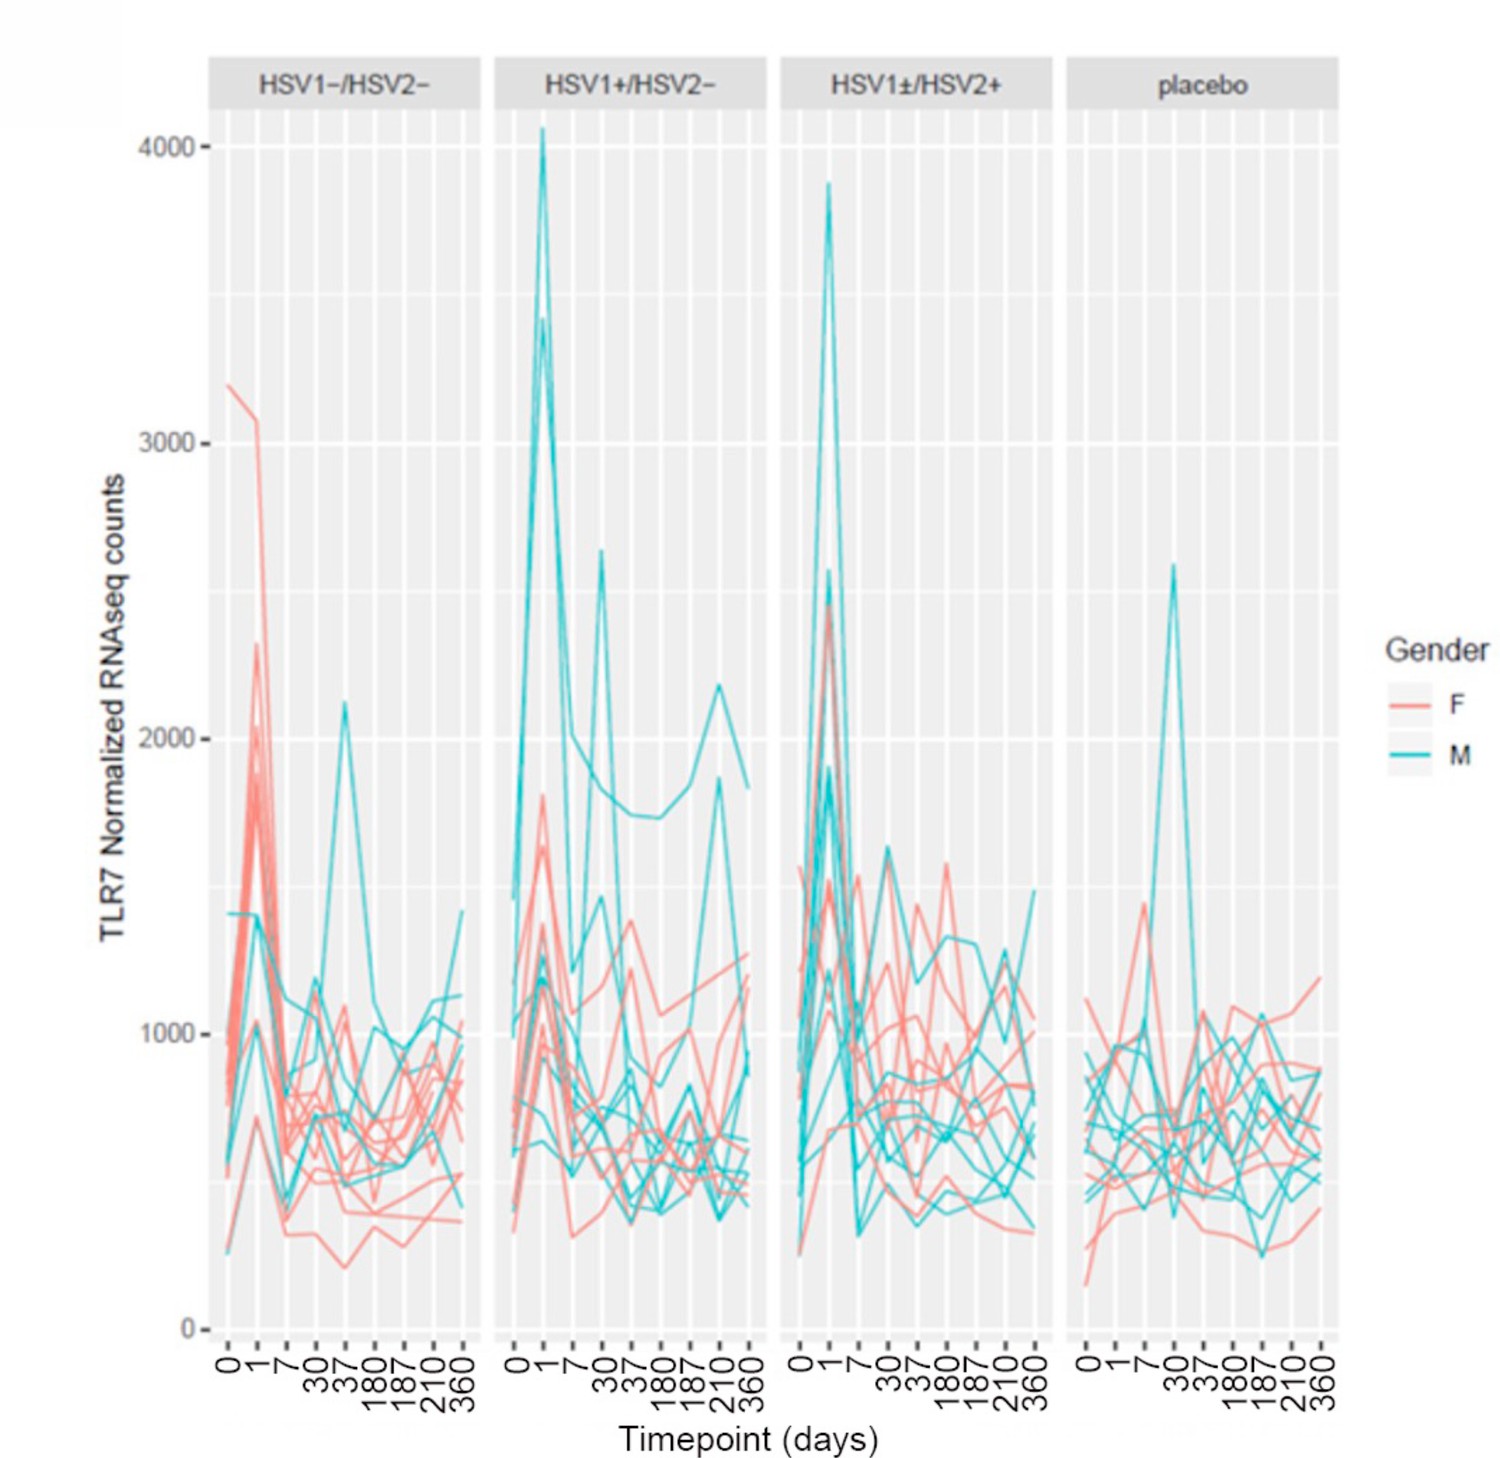
TLR7 gene expression response to vaccination.
Longitudinally monitored TLR expression is plotted for all 60 subjects, colored by sex and separated by herpes simplex virus (HSV) serostatus for vaccine recipients, or with all serogroups combined for placebo recipients.
Figure 4 with 2 supplements
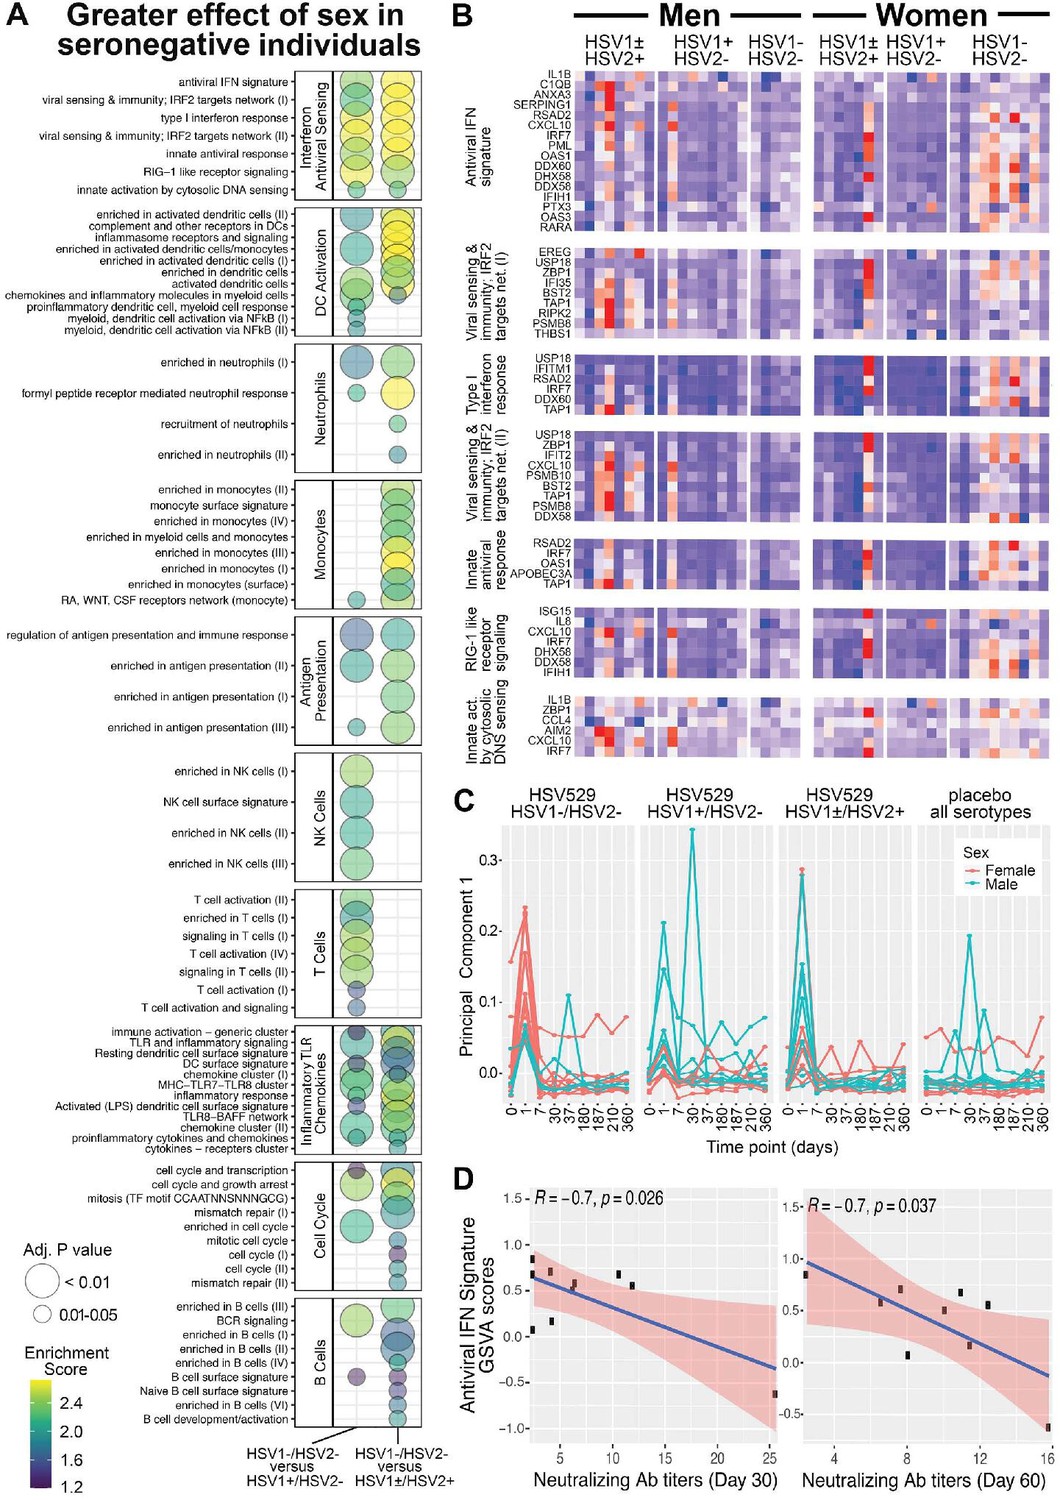
Gene expression responses to HSV529 that associate with sex differ significantly between subjects previously naive or exposed to herpes simplex virus (HSV), and the interferon (IFN) response associated with HSV naive women correlates inversely with HSV2 neutralizing antibody titers.
(A) Changes in expression of all genes between days 0 and 1 were compared between men and women separately for the three HSV serogroups of subjects based on prior exposure to HSV. For each gene those changes with sex were then used to compute a difference between the HSV naive group and either HSV exposed group (x-axis). These differences were used to rank genes for hypergeometric enrichment analysis of blood transcription modules (BTMs), and all pathways with significant positive enrichment in the HSV naive group are shown (FDR adjusted p < 0.05), with enrichment score and significance indicated by plotted color and size, respectively. (B) Comparison of sex differences between HSV naive and HSV1+/HSV2− subjects identified seven gene sets significantly enriched in the IFN antiviral sensing module. For these seven gene sets, responses of the 33 different leading-edge genes in rows, for all 45 vaccine recipients in columns are shown with the change in expression at day 1 compared to day 0 with z-scores normalized within each gene set, where red indicates above and blue indicates below mean values. (C) Principal component analysis was performed using expression of the 33 leading-edge genes from panel B, at all nine timepoints with RNA-seq data. The first principal component is plotted for all 60 subjects colored by sex and separated by HSV serostatus for vaccine recipients, or with all serogroups combined for placebo recipients. (D) For HSV naive women that were vaccinated, variation in day 1 IFN responses was quantified by gene set variation analysis (GSVA) of the antiviral IFN signature (y-axis), and correlated with HSV2 neutralizing antibody titers observed at day 30 or 60 (x-axis). Pearson coefficient and significance values are shown for the linear correlation in blue, with 95% confidence interval shaded red.
Figure 4—figure supplement 1
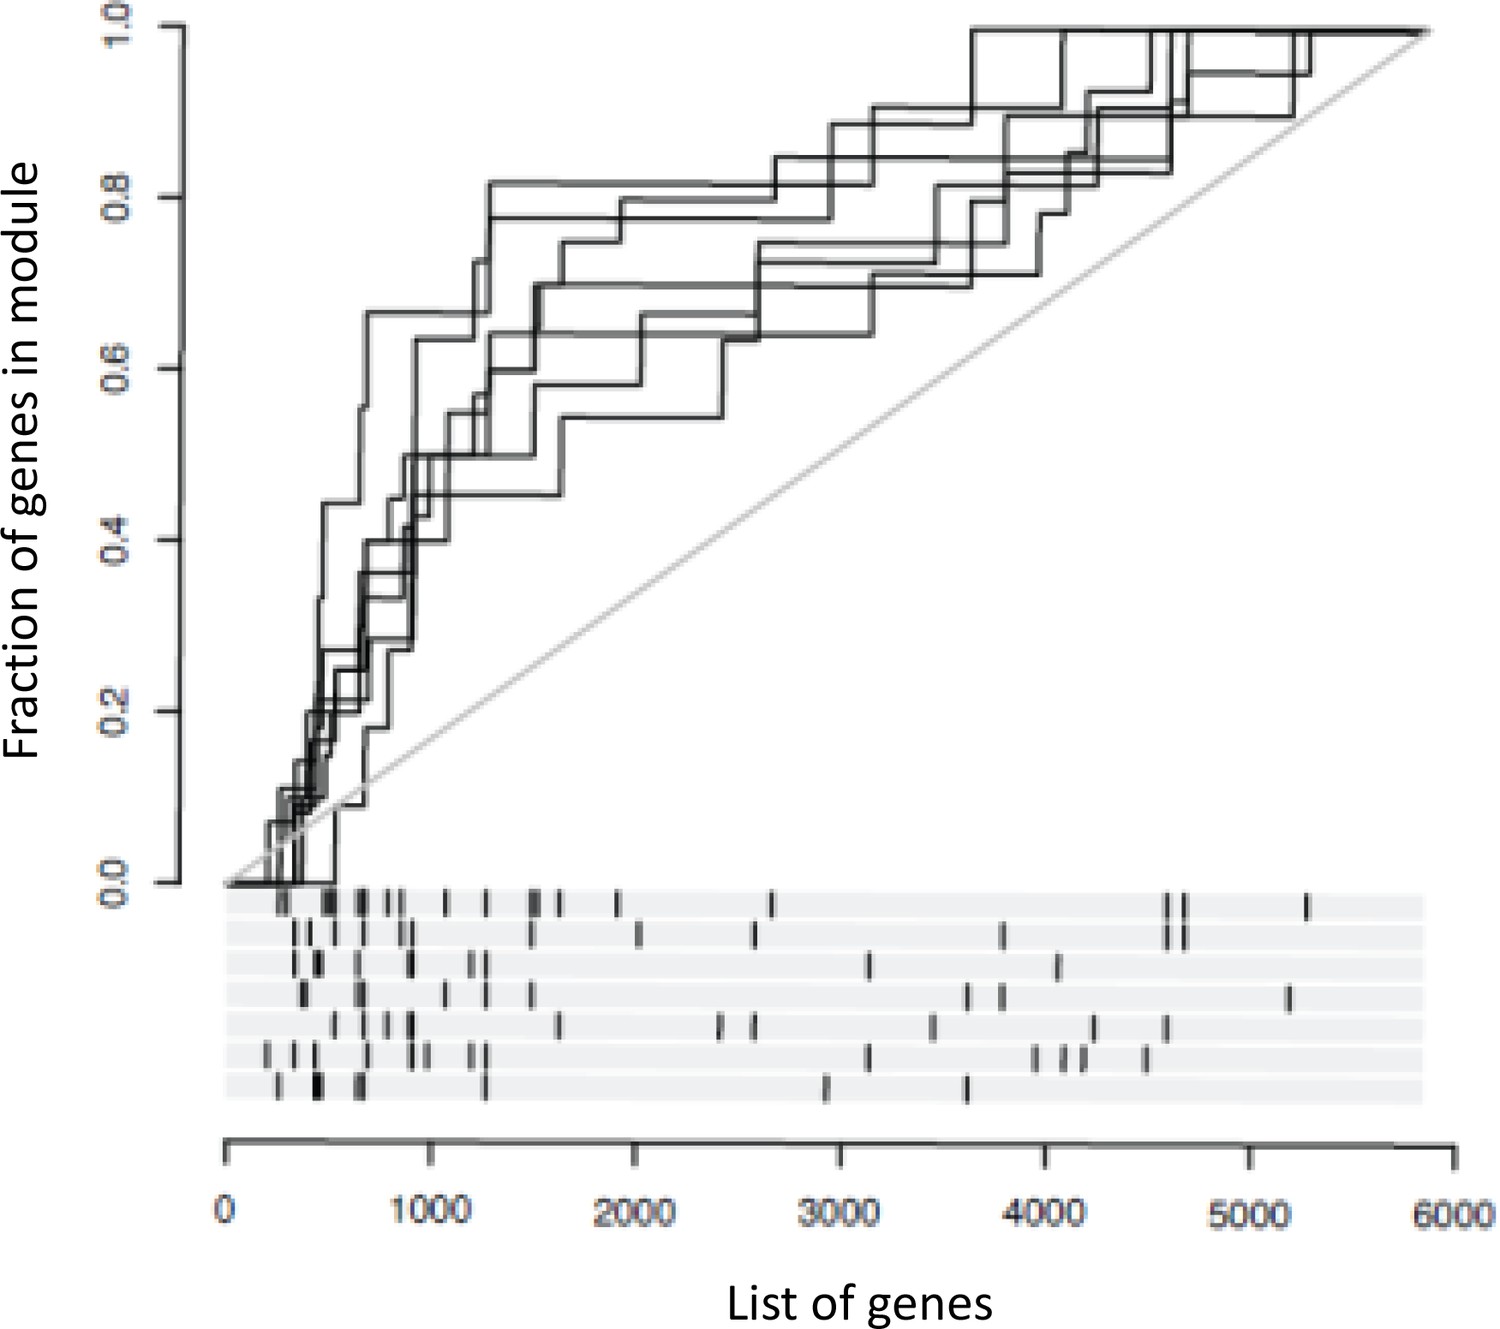
Enrichment of interferon (IFN) module gene sets in association with sex and prior exposure in day 1 transcriptional responses to HSV529.
Seven gene sets from the IFN and antiviral sensing module were enriched when comparing sex differences between herpes simplex virus (HSV) naive and HSV1+/HSV2− subjects in day 1 transcriptional responses (Figure 4A). For these enrichments, plots show the fraction of genes included from each set (y-axis) when all genes tested are ranked by decreasing difference between HSV naive compared to HSV1+/HSV2− subjects for greater expression in women compared to men (x-axis), with bars on the x-axis showing the distribution of members of these gene sets as black marks.
Figure 4—figure supplement 2
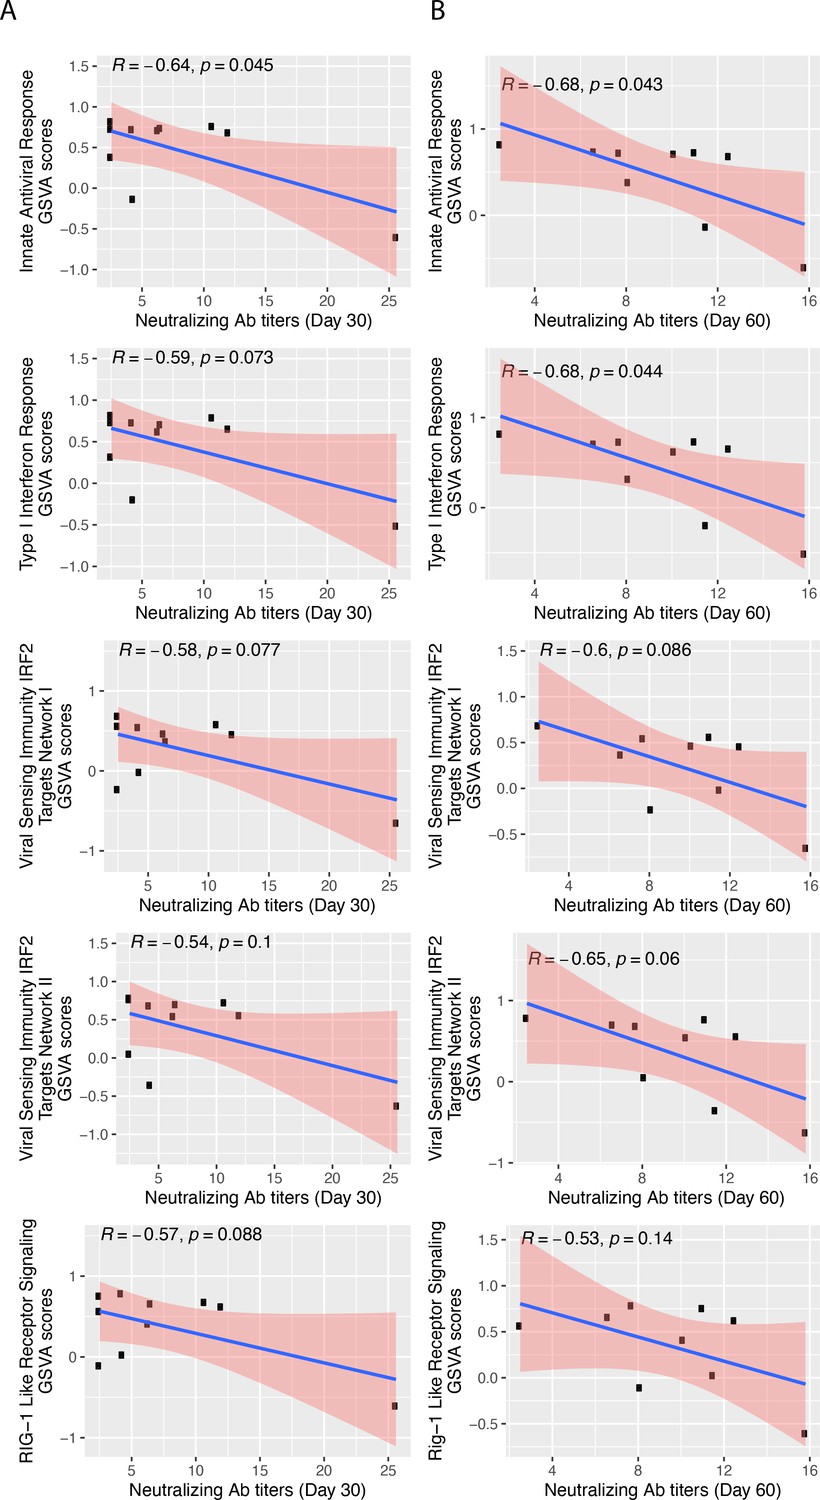
Multiple interferon (IFN)-related gene sets enriched in day 1 responses by herpes simplex virus (HSV) naive women correlate inversely with HSV2 neutralizing antibody titers.
Multiple gene sets from the IFN and antiviral sensing module were highly enriched when comparing sex differences between HSV naive and exposed subjects in day 1 transcriptional responses (Figure 4A). For the gene set with most significant enrichment, antiviral IFN signature, variation between individuals was analyzed for correlation with HSV2 neutralizing antibody titers observed for HSV naive women on day 30 (A) and day 60 (B). Here, the next five gene sets based on significance of enrichment in Figure 4A are also analyzed for correlation with HSV2 neutralizing antibody titers. Plots are as described for Figure 4D, and show Pearson coefficients ranging from −0.68 to −0.53, with significance values from p = 0.04 to p = 0.14.
Tables
Table 1
Twenty most significantly upregulated genes at day 1 for HSV529 recipients divided into three groups based on prior exposure to herpes simplex virus (HSV).
Changes in expression compared to day 0 were analyzed using Bioconductor package DESeq2, with log 2 fold changes reported and p values corrected for multiple comparisons. Genes marked in red are present in both HSV1+/HSV2− and HSV1±/HSV2+, but not HSV1−/HSV2− subjects.
| HSV1−/HSV2− | HSV1+/HSV2− | HSV1±/HSV2+ | ||||||
|---|---|---|---|---|---|---|---|---|
| Gene | Fold change | p adjusted | Gene | Fold change | p adjusted | Gene | Fold change | p adjusted |
| MX1 | 1.95 | 7.02 × 10⁻³¹ | GBP2 | 1.14 | 1.36 × 10⁻²⁰ | ANKRD22 | 5.44 | 4.37 × 10−44 |
| EIF2AK2 | 1.28 | 3.99 × 10⁻²⁸ | GBP1 | 2.06 | 2.60 × 10⁻¹⁹ | GBP5 | 1.94 | 6.39 × 10−41 |
| IFI44 | 2.01 | 3.99 × 10⁻²⁸ | PSTPIP2 | 0.98 | 4.27 × 10⁻¹⁸ | WARS | 2.19 | 2.03 × 10−40 |
| ISG15 | 2.10 | 3.99 × 10⁻²⁸ | ANKRD22 | 3.54 | 7.25 × 10⁻¹⁸ | ETV7 | 4.12 | 5.08 × 10−40 |
| IFI6 | 2.26 | 4.94 × 10⁻²⁸ | FCGR1B | 2.32 | 4.39 × 10⁻¹⁷ | GBP1 | 2.86 | 1.64 × 10−39 |
| HERC5 | 1.66 | 3.52 × 10⁻²⁷ | WARS | 1.44 | 9.49 × 10⁻¹⁷ | GBP4 | 1.86 | 1.93 × 10−38 |
| OAS3 | 1.95 | 3.52 × 10⁻²⁷ | GBP4 | 1.24 | 2.28 × 10⁻¹⁶ | IDO1 | 4.02 | 4.50 × 10−38 |
| CMPK2 | 2.12 | 5.75 × 10⁻²⁷ | LAP3 | 1.54 | 2.28 × 10⁻¹⁶ | CD274 | 1.72 | 2.16 × 10−37 |
| HERC6 | 1.02 | 5.75 × 10⁻²⁷ | GBP5 | 1.24 | 3.51 × 10⁻¹⁶ | LAP3 | 2.26 | 7.50 × 10−37 |
| IFI44L | 2.68 | 1.52 × 10⁻²⁶ | GBP1P1 | 3.09 | 5.37 × 10⁻¹⁶ | GBP2 | 1.46 | 1.71 × 10−36 |
| LAMP3 | 1.94 | 2.86 × 10⁻²⁶ | FCGR1A | 2.05 | 7.64 × 10⁻¹⁶ | GBP1P1 | 4.40 | 6.42 × 10⁻³⁴ |
| IFIT1 | 2.92 | 1.39 × 10⁻²⁵ | STAT1 | 1.37 | 1.27 × 10⁻¹⁵ | VAMP5 | 1.63 | 6.16 × 10⁻³³ |
| IFIT2 | 2.41 | 5.10 × 10⁻²⁵ | APOL4 | 3.12 | 2.45 × 10⁻¹⁵ | CXCL10 | 4.50 | 1.98 × 10⁻³² |
| SPATS2L | 1.32 | 6.94 × 10⁻²⁵ | PSME2 | 0.84 | 3.67 × 10⁻¹⁵ | FCGR1B | 3.10 | 1.98 × 10⁻³² |
| USP18 | 1.89 | 1.30 × 10⁻²⁴ | FCGR1C | 2.55 | 5.59 × 10⁻¹⁴ | SERPING1 | 3.79 | 2.05 × 10⁻³² |
| PARP12 | 0.72 | 1.86 × 10⁻²⁴ | IRF1 | 0.89 | 1.52 × 10⁻¹³ | PSME2 | 1.20 | 2.41 × 10⁻³² |
| RSAD2 | 2.29 | 1.86 × 10⁻²⁴ | APOL2 | 0.64 | 2.19 × 10⁻¹³ | BATF2 | 3.81 | 2.58 × 10⁻³² |
| TRIM22 | 0.78 | 2.45 × 10⁻²⁴ | PARP9 | 1.14 | 3.14 × 10⁻¹³ | IRF1 | 1.34 | 3.16 × 10⁻³² |
| HELZ2 | 1.16 | 2.23 × 10⁻²³ | APOL3 | 0.55 | 3.89 × 10⁻¹³ | APOL3 | 0.83 | 7.00 × 10⁻³² |
| MX2 | 1.25 | 5.10 × 10⁻²³ | SAMD4A | 1.24 | 3.89 × 10⁻¹³ | SAMD4A | 1.86 | 1.74 × 10⁻³¹ |
Additional files
-
Supplementary file 1
Flow cytometry markers and lists of significantly upregulated genes and changes in cell populations.
(A) Four parallel 10-color staining panels used for high parameter flow cytometry analysis. (B) Seventy subsets of PBMCs detected by high parameter flow cytometry analysis. (C) The 20 most significantly upregulated genes at day 1 compared to day 0 when analyzing all HSV529 recipients. Genes marked in red are IFN-stimulated genes, and those in blue are Fc receptors. (D) The 20 most significantly changing cell populations at day 1 compared to day 0 when analyzing all HSV529 recipients. Red indicates NK cells, blue indicates Th1 cells, green indicates cytolytic cells and yellow indicates plasmablasts. (E) Significantly changing cell populations in HSV529 recipients based on HSV serogroup, when analyzing differences from days 0 to 1. (F) Significantly changing cell populations in HSV529 recipients based on HSV serogroup, when analyzing differences from days 0 to 7.
- https://cdn.elifesciences.org/articles/80652/elife-80652-supp1-v1.xlsx
-
Transparent reporting form
- https://cdn.elifesciences.org/articles/80652/elife-80652-transrepform1-v1.pdf
Download links
A two-part list of links to download the article, or parts of the article, in various formats.
Downloads (link to download the article as PDF)
Open citations (links to open the citations from this article in various online reference manager services)
Cite this article (links to download the citations from this article in formats compatible with various reference manager tools)
Sex and prior exposure jointly shape innate immune responses to a live herpesvirus vaccine
eLife 12:e80652.
https://doi.org/10.7554/eLife.80652


